- Protocols

- Articles and Issues
- For Authors
- About
- Become a Reviewer

Workflow for High-throughput Screening of Enzyme Mutant Libraries Using Matrix-assisted Laser Desorption/Ionization Mass Spectrometry Analysis of Escherichia coli Colonies
Published: Vol 13, Iss 21, Nov 5, 2023 DOI: 10.21769/BioProtoc.4862 Views: 2550
Reviewed by: Neha NandwaniRama Reddy GoluguriAmit Kumar Dey
Original research article
The authors used this protocol in:

May 2023

Protocol Collections
Comprehensive collections of detailed, peer-reviewed protocols focusing on specific topics


Related protocols
Abstract
High-throughput molecular screening of microbial colonies and DNA libraries are critical procedures that enable applications such as directed evolution, functional genomics, microbial identification, and creation of engineered microbial strains to produce high-value molecules. A promising chemical screening approach is the measurement of products directly from microbial colonies via optically guided matrix-assisted laser desorption/ionization mass spectrometry (MALDI-MS). Measuring the compounds from microbial colonies bypasses liquid culture with a screen that takes approximately 5 s per sample. We describe a protocol combining a dedicated informatics pipeline and sample preparation method that can prepare up to 3,000 colonies in under 3 h. The screening protocol starts from colonies grown on Petri dishes and then transferred onto MALDI plates via imprinting. The target plate with the colonies is imaged by a flatbed scanner and the colonies are located via custom software. The target plate is coated with MALDI matrix, MALDI-MS analyzes the colony locations, and data analysis enables the determination of colonies with the desired biochemical properties. This workflow screens thousands of colonies per day without requiring additional automation. The wide chemical coverage and the high sensitivity of MALDI-MS enable diverse screening projects such as modifying enzymes and functional genomics surveys of gene activation/inhibition libraries.
Key features
• Mass spectrometry analyzes a range of compounds from E. coli colonies as a proxy for liquid culture testing enzyme mutant libraries.
• Colonies are transferred to a MALDI target plate by a simple imprinting method.
• The screen compares the ratio among several products or searches for the qualitative presence of specific compounds.
• The protocol requires a MALDI mass spectrometer.
Graphical overview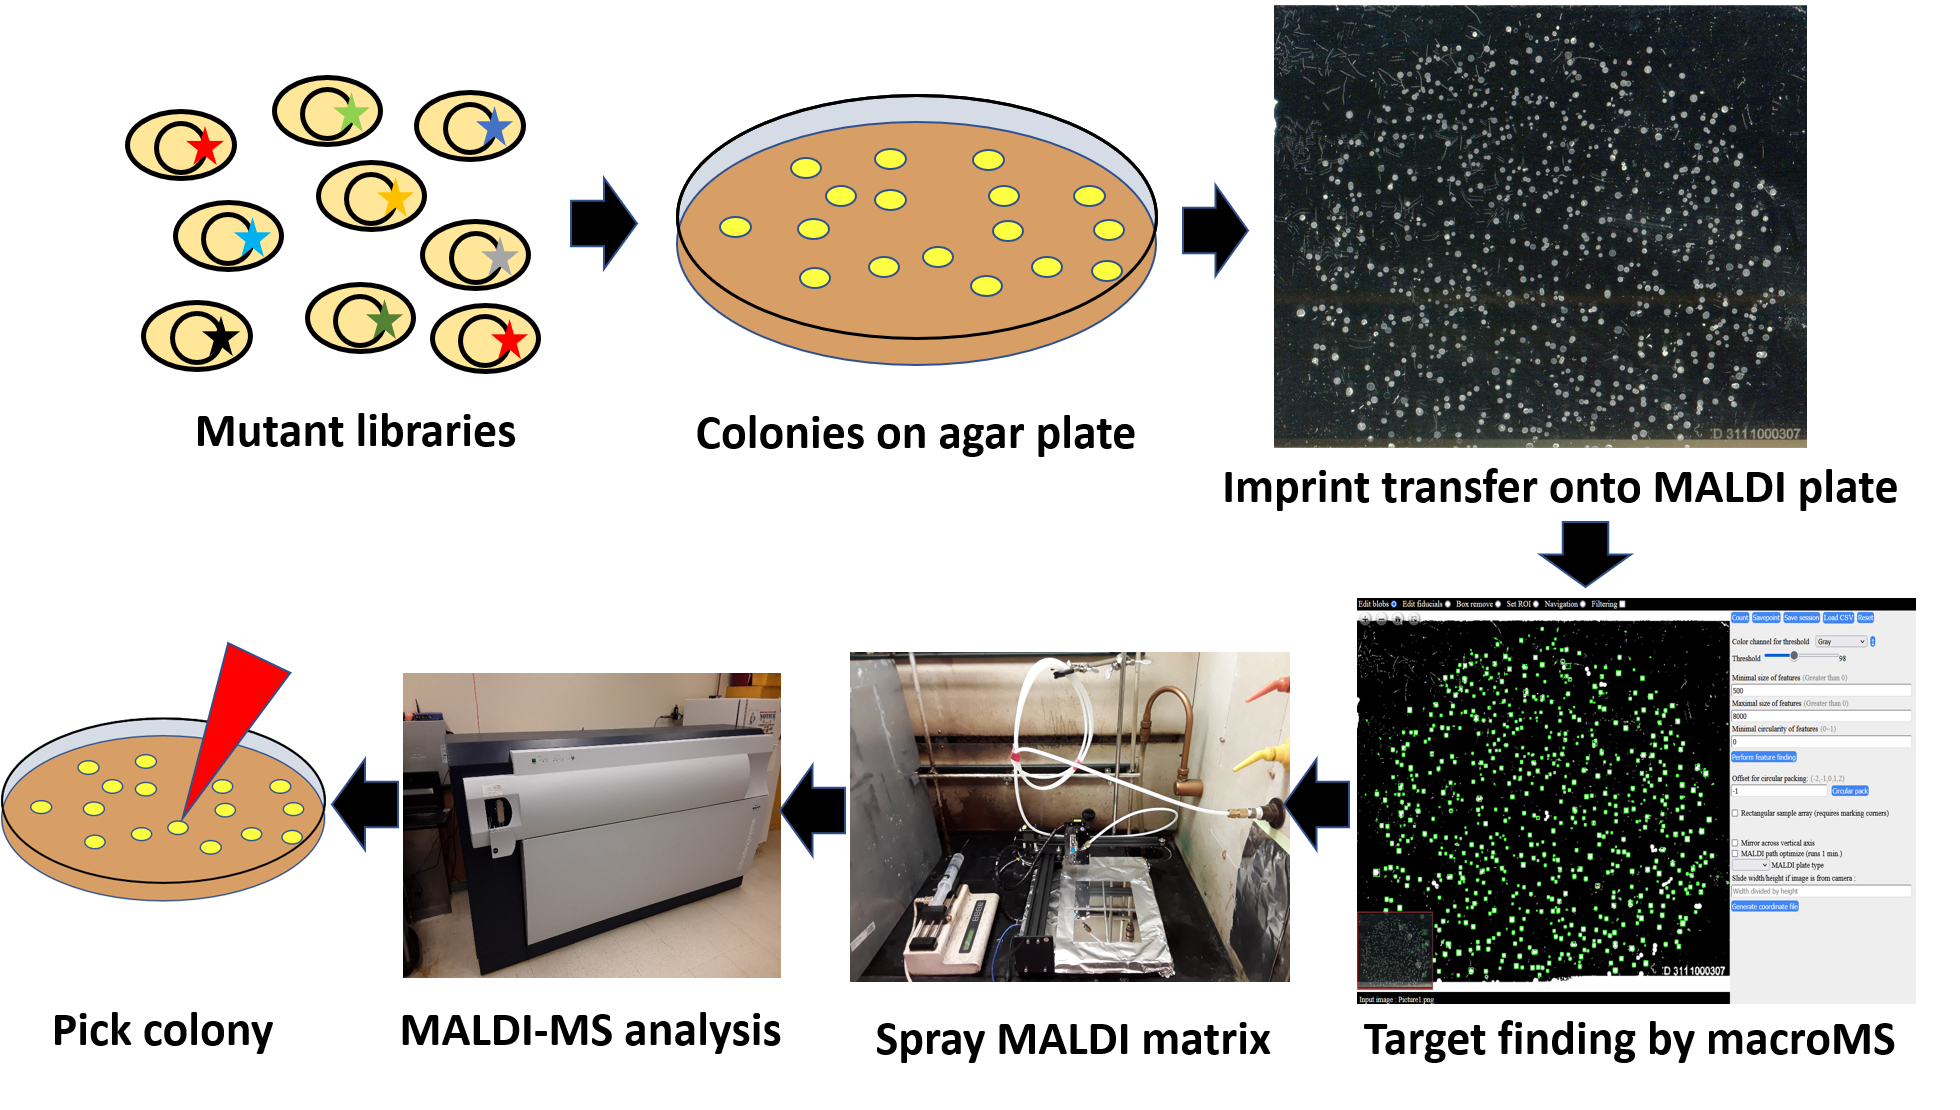
Overview of the MALDI-MS analysis of microbial colonies for screening mutant libraries. Microbial cells containing a mutant library for enzymes/metabolic pathways are first grown in agar. The colonies are then imprinted onto a MALDI target plate using a filter paper intermediate. An optical image of the MALDI target plate is analyzed by custom software to find the locations of individual colonies and direct subsequent MALDI-MS analyses to the selected colonies. After applying MALDI matrix onto the target plate, MALDI-MS analysis of the colonies is performed. Colonies showing the desired product profiles are found by data analysis via the software, and the colonies are picked for downstream analysis.
Background
Directed evolution is an iterative process of mutagenesis and phenotype screening to achieve incremental improvements towards desired characteristics (Arnold, 2018). The method is used widely for creating efficient biocatalysts producing drugs, fuels, food, and industrial products (Turner, 2009; Dietrich et al., 2010; Wang et al., 2021). Lack of high-throughput methods for phenotype screening can be a bottleneck for directed evolution (Zeymer and Hilvert, 2018). Chromogenic conversion, pH change, and fluorescence readings can be used for phenotype screening; however, they are often indirect measurements of the desired phenotype (Körfer et al., 2018; Alfaro-Chávez et al., 2019; Minges et al., 2020). A promising approach is mass spectrometry (MS), which provides label-free measurement of a wide variety of analytes. Acoustic ejection mass spectrometry is the state-of-the-art high-throughput screening technology that applies an acoustic pulse to transfer liquid samples to an MS device, achieving a subsecond analytical cycle (Liu et al., 2020; Zhang et al., 2021). However, it requires extensive automation systems for sample creation such as biochemical reactions, cell culture, liquid transfer, and storage (Simon et al., 2021). Such robotic systems are not commonly available to many labs. Alternatively, matrix-assisted laser desorption/ionization MS (MALDI-MS) is a widely available MS system that boasts high throughput, relatively simple sample preparation, high salt tolerance, and wide chemical coverage (Fournier et al., 2008; Grove et al., 2011; Singhal et al., 2015). Previously, the optically guided MALDI-MS method was applied to perform high-throughput screening of microbial colonies for engineering multistep enzyme reactions (Si et al., 2017). In this workflow, hundreds of agar colonies are transferred to a MALDI plate by imprinting, and MALDI-MS of the scattered colonies is performed using the coordinates reported by microMS image analysis software. This work successfully enables individual colonies to serve as individual reaction vessels for phenotyping, which is a promising alternative to the complex automation system needed for performing and processing large numbers of liquid cultures. For routine analysis of a larger number of microbial colonies, the current protocol simplifies steps for imaging, instrument setup, software operation, and downstream data analysis.
The simplification of the workflow is enabled by macroMS, a newly created software package that is freely available. The macroMS is the adaptation of a single-cell microMS package and it was created for high-throughput screening of macroscopic samples larger than 200 μm (Comi et al., 2017; Choe et al., 2021). The macroMS package enables rapid imaging by flatbed scanner and camera, user-friendly tools for image analysis and optical correction, simple MS instrument training, and data analysis/visualization for isolating colonies of interest. Based on macroMS, this protocol describes a simplified end-to-end colony screening workflow by MALDI-MS, including growing and preparing colonies for the MALDI-MS screen, using the macroMS software to set up and perform MALDI-MS analysis, performing data analysis, and picking colonies of interest. This workflow can be used to efficiently screen mutant libraries for modifying a wide variety of enzymes or metabolic pathways that form compounds on colonies that are detectable by MALDI-MS. While the workflow has been developed using the Bruker ultraflextreme mass spectrometer, it can be adapted to other instruments, although this would require adapting several of the software and instrument operation steps. The limitations of the workflow are: 1) it works with nonvolatile compounds that do not evaporate in the vacuum environment of MALDI-MS, 2) it is a semiquantitative MALDI-MS screen that uses the ratio between observed MALDI-MS peaks, and 3) the macroMS data analysis tool limits the width of the mass range of the mass spectrum to be under m/z 1,000.
As the equipment to spray matrix onto the slides is not commonly available in many laboratories, the end of the protocol includes the construction of a spraying device for applying MALDI matrix onto four extra-large MALDI target plates (i.e., 105 mm × 75 mm). MALDI matrix application is a commonly performed step for MALDI imaging, where airbrush, sublimation chamber, and commercial automatic sprayer systems have been used to coat samples with the compounds (Hankin et al., 2007; Ye et al., 2013; Andersen et al., 2020). However, few devices have the capacity for processing wide target plates holding the large number of colonies needed for high-throughput screening. Also, while MALDI-MS has become commonly available in universities and industrial settings, facilities often lack the capability and experience with MALDI imaging and therefore do not have devices for MALDI matrix coating. If other alternatives are available, they can be used; otherwise, the system described here provides the capability to simultaneously prepare four large MALDI plates as needed for high-throughput screens and reducing variability.
The workflow was successfully used to screen mutant libraries for an acyl-ACP thioesterase and an acyl-ACP desaturase. Acyl-ACP thioesterase cleaves the thioester bond in acyl-ACPs in the type II fatty acid synthesis pathway, deciding the chain length of the resulting free fatty acids. Acyl-ACP thioesterase from the California bay laurel (UcFatB2) expressed in E. coli produces dodecanoic acid as a primary product and tetradecanoic acid as a secondary product. The workflow compared the ratio between dodecanoic acid and tetradecanoic acid measured from colonies that express UcFatB2 random mutant library and found variants that have higher ratio for dodecanoic acid (Jindra et al., 2023). Acyl-ACP desaturase removes two hydrogens from a single bond between two carbons (C — C) resulting in double bond (C = C) in fatty acyl-ACP, deciding the location of the double bond in unsaturated fatty acid. Acyl-ACP desaturase from the Black-eyed Susan vine (TaDes) expressed in E. coli produces C16:1 Δ6 as a primary product and C16:1 Δ8 acid as a secondary product. By combining with a simple ozone treatment step, the workflow compared the ratio between the ozonolysis products of C16:1 Δ6 and C16:1 Δ8 measured from colonies that express TaDes random mutant library. The screen found variants that produce C16:1 Δ8 as a primary product (Choe et al., 2023). The protocol covers the workflow demonstrated using the thioesterase screen.
Materials and reagents
Prespotted AnchorChip adapter (Bruker Daltonics, catalog number: 221598), four custom built 1.2 mm × 105 mm × 75 mm target plates, and copper conducting tape (3M, catalog number: 05012A-AB) (Note 1)
MTP target frame (Bruker Daltonics, catalog number: 8074115) and MTP 384 target plate polished steel (Bruker Daltonics, catalog number: 8280781)
Vacuum desiccator (SP Bel-Art, catalog number: F42020-0000)
5′ of 1/2″ tubing (McMaster-Carr, catalog number: 5648K33)
N-Phenyl-2-naphthylamine (PNA) (Sigma-Aldrich, catalog number: 178055)
7.25″ × 5″ × 1.875″ HDX hydrophilic sponge (QEP, catalog number: 70005-24)
6″ × 6″ × 3/8″ metal plate (McMaster-Carr, catalog number: 8983K212)
6″ × 6″ × 0.12″ metal plate (McMaster-Carr, catalog number: 8983K118)
A4 papers
Standard lab tape
Lighter
Push pins
Duct tape
Sharpie pen
Power strip
Isopropyl alcohol
Methanol
Glycerol
Delicate task wipes (Kimberly-Clark Professional, catalog number: 34155)
10% bleach
150 mm × 15 mm bacteriological Petri dish (Corning, catalog number: 351058)
Syringe filter, 0.2 μm Nylon (Thermo Scientific, catalog number: 726-2520)
90 mm filter unit, 500 mL (Thermo Scientific, catalog number: 569-0020)
Sterile 10 mL syringe, single use (BD, catalog number: 302995)
Sterile 1.5, 15, and 50 mL tubes and corresponding tube racks
Sterile 2, 20, and 1,000 μL pipette tips and corresponding adjustable volume pipettes
Sterile 5 and 50 mL serological pipettes and a pipetaid
Carbenicillin (Gold Biotechnology, catalog number: C-103-5)
Autoclaved 90 mm membrane filter, 0.22 μm (Millipore, catalog number: GVWP09050)
14 mL cell culture tubes (Greiner Bio-One, catalog number: 187262)
Sterile 250 and 1,000 mL autoclavable flasks (Pyrex, catalog number: 4980)
L-shaped cell spreader (VWR, catalog number: 76207-748)
Inoculating turntable
Ice bucket
4″ × 125′ Parafilm-M film (Bemis Company Inc, catalog number: PM996)
Gallon storage double zip bags, 26.8 cm × 27.3 cm (Walmart)
Plastic box for transporting MALDI target adapter
Aluminum foil
Tweezer
Spectrophotometer cuvette
10 nm gold colloid solution (BBI Solutions, catalog number: EM.GC10/4)
LB powder (Fisher Scientific, catalog number: BP9722-2)
Agar (BD, catalog number: 214030)
Isopropyl β-D-1-thiogalactopyranoside (IPTG) (Sigma-Aldrich, catalog number: IPTG-RO)
Glucose (Fisher Scientific, catalog number: D1610)
Autoclave tapes
Clock
Paper towel
Miniprep kit (QIAGEN, catalog number: 27104)
Chemical waste bottle
Cuffed sleeve lab coat
Disposable laboratory exam gloves
Biohazard trash can
Electrocompetent cells (i.e., RL08ara strain)
Mutant library plasmid (i.e., pTrc99a-*BTE)
Wild-type control plasmid (i.e., pTrc99a-WT BTE)
Acetonitrile (Thermo Fisher Scientific, catalog number: 51101) (Note 2)
Acetone (Fisher Scientific, catalog number: A929-1)
LB agar plates (see Recipes) (Note 3)
Liquid LB media (see Recipes)
PNA solution (per 20 mL) (see Recipes) (Note 2)
(Optional) materials for building MALDI matrix spray station
CNC machine (Huizhou Bachin Electronic Technology, catalog number: T-A4)
Windows PC compatible with the CNC machine
Chemical safety hood with working ports for nitrogen, air, vacuum, and electricity. The plastic barbed connector for the nitrogen port must be detachable by unscrewing, exposing the female opening for the pipe
Syringe pump (KDS Scientific, catalog number: KDS-100-CE)
Lab stand with a clamp
Two adjustable wrenches
Caliper
25′ of 1/4″ nylon tubing (McMaster-Carr, catalog number: 5548K75)
Two 50 mL syringes with Luer tapering (BD, catalog number: 309653)
1/4″ × 1/16″ stainless steel reducing union (Swagelok, catalog number: SS-400-6-1)
1/16″ OD × .020″ ID stainless steel tubing, 5 cm (IDEX, catalog number: U-101)
1/16″ OD × .030″ ID stainless steel tubing, 5 cm (IDEX, catalog number: U-115)
1/16″ Union Tee (Swagelok, catalog number: SS-100-3)
Two 1/16″ OD × .0155″ ID × 1.6″ NanoTightTM tube sleeves (IDEX, catalog number: F-242)
350 μm OD × 250 μm ID fused silica capillary (Polymicro, catalog number: 1068150026)
10-32 female-to-female Luer adapter (IDEX, catalog number: P-659)
1/16″ OD one-piece finger-tight fitting, 10-32 coned (IDEX, catalog number: F-120Y)
Gorilla glue (The Gorilla Glue Company)
(Optional) HTS MALDI adapter 1.0 mm (Bruker Daltonics, catalog number: 1847571)
(Optional) HTS MALDI plates (Bruker Daltonics, catalog number: 1833280)
(Optional) MTP target frame (Bruker Daltonics, catalog number: 8074115)
(Optional) MTP 384 target plate polished steel (Bruker Daltonics, catalog number: 8280781)
(Optional) 1/4″ tube OD × 3/8″ ID-18 NPTF male connector (Parker, catalog number: 68C-4-6)
(Optional) 1 mL glass syringe (Hamilton, catalog number: Gastight #1001)
Recipes
LB agar plates
Make 500 mL of 2× concentrated LB media (20 g of LB powder per 500 mL media).
Perform filter sterilization of the solution.
Add 250 mL of deionized water into a 1 L flask.
Add 7.5 g of agar into the flask.
Autoclave the flask for 20 min at 15 psi and 121 .
Immediately after completing the autoclave sterilization, transfer the flask to a biosafety hood.
Add 250 mL of the 2× LB media at room temperature into the flask, while swirling the flask.
Add carbenicillin (100 µg/mL), IPTG (0.1 mM), and glucose (1% w/v).
Thoroughly mix the media by swirling the flask.
Pour 40 mL of the media into each 150 mm Petri dish.
Leave the dishes completely open and dry for 30 min in the biosafety hood.
Put the dishes into plastic bags and store at 4 °C. During storage, the dishes should face upside down.
Liquid LB media (500 mL)
After dissolving 10 g of LB powder into deionized water (500 mL), perform filter sterilization of the solution using the vacuum filter unit.
PNA solution (per 20 mL)
Reagent Quantity PNA 100 mg Acetonitrile (Note 2) 20 mL
Equipment
PC with internet connectivity and Firefox or Chrome web browser
Flatbed scanner (EPSON, catalog number: Perfection V300 Photo)
Biosafety hood
Chemical safety hood
-20 °C freezer
-70 °C freezer
4 °C refrigerator
Autoclave
Cell culture incubator (Fisher Scientific, catalog number: 1600D)
Electroporator (Bio-Rad, catalog number: Gene Pulser Xcell)
Refrigerated centrifuge (Eppendorf, catalog number: 5810 R)
UV-Vis spectrophotometer (Thermo Scientific, catalog number: Genesys 10S)
Cell culture shaker (New Brunswick, catalog number: I 24) with clamps for 250 mL flasks
MALDI-ToF-MS (Bruker Daltonics, catalog number: ultrafleXtreme)
Ultrasonic bath sonicator (Cole Parmer, catalog number: 8891R)
Solid insert tray for sonicator bath (Branson, catalog number: 100410174)
Milli-Q water supply (ELGA LabWater, catalog number: PURELAB flex)
Ice supply
Electronic scale (Mettler Toledo, catalog number: PB4002-S)
(Optional) Acrylic nitrogen purge cabinets with nitrogen flow (Cleatech, catalog number: 1500-1-A)
(Optional) IR Thermometer (FLUKE, catalog number: 62MAX+) (Note 4)
Software
flexControl 3.4 (Build 135.12, Compass for flexSeries 1.4, Bruker Daltonics)
Bachin Draw (Huizhou Bachin Electronic Technology, http://www.bachinmaker.com)
Inkscape 1.0 (Inkscape, https://inkscape.org)
macroMS (Lab software, https://macroms.scs.illinois.edu/)
flexAnalysis 3 (Bruker Daltonics)
Control software for scanner
Procedure
Sample preparation (Note 3)
Colony culture
Transform electrocompetent cells with > 50 ng of plasmid mutant library (Note 5).
Resuspend the bacterial cells using 1 mL of LB media and transfer the cells into a cell culture tube holding 2 mL of LB. Grow the cells within a shaking incubator for 1 h at 37 °C.
Add antibiotics to the 3 mL of LB solution (100 μg/mL carbenicillin) and grow overnight at 37 °C in a shaker incubator.
Prepare four microcentrifuge tubes holding 990 μL of LB and perform three 100-fold dilutions of the overnight culture by serially transferring 10 μL of sample to the next tube three times. Mix the tubes thoroughly in each dilution step. For the fourth tube, transfer 10 μL from the second tube (10,000-fold diluted) resulting in two tubes having 1,000,000-fold diluted samples.
Using an inoculating turntable and a spreader stick, spread 500 μL of the diluted culture solution onto a prewarmed 150 mm plate in the biosafety hood. The liquid should be spread over an area like the 90 mm filter paper.
Immediately after, use the tip top of the shorter leg of the L-spreader stick to uniformly spread the liquid layer while slowly rolling the turntable. Do not spread until the liquid becomes dry.
Dry the liquid layer in the hood. Seed three more plates in the same manner.
Seal the plates with parafilm-M (Note 6).
Label the sample name at the top corner of the bottom dish, including the plate number. The up-down orientation of the label decides the sample orientation throughout the sample preparation workflow (Figure 1).
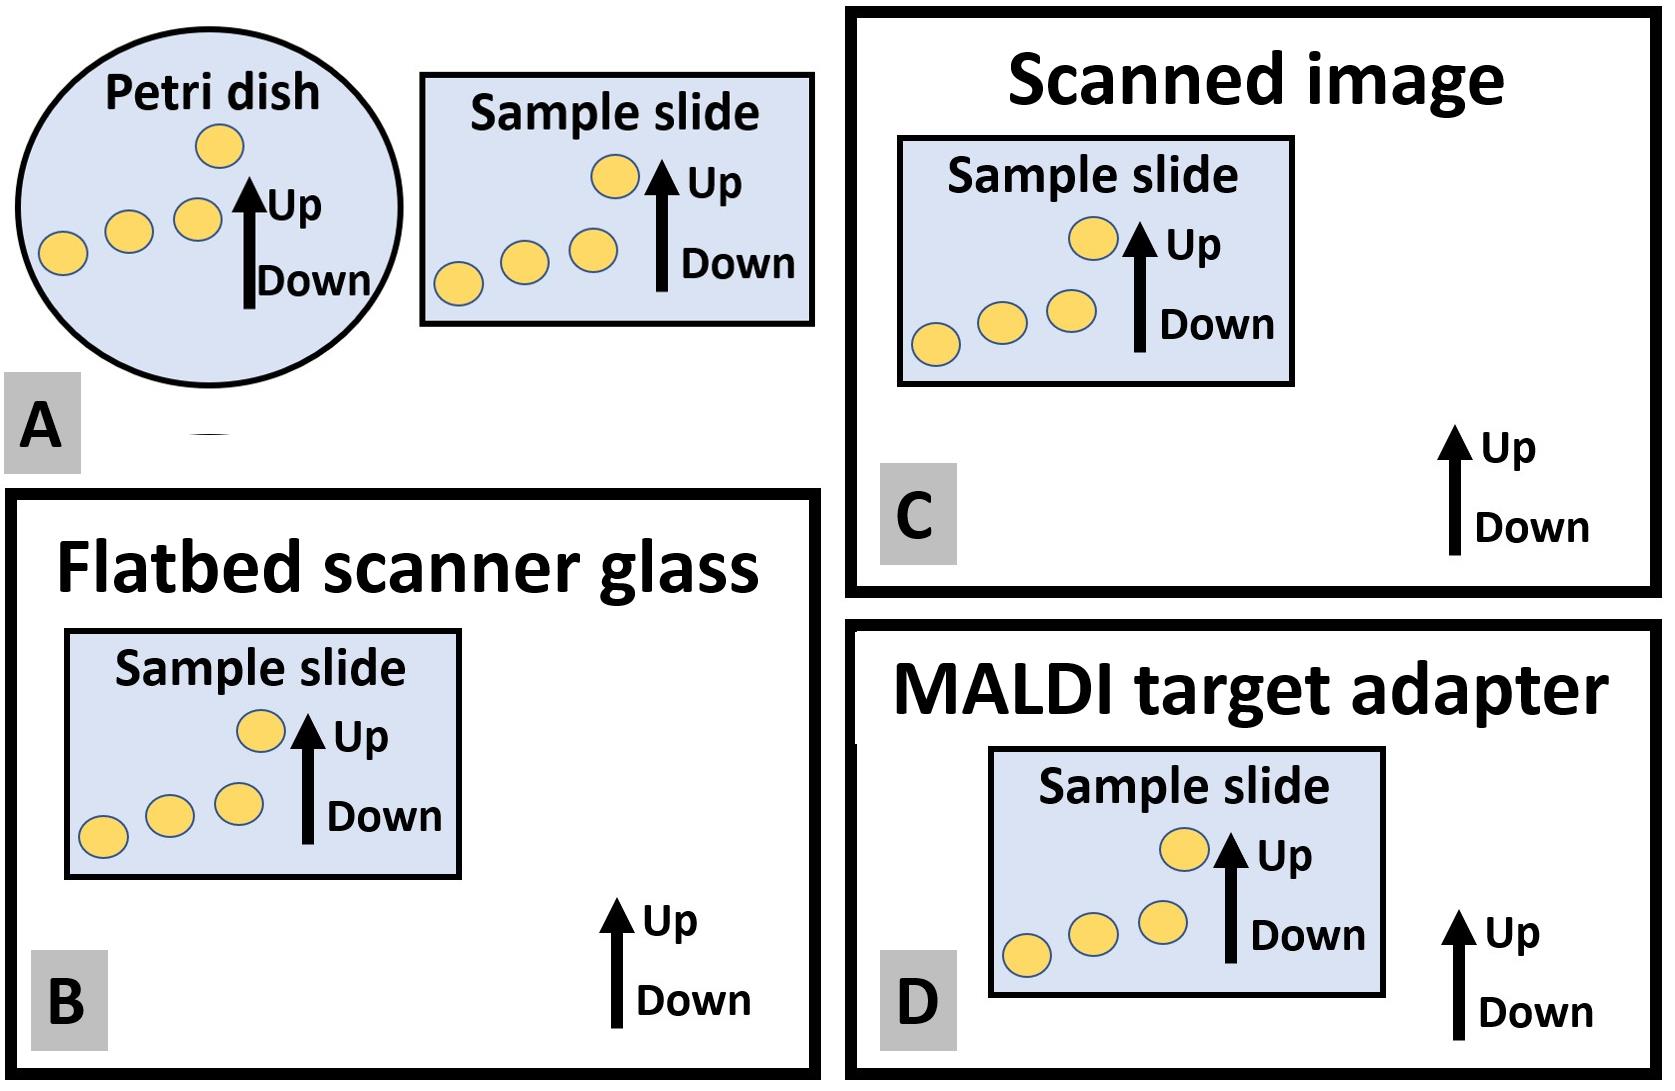
Figure 1. Maintaining a constant up-down orientation of the sample slide throughout the sample preparation workflow. Up-down orientation of the target plate should be equal to the up-down orientation of (A) Petri dish when transferring colonies, (B) flatbed scanner glass when imaging, (C) the image of the target plate, and (D) MALDI target adapter when mounting the target plate.Incubate the Petri dishes in the cell culture incubator without water bath. Do not stack the plates in the incubator and set the plates facing upside down.
In ~12–18 h, collect the plates when the colonies are ~1–2 mm.
Imprinting colonies
Immediately after the completion of the cell culture step, seal the plates by an additional layer of parafilm and put the plates into a sealed plastic bag. To prevent drying of the colonies, all subsequent steps until the imprinting step should be completed in 2 h.
Attach two layers of tape on the left and right edge of the MALDI target plate, while avoiding covering the fiducial marks at the corner edges. This step, step B1b, and step D6z are not necessary if the HTS MALDI plates are used. Write the sample name on the tape.
Label the sample name on the backside of the MALDI target plate and on the tape at the frontside. The up-down orientation of the labels should be used for preventing placing the slide upside down in the scanner and on the MALDI target adapter (Figure 1).
Get an equal number of A4 papers as the Petri dishes and tightly fold individual papers into half.
Using your hand, remove particulate matter on the frontside of the protective steel plate (0.012″ thickness) and on the backside of the MALDI target plate.
Set the MALDI target on the protective steel plate, with the mirror polished side facing up. Check the rotational orientation of the labeling letters of the target plate (Figure 1).
Place the Petri dish next to the MALDI target, with the colonies facing up (Figure 2). Orient the Petri dish so that the labels are placed on top. The subsequent steps until the end of step A2m should be completed rapidly to minimize drying of colonies.
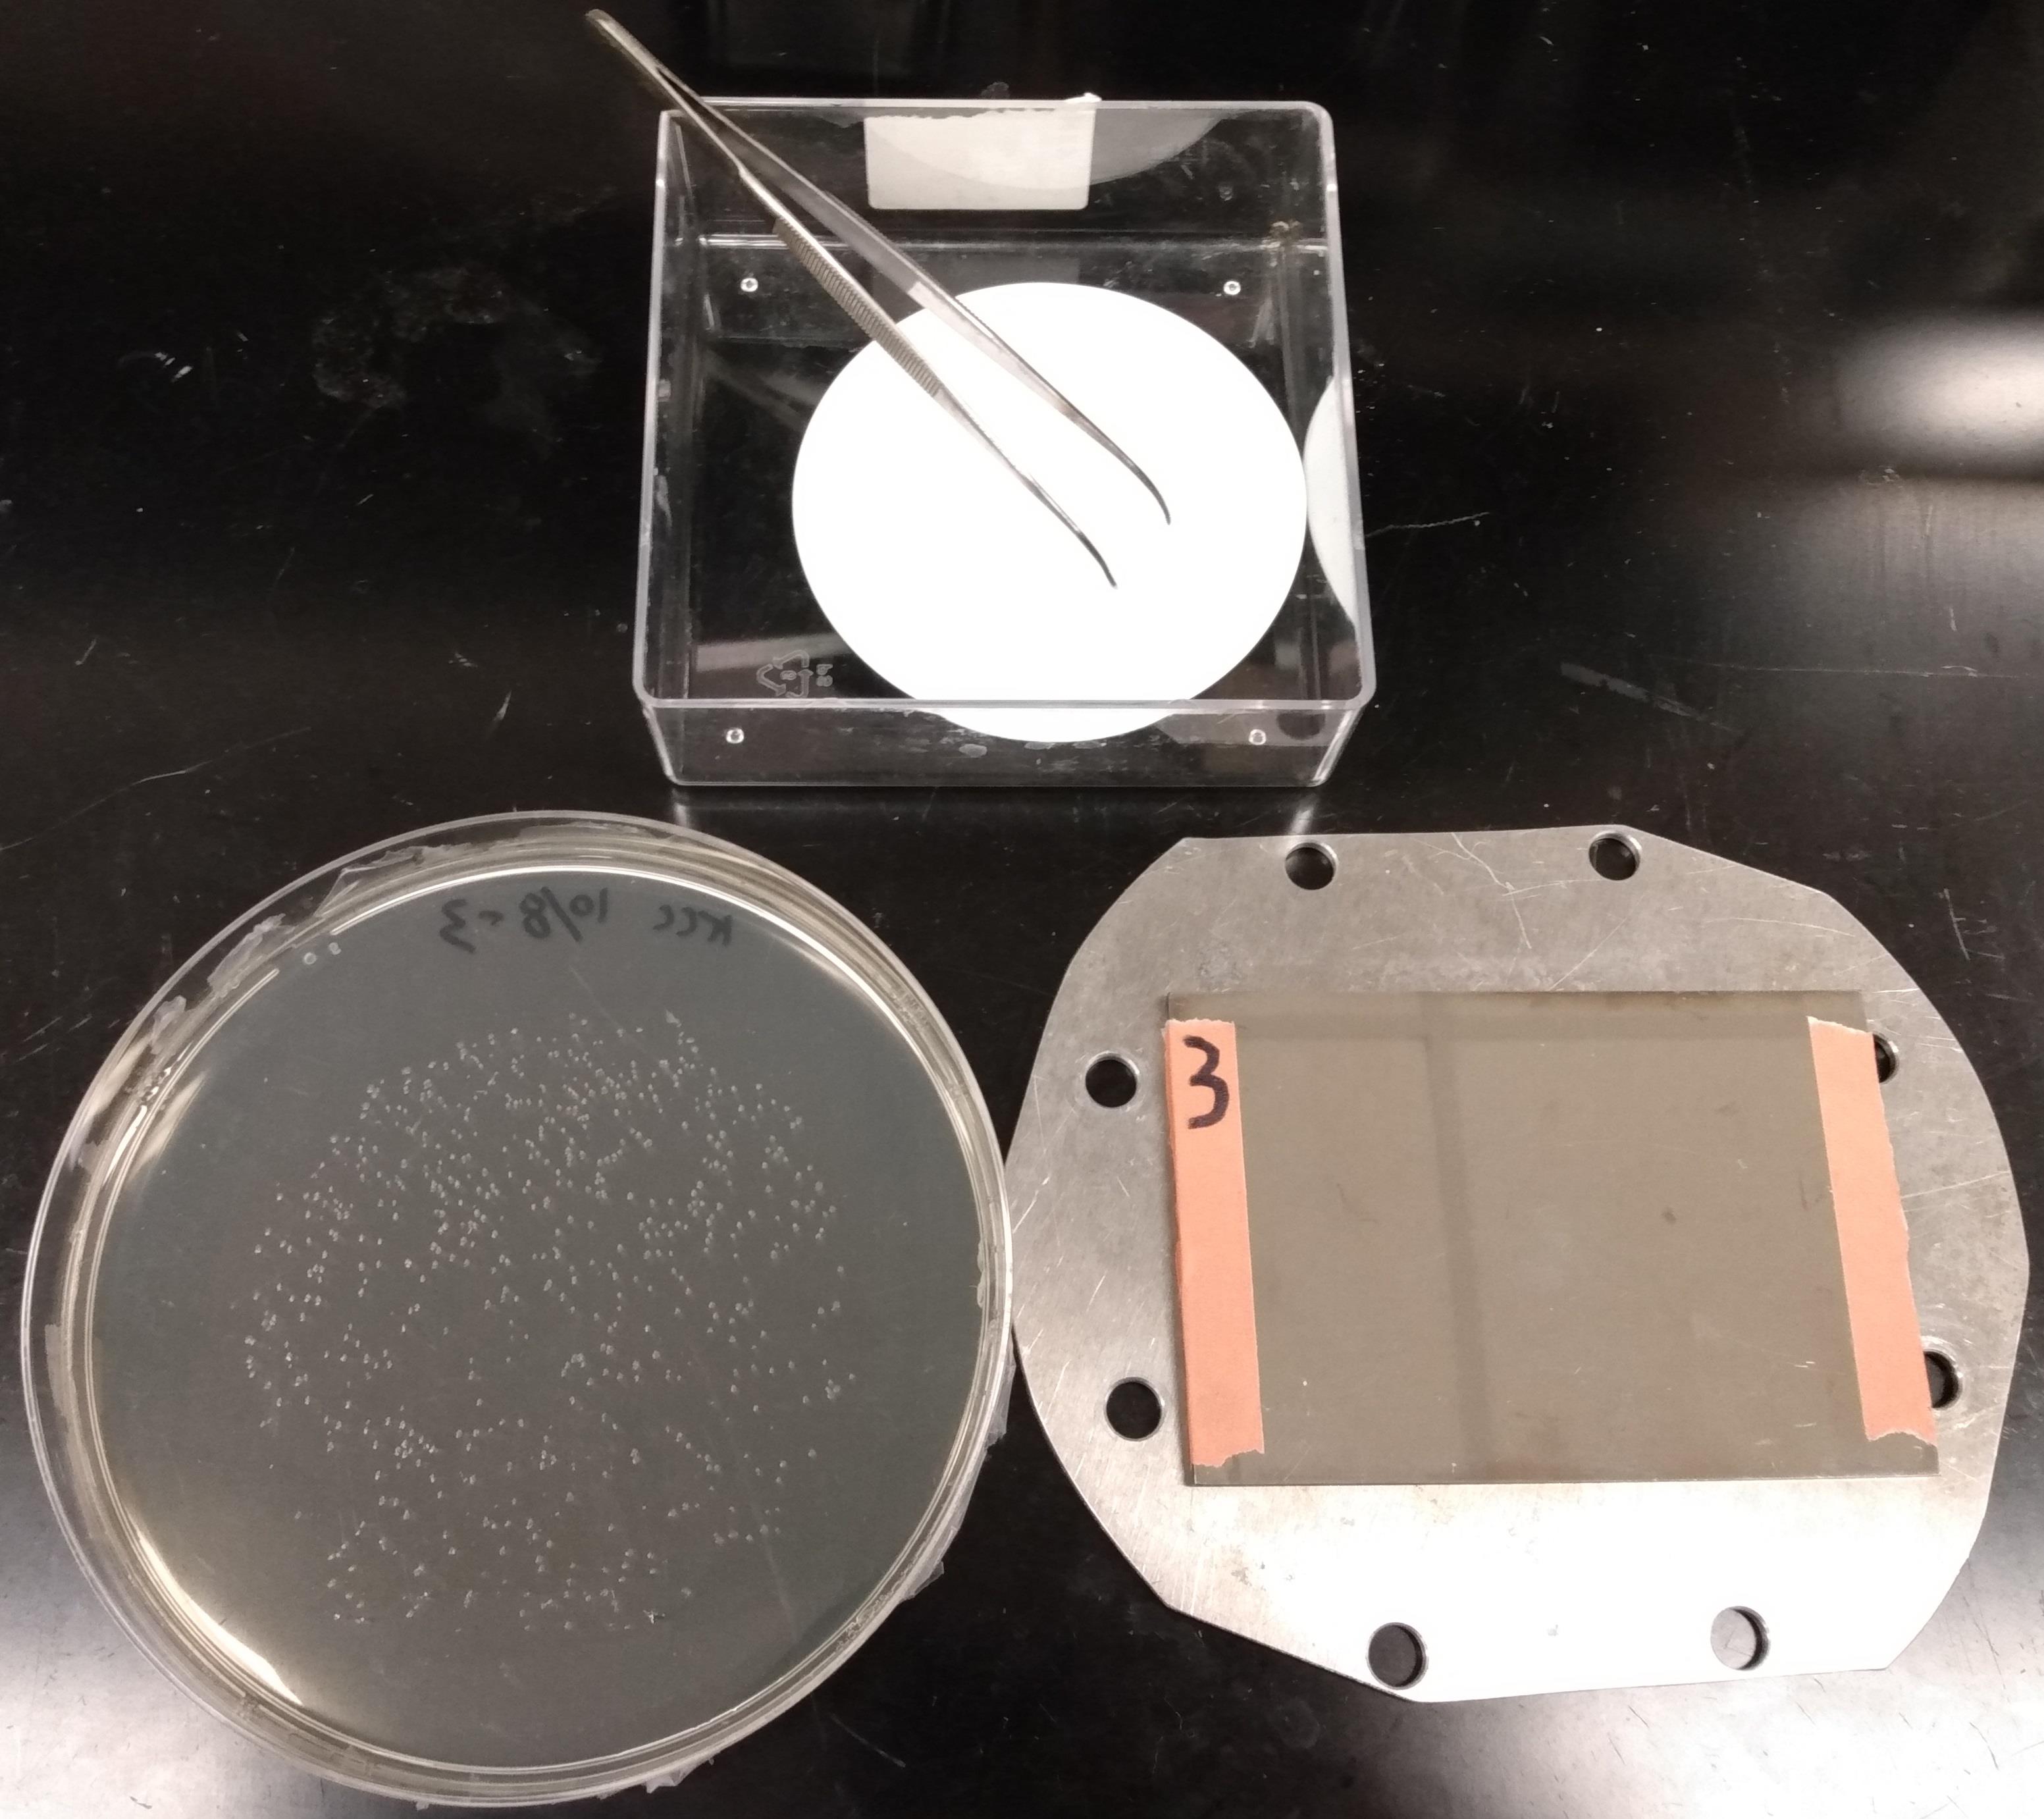
Figure 2. Setup for colony transfer. The Petri dish with colonies (left) and the MALDI plate sitting on the protective steel plate (right). The filter paper for colony transfer (top) is placed next to the plate.Open the cover of the Petri dish.
Immediately set the sterile filter paper onto the colonies and close the cover of the Petri dish. Wait at least 30 s for the complete attachment of the colonies onto the paper.
Using a tweezer, grab the bottom side of the filter paper and gently pull off the filter paper from the agar plate at roughly 10 cm/s speed while avoiding lateral movement of the filter paper on the agar surface. Immediately lay the top, middle, and then the bottom side of the filter paper onto the MALDI target, having the colonies directly touch the target plate. It is important not to change the rotational orientation of the filter paper, meaning the tweezer should still be grabbing the bottom side of the filter paper when the filter paper is placed onto the MALDI target.
Quickly move the steel protector (with the MALDI target plate and the filter paper) onto the bottom surface of the floor.
Quickly set an unused folded A4 paper onto the filter paper, set the sponge on top of the paper, and set the 3/8″ thick steel plate on top of the sponge (Figure 3). Avoid lateral movement of the filter paper while placing the paper, the sponge, and the plate. The center of these items should be roughly aligned as they are placed.
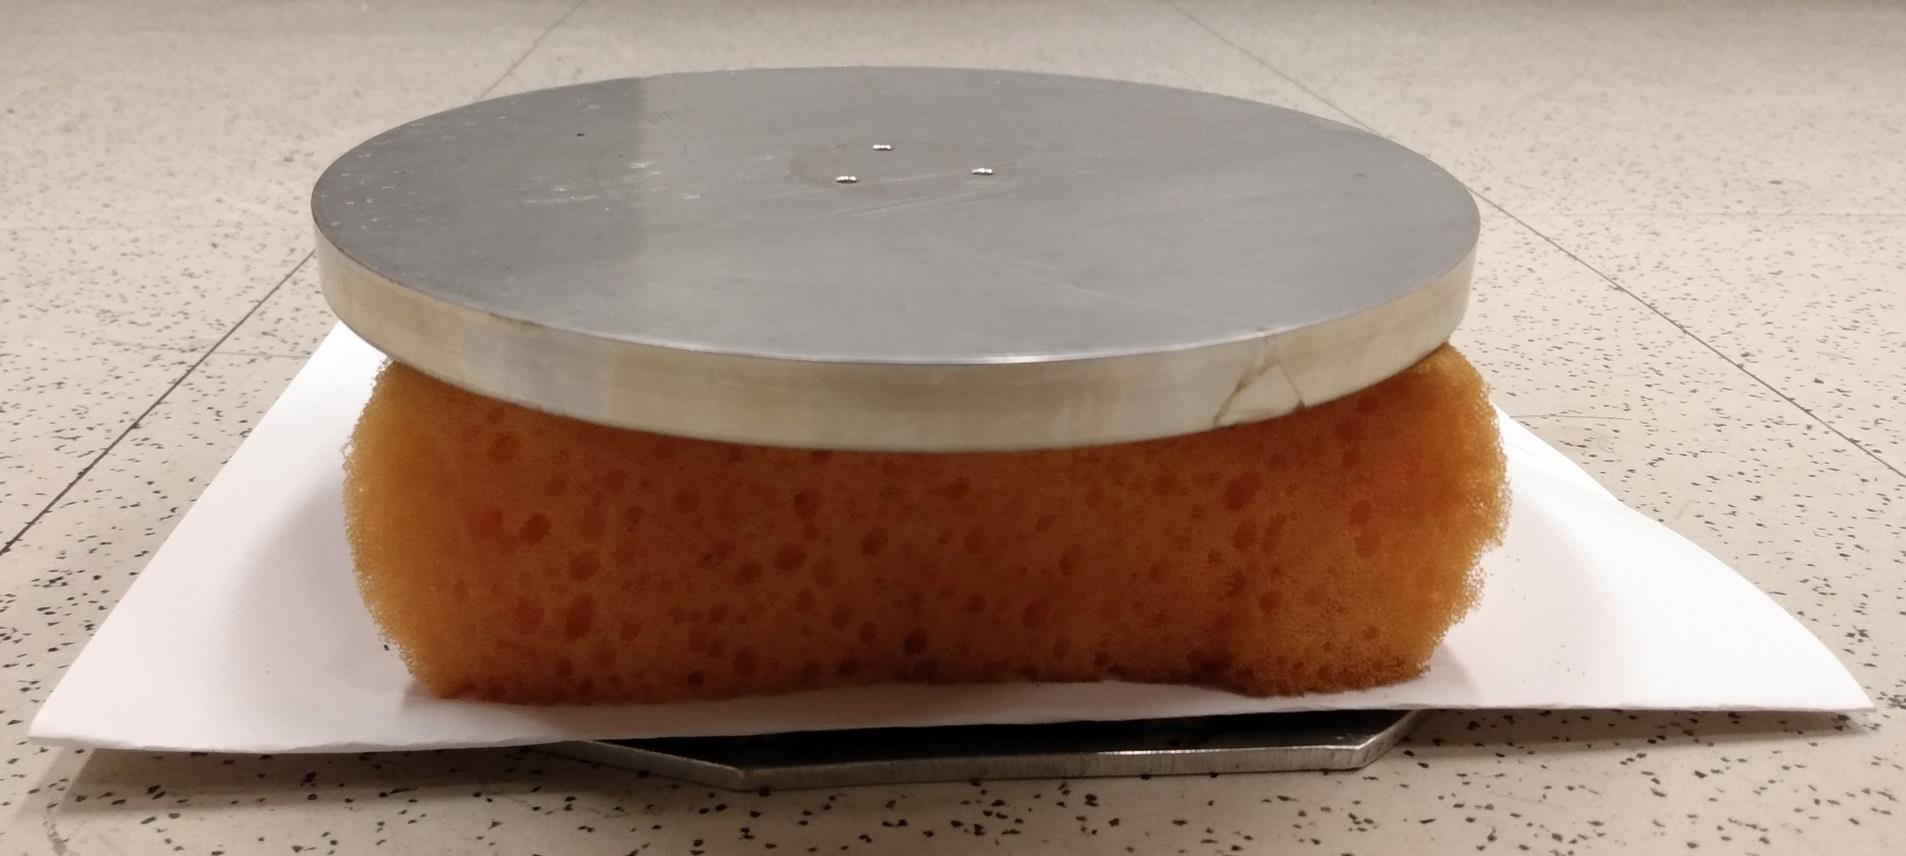
Figure 3. Colony imprinting tool. The imprinting tool consists of a 3/8″ steel plate, flat sponge, folded A4 paper, filter paper with colonies, MALDI target plate, and protective steel plate, from top to bottom.Immediately step onto the 3/8″ steel plate using your full body weight (> 50 kg). Set the center of the foot roughly near the center of the plate and press using both upside and downside of the foot; avoid pressing only one area at the periphery of the plate. Add extra weight by pushing up the edge of the table or hood using hands (> 1 s).
Remove the steel plate, the sponge, and the paper sequentially.
Place the MALDI target plate on the table and wait 30 s for drying.
Using the tweezer, remove the filter paper from the MALDI target plate (Figure 4). Put the used filter paper and the A4 paper into the biohazard trash can.
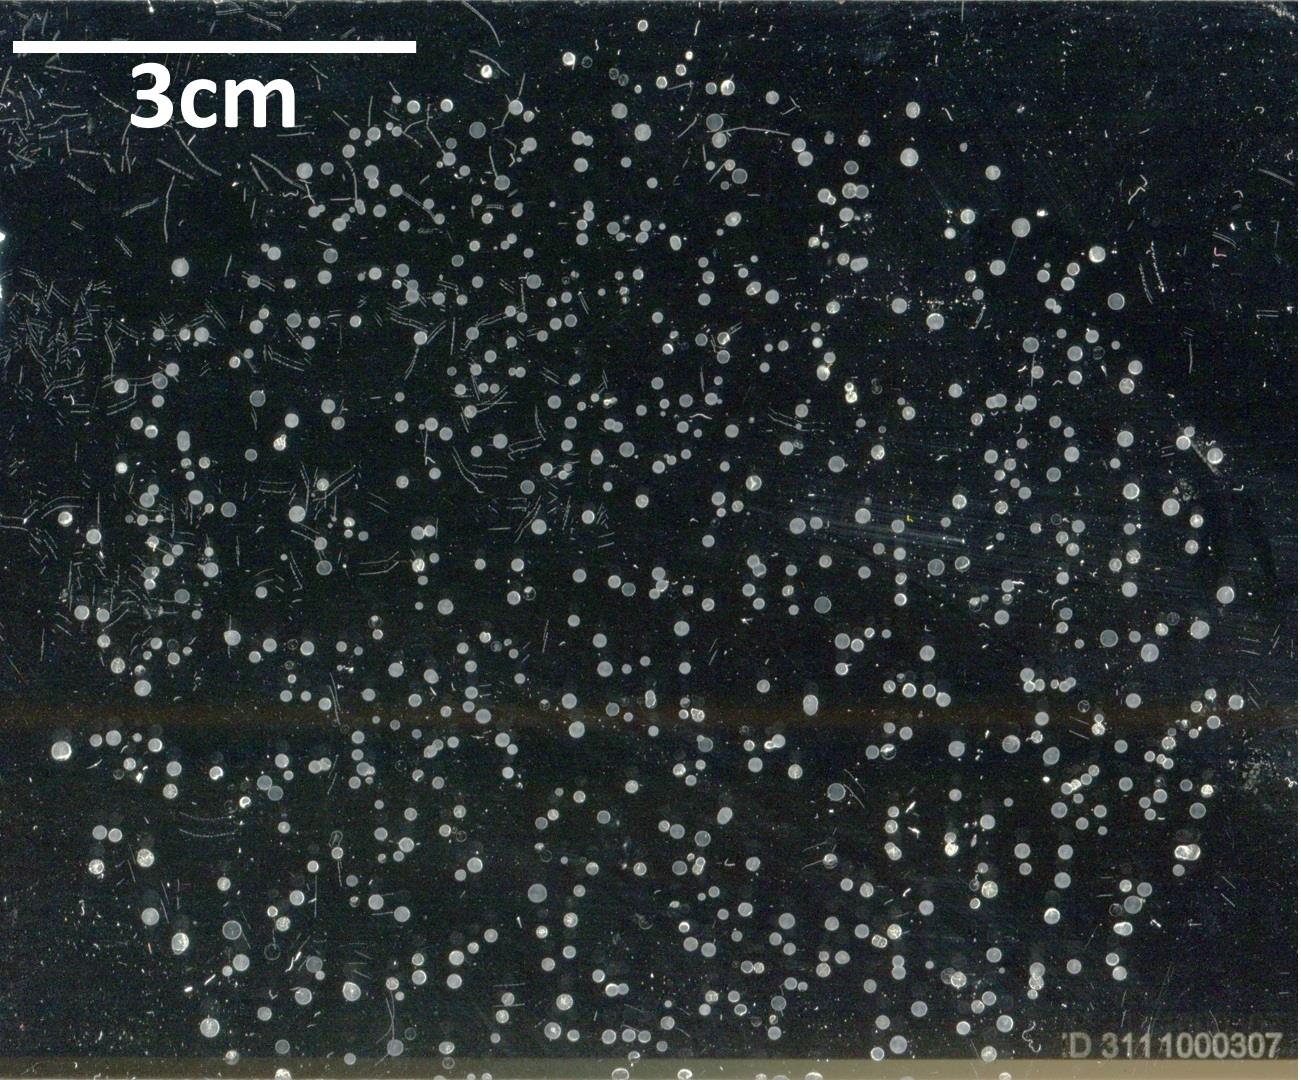
Figure 4. Example of a MALDI target plate with imprinted E. coli coloniesStore the target plates in the vacuum desiccator from step D5 for 5 min and remove weakly attached colonies by gentle airflow using the air tube (Note 7).
If no visible biomass is left on the agar dish after removing the colonies, incubate the plates in the cell culture incubator until a visible amount of biomass reappears. If the cells do not regrow, try reducing the initial cell culture time (step A1k).
Seal the agar plates with parafilm-M and store them in a 4 °C refrigerator.
Imaging using flatbed scanner
Open the cover of the scanner and leave the cover lifted.
Clean up the scanner glass with ethanol wipe, removing dust and particulate matter.
Set the target sample slides onto the scanner glass with the sample side facing down.
Check the rotational orientation of the letters on the back of the target plate to avoid rotationally flipping the plate upside down (Figure 1).
Orient the target plate so that the top and bottom edge of the target plate are perpendicular to the side edges of the frame of the scanner glass.
If the target plate is an ITO slide, turn off the room light. If the target plate is a nontransparent metal plate, close the cover.
Open the control software for the scanner.
Set the resolution to 800 dpi.
Set the scanned area so that the target plate(s) is included while minimizing the off-target area. Up to four target plates can be imaged together.
Obtain the width and the height of the scan area in pixel number. Calculate the total pixel count by multiplying these values and check if the total pixel is smaller than the max pixels allowable by the macroMS software, which is 30,000,000. In other words, macroMS does not accept an image larger than ~300 cm2 at 800 dpi.
Check if all the fiducial points are visible in the image (Figure 5).
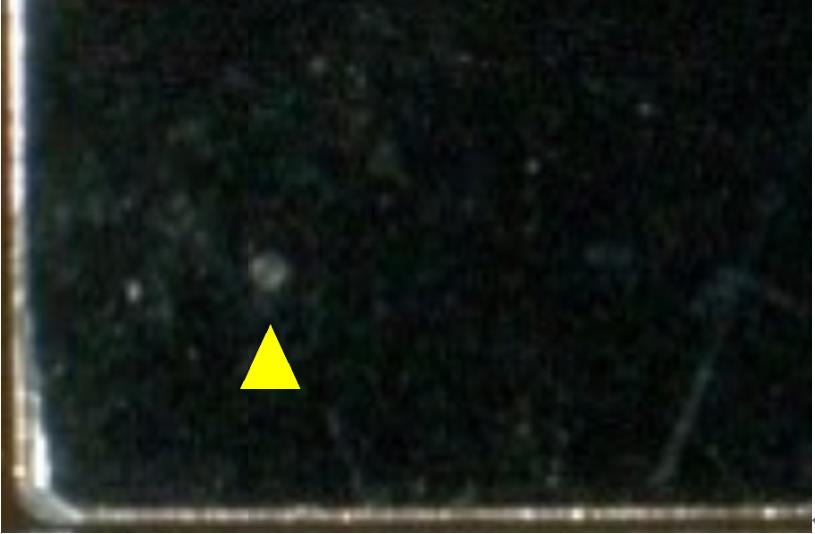
Figure 5. Example of a fiducial mark. The point highlighted by the yellow arrow is a laser etch mark that is created during building the custom MALDI target plate. This point should be visible both in the image and in the video feed of the MALDI-MS instrument. This etch mark is ~200 μm.Optionally, the image thresholds can be adjusted to increase the contrast between the colonies and the background. The background should be either clearly darker or clearly brighter than the colonies. The background should have uniform darkness.
Perform scanning. For mirror polished steel plates, if white vertical stripes appear due to the LED light bulbs, rotate the plates 90° and scan again.
Confirm that the total pixel count for the image is less than 30,000,000. For this, right-click the image file and click properties. Find the vertical and horizonal dimension in pixel counts and obtain the total count by multiplying the two values (i.e., 4,000,000 for a 2,000 × 2,000 image). If the number is larger than the limit, use lower dpi resolution.
Confirm that the fiducial points for each of the plates are visible in the image.
Confirm that the up-down orientation of the sample plate is correct (Figure 1).
Name the filename informatively.
Clean up the scanner glass with ethanol wipe.
macroMS for image analysis and target recognition
Confirm that the total pixel count for the image is less than 30,000,000. Refer to step A3n.
Using either Firefox or Chrome web browser, visit macroMS web tool at https://macroms.scs.illinois.edu. (Video walkthrough for operating macroMS can be found at https://www.youtube.com/watch?v=OckpuZsUfSg. More in-depth instructions can be found at https://kisurbc2.gitbook.io/macroms).
Submit the image file.
Using the Edit fiducials tool, put three fiducial marks at the fiducial points at the three corners of the target plate in the image. Use the max zoom to set the fiducial mark at the precise center of the fiducial point.
Using the Set ROI tool, set the region to perform target finding. Select the area in the plate where the colonies are located.
Select the image threshold type in the dropdown menu. Gray is the most frequently used.
Using the scroll bar, adjust the threshold value. The image panel immediately displays the image that is thresholded at the current value. Using this feedback, decide the threshold that results in more visible colonies while minimizing the background noise.
Set the minimum and maximum size for target finding. For 2 mm colonies in 800 dpi image, 200 and 1,000 can be example values for minimum and maximum size.
Set the circularity limit to approximately 0.3.
Perform target finding (Figure 6A). Several trials can be done to find the parameters increasing true positive identification and reducing false negative identification. The optimized values for the parameters are reusable as long as the next images have the same dpi resolution and similar colony sizes.
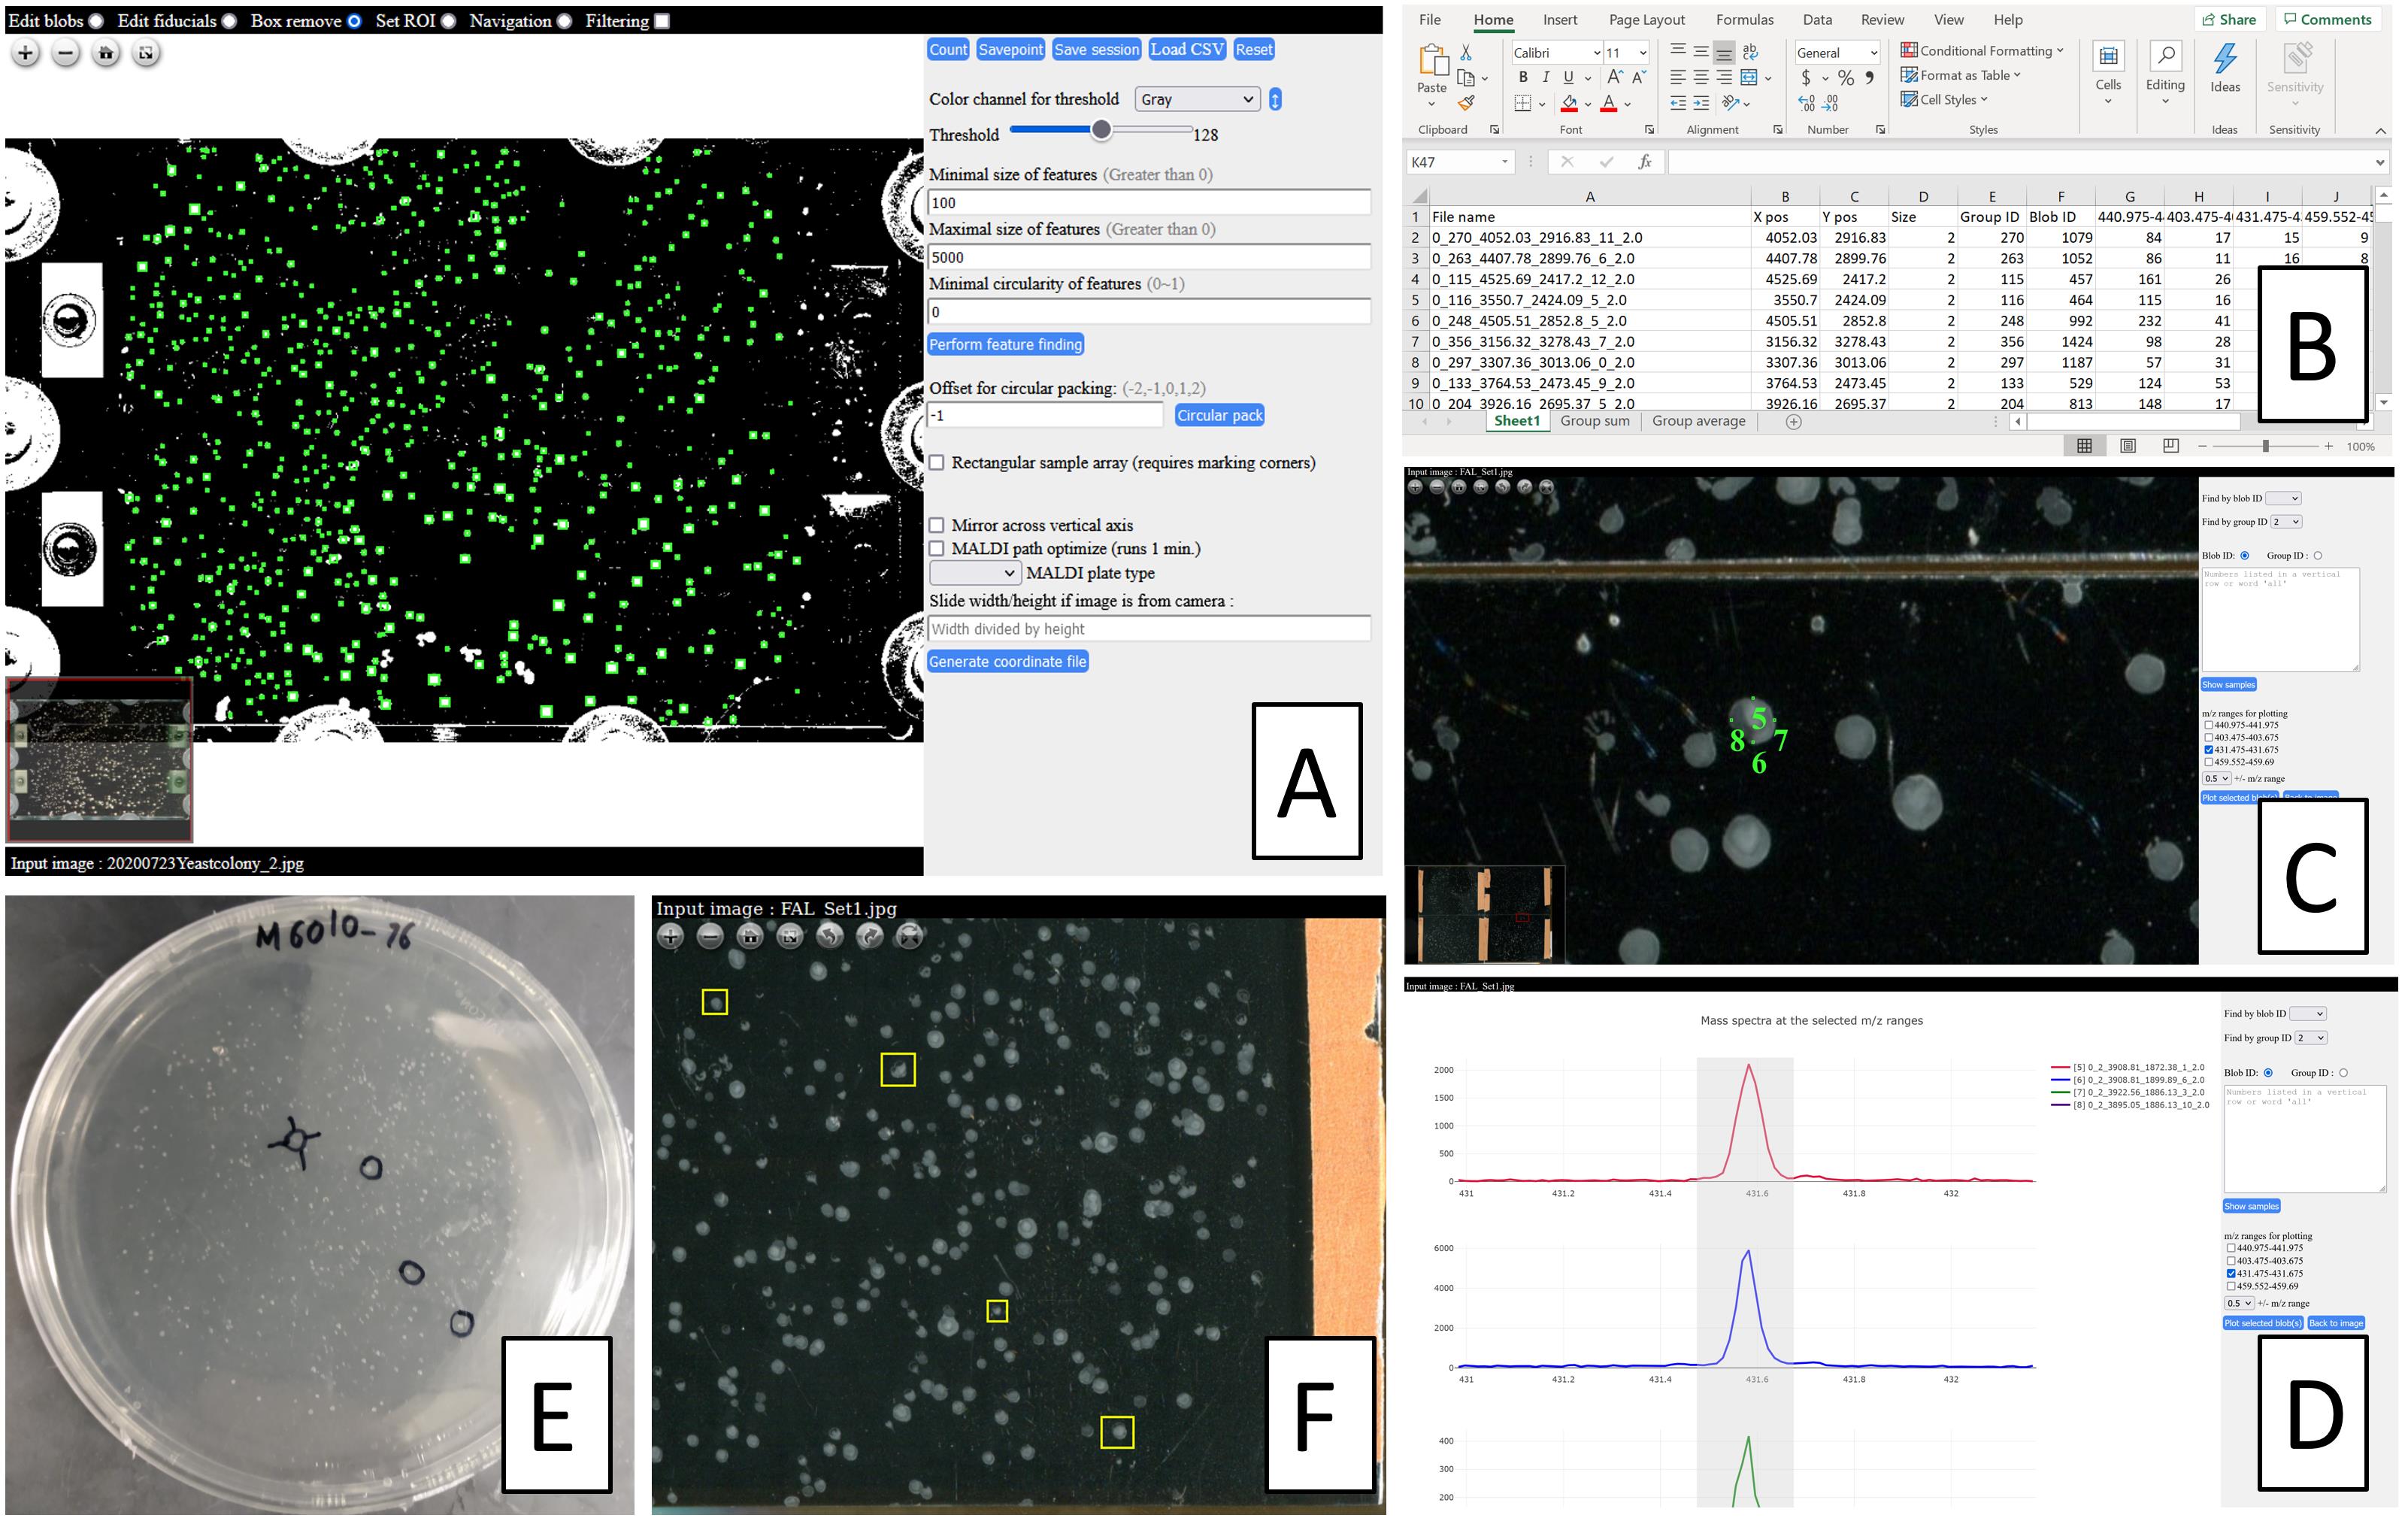
Figure 6. Overview of the functions of macroMS software. A. Finding colonies by image analysis on a scanned photo of a 50 mm × 75 mm ITO slide (Choe et al., 2021). B. Data analysis output listing signal strength for peaks of interest for all screened colonies. C, D. Data visualization tool that matches the data analysis results to individual colonies. E, F. Finding a colony from a Petri dish using the colony-hopping functionality of the data visualization tool.If areas around the colonies are to be sampled, perform circular packing with offset value of 1.
Using the filter tools and the target editing tools, remove target boxes from false positives (i.e., merged colonies and particles) and add target boxes to false negatives. An option for addressing high false negative rate is screening more colonies from additional agar plates.
Select the target plate type and download the geometry file. Rename the geometry file informatively.
Move the file to the folder containing the geometry files for the flexControl software (i.e., D:\Methods\GeometryFiles). Never edit the content of the geometry file manually.
Spraying MALDI matrix
Spray approximately 0.1–0.3 mg/cm2 of PNA matrix onto samples using the sprayer owned by the lab. If the lab does not have a sprayer, an option is to build a sprayer device and perform the steps as described in section D. For peak alignment, putting one or two internal mass calibrants into the solution is recommended (Note 8).
Remove the tapes on the target plate from step A2b.
Using methanol wipes, remove the matrix from the fiducial points.
At the fiducial point near the top left corner edge of the target plate, spot 0.5 μL of the gold colloid solution and dry the droplet.
MALDI-MS analysis (Note 9)
Mounting target plate onto adapter (Note 1)
Take the adapter for MALDI-MS target plate into the chemical safety hood where the target plates are located.
Attaching target slide or ITO glass onto PACII adapter:
i. Remove particulate matters on the MALDI target adapter and on the backside of the target plate.
ii. Soak a paper towel with ethanol and thoroughly wipe the area on the adapter and the MALDI target where copper tapes will attach to. Pressing down with some force while wiping is recommended.
iii. Mount the MALDI target onto adapter. The up-down orientation of the target plate should be the same as the orientation of the MALDI adapter, so that the letters behind the target plate are not flipped upside down (Figure 1).
iv. Tape the plate onto the MALDI adapter using the one-sided copper tape (Figure 7). Flatten the tape as much as possible; there is little tolerance for the height differences within the instrument. The copper tape should not touch more than one surface of the adapter.
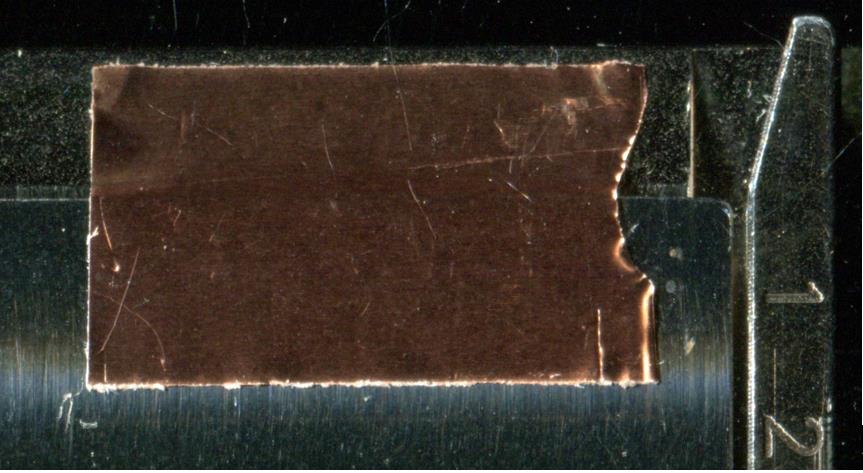
Figure 7. Example for placement of a copper tape. The copper tape does not reach above the upper edge boundary of the MALDI adapter.Attaching target slide or ITO glass onto adapters other than PAC II adapter.
Mount target plate onto MALDI adapter, following the product manual. Check the up-down orientation of the target plate.
Put the adapter inside the transport box.
Change to new gloves and carry the box to the MALDI-MS instrument.
Setting up optically guided MALDI-MS
Insert the MALDI target adapter with the plate into the instrument.
Press the Load/Eject button. From this point, a video walkthrough for setting up the instrument can be found at https://www.youtube.com/watch?v=OckpuZsUfSg.
In the Geometry dropdown menu, select the geometry file downloaded from macroMS.
Click the Sample Carrier tab and click the Teach button.
From the drop-down menu, find the entries that are labeled as “fiducial_X_Y_null.” For example, “top_left” in “fiducial_top_left_null” means the corresponding fiducial point is located near the top left corner edge of the target plate (Figure 8). After selecting one fiducial point, click Go. After the automated movement, move the target mark in the video feed to the center of the fiducial point by clicking in the video feed. When the target mark is centered at the fiducial point, click Reached (Note 10).
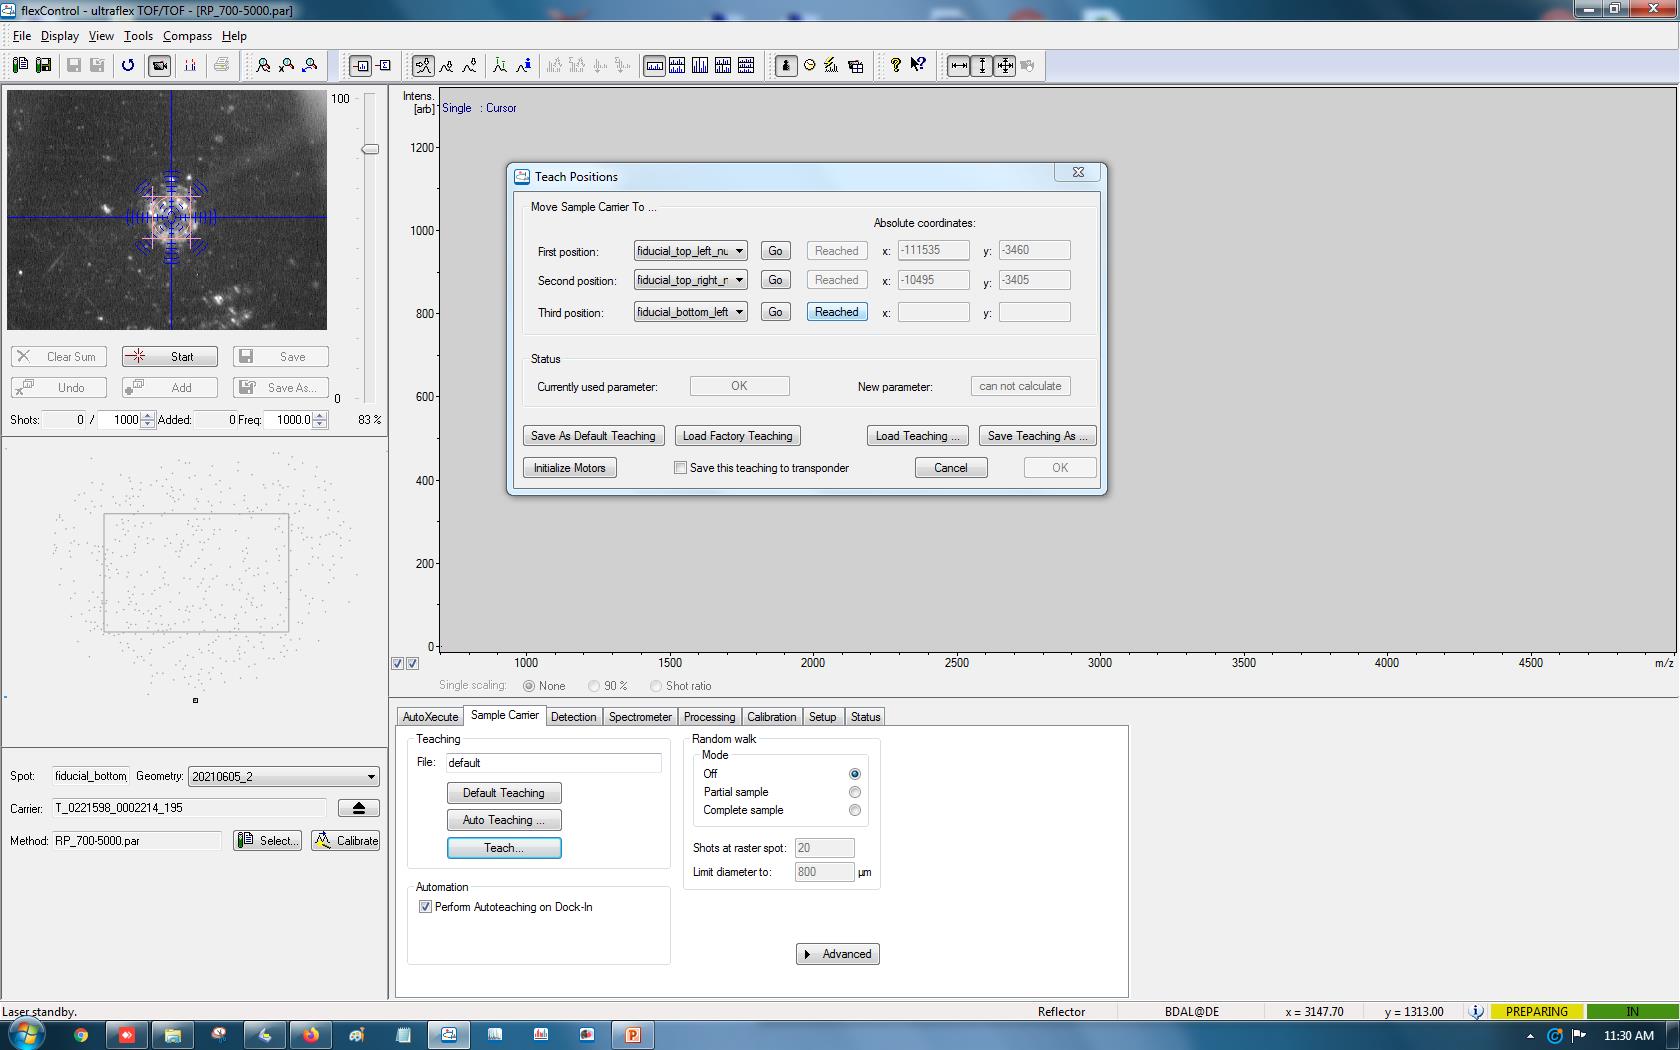
Figure 8. Fiducial training in flexControlRepeat the above procedure for the second and the third fiducial point.
Click the OK button.
Click several target points in the target map underneath the video feed. Check if the target mark in the video feed moves to the area within the targets. If not, check if the correct geometry file is loaded or if fiducial training is done correctly.
Select the desired MALDI-MS method file.
Perform mass calibration using the mass calibrant added at the top left fiducial point. For gold nanoparticles, peaks from ~1 to 7 Au can be used for calibration in positive or negative ionization mode.
Sacrificing a few colonies, adjust the following parameters that result in good intensity for peaks of interest (Note 11):
i. Laser intensity
ii. Number of laser shots
iii. Diameter of random walk
Click Detection tab and adjust the mass range. For data analysis by macroMS, the width of mass range should not be above 1,000 Da.
Save the method file.
Click the AutoXecute tab, select the desired AutoXecute method file, and set the laser settings in the editor as described in Note 12.
On another colony, check the peaks based on AutoXecute method by clicking Run method on current spot.
Click the AutoXecute tab.
Click the New button for the run and select the current geometry file.
Click Next twice.
At the sample selection page, mouse drag and drop select all the target positions (Figure 9). Avoid selecting fiducial points at the corner edges of the map.
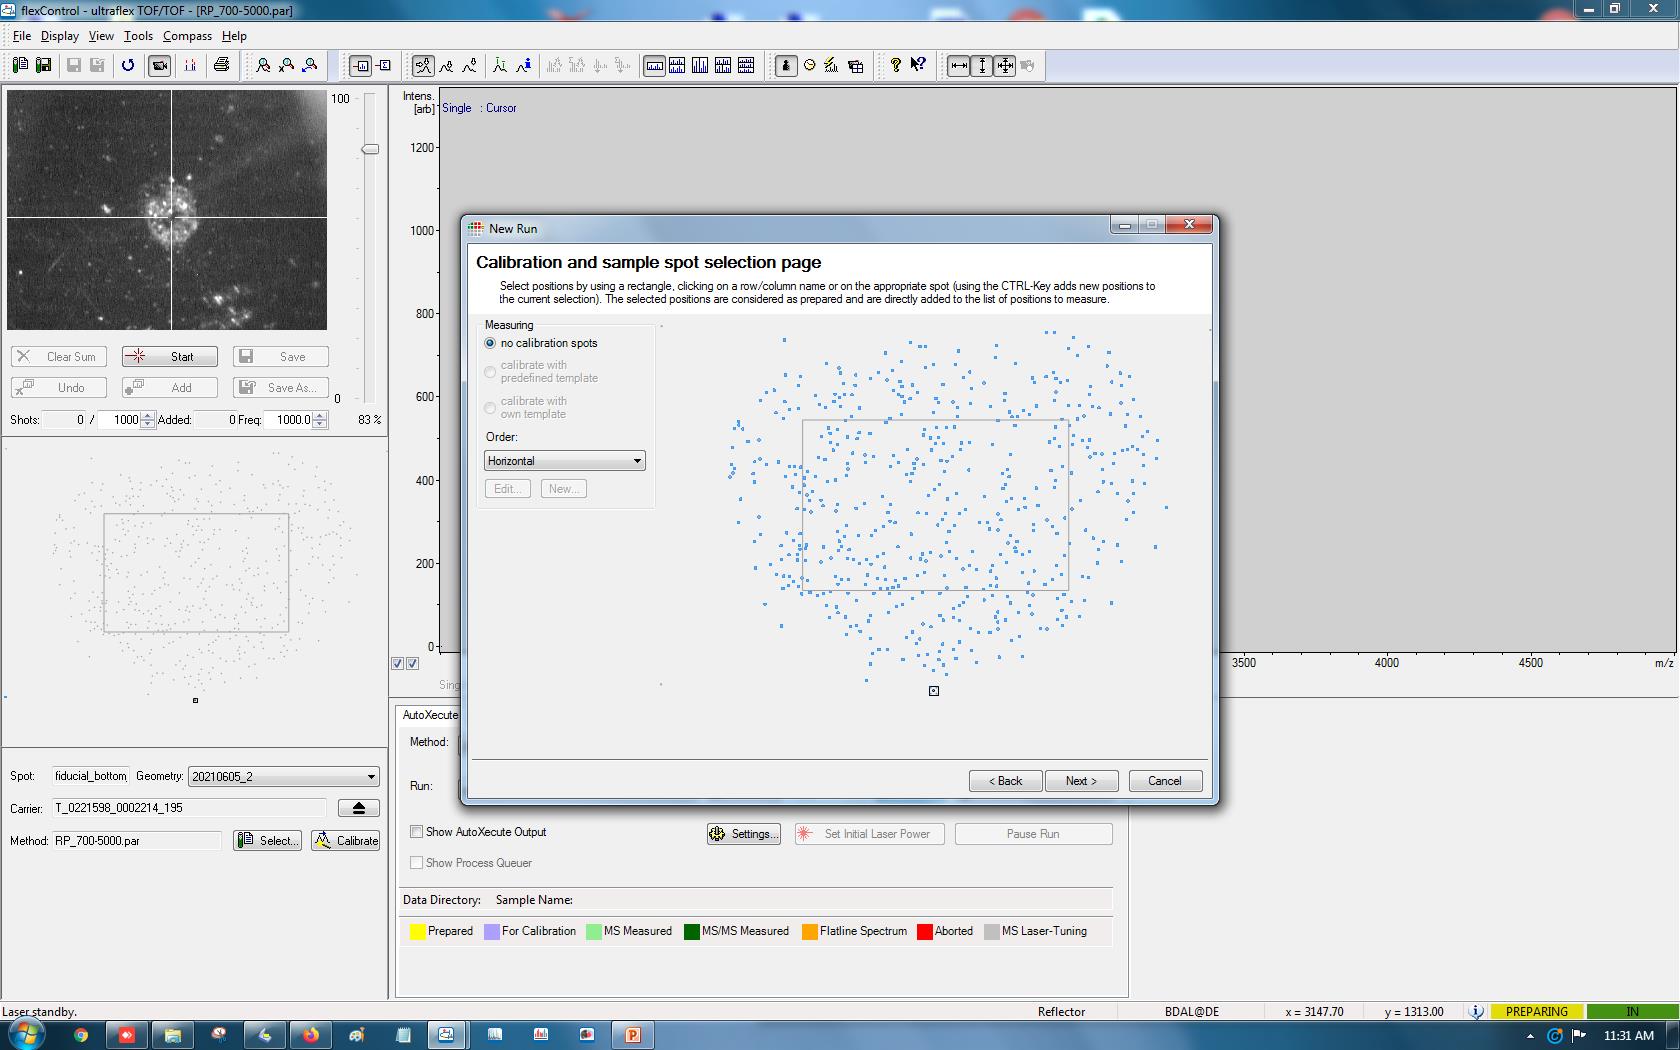
Figure 9. Selecting colonies as targets for MALDI-MS. By mouse click-and-drag, the targets generated by macroMS can be selected for MALDI-MS analysis.Click Next, choose the AutoXecute method, select the path for the output files, and type in the sample name. Click Next and click Finish.
Check the information listed in the window and click OK.
Type in the name for the sequence file and save.
In the mass spectrum window, zoom into one dominant peak of interest by Zoom X axis only and click Auto Vertical Scale checkbox.
In the AutoXecute tab, click Start automatic Run. Check the intensity of the peak for the first ~10 acquisitions.
Cleaning reusable MALDI targets
Squeeze the wash bottle for isopropyl alcohol and rinse off the MALDI matrix from the target plates. Collect the waste in a 10% bleach solution. During the cleaning steps, be careful not to create scratch marks on the mirror polished surface.
Remove the colonies on the plates using Kimwipes soaked with water, collecting the waste in 10% bleach solution.
Put the plates and waste into the 10% bleach solution and incubate for 30 min.
Put the plates into 100% isopropyl alcohol and sonicate for 10 min.
Dry the plate using Kimwipes.
Store the plates in a closed container.
Data analysis
Refer to the Data Analysis section for identifying colonies to isolate in the following steps.
Downstream testing
Colony picking
Open the data visualization map that is included in the data analysis email.
In the map, type in the colony ID of interest into the input box. This highlights the colony.
Obtain the corresponding Petri dish from the 4 °C refrigerator from step A2s.
Rotate the Petri dish so that the labels are at the top (See steps A1i and A2c). This means the up-down orientation of the colonies in the image and in the Petri dish are the same (Figure 1). Also, the colonies side of the Petri dish should be facing towards the observer.
Find any group of colonies that are identifiable from both the image and the plate. They are arranged in the shape of letters like I, O, and U. These colonies can be at the edge of the image.
Perform colony-hopping to gradually move towards the desired colony (Figure 6E, 6F).
i. Using a pen, circle the spot on the Petri dish where the colony from step C1e is located.
ii. By mouse drag and drop, highlight the same colony on the image page.
iii. Find the next colony that is closer to the colony of interest and is identifiable both in the plate and in the image panel.
iv. Mark the colony on the Petri dish and highlight the same colony on the image page.
v. Repeat finding and labeling a colony that is incrementally closer to the colony of interest until reaching the destination.
vi. Circle the spot on the Petri dish where the colony of interest is located.
Touch the colony with the tip of a sterile P1000 tip and circle the colony several times. If the desired colony is too small or too close to the adjacent colonies, a colony can be picked using a sterile pin following the steps below.
i. Tape a pin onto a pen.
ii. Tape the pen onto the head of a dissecting microscope.
iii. Set the Petri dish onto the stage of the microscope and turn on the background light.
iv. Using a lighter, burn the pin several seconds and wait 30 s for cooldown.
v. Move the pin towards the colony and set the tip of the pin ~2 mm directly above the colony. Use the coarse adjustment knob of the microscope for movement in Z-axis and move the Petri dish by hand for movement in the X-Y axis (Figure 10).
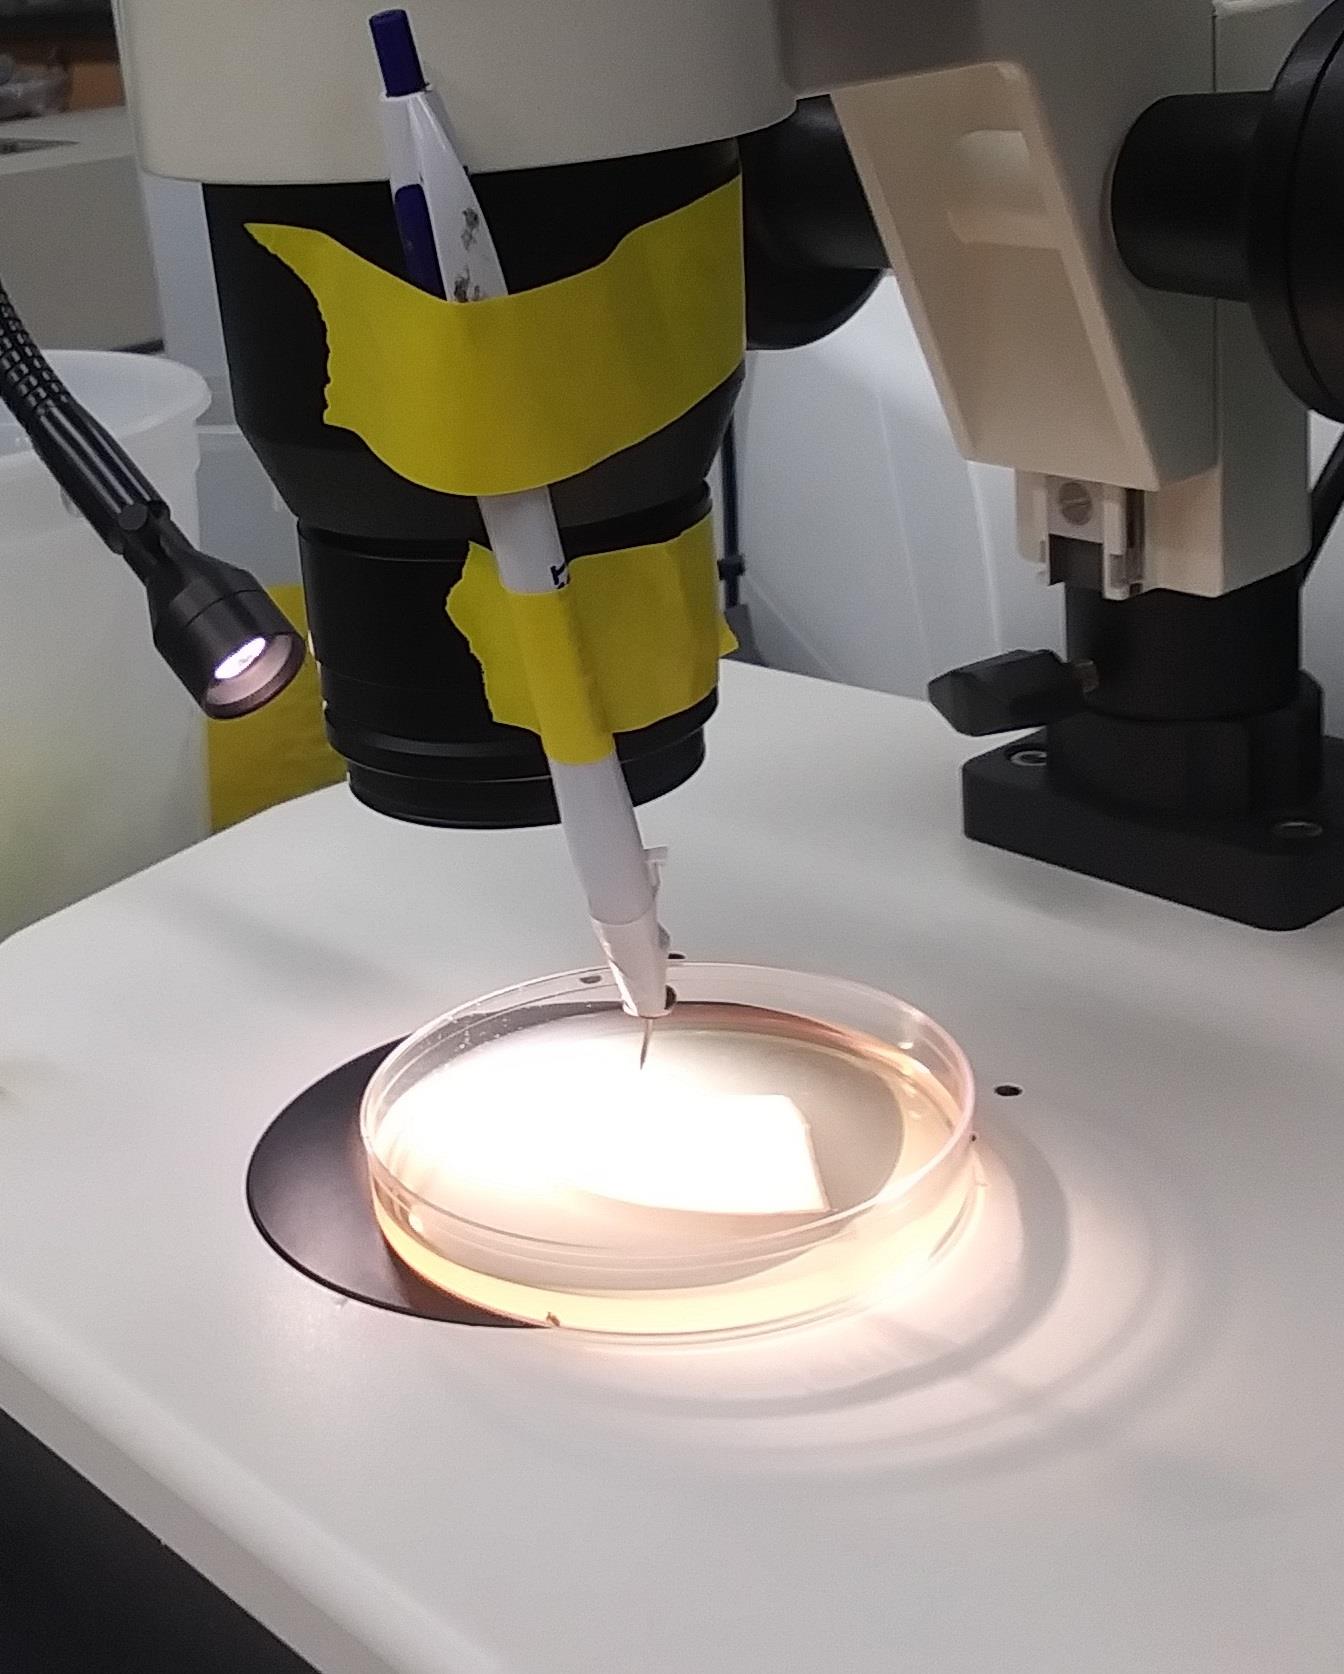
Figure 10. Colony picking by a flame sterilized pin. The coarse adjustment knob of the dissecting microscope is used for the precise up-down movement of the colony picking pin.vi. Use the coarse adjustment knob again to lower the pin and make physical contact between the tip of the pin and the colony. Optionally, maximize the transfer of cells onto the pin by moving the plate a little (< 0.5 mm) while making the contact.
vii. Lift the pin away from the colony.
viii. Remove the pen.
From the isolated cells, start 5 mL overnight cultures.
Purify plasmid DNA from the overnight cultures using the plasmid extraction kit following the manual included in the kit. Save the plasmid DNA at -20 °C.
Freshly transform electrocompetent cells with the purified plasmids and the control plasmid. The electrocompetent cells should be from the same batch.
Seed the isolates and the control into different sections of the same 150 mm agar plate. The plate should contain the same media that was used to form the products of enzyme activity (step A1e). For seeding, spot 50 μL of the cell media onto agar Petri dish and streak the liquid using a sterile pipette tip.
MALDI-MS confirmation of the regrown colonies (Note 13)
Using P200 pipette tips, pick a colony on Petri dish and thinly spread onto a well of MTP 384 target plate (Figure 11). Due to possible spread of the MALDI solution, leave an empty well between the samples. Transfer three colonies from each isolate and control strain.
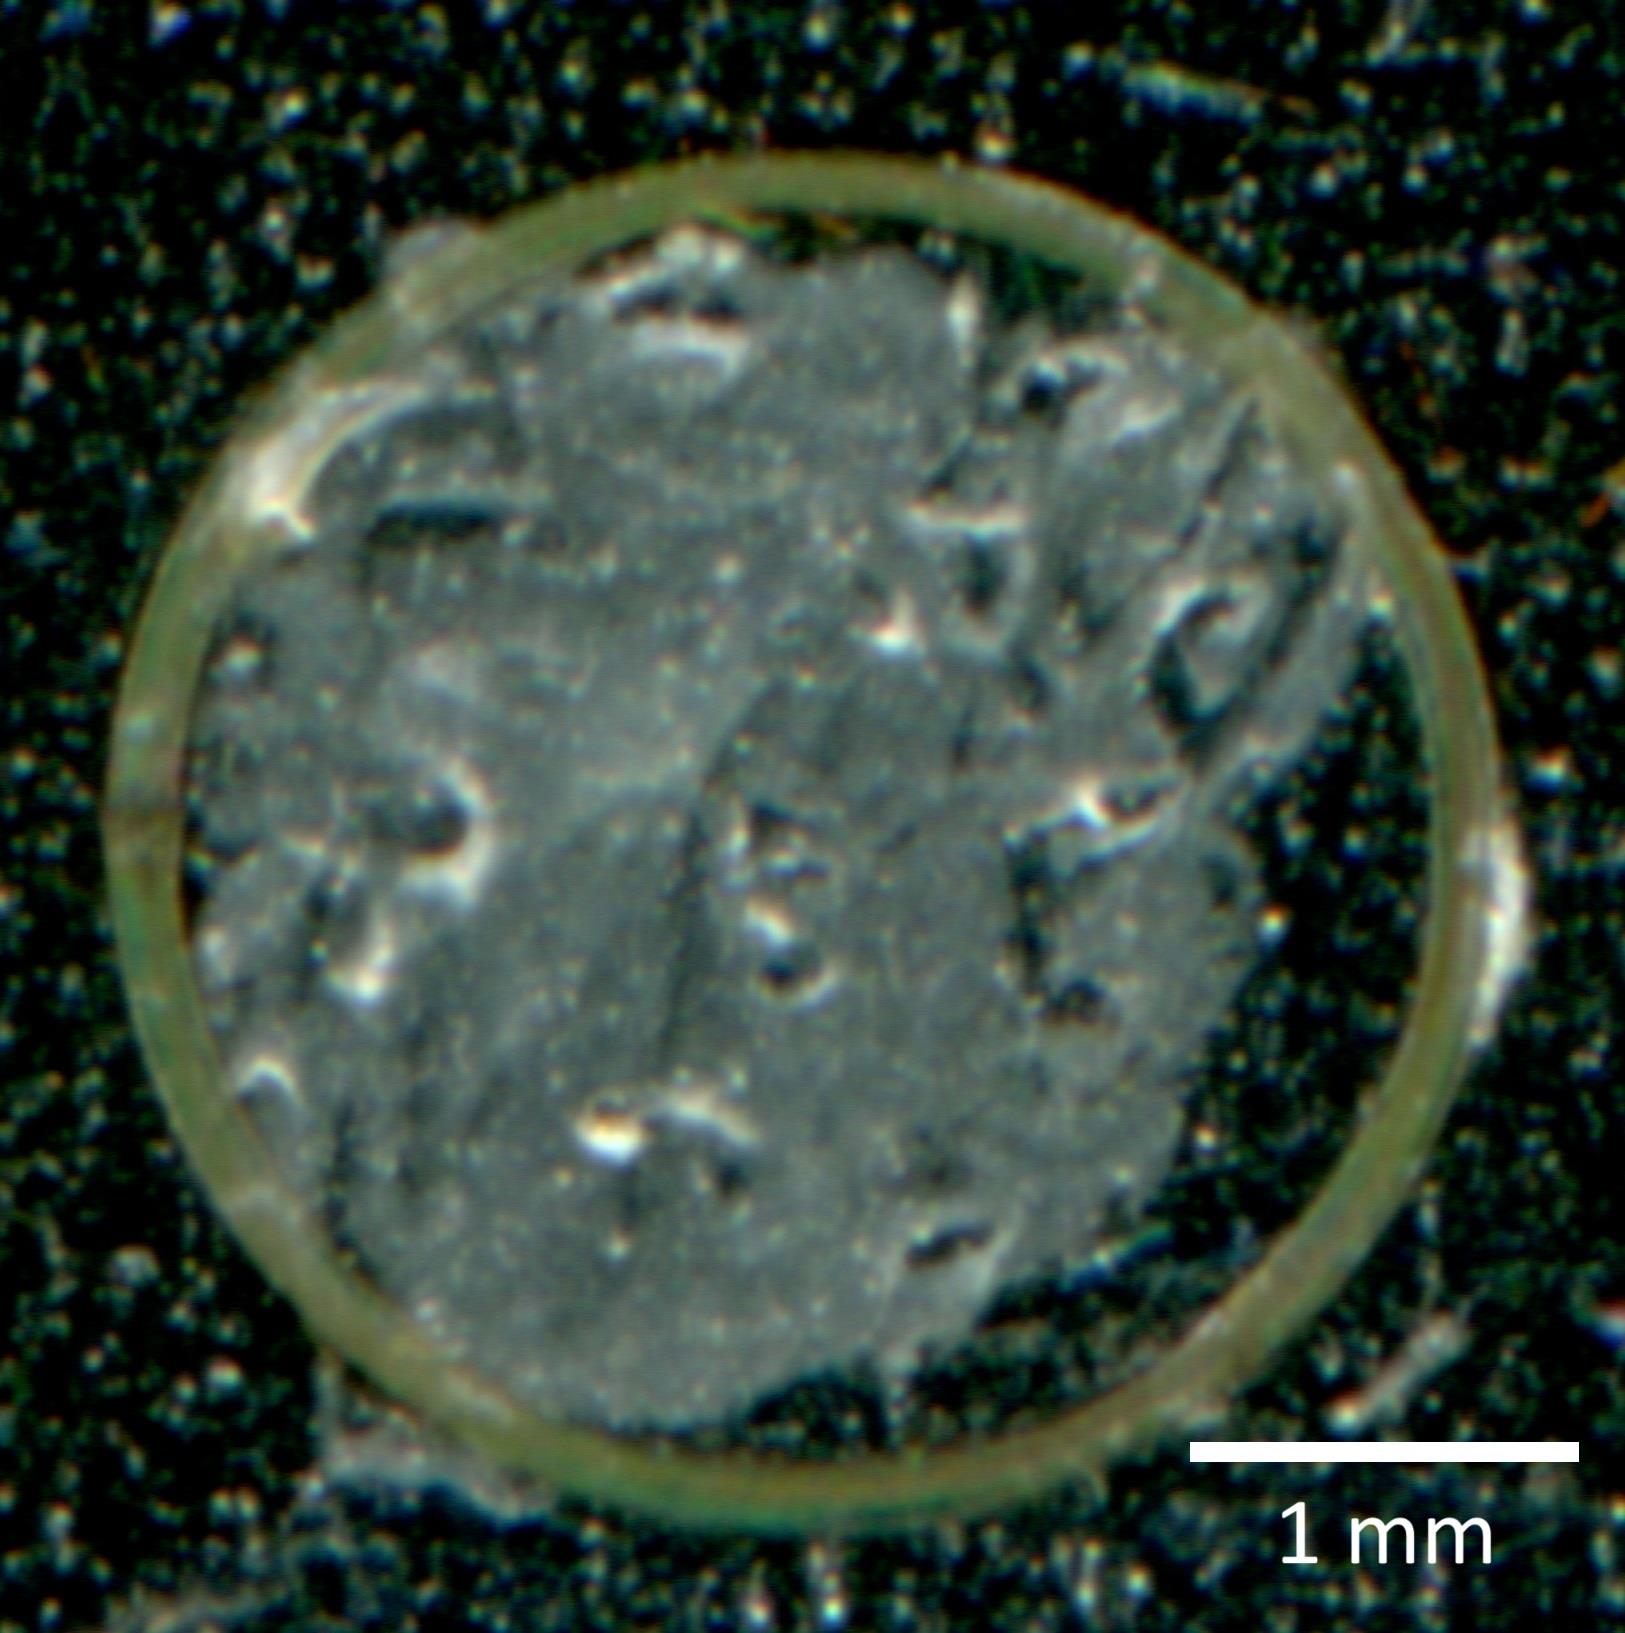
Figure 11. Example of spreading microbial colony onto a MALDI target wellSpot 1 μL of MALDI solution (10 mg/mL dissolved in acetone) to each well and dry the solution by evaporation (Note 14).
Perform MALDI-MS (4,000 shots, complete random walk, and ~40%–60% laser power). Refer to the data analysis section for the isolate analysis.
Building spray station and applying MALDI matrix (Figure 12) (Note 15)
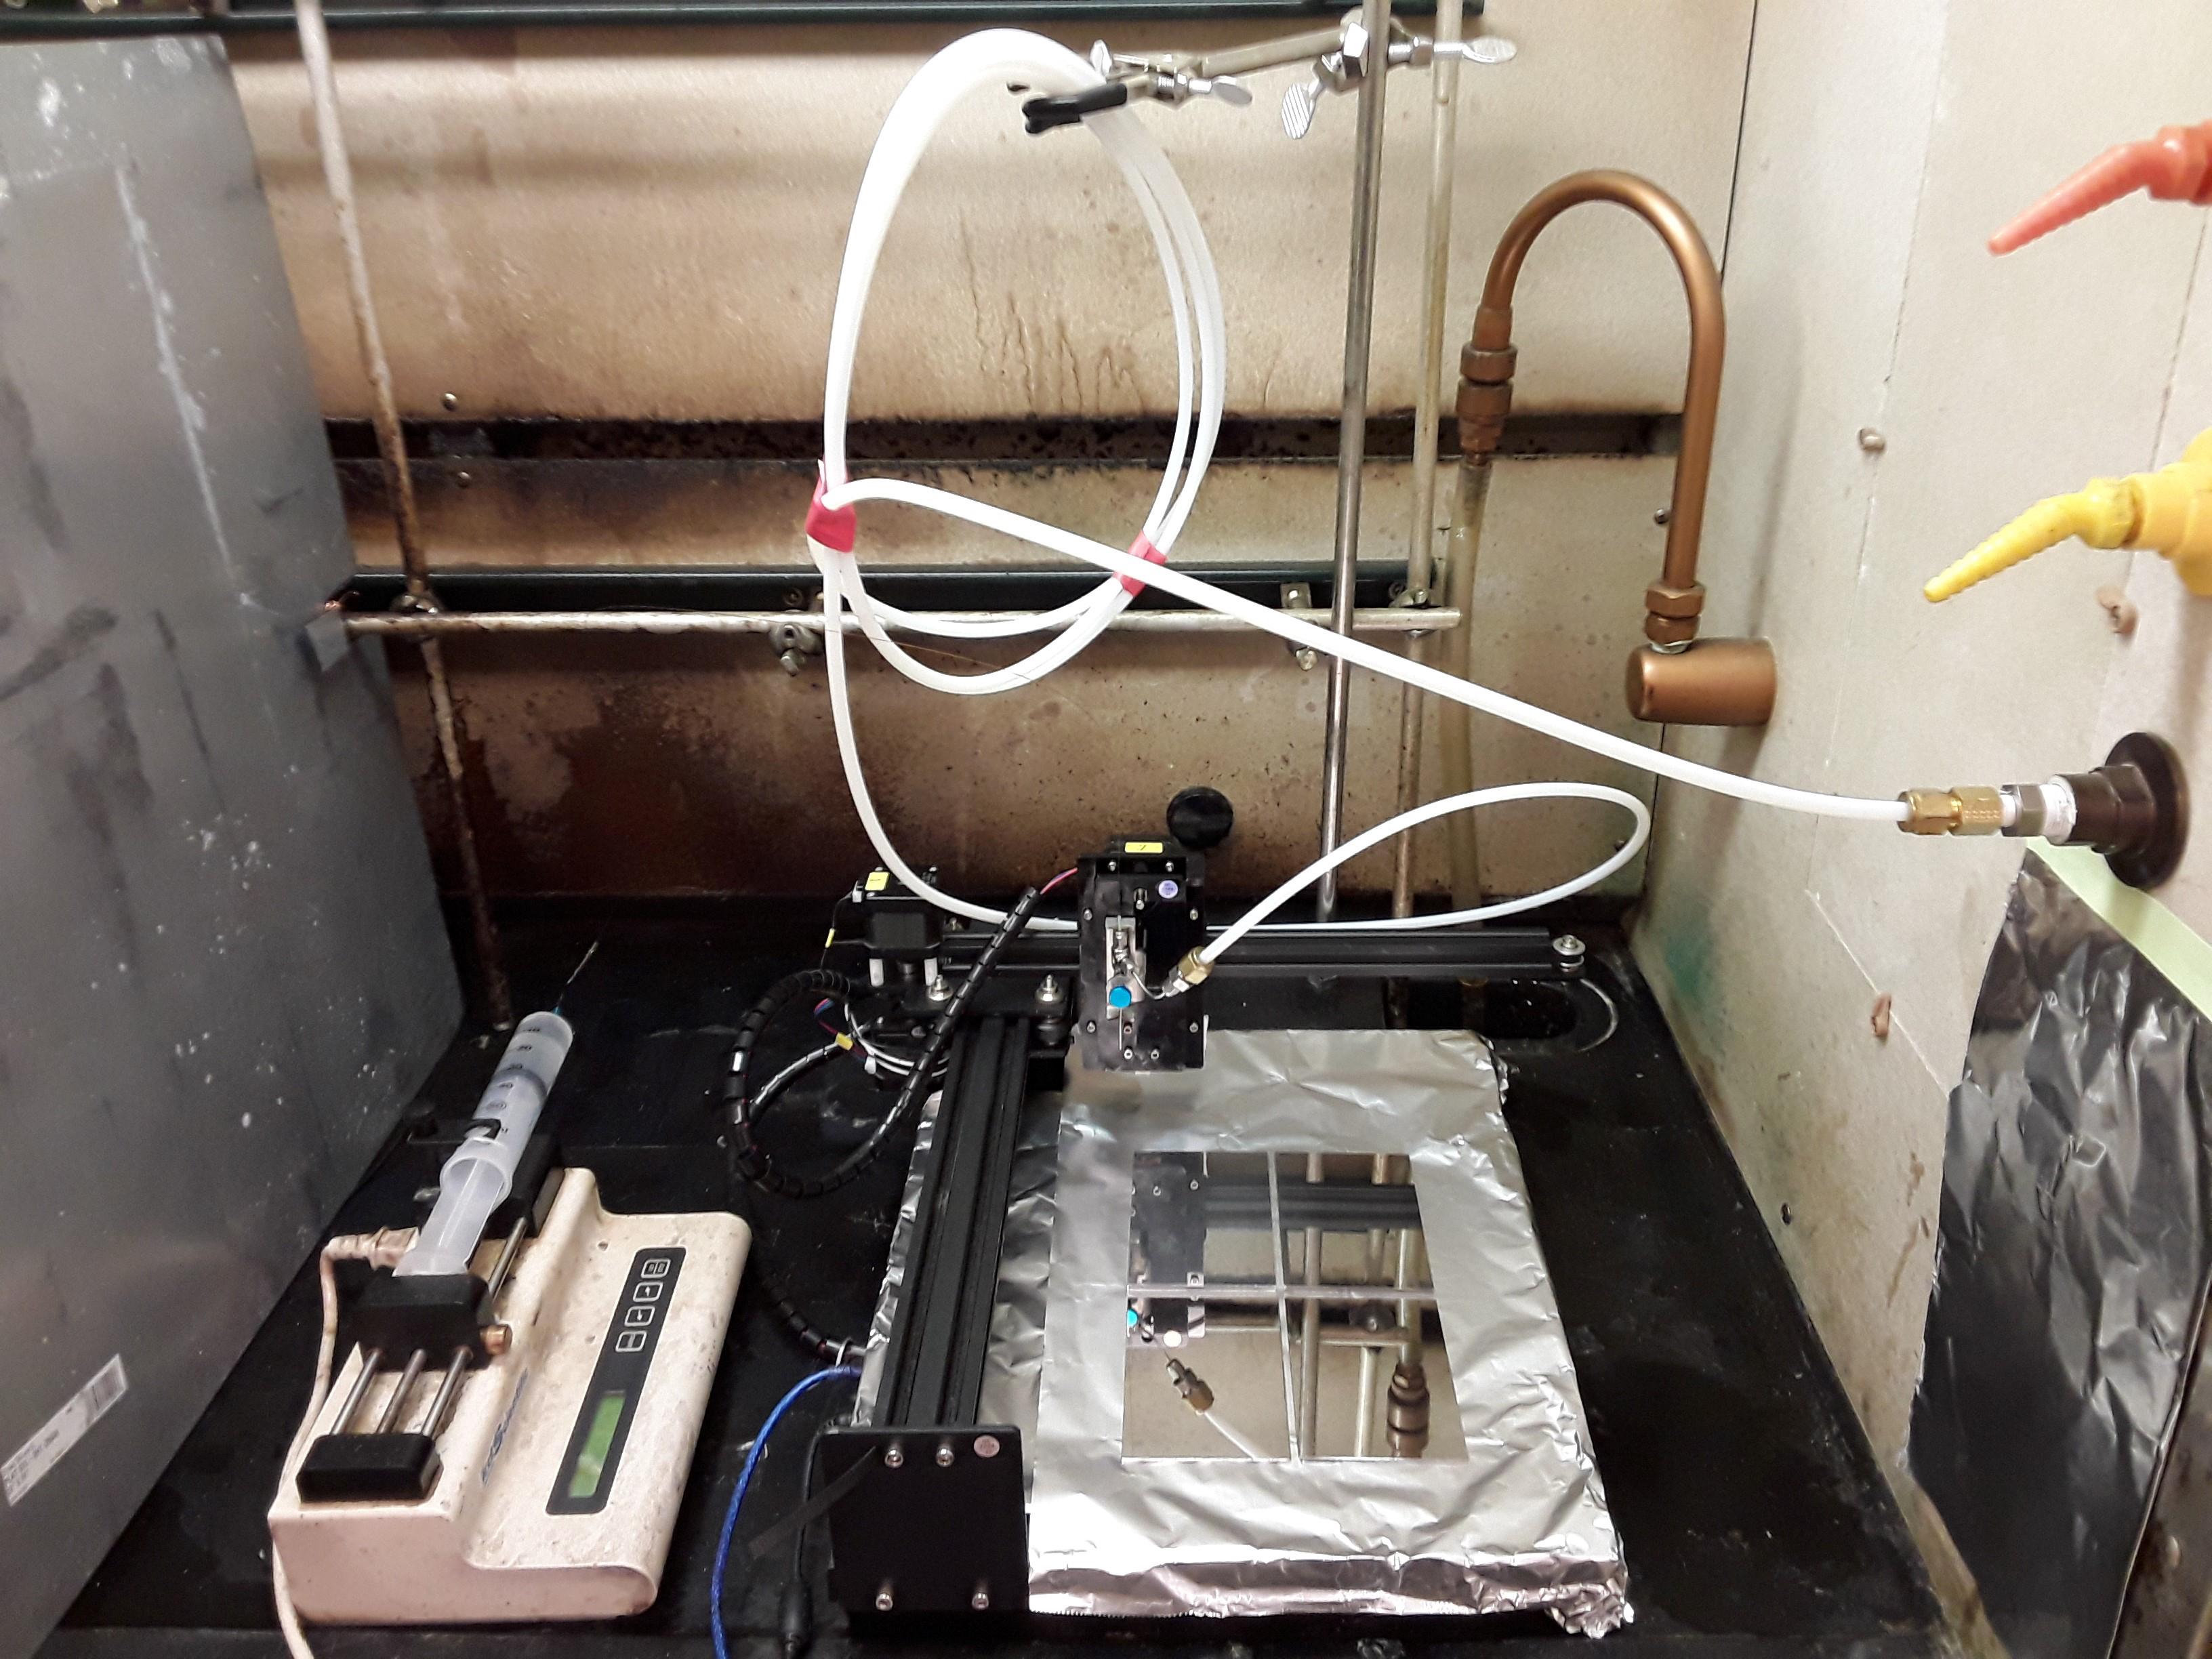
Figure 12. Overview of the MALDI matrix spray station in a chemical safety hood. A sprayer head is mounted at the penholder of the CNC drawing machine. When the matrix solution and the nitrogen gas are supplied, the sprayer head nebulizes the matrix solution into aerosol. While spraying, the drawing machine moves the sprayer head in step motion, uniformly coating MALDI plates with matrix.Nitrogen gas circuit
Using an adjustable wrench, unscrew the barbed connector for the nitrogen outlet of the chemical safety hood, exposing the female port.
Using the inside measuring jaws of a caliper, measure the diameter of the female port (distance between one inside edge and the opposite inside edge) and obtain the nearest fractional inch (Note 16).
Obtain a 1/4″ tube × D″ NPTF male connector where D is the measured fractional inch.
Screw the connector into the female port.
Cut 6′ of the 1/4″ nylon tube.
Connect the 6′ nylon tube to the 1/4″ side of the connector. To connect, untighten the hex nut for the 1/4″ side of the connector and insert the nylon tube into the hole. Using two wrenches, strongly tightening the hex nut will firmly fix the nylon tube onto the connector. Confirm the connection by pulling the tube from the connector. This method, untightening the hex nut using the adjustable wrenches, inserting the tube, and tightening the hex nut again for affixing the tube, applies to all connections mentioned below.
Connect the other side of the 6′ nylon tube into the 1/4″ × 1/16″ reducing union.
Connect a 1/16″ OD × .030″ ID tubing to the 1/16″ opening of the reducing union.
Connect the other side of the 1/16″ stainless steel tubing to the middle opening of the 1/16″ union tee. Bend the 1/16″ steel tubing by force like in Figure 13.
Connect the second opening of the 1/16″ union tee to the 1/16″ OD × .020″ ID tubing.
Connect the third opening of the 1/16″ union tee to the NanoTightTM tube sleeve. The constructed sprayer head is shown in Figure 13.
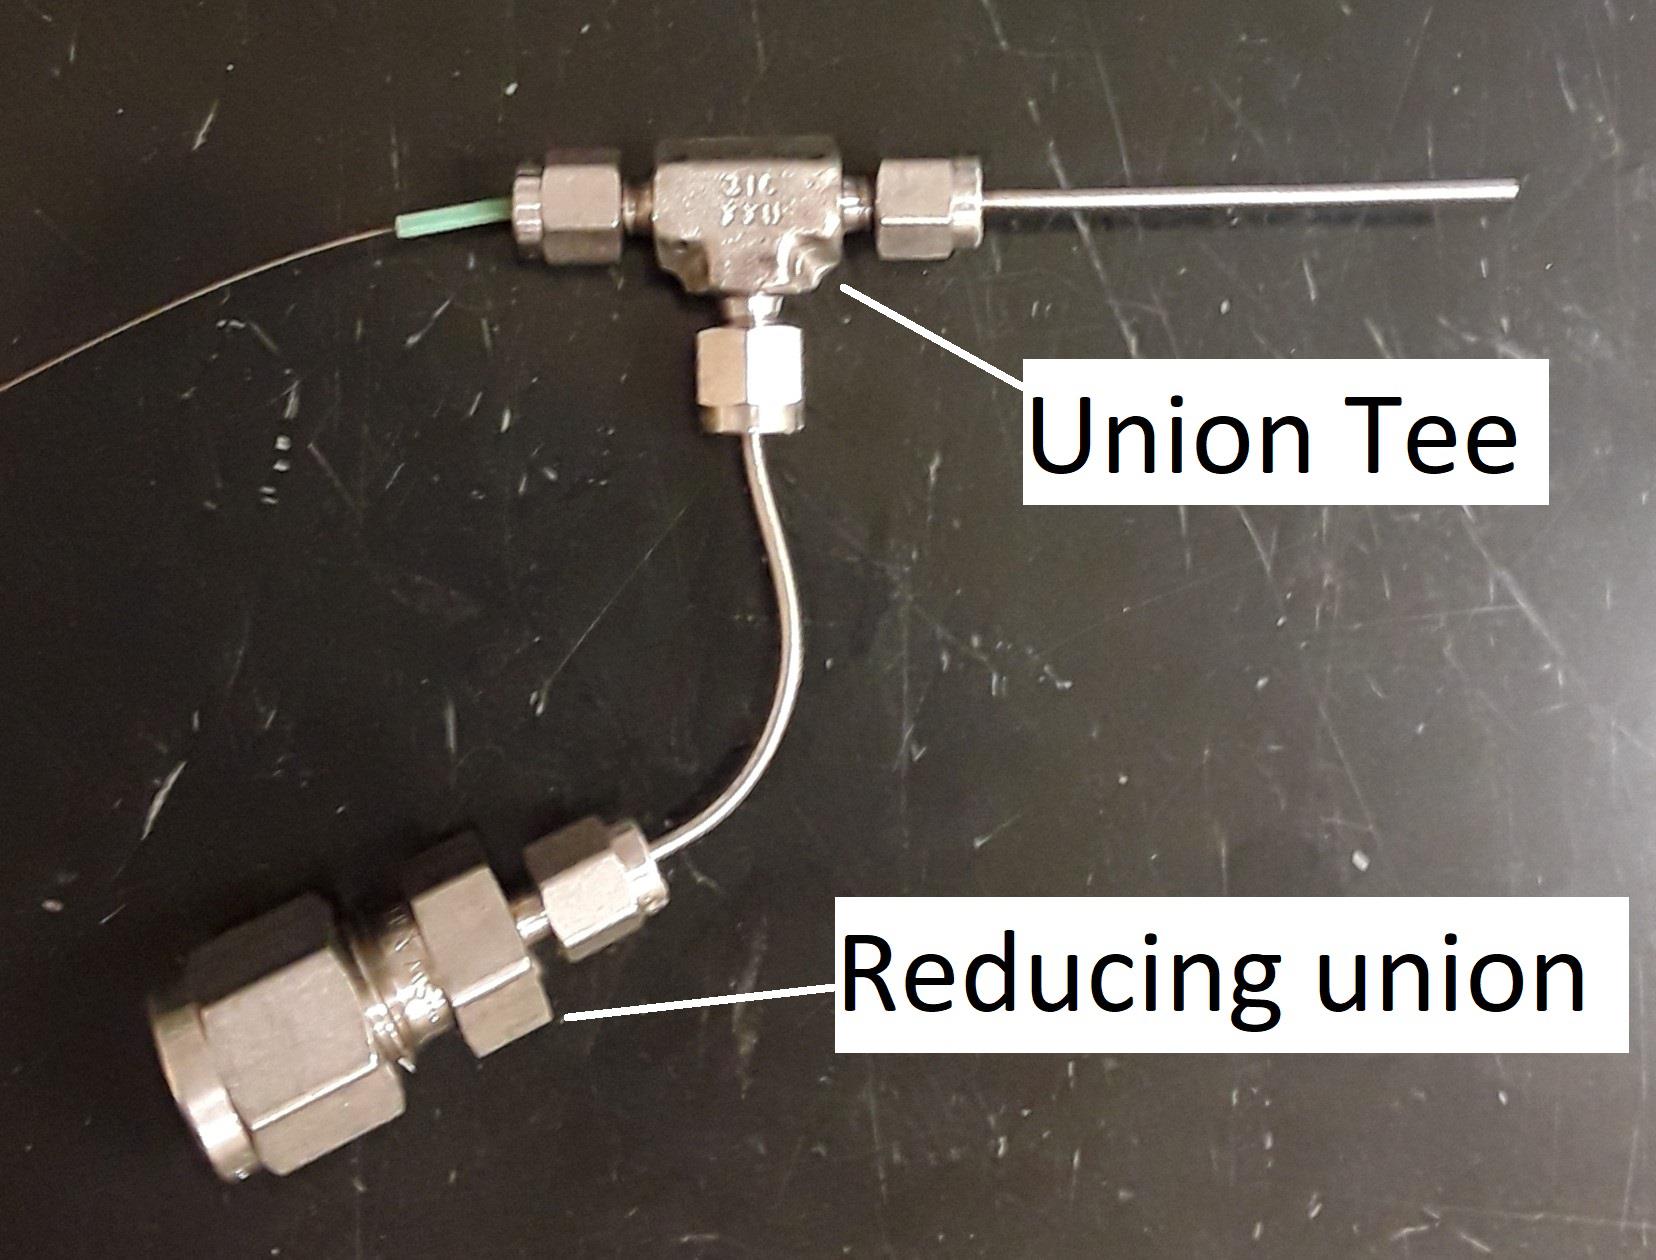
Figure 13. Completed sprayer head. The capillary tubing is inserted at step D2g.
Liquid circuit
Screw the Luer adapter into the Luer lock of the 50 mL syringe.
Partially screw the one-piece finger-tight screw fitting into the Luer adapter.
Fully insert the green tube sleeve into the screw fitting.
Cut 3′ of the capillary fused silica capillary.
Insert capillary through the tube sleeve until approximately 0.2″ of the capillary enters the syringe.
Strongly tighten the screw fitting. Check if the capillary moves by slightly pulling by hand (roughly 0.1 N force). If so, tighten the screw fitting stronger. The completed assembly is shown in Figure 14.
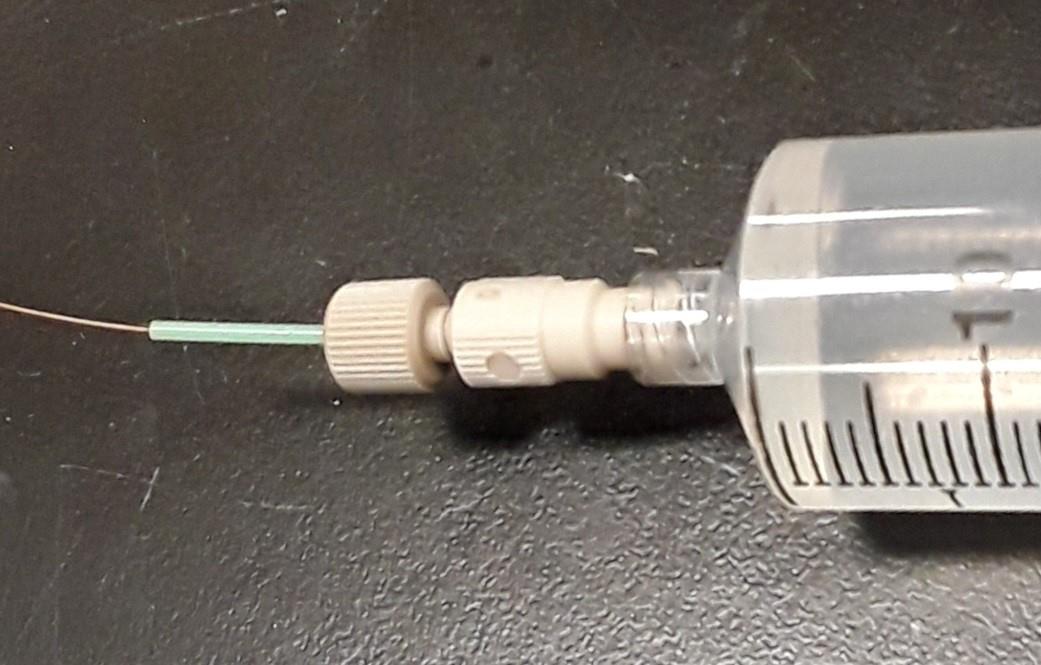
Figure 14. Syringe headConnect the other tip of the capillary to the sprayer head:
i. Slightly open the hex nut for the green tube sleeve.
ii. Insert the capillary through the tube sleeve.
iii. Push the capillary until approximately 0.5 mm of the tip of the capillary goes outside of the end of the 1/16 stainless tube (Note 17). Avoid pulling the capillary from the sprayer head mistakenly in the subsequent steps.
iv. Tightly close the hex nut.
Setting up the CNC machine
Using the online manual, set up the Bachin Draw CNC machine and the control PC (Note 18). While doing so, set the Windows PC right adjacent to the side of the chemical safety hood where the CNC machine will be located. Place the CNC machine inside the hood (Note 19)
Cover the bottom surface of the CNC with aluminum foil. Attach the foil using tape.
(Optional) Place the pen holder at the home position (top left corner edge). On the aluminum foil, mark a dot at 2 cm towards the 4:30 direction from the pen holder.
(Optional) Draw a horizontal line and a vertical line crossing at the dot. The lines should be parallel to the horizontal and vertical edges of the rectangular surface of the bottom plate of the machine. Record these lines by attaching six pieces of 2-inch tape along these lines.
Position the syringe pump next to the CNC machine.
Glue the sprayer head onto the pen holder following the steps below.
i. Completely tighten the hex nuts of the sprayer head. Disconnect the 6′ nylon tube from the 1/4″ × 1/16″ reducing union.
ii. Wet the locations of the pen holder that will make physical contact with the sprayer head with water (Figure 15).
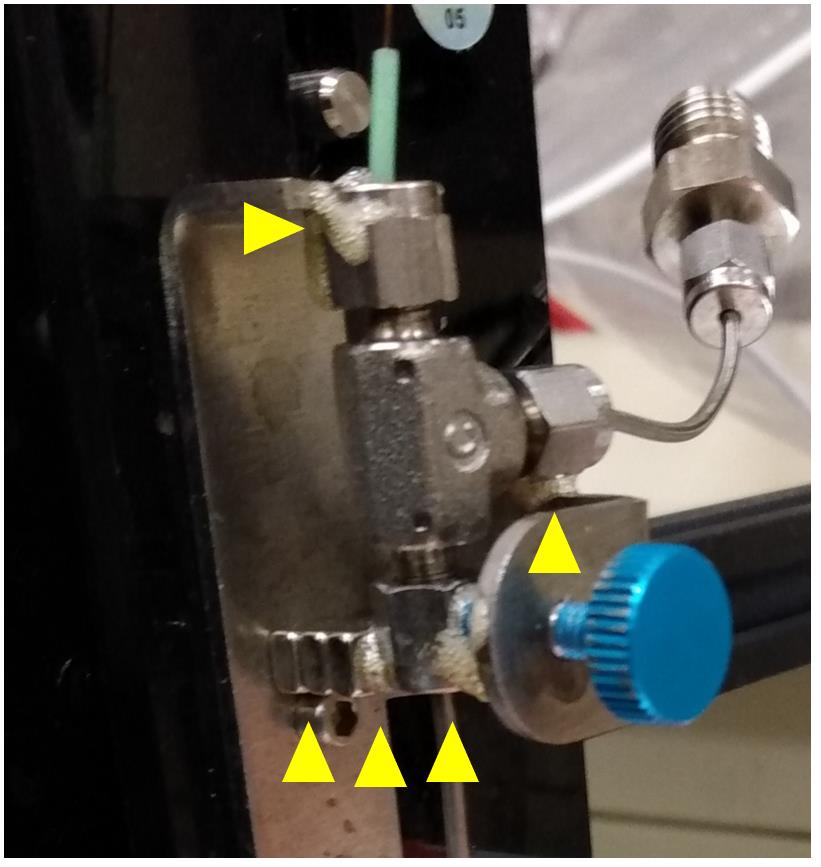
Figure 15. Locations for applying the Gorilla glue to attach the sprayer head to the pen holder of the CNC machineiii. Apply Gorilla glue.
iv. Wet the surfaces of the Neodymium magnets provided by the CNC device and apply the Gorilla glue onto the surface of the magnets.
v. Mount the magnets on the steel area that is opposite to the blue screw.
vi. Affix the sprayer head onto the pen holder by strongly tightening the blue screw, pressing the bottom hex nut against the magnets (Figure 15). Check the glued positions make contact between the sprayer head and the penholder.
vii. Apply the glue on the same locations of the penholder again.
viii. Wait 24 h until the glue solidifies completely.
ix. Connect the 6′ nylon tube back into the 1/4″ × 1/16″ reducing union.
Stabilize the sprayer by inserting its nylon tube into the clamp of the lab stand (Figure 12). The distance between the clamp and the sprayer head should be at least 4′ to allow flexibility during the spray.
Setting up the control software for the CNC machine
Open the Inkscape software. (Instead of drawing the spray path, the provided drawing files can be used. See Note 20 for dimensions. Jump to step D4r if the provided files are used.)
In millimeters, calculate the horizontal and vertical size of the area that MALDI matrix solution will be sprayed. The horizontal and vertical size of the area should be 40 mm larger than the MALDI target plate (i.e., for a 110 mm × 75 mm plate, the spray area will be 150 mm × 115 mm).
Click the Draw Bezier curves and straight lines button at the left sidebar.
Click at point where X = 1.00 and Y = 1.00. The coordinate of the mouse can be obtained at the right bottom corner of the window.
Click the second point where X = 1.00 + the horizontal size of the spray area and Y = 1.00.
Click the third point where X = 1.00 + the horizontal size of the spray area and Y = 3.00.
Click the fourth point where X = 1.00 and Y = 3.00.
Click the fifth point where X = 1.00 and Y = 5.00. Terminate the drawing by pressing the enter key. The completed single step of the spray path is shown in Figure 16.
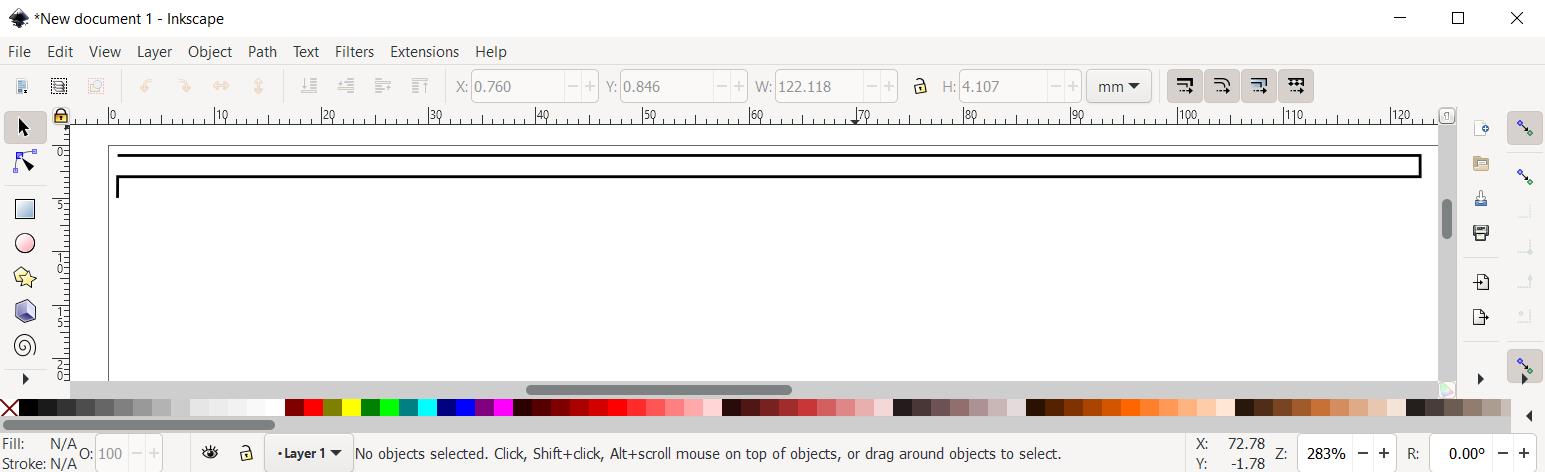
Figure 16. Drawing for a single step of the spray pathSelect the drawing by clicking. Copy and paste the drawing.
Join the copy and the original by moving the copy so that the fifth point of the original drawing touches the first point of the copy. The touching is indicated by the message “Cusp node to cusp node.”
Zoom into the spot where the two points of the drawings are joined (Figure 17). Click Edit paths by nodes (N) button at the left sidebar.
At the zoomed view, by hold shift + clicking, select both the line from the original drawing and the line from the copied drawing.
By holding click + dragging, select the spot where the two lines meet. Then, click Join selected nodes button at the top menu. This results in one continuous joined line (Figure 17).
Figure 17. Joining two nodes to create a continuous single spray pathRepeat copying the drawing followed by joining the nodes until the vertical size of the resulting drawing grows to the desired vertical size of the spray area (Figure 18).
Figure 18. Path for one round of spray coating. Multiple steps in Figure 16 are joined by node-to-node joining indicated in Figure 17. The area of the spraying should be 4 cm larger than the size of the sample.By hold-click + dragging, select the entire spray path. Then, copy and paste the path into the same canvas. Then, move the copied content precisely above the original, so that the copied content hides the original completely. While moving the copied content towards the original content, the software assists with the complete overlapping.
Repeat the above step, which results in four overlapping paths. This means four repeats of the spraying process.
Save the file in SVG format.
Open the SVG file in Bachin Draw software and move the top left corner edge of the spray area to the origin point of the canvas. The origin is where the two pink lines cross (Figure 19).
Figure 19. Spray path loaded into the CNC control software. The spray path indicated in red is the path drawn by the Inkscape software.Without liquid or gas, press the start button of Bachin Draw to complete the full path defined by the SVG file. During the mock spraying process, find and remove obstacles blocking the path of the spray head, the capillary, and the gas tube. Also, check if the gas tube touches the aluminum foil or creates too much strain on the 1/16″ × .020″ tubing of the sprayer head. Avoid these by adjusting the length of the nylon tube or the location of the lab stand or by creating rotational strain on the tube by twisting. For creating the rotational strain, unscrew the hex nut holding the nylon tube, twist the tube, and tightly screw the hex nut again while holding the twisted tube by hand.
Setting up vacuum desiccator
Cut the 5′ polyurethane rubber tubing into half.
Set the vacuum desiccator inside the hood.
Using the polyurethane rubber tubing, connect the barbed connector on the desiccator to the barbed connector for the vacuum outlet of the safety hood.
Connect the barbed connector for the airflow outlet of the safety hood to polyurethane rubber tubing.
Spraying MALDI matrix
Wear a cuffed sleeve lab coat that fully covers the wrist.
Prepare 20 mL of PNA matrix solution at 5 mg/mL in acetonitrile (Note 2) and put into the 60 mL syringe. For peak alignment, putting one or two internal mass calibrants into the solution is recommended. See Notes 8, 17, and 21.
Put 50 mL of methanol into another 60 mL syringe. Put ~3 mL of air into the syringe.
Prepare a 50 mL tube containing acetonitrile.
Check if the PC communicates to the CNC by pressing the down button of the Bachin Draw software. The CNC should respond by moving the sprayer head (Note 22). Then, press the home button.
Place a plastic cap of a 50 mL tube under the nozzle of the sprayer head.
Input the width of the syringe and the flowrate into the syringe pump (i.e., 24.5 mm and 25 mL/h for the 60 mL syringe).
Connect the methanol wash syringe to the sprayer head through the capillary.
Purge the capillary with ~1 mL of the wash solution by manually pushing the plunger.
Empty the capillary by putting air from the wash syringe.
Remove the Luer adapter and the capillary from the wash syringe (non-syringe components of Figure 14) and connect them to the syringe holding the matrix solution.
Mount the syringe for the matrix solution onto the syringe pump.
Disconnect the gas line from the 1/4″ to 1/16″ connector by unscrewing the hex nut of the gas line. Purge the gas circuit of the sprayer head by pipetting 2 mL of the acetone solution into the opening of the 1/4″ to 1/16″ connector (Figure 20). Remove the solvent in the tube by pipetting air through the tube. Connect the gas line back into the connector again. Avoid bending the 1/16″ tube in the process.
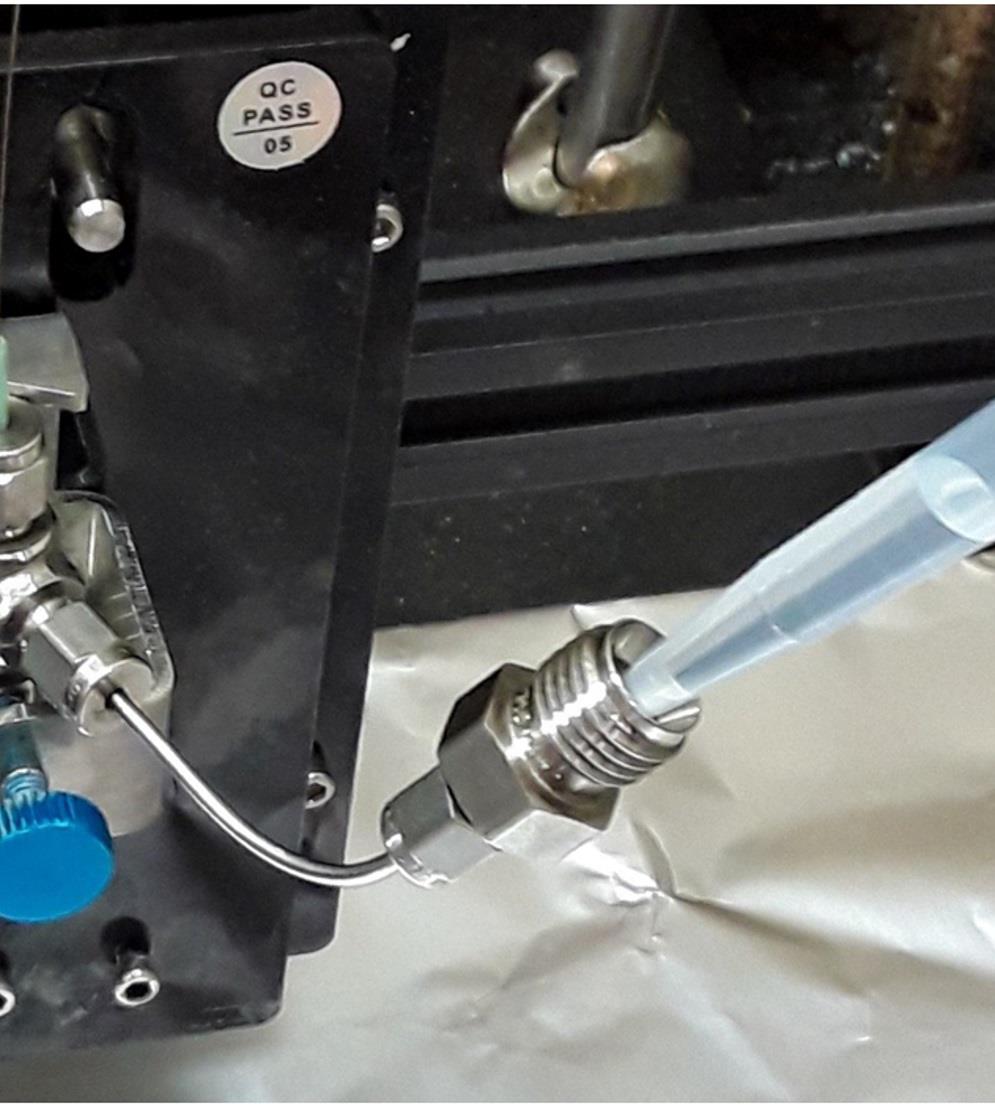
Figure 20. Cleaning of the sprayer head for removing solid residue in the sprayerIn Bachin draw, open the appropriate SVG file defining the spray area for the target plate(s). At 25 mL/h flow rate, files with 4 sweeps should be selected. Make sure the top-left corner edge of the draw path is placed at the origin point.
Place the target plate(s) inside the spray area on the aluminum foil.
Close the stash of the chemical safety hood as much as possible.
Turn on the nitrogen gas line for the sprayer head.
Turn on the syringe pump.
Wait 30 s.
Check if the spray is started by appearance of the spray under the spray nozzle (Note 23). Completely shut the stash of the safety hood.
Press the start button on the CNC control software. After checking for 1 min, evacuate from the room.
After spraying, open the safety hood minimally and stop the syringe pump first.
Wait 30 s and close the nitrogen gas line.
Wait 10 min for the target plate to dry and for the aerosols from the spray to fully disappear.
Connect the capillary to the wash syringe and purge the capillary with ~1 mL of methanol.
Using methanol-soaked Kimwipes, remove the matrix from the fiducial marks on the plates.
Spot 0.5 μL mass calibrant at the fiducial mark near the top left corner of the plates.
Dry the calibrant solution.
Remove the tapes on the target plates and proceed to step B2.
If the MALDI-MS screen is performed on a separate day and if a nitrogen cabinet is available, put the plates in a clean plastic container, seal the box using parafilm-M, and put the box into the cabinet. Wipe the outside of the box with ethanol before putting into the nitrogen cabinet.
Data analysis
(A video walkthrough for the data analysis is available at the “Submitting data analysis” and “Opening processed data” section at https://www.youtube.com/watch?v=OckpuZsUfSg) Using flexAnalysis, confirm that the width of the mass range of the acquired mass spectra is below m/z 1,000. For example, if the acquired mass spectrum ranges from m/z 300 to m/z 1,400, the data file cannot be analyzed by macroMS. Do not manually modify the mass spectra data files including file names.
Compress the mass spectrum data into a zipped folder. It is important to compress the folder containing the individual data files and not compress the individual data files selected by Ctrl + A key. For example, if the path to the folder holding mass spectra data is C:\Data_313\BTE6 such that the path to individual mass spectrum data is C:\Data_313\BTE6\0_0_366.64_152.14_5 and C:\Data_313\BTE6\0_0_902.34_857.42_3, compress the BTE6 folder, not the Data_313 folder or 0_0_366.64_152.14_5_1.0. folder.
Obtain the image file used to generate the target list. Check that the name of the image file is informative enough to identify the sample, since this name will be used as the title for all data outputs. If not, rename it more informatively.
Create a text file containing m/z ranges for up to 10 peaks of interest. In flexAnalysis, load 10 randomly selected mass spectra in overlaid mode. Navigate to a peak of interest, then find two m/z values that can span all the overlaid peaks. Input the values in the text file (Figure 21). The text file is tab-delimited, meaning the tab key must be used to separate the values instead of space bar. Alternatively, cutting and pasting from two columns of Excel spreadsheet results in tab-delimited entries in the text file.
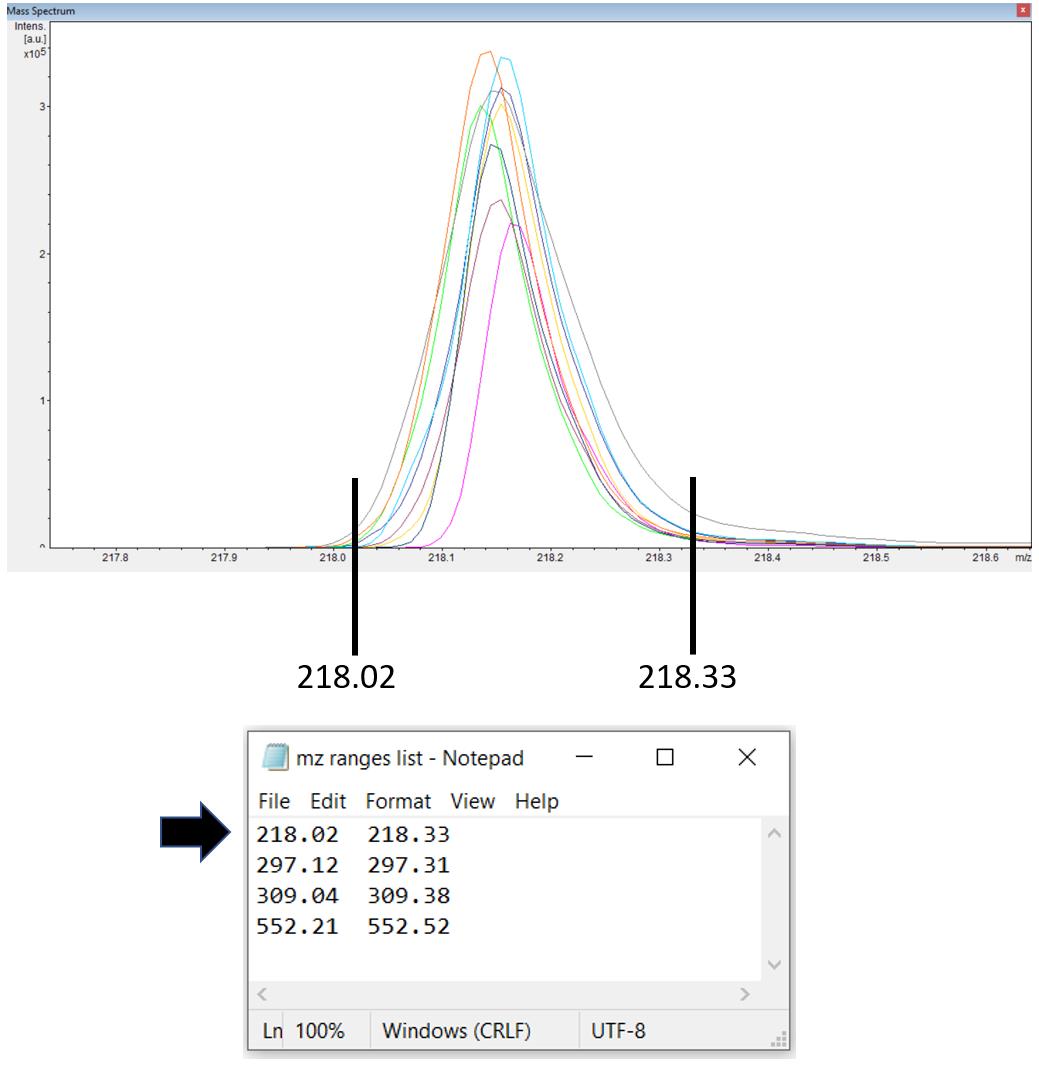
Figure 21. Defining a peak of interest. If a peak of interest appears at approximately 218.17, the m/z range values (218.02 and 218.33) that can contain this peak in all the 10 overlaid mass spectra should be inserted into the text file. In the file, the two values should be separated by a tab key.Optionally, peak alignment can be done by adding exact mass for one or two internal calibrants that were added into the MALDI matrix solution (step D6b). The exact mass for an internal calibrant with adducts can be obtained from the chemical formula using online exact mass calculators such as the tool from sisweb.com. In flexAnalysis, load approximately 10 mass spectra in overlaid mode. Confirm the overlaid peaks corresponding to the internal calibrants appear in the mass spectra. Also, confirm there is no larger peak appearing within m/z 0.5 from the mass calibrants. Put in the exact mass as shown in Figure 22. When peak alignment is used, the format for inputting the mass range for peaks of interest changes as well. The first number is the exact mass for the compound and the second number is 70% of the width of the overlaid peaks, again tab-delimited (Figure 22) (Note 24).
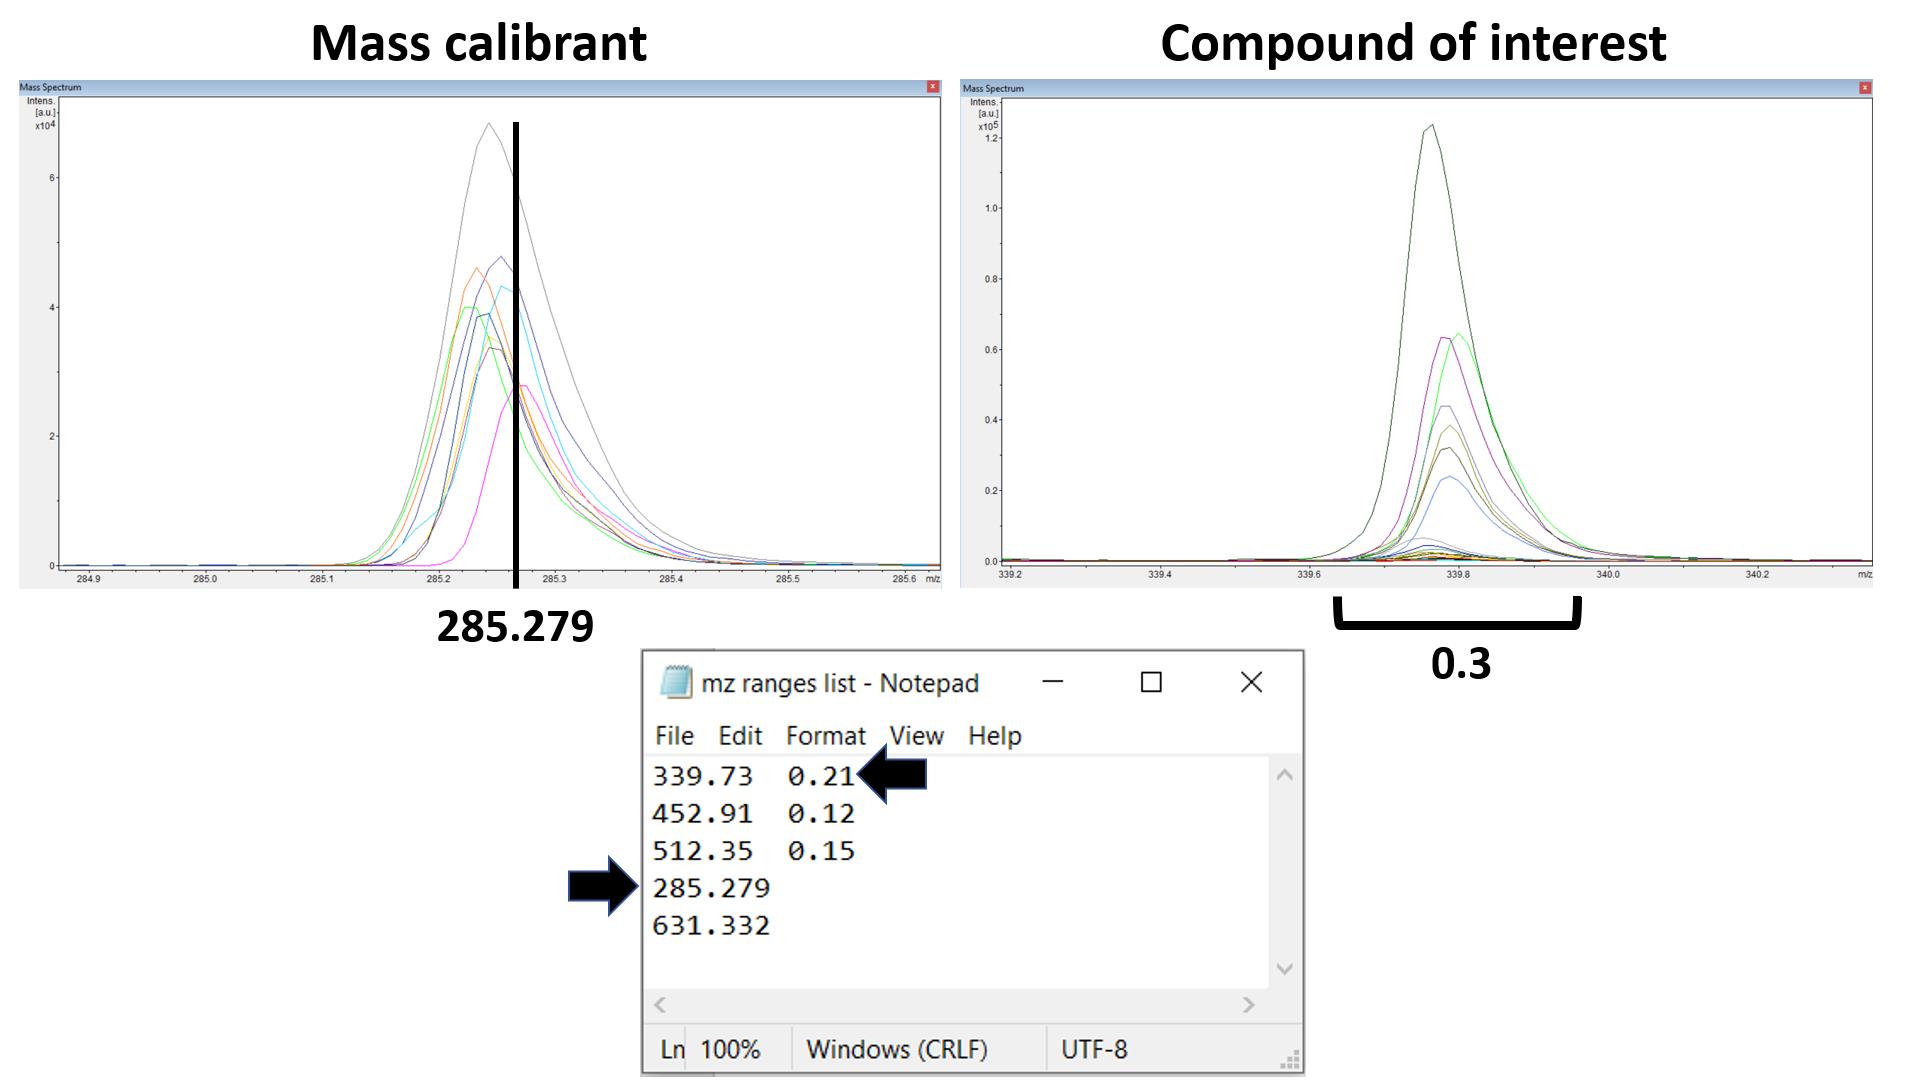
Figure 22. Defining mass calibrant for peak alignment and peaks of interest. To define a mass calibrant, the exact mass of the mass calibrant (285.279 in this case) is put into the text file. To define a peak of interest, the exact mass of the compound with an adduct and the 70% of peak width that spans all 10 overlaid mass spectra (i.e., 339.73 and 0.21) should be inserted. The two values (339.73 and 0.21) should be separated by a tab key.Submit the email address, the zipped data file, the image, and the text file into macroMS using the input fields of the main page. Do not upload multiple files simultaneously from multiple windows or tabs, which can crash the file uploading. The speed of data processing is roughly 3 s per mass spectrum (i.e., 1 h per one colony screen generating 1,200 mass spectra).
Open the email listing data analysis results and save the Excel output file.
Open the Excel spreadsheet that lists ion counts for the peaks of interest (Figure 6B).
For a screen of an enzyme mutant library searching for an isolate with modified ratio between two products, sort samples by the sum of the two peaks and remove the bottom 70% inactive variants.
Add a column that lists the ratio between the two peaks for the remaining samples. Using the larger peak as the denominator for the ratio calculation can reduce the variability caused by signal noise.
Divide the colonies into two equally sized groups by the X coordinate and Y coordinate. Using statistics such as Student’s t-test, check if there is a significant difference in the peak ratios between the groups. If there is a significant difference, options can be multivariate outlier detection (Mahalanobis distance calculation) using the X, Y coordinate and the peak ratio value in Excel, performing outlier detection by the group, or seeing if the change observed in the outlier is bigger than the difference between the group.
Sort the rows by the ratio values of all active variants. Obtain the average and the standard deviation value of all the peak ratios. Find the values that are one or two standard deviations away from the average. For data generated from macroMS circular packing, an extra sheet lists the averaged value per colony. The average of the group should be used for the data processing.
Copy the Blob ID or Group ID for the colonies of interest, open the data visualization map from the email, and put the IDs into the input box. Click Show samples to locate the samples in the image (Figure 6C).
To plot mass spectrum of the peaks of interest for the selected colonies, select the checkboxes for the peak(s) and click Plot selected peak(s). The peaks should be within the greyed area of the shown mass spectra, and the peak intensity should be preferably larger than 4,000 (Figure 6D). Then, the colony can be isolated for downstream tests.
For analysis of MALDI-MS data acquired for regrown isolates (step C1k), load the data in flexAnalysis. Click the checkboxes corresponding to each of the files. Then, highlight all the files in blue by clicking the top file and Shift + clicking the bottom file.
Click the icon button for Find Mass List.
Click the top file and open the window for Mass List.
By Ctrl + clicking, select peak picking results for all compound of interest. If peaks are missing, go to Methods, select Edit Processing Parameters, change Peak Detection Algorithm to Centroid, and run Find Mass List on all the files again.
Copy and paste the data into an Excel file. Likewise, transfer the data for all samples.
Compare the isolates against the control based on the ratio of peak areas using a Student’s t-test or create a scatterplot (Figure 23B) visualizing the change.
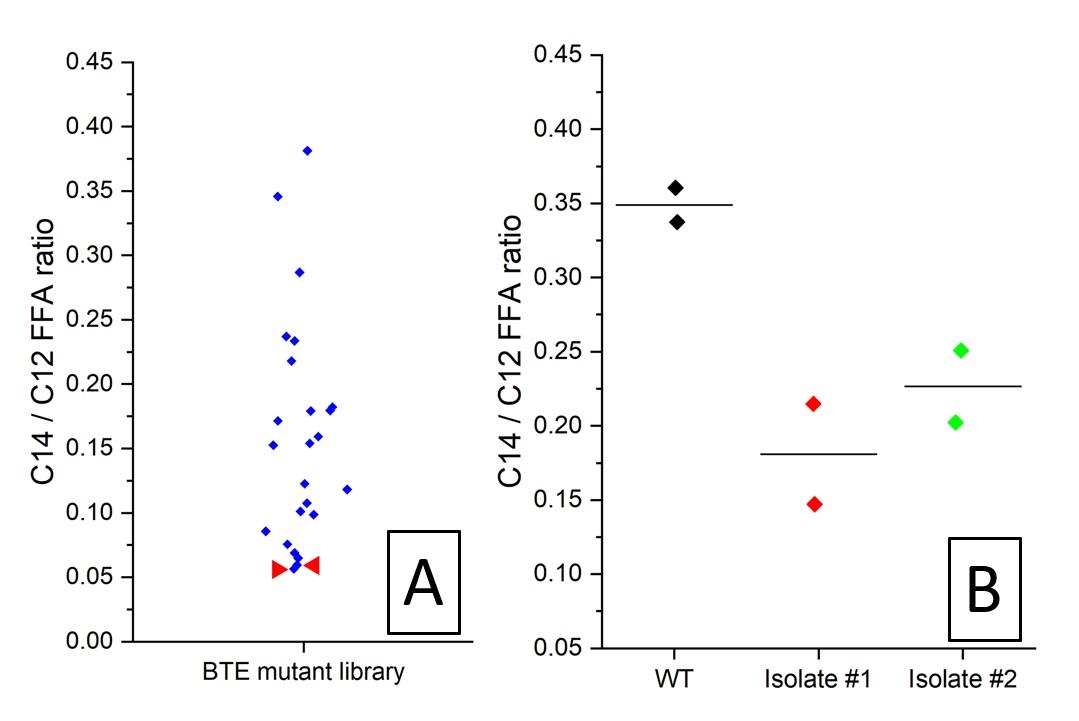
Figure 23. Example datasets for the MALDI-MS screening of E. coli colonies expressing UcFatB2 random library. A. Per colony ratio between C12 free fatty acid and C14 free fatty acid from a MALDI screen, as measured by analyzing imprinted colonies coated with MALDI sprayer. Two colonies (red arrows) showing the lowest C12/C14 FFA ratio were isolated for retest. B. C12/C14 FFA ratio of the regrown isolates and the wildtype control, as measured by analyzing manually spread colonies treated with dried droplet MALDI solution.
Validation of protocol
This protocol was validated by a work modifying substrate specificity of thioesterase (Jindra et al., 2023) and another work modifying regioselectivity of desaturase (Choe et al., 2023).
Notes
From a machine shop facility, build the following metallic target plates (Figure 24) using #8 mirror polished steel (9785K14, McMaster-Carr). Mirror polishing steel surface by manufacturers leaves small but visible lines on the surface, and the angle of cutting the plate should not be diagonal but parallel/perpendicular to these lines. Diagonal lines can cause image artifacts during scanner imaging. The four dots are created by laser etching, and they serve as fiducial points. Alternatively, the following adapter-target pairs also work: 1) HTS MALDI adapter 1.0 mm and HTS MALDI plates and 2) MTP target frame and MTP 384 target plate polished steel. The HTS plate and adapter are highly recommended because the plate mounts to the adapter by magnet, eliminating the need to use copper tapes, a unique serial number written at the bottom-right corner of the plate can eliminate the need to label the plate by pen, its internal fiducial marks are highly visible in the instrument video feed even after matrix spray coating, and taping at the side edges to enable attachment of copper tape is not needed. Use of metallic MALDI target instead of glass ITO slide is recommended for improved sensitivity and better attachment of the E. coli colonies. For ITO slides, the fiducial points can be the corner edge point of the glass or the center of the cross mark created by a glass engraving pen.
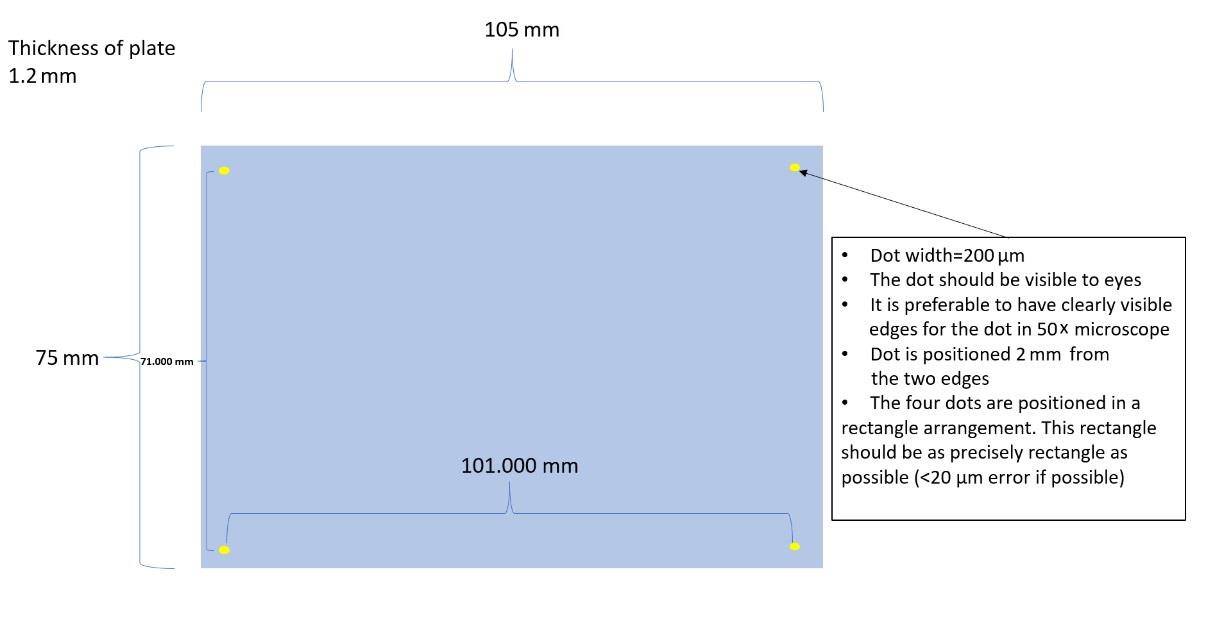
Figure 24. Drawing of the custom MALDI target plateDifferent MALDI matrices result in varying degrees of MALDI sensitivity from the imprinted colonies. While PNA and 1,5-Diaminonaphthalene (DAN) enable measurement of compounds directly from colonies, 2,5-Dihydroxybenzoic acid (DHB) and alpha-Cyano-4-hydroxycinnamic acid (CHCA) may not. For better measurement by DHB and CHCA, use small colonies (~0.5 mm) to reduce sample thickness or measure from the area around the colonies to sample compounds that are spread away from the colonies during the MALDI matrix spraying. In the second case, the density of colonies must be reduced below 250 per MALDI target plate (75 mm × 110 mm) and the offset value of 1 should be used for the circular packing tool of macroMS. Alternatively, DAN with salt could be used as an alternative to DHB or CHCA for positive ionization directly from colonies. Also, always read Material Safety Data Sheet (MSDS) to check if the MALDI matrix and the solvent used for making MALDI matrix solution are toxic (i.e., 9-aminoacridine and acetonitrile) or safer [i.e., DHB, CHCA, and N-(1-naphthyl) ethylenediamine dihydrochloride (NEDC)]. Even if the spraying is performed inside a chemical safety hood, spraying the chemical solution into a fine mist increases risk of exposure. Moreover, while transferring the sample plate to the MALDI-MS instrument, the sample plates should be in a clean container that is held wearing clean gloves. Wearing a respirator may be needed when toxic compounds are involved. Gloves should be changed frequently. For safety, acetone can replace acetonitrile when making MALDI solution. Lastly, avoid nanoparticles and carbon-based matrices (i.e., graphite, graphene, carbon nanotubes, etc.) for large MALDI screens due to their potential impact on the instrument.
Before the colony screen for an enzyme other than this thioesterase, the duration, temperature, and media composition of cell culture method for growing colonies should be decided to improve the product formation of the enzyme activity or the biochemical activity. Plasmids with different copy numbers may be tried. Also, the strain producing improved products while maintaining a good attachment to the MALDI target plate without flaking off should be chosen (i.e., K-12 strain for E. coli). Larger peak area and signal-to-noise ratio in MALDI-MS measurement results in more reliable detection of change in product profile. For E. coli, a starting point can be growing cells on LB plate made from filter sterilized media containing 100 μM IPTG, 100 μg/mL carbenicillin, and 1% glucose for 12 h at 37 °C. Optionally, colonies can form in growth plates first, and then be transferred to an inducing plate for enzyme production (Si et al., 2017). For measuring products from the colonies grown at trial experiments, use a pipette tip to transfer the biomass of the colonies onto a well of MALDI plate and thinly spread it (Figure 11). Spot 1 μL of the MALDI solution for analysis. More accurate test for peak intensity is MALDI-MS analysis of imprinted colonies that are coated with MALDI matrix by the standard spraying procedure. In addition, the workflow works with non-volatile compounds. Check the loss of the compound in the high vacuum environment of the instrument before developing a screen. First, make a mixture of MALDI matrix solution and the standards and spot onto 12 different wells in an MTP 384 plate. When the MALDI target plate is in the high vacuum environment, perform MALDI-MS analysis of the first three wells. Repeat the measurement on a different set of three wells every 30 min. Compare the differences in peak intensity for the standards. For MALDI analysis, use 5,000 laser shots, 1,000 Hz for laser frequency, and complete random walk. Lastly, for relative quantitation of a single compound by the ratio-based colony screen, due to inconsistent compound extraction and ionization that are inherent in the MALDI analysis of colonies, an ideal internal calibrant for the ratio-based screen can be a compound that is produced at the same cellular location where the compound of interest is produced at (i.e., cytoplasm vs. membrane).
The IR thermometer can be used to check the temperature of the cooling agar solution before adding in temperature-sensitive antibiotics. Also, it can be used to check the temperature of the warmed agar plate before seeding with cells.
Using electrocompetent cells grown from richer media such as filter-sterilized LB solution can result in better production of compounds. Minimize the generational gap between the electrocompetent cells and the source strain vials. Also, seeding plates with freshly transformed cells without the overnight culture step can potentially result in better product formation.
The purpose of using parafilm-M is to reduce moisture loss to enable the colony transfer steps. To authors’ experience, increasing the humidity of the cell culture incubator itself resulted in the colonies flaking off from the metal plate when imprinted. Increasing the humidity of colonies by parafilm sealing helped resolve the flaking problem.
If significant flaking happens with E. coli: 1) perform incubation in dryer incubator; 2) for growing colonies, use agar plates that were dried longer than 40 min in the biosafety hood; 3) use smaller colonies (1 mm or less) by decreasing the growth time or increasing colony density; 4) perform deep cleaning of the mirror-polished surface of the MALDI target plate using a plasma cleaner or glow discharge system; 5) consider finding a sticky host strain (Neve et al., 2020) and avoid DH5α; 6) try room-temperature growth of the colonies; 7) add IPTG/arabinose into the growth media to induce protein expression; 8) after step A2i, soak filter paper and colonies with MS-compatible adhesive such as DHB (Jens et al., 2022) and glycerol by setting onto agar gel containing these compounds, and then imprint.
Mass range between the two internal calibrants should include all compounds of interest, and the mass calibrants should not be chosen if the peak for the calibrant appears within 0.5 m/z from a larger peak due to the algorithm used by macroMS peak alignment. Amino acids and odd chain fatty acids at ~1 mg/mL could be used as internal mass calibrants.
Prior to the screen, the MALDI-MS instrument parameters and MALDI matrix should be optimized for sensitivity and peak resolution. Also, the method should be verified for analyte detection. Instrument manuals should be consulted for tuning laser power, laser beam width, number and frequency of laser shots, grid voltage, pulse delay, random walk, polarity of ionization mode, pulsed ion extraction time, accelerating voltage, extraction voltage, lens voltage, reflector voltage, and the choice of reflectron/linear mode. These parameters should be developed based on measuring the compounds of interest from the colonies grown and prepared by the same protocol. Working parameters for ultrafleXtreme include 50% laser power, Ultra laser width, reflectron mode, 4,000 laser shots, and 800 μm complete random walk. For targets generated from macroMS circular packing, 1,500 laser shots with 600 μm complete random walk can be used. Autoflex could be used for the screen workflow analyzing several Petri dishes. There are literature sources introducing MALDI-MS optimization and choosing MALDI matrix (Barwick et al., 2006; Calvano et al., 2018; Leopold et al., 2018). For verification of compound identification, mass spectrum for the colony sample by tandem mass spectrometry (MS/MS) should be compared with the mass spectrum from chemical standard. For strains with inducible production of the compound of interest (i.e., enzyme expression by arabinose induction), compound verification can be helped if the peak appears only in the presence of the inducing agent (i.e., arabinose or IPTG).
If there is a distance between the laser ablation point and the center target mark of the video feed, perform fiducial training using the actual laser ablation point. For example, if the laser ablation point is slightly below the target mark in the video feed, perform fiducial training using the laser target point not the target mark of the video feed (Choe et al., 2021). Additionally, the finalized version of the macroMS software does not use numeric values to label the fiducial points like the case at 1:56 in the YouTube video.
Occasionally, check the MALDI-MS source cleaning is performed well. Without cleaning, the MALDI-MS sensitivity can drop significantly. Click the Status tab in the flexControl software, click Details button, open Processor subsystem tab, and check source cleaning maintenance interval. Check if the value is below 12%–15%. If the value is above this range, check with the instrument administrator if the value is acceptable for MALDI-MS sensitivity.
The following describes setting up an AutoXecute file. On the AutoXecute tab of the main flexControl window, select the AutoXecute method file to open in the dropdown menu and click Edit. In the General tab of the AutoXecute Method editor, select the method file to use. In the Laser tab of the AutoXecute file, turn off the Fuzzy Control. In the Evaluation tab, select none for Use background list. In the Accumulation tab, turn off the Dynamic termination. Click on for the Fuzzy control, type in the desired number of laser shots in the input box for Sum up and Satisfactory shots and click Off for the Fuzzy control. In the Movement tab, check the checkbox for Random walk and put in 50 for Shots at raster spot. In Processing tab, select none for all fields. Click Save button. When the AutoXecute file is saved after the above steps, only the number of laser shots need to be set before the next screen.
An alternative MALDI test for the regrown colonies is macroMS-guided MALDI-MS analysis of imprinted colonies of the isolates prepared by the same spraying procedure and MALDI-MS method that were used for the original library screen. In this case, the colonies of experiment group and the control group should be imprinted using the same filter paper. Another alternative is: 1) pull all colonies from each of the sample into vials of 50 μL of water; 2) thoroughly mix the liquid samples; 3) in triplicates, spot 1.5 μL of the samples at the precise center of a well of MTP 384 target plate; 4) dry the sample by leaving in the room air; 5) apply MALDI matrix by the same spray procedure as the original colony screen; and 6) perform MALDI-MS at > 5,000 laser shots, 800 µm random walk at the center of dried droplet, and 40%~60% laser power. After these methods, perform the same data analysis steps mentioned in the protocol.
For DHB and CHCA matrix that can show reduced MALDI-MS sensitivity of the colonies sample, the spot and transfer extraction method can be used. Using a P2 pipette, spot 1 μL of the matrix solution onto the colony in the MALDI target well, pull the liquid in 1 s after making the contact, and spot onto the second well. MALDI-MS measurement is done on the second well.
For qualitative screen searching for the presence of specific compounds from colonies, MALDI matrix can be sprayed using an airbrush instead of using the spraying station. However, this can result in a reduced throughput in sample preparation and increased variability in sensitivity. Performing step D1b to obtain the connector between the pipe and gas tube is still necessary.
A common size for the female port is 3/8″. In this case, an example piece that can be used is 1/4″ tube OD × 3/8″ ID-18 NPTF male connector.
The capillary should be changed every 1–2 months. Without replacement, the capillary shows reduced mechanical strength resulting in breaking.
The manual for building the CNC machine can be found at the following link: http://www.bachinmaker.com/?p=46&a=view&r=209
It is important not to bend the terminal of the USB cable that is plugged into the USB port of the CNC device; the USB port can be easily destroyed. Stabilize the USB cable by taping the cable onto the bottom surface of the chemical safety hood. Minimize moving the CNC machine.
The vertical and horizontal dimensions of the spray area defined by the files are the following: ALL_AREA-4 Sweeps.svg: 273 mm × 190 mm, PACII-4 Sweeps.svg: 126 mm × 150 mm, TLC-4 Sweeps.svg: 62 mm × 150 mm. The files perform four rounds of spraying.
If chemical derivatization is performed, make 1.5 mL of derivatization solution in a glass vial (i.e., 5 mg/mL fmoc-chloride and 1.5 mg/mL pyridine dissolved in toluene), put into a 1 mL glass syringe, mount the syringe onto the syringe pump, connect the capillary, and perform one sweep of spraying at 10 mL/h. These steps should be done quickly because derivatization agents can start losing reactivity (i.e., 20 min for fmoc-chloride). Immediately after spraying, purge the liquid circuit with 1 mL of methanol (step D6y) and take at least 30 min in step D6x for better disappearance of the aerosols. Then, perform spraying MALDI matrix solution onto samples. For gas-based derivatization such as ozonolysis, uniform mixing of gas in the reaction chamber by applying the gas via a pump may be necessary.
If the CNC machine does not respond even after powering on the machine and connecting to the PC, go to device manager in the control panel, go to Universal Serial Bus controllers, right-click the USB device connected to the CNC machine, and try disabling and enabling the USB device. Trial and error may be needed to find the correct USB device that is linked to the CNC machine. Alternatively, turn off and on both the device and the PC.
If the air turbulence inside the hood is strong enough to visibly disturb the flow of the spray, install a mini plastic cup around the spray nozzle as a protection against the air turbulence. Also, where the spraying is intermittent at approximately 2 s cycle, perform capillary height adjustment and liquid purging (step D2giii, step D6i, and step D6m). Lastly, an alternative method for starting the gas spray would be to 1) start the pump without turning on the nitrogen gas, 2) wait for the appearance of droplets, then 3) start the nitrogen gas.
An alternative method for creating a m/z ranges list with peak alignment is aligning to a single spectrum that shows large peaks for all compounds of interest and mass calibrant. The method is justified when there is a contaminating peak at the shoulder of a target compound; this makes setting the m/z ranges using the standard method extremely difficult. Using flexAnalysis, find a mass spectrum that shows large peaks for all target compounds and calibrants. Next, maximally zoom into the tip of the peak for the mass calibrant and get the X-value where the maximum Y-value appears. Write the X-value into the text file as the mass value for the calibrant. Repeat for the second mass calibrant. For m/z ranges of the compounds of interest, use the m/z ranges (i.e., 521.1 521.3) of the peaks of the spectrum as the input values for the compounds.
Acknowledgments
This work was funded by the Department of Energy Center for Advanced Bioenergy and Bioproducts Innovation (United States Department of Energy, Office of Science, Office of Biological and Environmental Research) under Award No. DE-SC0018420. The instrumentation used was partially supported by the National Institute on Drug Abuse under Award No. P30 DA018310. Any opinions, findings, and conclusions or recommendations expressed in this publication are those of the author(s) and do not necessarily reflect the views of the funding agencies. The protocol is adapted from the validation publication (Jindra et al., 2023). The idea of imprint-transferring agar colonies by a filter paper is adapted from Si et al. (2017).
Competing interests
The authors declare no competing financial interest.
References
Alfaro-Chávez, A. L., Liu, J. W., Porter, J. L., Goldman, A. and Ollis, D. L. (2019). Improving on nature’s shortcomings: evolving a lipase for increased lipolytic activity, expression and thermostability. Protein Eng. Des. Sel. 32(1): 13–24.
- Andersen, M. K., Krossa, S., Høiem, T. S., Buchholz, R., Claes, B. S. R., Balluff, B., Ellis, S. R., Richardsen, E., Bertilsson, H., Heeren, R. M. A., et al. (2020). Simultaneous Detection of Zinc and Its Pathway Metabolites Using MALDI MS Imaging of Prostate Tissue. Anal. Chem. 92(4): 3171–3179.
- Arnold, F. H. (2018). Directed Evolution: Bringing New Chemistry to Life. Angew. Chem. Int. Ed. 57(16): 4143–4148.
- Barwick, V., Langley, J., Mallet, T., Stein, B. and Webb, K. (2006). Best Practice Guide for Generating Mass Spectra. LGC (Teddington) Limited.
- Calvano, C. D., Monopoli, A., Cataldi, T. R. I. and Palmisano, F. (2018). MALDI matrices for low molecular weight compounds: an endless story? Anal. Bioanal. Chem. 410(17): 4015–4038.
- Choe, K., Jindra, M. A., Hubbard, S. C., Pfleger, B. F. and Sweedler, J. V. (2023). MALDI-MS screening of microbial colonies with isomer resolution to select fatty acid desaturase variants. Anal. Biochem. 672: 115169.
- Choe, K., Xue, P., Zhao, H. and Sweedler, J. V. (2021). macroMS: Image-Guided Analysis of Random Objects by Matrix-Assisted Laser Desorption/Ionization Time-of-Flight Mass Spectrometry. J. Am. Soc. Mass Spectrom. 32(5): 1180–1188.
- Comi, T. J., Makurath, M. A., Philip, M. C., Rubakhin, S. S. and Sweedler, J. V. (2017). MALDI MS Guided Liquid Microjunction Extraction for Capillary Electrophoresis–Electrospray Ionization MS Analysis of Single Pancreatic Islet Cells. Anal. Chem. 89(14): 7765–7772.
- Dietrich, J. A., McKee, A. E. and Keasling, J. D. (2010). High-Throughput Metabolic Engineering: Advances in Small-Molecule Screening and Selection. Annu. Rev. Biochem. 79(1): 563–590.
- Fournier, I., Wisztorski, M. and Salzet, M. (2008). Tissue imaging using MALDI-MS: a new frontier of histopathology proteomics. Expert Rev. Proteomics 5(3): 413–424.
- Grove, K. J., Frappier, S. L. and Caprioli, R. M. (2011). Matrix Pre-Coated MALDI MS Targets for Small Molecule Imaging in Tissues. J. Am. Soc. Mass Spectrom. 22(1): 192–195.
- Hankin, J. A., Barkley, R. M. and Murphy, R. C. (2007). Sublimation as a method of matrix application for mass spectrometric imaging. J. Am. Soc. Mass Spectrom. 18(9): 1646–1652.
- Jens, J. N., Breiner, D. J. and Phelan, V. V. (2022). Spray-Based Application of Matrix to Agar-Based Microbial Samples for Reproducible Sample Adherence in MALDI MSI. J. Am. Soc. Mass Spectrom. 33(4): 731–734.
- Jindra, M. A., Choe, K., Chowdhury, R., Kong, R., Ghaffari, S., Sweedler, J. V. and Pfleger, B. F. (2023). Evaluation of strategies to narrow the product chain-length distribution of microbially synthesized free fatty acids. Metab. Eng. 77: 21–31.
- Körfer, G., Novoa, C., Kern, J., Balla, E., Grütering, C., Davari, M. D., Martinez, R., Vojcic, L. and Schwaneberg, U. (2018). Directed evolution of an acid Yersinia mollaretii phytase for broadened activity at neutral pH. Appl. Microbiol. Biotechnol. 102(22): 9607–9620.
- Leopold, J., Popkova, Y., Engel, K. and Schiller, J. (2018). Recent Developments of Useful MALDI Matrices for the Mass Spectrometric Characterization of Lipids. Biomolecules 8(4): 173.
- Liu, C., Van Berkel, G. J., Cox, D. M. and Covey, T. R. (2020). Operational Modes and Speed Considerations of an Acoustic Droplet Dispenser for Mass Spectrometry. Anal. Chem. 92(24): 15818–15826.
- Minges, H., Schnepel, C., Böttcher, D., Weiß, M. S., Sproß, J., Bornscheuer, U. T. and Sewald, N. (2020). Targeted Enzyme Engineering Unveiled Unexpected Patterns of Halogenase Stabilization. ChemCatChem 12(3): 818–831.
- Neve, I. A. A., Sowa, J. N., Lin, C. C., Sivaramakrishnan, P., Herman, C., Ye, Y., Han, L. and Wang, M. C. (2020). Escherichia coli Metabolite Profiling Leads to the Development of an RNA Interference Strain for Caenorhabditis elegans. G3 Genes|Genomes|Genetics 10(1): 189–198.
- Si, T., Li, B., Comi, T. J., Wu, Y., Hu, P., Wu, Y., Min, Y., Mitchell, D. A., Zhao, H., Sweedler, J. V., et al. (2017). Profiling of Microbial Colonies for High-Throughput Engineering of Multistep Enzymatic Reactions via Optically Guided Matrix-Assisted Laser Desorption/Ionization Mass Spectrometry. J. Am. Chem. Soc. 139(36): 12466–12473.
- Simon, R. P., Häbe, T. T., Ries, R., Winter, M., Wang, Y., Fernández-Montalván, A., Bischoff, D., Runge, F., Reindl, W., Luippold, A. H., et al. (2021). Acoustic Ejection Mass Spectrometry: A Fully Automatable Technology for High-Throughput Screening in Drug Discovery. SLAS Discovery 26(8): 961–973.
- Singhal, N., Kumar, M., Kanaujia, P. K. and Virdi, J. S. (2015). MALDI-TOF mass spectrometry: an emerging technology for microbial identification and diagnosis. Front. Microbiol. 6: e00791.
- Turner, N. J. (2009). Directed evolution drives the next generation of biocatalysts. Nat. Chem. Biol. 5(8): 567–573.
- Wang, Y., Xue, P., Cao, M., Yu, T., Lane, S. T. and Zhao, H. (2021). Directed Evolution: Methodologies and Applications. Chem. Rev. 121(20): 12384–12444.
- Ye, H., Gemperline, E., Venkateshwaran, M., Chen, R., Delaux, P. M., Howes-Podoll, M., Ané, J. M. and Li, L. (2013). MALDI mass spectrometry-assisted molecular imaging of metabolites during nitrogen fixation in the Medicago truncatula-Sinorhizobium meliloti symbiosis. Plant J. 75(1): 130–145.
- Zeymer, C. and Hilvert, D. (2018). Directed Evolution of Protein Catalysts. Annu. Rev. Biochem. 87(1): 131–157.
- Zhang, H., Liu, C., Hua, W., Ghislain, L. P., Liu, J., Aschenbrenner, L., Noell, S., Dirico, K. J., Lanyon, L. F., et al. (2021). Acoustic Ejection Mass Spectrometry for High-Throughput Analysis. Anal. Chem. 93(31): 10850–10861.
Supplementary information
The following supporting information can be downloaded here:- ALL_AREA-4 Sweeps.svg
- PACII-4 Sweeps.svg
- TLC-4 Sweeps.svg
Article Information
Copyright
© 2023 The Author(s); This is an open access article under the CC BY-NC license (https://creativecommons.org/licenses/by-nc/4.0/).
How to cite
Choe, K. and Sweedler, J. V. (2023). Workflow for High-throughput Screening of Enzyme Mutant Libraries Using Matrix-assisted Laser Desorption/Ionization Mass Spectrometry Analysis of Escherichia coli Colonies. Bio-protocol 13(21): e4862. DOI: 10.21769/BioProtoc.4862.
Category
Systems Biology > Genomics > Screening
Microbiology > Heterologous expression system > Escherichia coli
Biochemistry > Protein
Do you have any questions about this protocol?
Post your question to gather feedback from the community. We will also invite the authors of this article to respond.