- Protocols

- Articles and Issues
- For Authors
- About
- Become a Reviewer

Microscopy and Plate Reader–based Methods for Monitoring the Interaction of Platelets and Tumor Cells in vitro
(*contributed equally to this work) Published: Vol 13, Iss 20, Oct 20, 2023 DOI: 10.21769/BioProtoc.4856 Views: 2385
Reviewed by: Dipak Kumar PoriaJibin SadasivanEduardo ListikAnonymous reviewer(s)
Advertisement


Protocol Collections
Comprehensive collections of detailed, peer-reviewed protocols focusing on specific topics


Abstract
Platelets and their activation status play an essential role in cancer metastasis. Therefore, the anti-metastatic potential of antiplatelet drugs has been investigated for many years. However, the initial screening of these antiplatelet drugs to determine which agents can inhibit the interactions of platelets and tumor cells is very limited due to reliance upon expensive, time-consuming, and low-throughput animal experiments for screening. In vitro models of the platelet–tumor cell interaction can be a useful tool to rapidly screen multiple antiplatelet drugs and compare their ability to disrupt platelet–tumor cell interactions, while also identifying optimal concentrations to move forward for in vivo validation. Hence, we adopted methods used in platelet activation research to isolate and label platelets before mixing them with tumor cells (MDA-MB-231-RFP cells) in vitro in a static co-culture model. Platelets were isolated from other blood components by centrifugation, followed by fluorescent labeling using the dye CMFDA (CellTrackerTM Green). Labeling platelets allows microscopic observation of the introduced platelets with tumor cells grown in cell culture dishes. These methods have facilitated the study of platelet–tumor cell interactions in tissue culture. Here, we provide details of the methods we have used for platelet isolation from humans and mice and their staining for further interaction with tumor cells by microscopy and plate reader–based quantification. Moreover, we show the utility of this assay by demonstrating decreased platelet–tumor cell interactions in the presence of the T-Prostanoid receptor (TPr) inhibitor ifetroban. The methods described here will aid in the rapid discovery of antiplatelet agents, which have potential as anti-metastatic agents as well.
Key features
• Analysis of platelet–tumor cell binding dynamics.
• In vitro methods developed for measuring platelet–tumor cell binding to enable rapid testing of antiplatelet and other compounds.
• Complementary analysis of platelet–tumor cell binding by imaging and fluorimetry-based readings.
• Representative results screening the effect of the antiplatelet drug, ifetroban, on platelet–tumor cell binding using the protocol.
• Validation results were presented with both a TPr agonist and ifetroban (antagonist).
Graphical overview
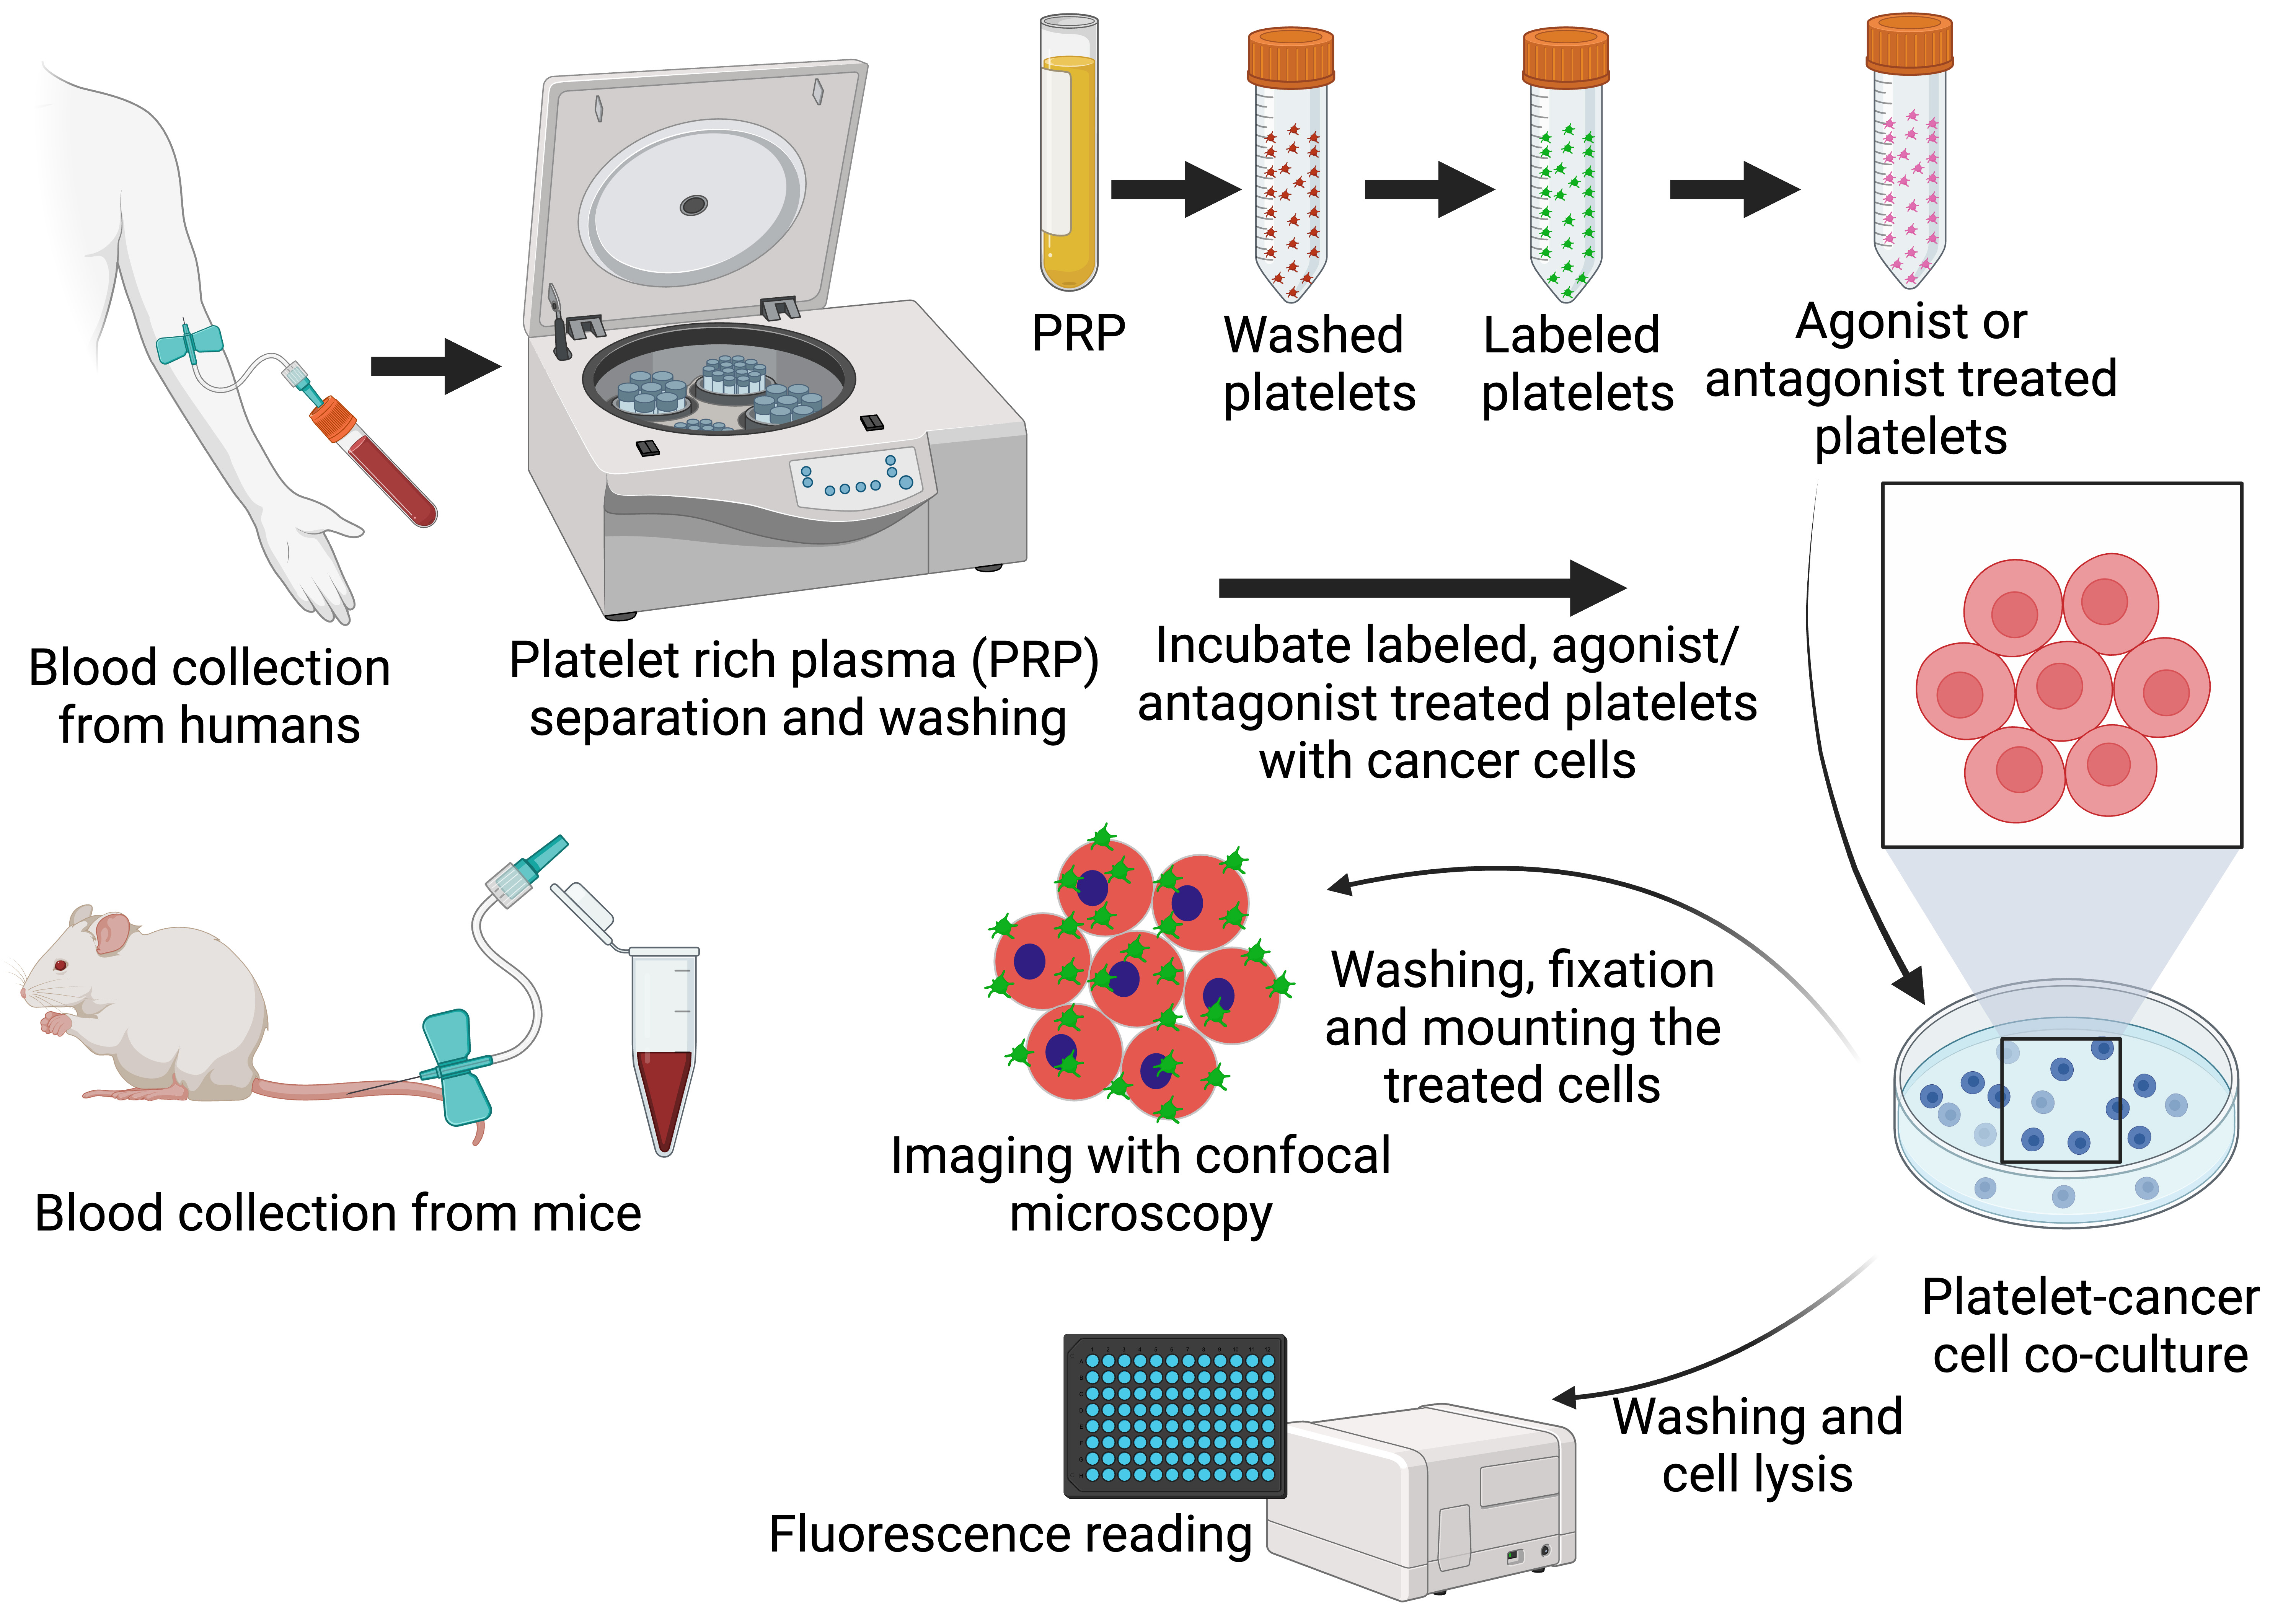
Representative overview of the process to isolate and label platelets, incubate platelets and tumor cells in the presence of antiplatelet agents, and image and/or quantify platelet–tumor cell interactions.
Background
Platelets are well known to play various crucial roles in hemostasis and thrombosis. However, growing evidence suggests that platelets are significantly involved in cancer metastasis as well (Gay and Felding-Habermann, 2011). Further, preclinical and clinical evidence has shown that platelets promote tumorigenesis and metastasis by paracrine interactions with cancer cells (Labelle et al., 2011). Cancer cells change platelet behavior by directly inducing tumor–platelet aggregates and triggering platelet activation (granule and extracellular vesicle release, altered phenotype, etc.). Further, platelet activation has been directly or indirectly linked to the dissemination of cancer cells, cancer cell survival within the circulation, and the extravasation of cancer cells at distant sites of metastasis (Xu et al., 2018). Since platelet activation pathways are likely contributors to cancer growth and metastasis, antiplatelet drugs have immense potential for the treatment of cancer metastasis by inhibiting a myriad of events that drive cancer growth and metastasis (Gay and Felding-Habermann, 2011; Wojtukiewicz et al., 2017; Lucotti et al., 2019; Tao et al., 2021). For instance, we recently discovered single nucleotide polymorphisms in TBXA2R, a gene expressed on platelets, that correlate significantly with metastasis of many solid cancers, including breast, melanoma, colon, and lung (Werfel et al., 2020). Further, we found that both hyperactivated and wild-type TPr (Thomboxane A2-Prostanoid receptor)—the protein encoded by TBXA2R—contribute to cancer metastasis in animal models. The safe and selective inhibitor of TPr, ifetroban, was able to reverse this effect and significantly reduce metastasis of cancer cell lines in the same animal models. However, antiplatelet drug efficacy against platelet–tumor cell interactions is challenging to study in vitro due to difficulties in fully replicating the dynamic and intricate processes that occur in vivo and often requires screening directly in rodent models of metastasis. These rodent studies are expensive, time-consuming, and low-throughput, which is particularly burdensome when a large number of antiplatelet drugs need to be screened. Hence, in order to rapidly screen for agents with anti-metastatic potential through disrupting platelet–tumor cell interactions, we have developed methods for the fluorescent labeling of platelets and the study of platelet–tumor cell interactions in vitro using Red Fluorescent Protein (RFP)-expressing breast cancer cells (RFP-MDA-MB-231). Using these methods, we have carried out studies to quantify the interaction of platelets and tumor cells in culture, alongside other reports also showing that platelets play key roles in the survival and spreading of tumor cells early during the metastatic cascade (Ponert et al., 2018; Lucotti et al., 2019).
Materials and reagents
Bovine serum albumin (BSA) (Sigma-Aldrich, catalog number: A3059)
Coulter counter (Beckman; 50 μM aperture tube, 3–30 fl particles)
CellTrackerTM Green CMFDA Dye (Thermo ScientificTM, catalog number: C7025)
Dextrose (Sigma-Aldrich, catalog number: D9434-250)
DPBS (Ca2+/Mg2+ free) (Gibco, catalog number: 14190359)
Dulbecco’s modified Eagle’s medium (DMEM) (Gibco, catalog number: 11965118)
EDTA (Sigma-Aldrich, catalog number: E5134)
Fetal bovine serum (FBS) (Gibco, catalog number: 26140079)
Calcium-free Hank’s Balanced Salt Solution (HBSS) (Sigma-Aldrich, catalog number: H9394)
HEPES (Sigma-Aldrich, catalog number: H2034)
Hydrochloric acid (Thermo Fisher ScientificTM, catalog number: A466-2)
Ifetroban (Medchem express, catalog number: HY-105218)
Mycoplasma-free MDA-MB-231-RFP cells (Gentarget Inc, catalog number: SC057-Bsd), and other tumor cells/xenografts fluorescent protein–incorporated or later staining in the confocal step models can be tested in a similar way
Paraformaldehyde 16% aqueous solution EM grade (Electron Microscopy Sciences, catalog number: 15710-S)
PBS, pH 7.4 (Thermo Fisher ScientificTM, catalog number: 10010023)
Penicillin-streptomycin (P/S; 10,000 U/mL) (Gibco, catalog number: 15140122)
Potassium chloride (KCl) (Thermo Fisher ScientificTM, catalog number: P217-500)
Prostaglandin E1 (PGE1) (Thermo Fisher ScientificTM, catalog number: P5515)
Sodium citrate (Sigma-Aldrich, catalog number: C8532)
Sodium chloride (NaCl) (MP Biomedicals, catalog number: 194848)
Sodium hydrogen carbonate (NaHCO3) (Sigma-Aldrich, catalog number: S6297-250)
Sodium phosphate monobasic (NaH2PO4) (Sigma-Aldrich, catalog number: 71505-250)
TrypLETM Express (Gibco, catalog number: 12604-021) or 0.05% Trypsin/EDTA (Gibco, catalog number: 15400-054)
U46619 (Cayman Chemicals, catalog number:16450)
Vectashield Antifade Mounting Medium with DAPI (Cole-Parmer®, catalog number: H-1200-10)
Triton-X 100 (Thermo Fisher ScientificTM, catalog number: A16046)
Solutions
Sodium citrate for anticoagulation of blood (see Recipes)
HBSS with EDTA (see Recipes)
DMEM complete media (see Recipes)
Washing buffer for platelets (see Recipes)
Resuspension buffer for platelets (see Recipes)
MTH buffer (see Recipes)
Recipes
Sodium citrate for anticoagulation of blood
Prepare a 3.8% solution of sodium citrate by dissolving 380 mg of sodium citrate in 7 mL of water (ddH2O).
Adjust pH to 7 with concentrated hydrochloric acid.
Add water to a final volume of 10 mL.
Store the solution at 2–8 °C for six months. Allow the solution to reach room temperature before use.
To anticoagulate blood with 0.38% sodium citrate final concentration, add 1 mL of 3.8% sodium citrate solution to 9 mL of whole blood. Adjust the volume of sodium citrate according to the final blood volume.
HBSS with EDTA
Add 250 μL of 1 M EDTA to 50 mL of HBSS and mix well.
Adjust pH to 6.4 with concentrated hydrochloric acid.
Store the solution at 2–8 °C for two weeks. Allow the solution to reach room temperature before use.
DMEM complete media
Remove the 50 mL of plain media from the fresh DMEM bottle in the cell culture hood.
Add 50 mL of heat-inactivated FBS to the DMEM bottle containing 450 mL of plain media.
Add 5 mL of Pen/Strep reagent (100×) to the above mixture and mix it gently.
Washing buffer for platelets
Add 0.1% wt/vol NaHCO3 + 0.1% wt/vol BSA + 1 mM EDTA (Mw = 380.35 g/mol).
Add 10% MTH (Recipe 6) vol/vol in dH2O.
Prepare all of them in ultrapure distilled water.
Sterilize each buffer after preparation using a sterile filter unit inside the cell culture hood.
Resuspension buffer for platelets
Add 0.1% wt/vol NaHCO3 + 0.1% wt/vol BSA.
Add 10% MTH vol/vol in dH2O.
Prepare all of them in ultrapure distilled water.
Sterilize each buffer after preparation using a sterile filter unit inside the cell culture hood.
MTH buffer
Add 134 mM NaCl (Mw = 58.44) + 0.3 mM NaH2PO4·2H2O (Mw = 156.01).
3 mM KCl (Mw = 74.55) + 5 mM HEPES (Mw = 238.3) + 5 mM dextrose (Mw = 180.16) + 2 mM MgCl2 (Mw = 203.3)
Prepare all of them in ultrapure distilled water.
Sterilize each buffer after preparation using a sterile filter unit inside the cell culture hood.
Laboratory supplies
Pipette tips (Gilson, catalog numbers: F167104, F167103, F167101)
Pipettes (Eppendorf, catalog numbers: 3123000012, 3123000020, 3125000109, 3123000055, 3123000063)
1 mL syringe (BD, catalog number: 309628)
10 mL syringe (BD, catalog number: 305959)
50 mL syringe (BD, catalog number: 300865)
0.22 μm syringe filter (Millex®, catalog number: SLGP033RS)
21 G syringe needle (Sarstedt, catalog number: 85.1162)
23 G syringe needle (BD, catalog number: 300800)
27 G syringe needle (BD, catalog number: 302200)
1.5 mL microcentrifuge tubes (Thermo ScientificTM, catalog number: 69715)
2 mL microcentrifuge tubes (Thermo ScientificTM, catalog number: 69720)
15 mL centrifuge tubes (Thermo ScientificTM, catalog number: 339650)
Black 96-well plate (Thermo ScientificTM, catalog number: 229411)
100 mm cell culture dishes (Thermo ScientificTM, catalog number: 150464)
48-well cell culture plate (Thermo ScientificTM, catalog number: 8715064)
Collagen-coated 35 mm dish coverslip (MatTek Corporation, catalog number: NC9125998)
Cell counting chamber slides (Thermo ScientificTM, catalog number: C10314)
Transwell® inserts (Corning, catalog number: 3401)
Round-bottom 10 mL Plastic centrifuge tube (Thermo Fisher ScientificTM, catalog number: 02-689-6, BD VacutainerTM supplier)
EDTA/heparin-coated or Microhematocrit capillary tube (Thermo Fisher ScientificTM, catalog number: 22-362566)
Equipment
-20 °C and -80 °C freezers
Centrifuge with swing-out rotor suitable for 15 mL centrifugation tubes (Eppendorf, model: 5810R)
Liquid nitrogen dewar (Thermo Fisher ScientificTM, catalog number: CY509113)
37 °C incubator (Thermo Fisher ScientificTM, catalog number: FSGPD20)
Mouse restrainer (Braintree Scientific, model: SHORTI STD)
Analytical weighing scale (Mettler Toledo, ME104E and ME204E)
Laminar flow cabinet (Thermo ScientificTM 1300 Series Class II, catalog number: 1323TS)
CO2 cell culture incubator (Thermo Fisher ScientificTM, HERAcell VIOS 160i, catalog number: 51030403)
Benchtop centrifuge (Eppendorf, model: 5810R)
Improved Neubauer cell counting chamber (EMS, catalog number: 68052-16)
LSETM low-speed orbital shaker (CorningTM, catalog number: 6780FP)
Countess II automated cell counter (Invitrogen, Thermo Fisher ScientificTM, catalog number: AMQAX1000)
Brightfield microscope (Thermo Fisher ScientificTM, catalog number: LMI6PH1)
Microhematocrit capillary tubes (Thermo Fisher ScientificTM, catalog number: 22-362574)
Microplate reader (BioTek, model: Synergy H1). Fluorescence intensity details: Top, fluorescein 2.5 pM (0.25 fmol/well 384-well plate); bottom, fluorescein 4 pM (0.4 fmol/well 384-well plate); bandpass = 18 nm (excitation and emission), fluorescein 0.25 pM (0.025 fmol/well 384-well plate); light source: Xenon flash lamp, wavelength range: 230–999 nm, 1 nm increment, bandpass: 4 nm (230–285 nm), 8 nm (> 285 nm) and wavelength range: monochromators: 250–700 nm, detection system: PMT detectors
Confocal microscope (LEICA SP8X, Wetzlar, Germany):
Objectives: HC PL APO CS2 40×/1.10 water
Lasers: 405 Diode (on), 442 diode, WLL (on, 70.00%)
Channels: Green, Gray, Blue, and Red
Laser lines (nm): 405, 442, 491, 554, 472, 491, 667, 670
Optimal settings: Scan mode (xyz), Scan speed (400 Hz), Magnification (40), Immersion (water), Pinhole (77.2 μm) and Emission wavelength (580 nm)
Software
Gen5, 3.05 (BioTek Instrument)
Prism, 9.2.0 (GraphPad)
Confocal microscopy image analysis software (Leica application suite 3.7.6)
Photoshop 21.1 (Adobe)
ImageJ 13.0.6 (imagej.nih.gov/ij/download/)
Procedure
Perform all protocol steps for live platelets at room temperature. Do not put platelets on ice. A Schematic overview of the experimental process is shown in the Graphical overview.
Collection of human blood
Draw 5 mL of venous blood into a 10 mL syringe with a 21 G syringe needle from a consenting adult donor. This should be performed by a competent phlebotomist.
Remove the needle from the syringe and immediately and gently transfer blood into a round-bottom 10 mL centrifuge tube containing 1 mL of 3.2% sodium citrate (see Recipes).
Mix blood with sodium citrate by gently inverting the tube three times.
Collection of mouse blood
Collect 75 μL of blood from the mouse dorsal pedal vein or another venous non-terminal collection site. For blood collection from the pedal vein, place the mouse into a restrainer and puncture the vein with a 23 G and 27 G syringe needle.
Collect the blood by holding an EDTA/heparin-coated capillary tube to the puncture site. Pre-warming the mice using a heated gel pack greatly aids the identification of the pedal vein.
Alternatively, collect 900 μL of blood by cardiac puncture under terminal anesthesia with a 23 G needle and 1 mL syringe. Remove the needle from the syringe and transfer blood immediately to a 2 mL microcentrifuge tube containing 100 μL of 3.2% sodium citrate.
Production of platelet-rich plasma (PRP) from whole blood
Centrifuge whole blood at 350× g for 20 min at room temperature (RT) or 1,300× g for 10 min at 22 °C.
The blood will have separated into two layers: the lower, dark layer of packed red blood cells and the upper yellow layer of PRP. The PRP volume will be approximately 50% of the whole blood volume.
Carefully remove the upper PRP layer and transfer it to a new round-bottom centrifuge tube.
PRP may be used directly in cytometry experiments. Further processing is required to generate washed platelet suspensions.
Platelet separation and washing
Wash platelets by diluting PRP (see Procedure C) with 5 volumes of the HBSS, supplemented with 4 mM EDTA, pH 6.4, or washing buffer (see Recipes).
Centrifuge at 350× g for 20 min at RT or 1,300× g for 10 min at 22 °C.
Wash the platelet pellet gently without resuspending it three times with HBSS (supplemented with 4 mM EDTA, pH 6.4) or wash buffer containing 0.25 μM PGE1.
Washed platelets can be resuspended directly into DMEM complete media (see Recipes) or resuspension buffer (see Recipes) suitable for the experiment.
Count platelets using a coulter counter.
Stain the washed platelets (8 × 10⁵ cells/mL) with CellTrackerTM Green dye (see section E3 below) and readjust the required concentration in resuspension buffer or directly into DMEM complete media (see Recipes).
Examination of platelets and tumor cell interactions by confocal microscopy
Cell revival and maintenance
Recover MDA-MB-231-RFP or other tumor cells from liquid nitrogen and dip the lower half of the vial into the 37 °C water bath or bead bath to thaw.
Do not let the whole content of the vial completely thaw (a small piece of ice should be visible inside the vial), wipe the vial from outside with 70% ethanol, and move to a laminar flow cell culture hood.
Open the vial and add contents into a 15 mL centrifuge tube containing pre-warmed complete media.
Centrifuge the 15 mL centrifuge tube containing cell and DMEM complete media (see Recipes) at 250× g for 5 min at RT.
After centrifugation, wipe the outside of the 15 mL centrifugation tube with 70% ethanol, move to a laminar flow cell culture hood, and decant the media in the liquid discarder without disturbing the cell pellet.
Pipette out the 1 mL fresh DMEM complete media (see Recipes) in the 15 mL centrifuge tube containing the cell pellet and resuspend the cells by slowly inverting the tube. Disperse the cells in a 100 mm dish plate containing 10 mL OF DMEM complete media (see Recipes) and keep the cultured dish plate in a 37 °C, 5% CO2 humidified cell culture incubator.
Replace the media with fresh DMEM complete media every 2–3 days.
Seeding cells into collagen-coated 35 mm dish cover glass
Once the cells reach 80%–90% confluency, remove the media from a 100 mm dish by aspiration.
Wash cells with 2–4 mL of DPBS (Ca2+/Mg2+ free) and remove the solution by aspiration.
Pipette 2–4 mL of pre-warmed 0.05% Trypsin solution into the 100 mm dish and incubate the dish in a 37 °C, 5% CO2 humidified cell culture incubator for 5 min.
Swirl the dish to ensure the solution covers all cells.
Observe the trypsinization process under the microscope at RT.
Once cells are suspended, pipette 6 mL of DMEM complete media to the flask to inhibit trypsin activity.
Transfer the cell suspension into a 15 mL centrifuge tube and centrifuge at 250× g for 5 min to pellet the cells.
Aspirate the media from the tube without disturbing the cell pellet.
Resuspend the cells in 1 mL of complete medium by gently pipetting the cells up and down and count the cells using a cell counting chamber.
Seed cells (4 × 10⁴ cells/dish) immediately into the 35 mm collagen-treated cover glass plates or 48-well glass bottom plates (clear-culture plates) at a density of 3.5 × 10⁴ cells/well in 500 μL of DMEM complete media (see Recipes).
Following the addition of cells, swirl the media in the dish to distribute the cells and place the 35 mm collagen-treated cover glass and 48-well glass bottom plates in a 37 °C, 5% CO2 humidified cell culture incubator.
Platelet staining
Fluorescently label the isolated platelets using CellTrackerTM Green according to the manufacturer’s protocol with slight modifications. Platelets isolated at a concentration of 8 × 10⁵ cells/mL were reconstituted in resuspension buffer.
Prepare the CellTrackerTM Green stock solution (1 mM) by adding the 20 μL of DMSO to a vial containing 50 μg of CellTrackerTM Green.
Prepare the working CellTrackerTM Green solution to 2 μM by diluting it in 1× PBS.
Add 200 μL of working CellTrackerTM Green solution (2 μM) to 1 mL of platelet suspension.
Immediately mix the sample by gentle pipetting and incubate the sample for 10 min at 37 °C.
After incubation, centrifuge the sample at 350× g for 20 min at RT.
Discard the supernatant and wash the pellet with warm PBS or washing buffer thrice by resuspending the pellet in PBS/washing buffer before centrifugation during each wash and after centrifugation. PBS should be discarded without disturbing the pellet.
Resuspend the platelets pellet (6 × 10⁶/100 μL) in the resuspension buffer for treatment.
Treatment with agonist and antagonist
After the labeling, activate the platelets by incubation with an agonist (U46619, 0.3 μM in PBS) and/or antagonist (Ifetroban, 10 μM in PBS) (Table 1).
Table 1. Examples of platelet agonists or antagonists and concentrations for platelet activation
Platelet agonist or antagonist Concentration Incubation temperature Incubation time U46619 0.3 μM 37 °C 15 min ADP 10 μM 37 °C 1 min Thrombin 1 U/mL 37 °C 1 min Collagen 5 μg/mL 37 °C 15 min Ifetroban 10 μM 37 °C 15 min Incubate platelets for 15 min at 37 °C.
After incubation, centrifuge the sample at 350× g for 20 min at RT.
Discard the supernatant and wash the pellet with warm PBS or washing buffer thrice by resuspending the pellet in PBS/washing buffer before centrifugation during each wash and after centrifugation. PBS should be discarded without disturbing the pellet.
Resuspend the platelets pellet (6 × 10⁶/100 μL) in the resuspension buffer or cell culture media (DMEM complete media, see Recipe) for treatment.
Treatment and confocal examination
Observe cell growth in 35 mm collagen-treated cover glass (see step E2k). If the cells are confluent (80%–90%), then add the agonist- or antagonist-treated CellTrackerTM Green-labeled platelets (6 × 10⁶ in 100 μL of DMEM complete media or PBS) (see step E4e).
Incubate the cultures in a 37 °C, 5% CO2 humidified cell culture incubator for another 30 min.
Wash the cells thrice with warm PBS to remove unbound platelets.
Fix the cells with 2% paraformaldehyde (diluted from 16% paraformaldehyde) in PBS for 15 min in a dark room.
Gently wash the cells twice with warm PBS.
Add 0.5 mL of mounting media with DAPI to fix cells and either examine immediately under confocal microscopy or store the slides at 4 °C until further analysis.
Platelet quantification by microplate reader analysis
Repeat steps E5a–E5c.
Lyse platelets bound to tumor cells (see step E5c) with 200 μL of Triton X-100 (10% in PBS) agitated for 5 min.
Transfer cell lysates to black 96-well plates and measure the fluorescence at excitation and emission wavelengths of 485 and 525 nm, respectively, using a microplate reader. Use at least triplicate samples to quantify platelet levels.
Data analysis
Confocal imaging
For the confocal imaging, at least three independent experiments, each of which originated from a different treatment, should be performed, and multiple images should be captured for each experiment.
Capture the images of all corners and center of the culture dishes. Captured images are analyzed with ImageJ software to measure the average fluorescence pixel intensities of green fluorescence in the various treatments (such as in Figure 1A, 1B, 1C, and 1D) (Wu et al., 2013) and processed with the Photoshop software [these will be the analytical regions of interest (ROIs)].
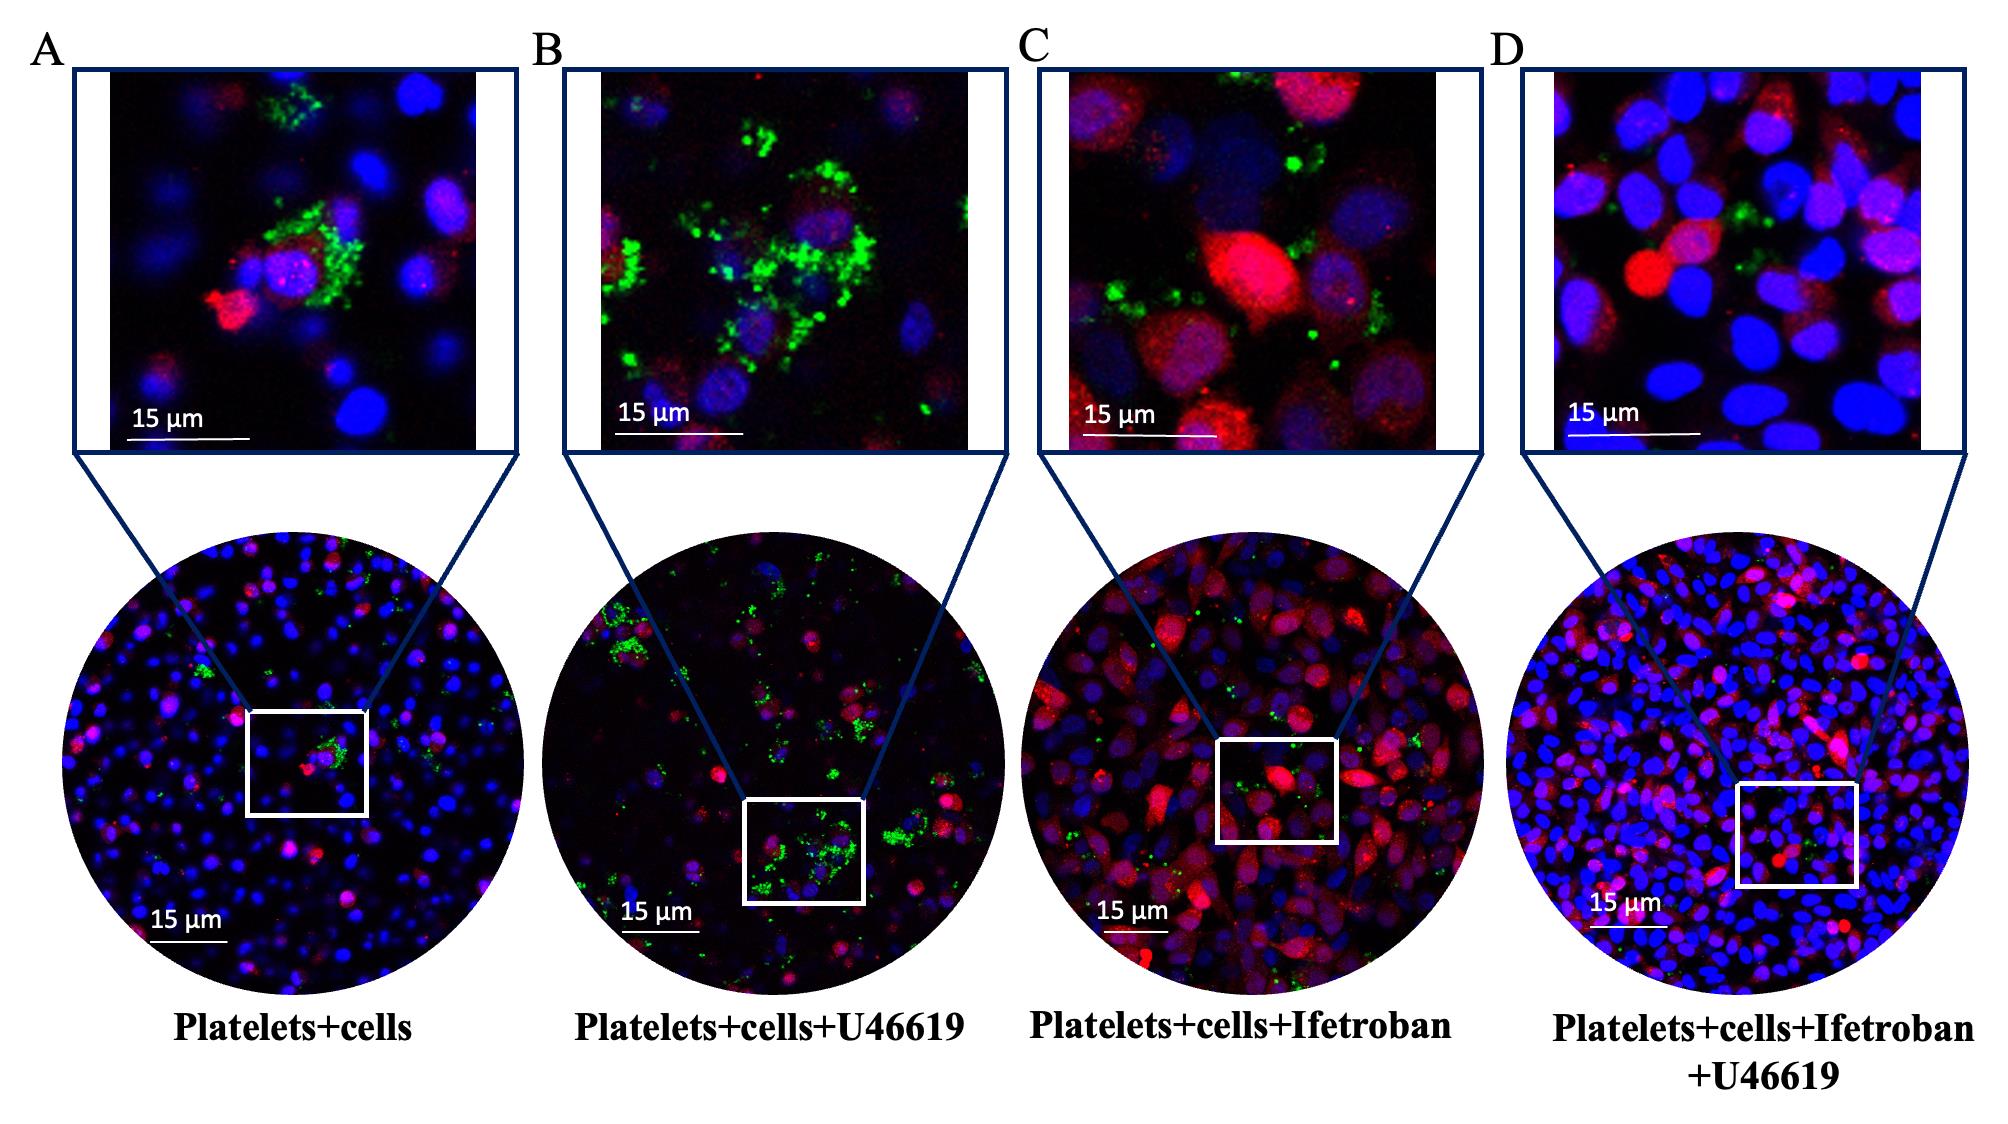
Figure 1. Representative pictures of CellTrackerTM Green–labeled platelets interacting with MDA-MB-231-RFP cells stained with DAPI. CMFDA-labeled platelets (green color), MDA-MB-231 RFP cells (red color), and DAPI (blue color). Representative confocal images control (platelet + tumor cells) (A), thromboxane A receptor agonist, U46619-treated platelet + tumor cells (B), platelet antagonist, Ifetroban-treated platelet + tumor cells (C), and co-treatment of Ifetroban- and U46619-treated platelet + tumor cells (D). Objectives: HC PL APO CS2 40×/1.10 water, scale bar is 15 μm, and the zoom of ROI 5×. ImageJ software is used to measure the average fluorescence intensities per pixel in all the treatments.Fiji (Fiji is just ImageJ) can be downloaded at https://fiji.sc/. Export the raw image data in a format compatible with ImageJ (e.g., tif) from the imaging system and import into ImageJ.
Go to Analyze > Set Measurements and check off the box next to Limit to Threshold. Then use Image > Adjust > Threshold to highlight the area you want to analyze, and then Analyze > Measure will give you intensity measurements in just your thresholded area.
Alternatively, draw a ROI in an area of the image around your object with one of the drawing tools (in the toolbar) and then Analyze > Measure will limit its measurement to that area. Do the same to another image to analyze the same size/shape area.
Export the green fluorescence pixel intensities data to Microsoft Excel. Calculate the mean and standard deviations (n = 3) of data from at least three independent experiments.
Present the data in mean ± SD (n = 3) and analyze the data by one-way ANOVA followed by Tukey’s test using Prism (GraphPad).
Changes in the treatment can be represented with respect to the percentage of control (normalization), where bars with different letters indicate significant (p < 0.05) differences between the groups (Toragall et al., 2023).
The represented confocal image results should be confirmed by examining three independent experiments.
Plate reader fluorometric assay
For the fluorometry assay, collect the green fluorescence reading data (n = 3) from at least three independent experiments, each of which originated from a different treatment from the plate reader.
Calculate the mean and standard deviations (n = 3) using Microsoft Excel from the above recorded data.
Present the data in mean ± SD (n = 3) and analyze the data by one-way ANOVA followed by Tukey’s test using Prism (GraphPad).
Changes in the treatment can be represented with respect to the percentage of control (Figure 2) and represent bars with different letters indicating significant (p < 0.05) differences between the group (Toragall et al., 2023) (Materials and reagents section).
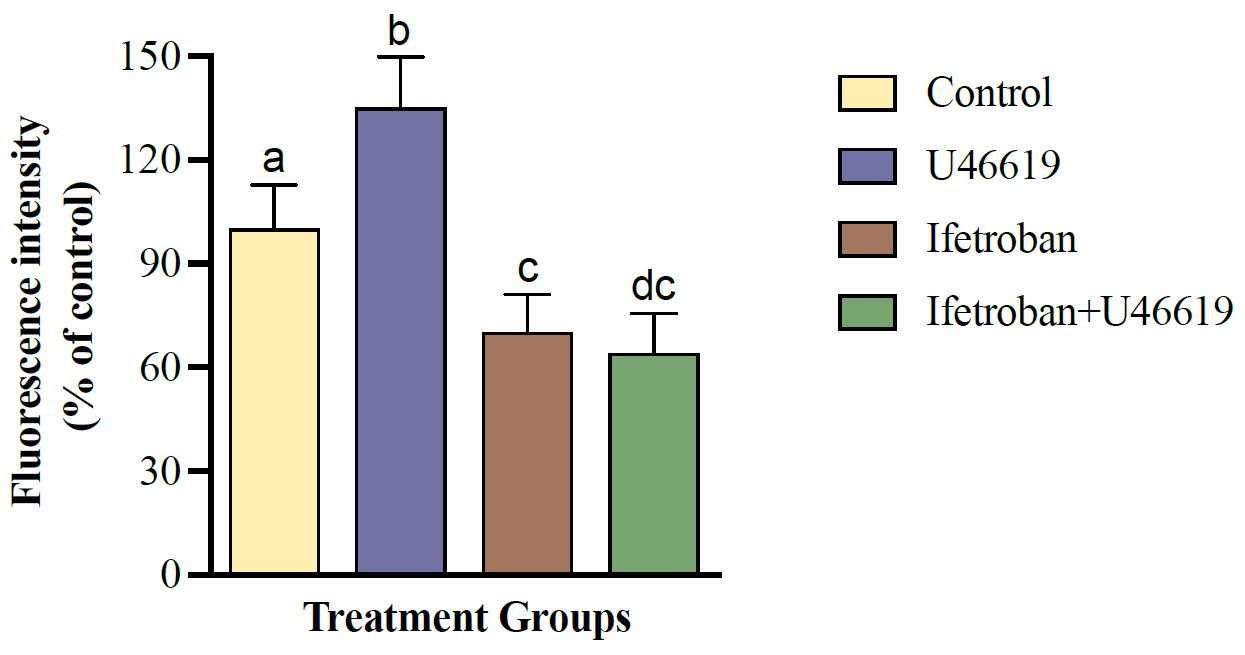
Figure 2. Representative quantification of platelet (CellTrackerTM Green–labeled) and tumor cell (MDA-MB-231-RFP) interactions using a microplate reader. Data are expressed as mean ± SD (n = 3) and analyzed by one-way ANOVA followed by Tukey’s test; bars with different letters indicate significant (p < 0.05) differences between the groups. Changes in the treatment are represented with respect to the percentage of control.
Validation of protocol
The protocol presented here was validated using confocal microscopy to image platelet–tumor cell binding and fluorimetry on a plate reader to measure the overall fluorescence of platelets in platelet–tumor co-culture. Moreover, the utility of these assays to determine changes in platelet–tumor cell binding in the presence of platelet agonists and antagonists was assessed using the TPr agonist U46619 and TPr antagonist Ifetroban. Figure 1 shows confocal microscopy images of RFP-expressing MDA-MB-231 tumor cells in co-culture with platelets that were pre-labeled with CellTrackerTM Green. These images show that platelets have low, but observable, levels of binding to tumor cells under resting conditions (Figure 1A). As expected, platelet binding to tumor cells increases drastically when the TPr agonist U46619 is added to the media (Figure 1B). Since platelet–tumor cell binding was fairly low under basal conditions, the treatment of platelets with TPr antagonist ifetroban had little effect on platelet–tumor cell interactions (Figure 1C). However, pre-treatment of platelets with ifetroban prior to the addition of U46619 completely abrogated the effect of U46619 on platelet–tumor cell binding (Figure 1D), suggesting that ifetroban is effective at limiting TPr-mediated platelet–tumor cell interactions. Next, fluorimetry readings on a microplate reader were used to confirm the imaging results. Again, there was a significant increase in platelet–tumor cell binding in U46619-treated co-cultures (Figure 2), as indicated by increased platelet fluorescence after washing, whereas the fluorescence in co-cultures with ifetroban-pre-treated platelets returned back to control levels. Importantly, the trends observed by plate reader–based fluorimetry matched the relative trends between groups obtained when quantifying confocal images as well (Figure 3). Taken together, these results validate that isolated platelets and tumor cells can be co-cultured, imaged via high-resolution confocal microscopy, quantified for total fluorescence using a microplate reader, and used to rapidly screen the effectiveness of antiplatelet drugs such as ifetroban.
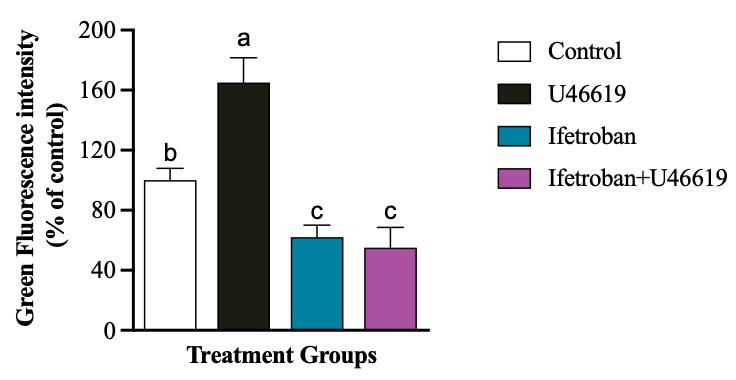
Figure 3. Representative quantification of platelet (CellTrackerTM Green–labeled) and tumor cell (MDA-MB-231-RFP) interactions using confocal images by ImageJ analysis of fluorescence intensities. Data are expressed as mean ± SD (n = 3) and analyzed by one-way ANOVA followed by Tukey’s test. Bars with different letters indicate significant (p < 0.05) differences between the groups. Changes in the treatment are represented with respect to the percentage of control.
General notes and troubleshooting
General notes
There are stopping points at this blood collection steps (sections A and B). The collected blood must be processed immediately for the PRP production. However, once the PRP is separated, it can be stored at room temperature for another 5 days for further experiments.
After the centrifugation, the platelets have pelleted down and supernatants (platelet poor plasma; PPP) are separated and must be recentrifuged to ensure the platelet yield/losses by handling errors (pipetting) (section B)
Ideally, the ratio of blood to sodium citrate (1:10) works well; this is what we have used in the present protocol. However, the ratio may vary with rodent models and geographical location of animals. Hence, we suggest optimizing different citrate ratios before proceeding with actual experiments (section B).
Human blood platelets have been used to label and treat tumor cells throughout the study. However, the steps can be used for mice blood platelets as well. For additional experiments with flow cytometry, 10 μL of PRP (step C3) can be used to verify the platelet activation markers (Burzynski et al., 2019) (section C).
A low level of leukocytes will be present in washed platelets. Repeated rounds of the washing protocol will reduce leukocyte load, but it does not significantly reduce the platelet count (section D).
We have used the resuspension buffer (500 μL, which should be no more than 25% of total complete media in the culture dish) for redissolving the platelet pellet to get a uniform distribution of platelets (homogenous mixture). However, one can use the complete media to dissolve it (there is no volume restriction) (section D).
For the confocal studies, seed the tumor cells in the center of the 35 mm collagen-treated cover glass plates for better examination of tumor cell and platelet interactions. Further, the 96-well clear-bottom plates can be used for the lysate assay with MDA-MB-231 RFP cell seeding density of 8.5 × 10³ cells per well in 200 μL of complete media (section E2).
To avoid the platelet clustering on coverslips, avoid using coverslips that are less than 95% confluent with tumor cells for the confocal microscopy studies, keep an extra control of coverslip treated with only labeled platelets, and image under confocal microscopy (section E2).
While labeling the platelets with fluorescent dyes, make sure to count the platelets (coulter counter) before and after labeling and optimize the different concentration fluorescent dyes to the number of platelets using the plate reader (excitation and emission wavelengths of 485 and 525 nm). Consider the highest number of platelets with higher fluorescence reading for better platelet labeling (section E3).
Platelets are sensitive and should be handled gently to avoid activation. Platelet-rich plasma and washed platelets should be kept at room temperature.
Sodium citrate is the recommended anticoagulant for these protocols, as its chelation of divalent cations is reversible with the addition of CaCl2, allowing for the easy production of serum. These protocols can also be performed using other non-reversible anticoagulants, if necessary (Burzynski et al., 2019).
Repeated washes/centrifugation in case of HBSS (supplemented with 4 mM EDTA, pH 6.4) may lead to activation of platelets; this is reported from the previous publication by Burzynski et al. (2019). However, the use of the PGE-1 with washing buffer can be incorporated to limit activation of platelets during wash steps (Lucotti et al., 2019). Further, the PGE1-containing buffer should only be used after the first wash (section D).
The detection of small fluorescently labeled particles by confocal microscopy (platelets) depends on the respective area of focus. The dish or slide must be scanned thoroughly for many representative portions and the confocal images can be analyzed using ImageJ software for the quantification of bound platelets around the tumor cells. The software is suitable to detect the platelet population and can be used to calculate the percentage of tumor cells covered with platelets.
For additional information related to confocal image processing for fluorescent intensity using ImageJ software, please visit the website below.
https://www.unige.ch/medecine/bioimaging/files/1914/1208/6000/Quantification.pdf
Acknowledgments
This work was funded by American Cancer Society (ACS) grant number: RSG-21-114-01-MM. This protocol was modified from the previous publications Lucotti et al. (2019) and Ponert et al. (2018) and verified by current lab examinations.
Competing interests
The authors declare that they have no conflicts of interest, financial or otherwise.
Ethical considerations
The collection of blood from rodents is approved by the institutional animal care and use committee (IACUC) at the University of Mississippi under protocol #23-007. For the representative studies shown, all human blood was acquired commercially from BioIVT.
References
Burzynski, L. C., Pugh, N. and Clarke, M. C. (2019). Platelet Isolation and Activation Assays. Bio Protoc 9(20): e3405.
- Gay, L. J. and Felding-Habermann, B. (2011). Contribution of platelets to tumour metastasis. Nat. Rev. Cancer 11(2): 123–134.
- Labelle, M., Begum, S. and Hynes, R. O. (2011). Direct Signaling between Platelets and Cancer Cells Induces an Epithelial-Mesenchymal-Like Transition and Promotes Metastasis. Cancer Cell 20(5): 576–590.
- Lucotti, S., Cerutti, C., Soyer, M., Gil-Bernabé, A. M., Gomes, A. L., Allen, P. D., Smart, S., Markelc, B., Watson, K., Armstrong, P. C., et al. (2019). Aspirin blocks formation of metastatic intravascular niches by inhibiting platelet-derived COX-1/thromboxane A2. J. Clin. Invest. 129(5): 1845–1862.
- Ponert, J. M., Schwarz, S., Haschemi, R., Müller, J., Pötzsch, B., Bendas, G. and Schlesinger, M. (2018). The mechanisms how heparin affects the tumor cell induced VEGF and chemokine release from platelets to attenuate the early metastatic niche formation. PLoS One 13(1): e0191303.
- Tao, D. L., Tassi Yunga, S., Williams, C. D. and McCarty, O. J. T. (2021). Aspirin and antiplatelet treatments in cancer. Blood 137(23): 3201–3211.
- Toragall, V., Muzaffar, J. and Baskaran, V. (2023). Lutein loaded double-layered polymer nanocarrier modulate H2O2 and CoCl2 induced oxidative and hypoxia damage and angiogenic markers in ARPE-19 cells. Int. J. Biol. Macromol. 240: 124378.
- Werfel, T. A., Hicks, D. J., Rahman, B., Bendeman, W. E., Duvernay, M. T., Maeng, J. G., Hamm, H., Lavieri, R. R., Joly, M. M., Pulley, J. M., et al. (2020). Repurposing of a Thromboxane Receptor Inhibitor Based on a Novel Role in Metastasis Identified by Phenome-Wide Association Study. Mol. Cancer Ther. 19(12): 2454–2464.
- Wojtukiewicz, M. Z., Sierko, E., Hempel, D., Tucker, S. C. and Honn, K. V. (2017). Platelets and cancer angiogenesis nexus. Cancer and Metastasis Reviews 36(2): 249–262.
- Wu, M. M., Ma, X. G. and He, J. M. (2013). Measurement of Endogenous H2O2 and NO and Cell Viability by Confocal Laser Scanning Microscopy. Bio Protoc 3(19): e920.
- Xu, X. R., Yousef, G. M. and Ni, H. (2018). Cancer and platelet crosstalk: opportunities and challenges for aspirin and other antiplatelet agents. Blood 131(16): 1777–1789.
Article Information
Copyright
© 2023 The Author(s); This is an open access article under the CC BY-NC license (https://creativecommons.org/licenses/by-nc/4.0/).
How to cite
Toragall, V., Hale, E. J., Hulugalla, K. R. and Werfel, T. A. (2023). Microscopy and Plate Reader–based Methods for Monitoring the Interaction of Platelets and Tumor Cells in vitro. Bio-protocol 13(20): e4856. DOI: 10.21769/BioProtoc.4856.
Category
Cancer Biology > Invasion & metastasis > Cell biology assays > Cell isolation and culture
Cell Biology > Cell isolation and culture
Do you have any questions about this protocol?
Post your question to gather feedback from the community. We will also invite the authors of this article to respond.