- Protocols

- Articles and Issues
- For Authors
- About
- Become a Reviewer

Fluorescence Resonance Energy Transfer to Detect Plasma Membrane Perturbations in Giant Plasma Membrane Vesicles
(*contributed equally to this work) Published: Vol 13, Iss 19, Oct 5, 2023 DOI: 10.21769/BioProtoc.4838 Views: 2105
Reviewed by: Alessandro DidonnaAnonymous reviewer(s)
Original research article
The authors used this protocol in:

Jan 2023
Advertisement


Protocol Collections
Comprehensive collections of detailed, peer-reviewed protocols focusing on specific topics


Abstract
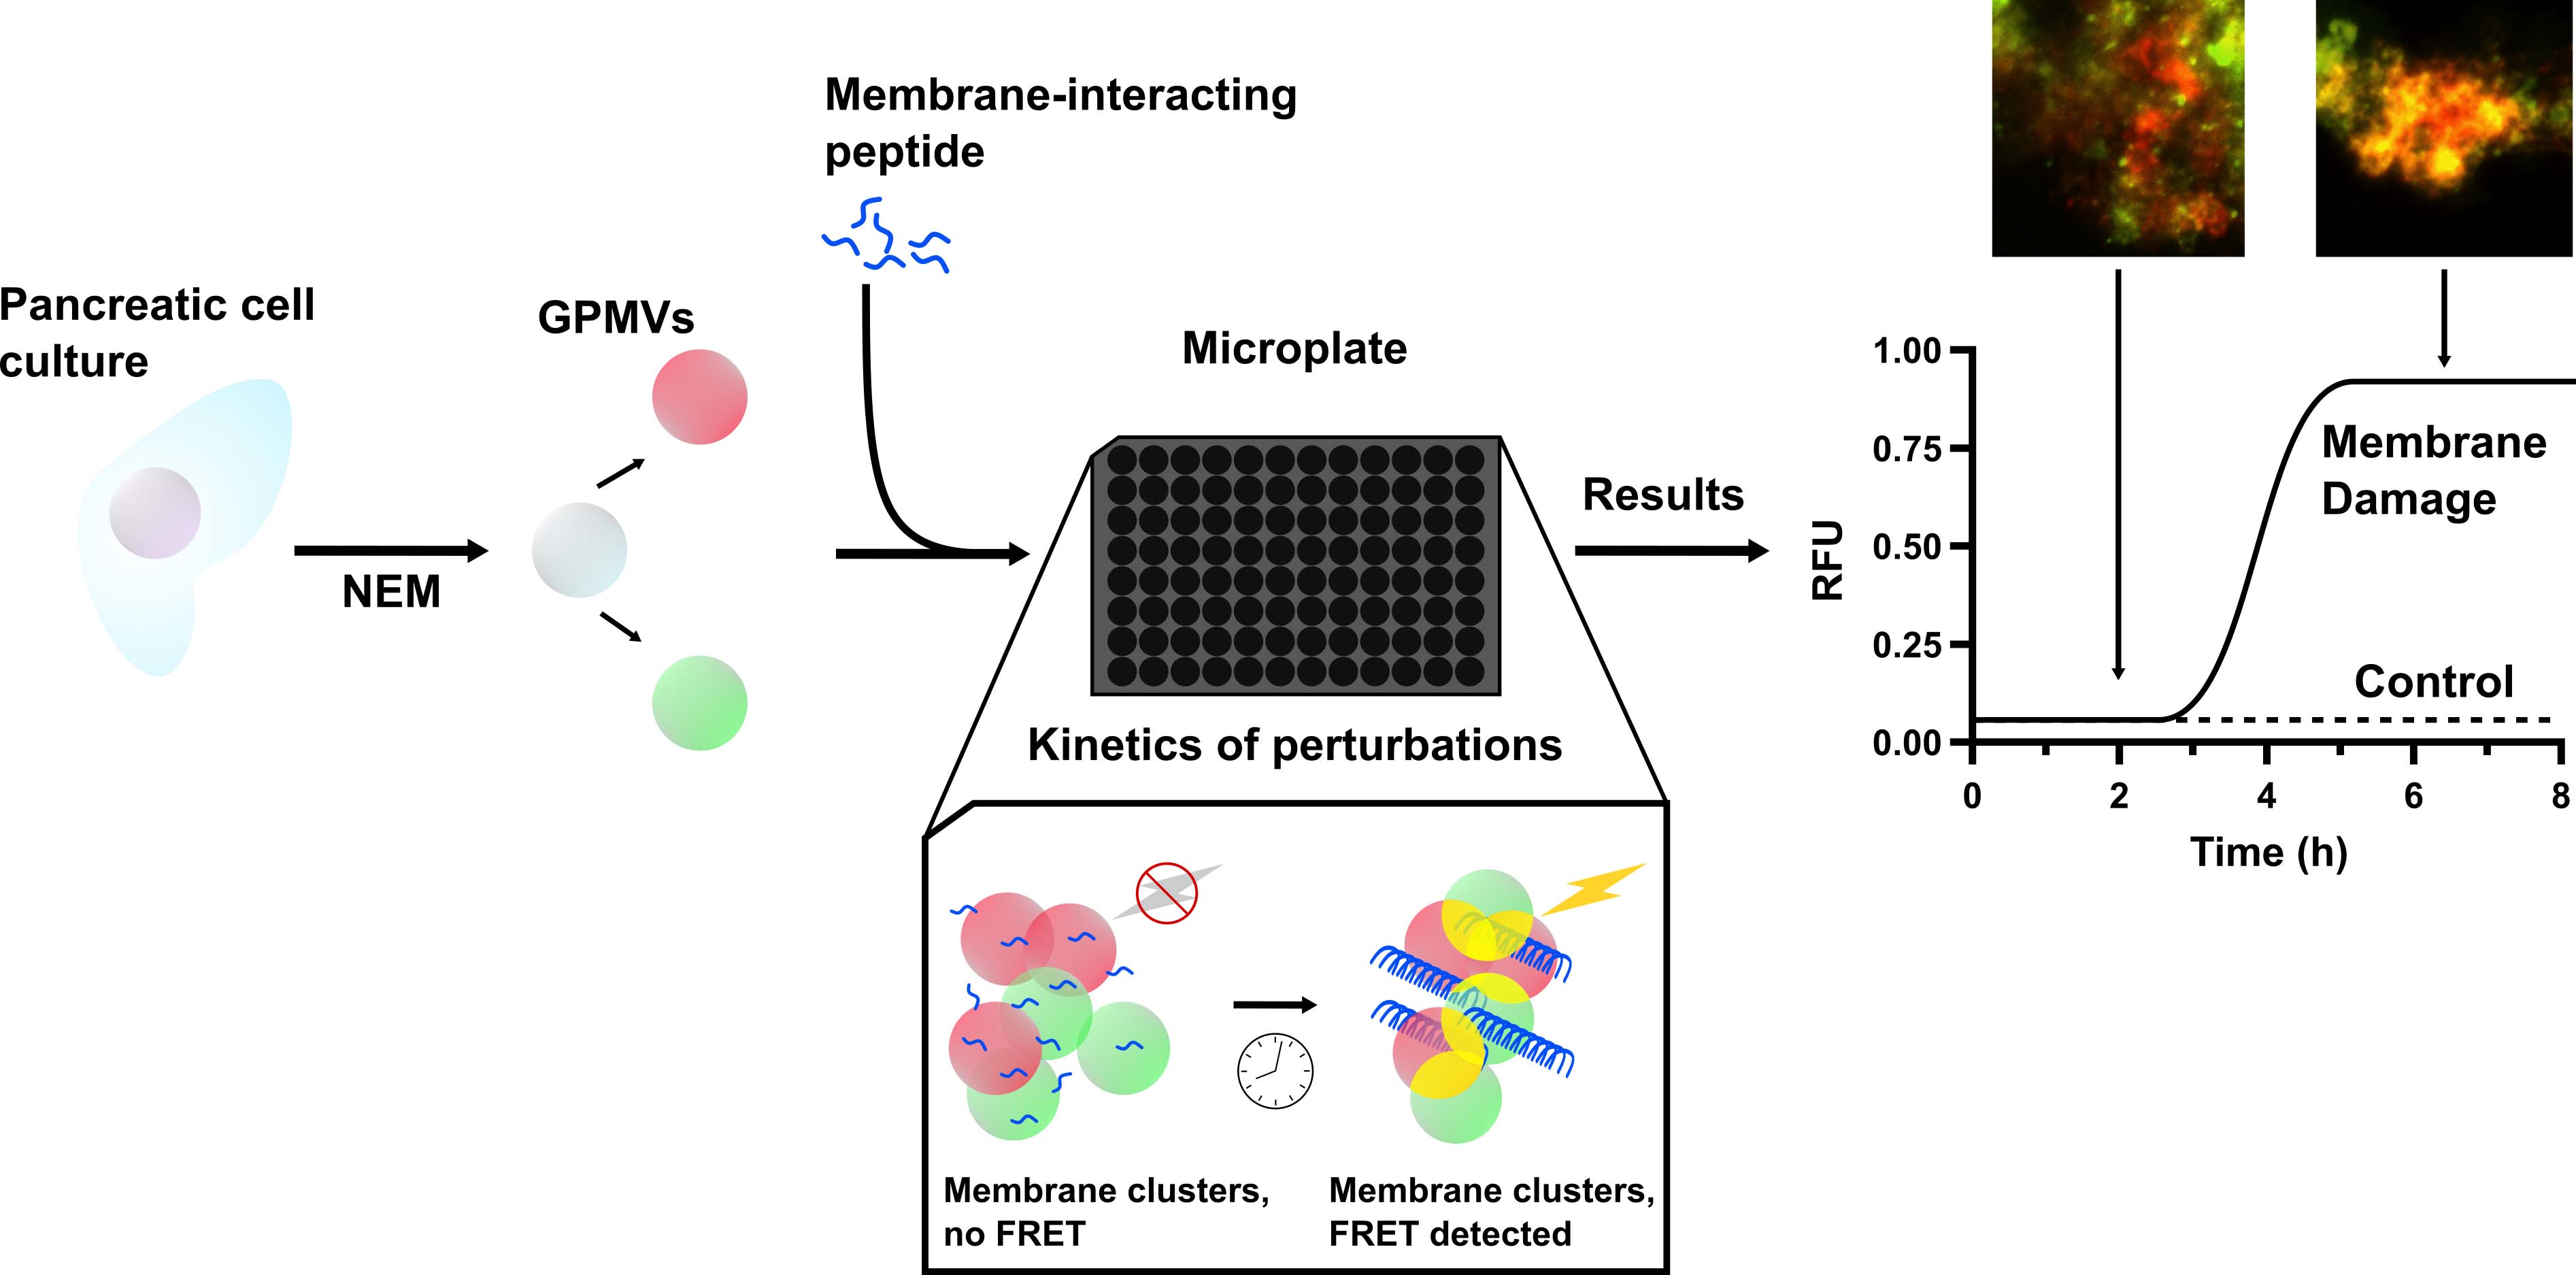
Disruptions and perturbations of the cellular plasma membrane by peptides have garnered significant interest in the elucidation of biological phenomena. Typically, these complex processes are studied using liposomes as model membranes—either by encapsulating a fluorescent dye or by other spectroscopic approaches, such as nuclear magnetic resonance. Despite incorporating physiologically relevant lipids, no synthetic model truly recapitulates the full complexity and molecular diversity of the plasma membrane. Here, biologically representative membrane models, giant plasma membrane vesicles (GPMVs), are prepared from eukaryotic cells by inducing a budding event with a chemical stressor. The GPMVs are then isolated, and bilayers are labelled with fluorescent lipophilic tracers and incubated in a microplate with a membrane-active peptide. As the membranes become damaged and/or aggregate, the resulting fluorescence resonance energy transfer (FRET) between the two tracers increases and is measured periodically in a microplate. This approach offers a particularly useful way to detect perturbations when the membrane complexity is an important variable to consider. Additionally, it provides a way to kinetically detect damage to the plasma membrane, which can be correlated with the kinetics of peptide self-assembly or structural rearrangements.
Key features
• Allows testing of various peptide–membrane interaction conditions (peptide:phospholipid ratio, ionic strength, buffer, etc.) at once.
• Uses intact plasma membrane vesicles that can be prepared from a variety of cell lines.
• Can offer comparable throughput as with traditional synthetic lipid models (e.g., dye-encapsulated liposomes).
Graphical overview
Background
The plasma membrane is a highly dynamic, heterogenous barrier between the intracellular components and the extracellular space ( Harayama and Riezman, 2018; Kalappurakkal et al., 2020). The integrity of this barrier is paramount to maintaining normal cell function and, consequently, a great deal of importance is attributed to understanding the processes by which it is disturbed. In particular, numerous amyloidogenic proteins have been found to interact with and destabilise the plasma membrane (Sciacca et al., 2018). While the biophysics of membrane disruption during amyloid formation are typically studied using synthetic models (e.g., liposomes, lipid monolayers, black lipid membranes), these models fall short of accurately depicting the complexity of plasma membranes (Thakur et al., 2011; Serra-Batiste et al., 2016; Sciacca et al., 2020). In vivo, plasma membranes are composed of not only lipids but also a significant amount of proteins (approximately 50% w/w) and polysaccharides (Kusumi et al., 2012; Harayama and Riezman, 2018). This heterogeneity is difficult, if not impossible, to recreate in a synthetic model, and it is highly probable that the molecular composition of the model system can influence protein aggregation and subsequent disruption of the membrane (Zhang et al., 2017). Prior work has demonstrated that varying the proportions of anionic phospholipids, cholesterol, and gangliosides has dramatic effects on the permeability of liposomes (Song et al., 2014; Sciacca et al., 2016 and 2020). Similarly, an accurate prediction of the cytotoxicity based on membrane damage observed in synthetic models alone remains challenging (Cao et al., 2013).
In several recent studies, giant plasma membrane vesicles (GPMVs) were employed to investigate the biophysics of amyloid-associated membrane damage (Quittot et al., 2021; Birol et al., 2018; Schlamadinger and Miranker, 2014). GPMVs are useful models isolated from different cells, such as HeLa, HepG2, Caco-2, RBL, CHO, or INS using comparable and straightforward protocols (Sezgin et al., 2012; Zartner et al., 2021). Consequently, membrane composition of GPMVs is virtually indistinguishable from the parent cells (K.R. Levental and Levental, 2015), although it must be noted that the relative distribution between the inner and outer phospholipid leaflets—in particular those containing anionic phosphatidylserine head groups—can be altered to a non-negligible extent in the vesicle membranes (Sezgin et al., 2012). These recent approaches are limited, however, in their ability to monitor large numbers of samples in a high-throughput fashion. The protocol described here compensates for the current shortcomings of GPMV-based analyses through the use of a microplate assay, measuring the Förster resonance energy transfer (FRET) between two differently labelled vesicles in a suspension. This allows for an experimental throughput comparable to that of traditional liposomes, such that an entire 96-well microplate can be analysed in a single experiment. While this assay is relatively robust and can detect changes to membranes over time, it is limited in its inability to detect small-scale perturbations. Due to the nature of the FRET response, membranes must be in close proximity and under somewhat static conditions. Additionally, smaller defects such as the formation of transmembrane pores may not be detectable with this method. If evaluating transmembrane pore formation with GPMVs is desired, an elegant protocol was developed by Birolet al. (2018), in which cytoplasmic proteins are fluorescently labelled and whose release can be monitored (Birol et al., 2018). Nonetheless, the following approach proves itself to be a valuable source of biophysical data regarding the relative degree of membrane damage during amyloid formation. Additionally, this approach may also be applicable to other membrane-damaging compounds such as antimicrobial and lytic peptides.
Materials and reagents
Biological materials
Rat INS-1E pancreatic cells (provided as a donation by Dr. Marc Prentki at the Centre hospitalier de l’Université de Montréal. Cells can be sourced from Accegen, catalog number: ABC-TC233S)
Reagents
N-ethylmaleimide (NEM) (Sigma-Aldrich, catalog number: E3876)
Human islet amyloid polypeptide (IAPP) (synthesised in-house, can be ordered from Genscript, catalog number: RP11278)
KCNTATCATQRLANFLVHSSNNFGAILSSTNVGSNTY-NH2
Note: Disulfide bridge between C2–C7.
Rat islet amyloid polypeptide (rIAPP) (synthesised in-house, can be ordered from Genscript, catalog number: RP11280)
KCNTATCATQRLANFLVRSSNNLGPVLPPTNVGSNTY-NH2
Note: Disulfide bridge between C2–C7.
Ammonium molybdate (Sigma-Aldrich, catalog number: 277908)
Ascorbic acid (Sigma-Aldrich, catalog number: AX1775)
Phosphorus standard (Sigma-Aldrich, catalog number: P3869)
Sulfuric acid, 98% (H2SO4) (Sigma-Aldrich, catalog number: 258105))
Hydrogen peroxide, 30% (H2O2) (Thermo Fisher, catalog number: 033323-AP)
Sodium chloride (NaCl) (Sigma-Aldrich, catalog number: S9888)
Sodium hydroxide (NaOH) (Sigma Aldrich, catalog number: 221465)
Calcium chloride (CaCl2) (Sigma-Aldrich, catalog number: C4901)
HEPES, free acid (Sigma-Aldrich, catalog number: 391314)
HEPES, 1 M solution (Cytiva, catalog number: SH30237.01)
Sodium pyruvate (Cytiva, catalog number: SH30239.01)
Penicillin-Streptomycin, 100× (Cytiva, catalog number: SV30010)
Fetal bovine serum (FBS) (Cytiva, catalog number: SH30070.03)
RPMI 1640, with L-glutamine (Cytiva, catalog number: SH30027.01)
Hank’s buffered saline solution (HBSS), without calcium, magnesium, and phenol red (Cytiva, catalog number: SH30588.01)
Trypsin 1× with 0.05% EDTA (Wisent, catalog number: 325-042-CL)
β-mercaptoethanol (Sigma-Aldrich, catalog number: M3148)
FAST-DiO (Invitrogen, Thermo Fisher, catalog number: D3898)
FAST-DiI (Invitrogen, Thermo Fisher, catalog number: D7756)
Wash buffer (see Recipes)
1 M sodium hydroxide (NaOH) (see Recipes)
Giant plasma membrane vesicle (GPMV) buffer (see Recipes)
3.5% m/v ammonium molybdate (IV) (see Recipes)
10% m/v ascorbic acid (see Recipes)
Complete growth media (see Recipes)
8.9 N H2SO4 (see Recipes)
1 mg/mL FAST-DiO (see Recipes)
1 mg/mL FAST-DiI (see Recipes)
Recipes
Wash buffer
10 mM HEPES, 150 mM NaCl, 2 mM CaCl2, pH 7.4
In a beaker, add 400 mL of ultrapure (type 1) water.
Dissolve HEPES (1.192 g), NaCl (4.38 g), and CaCl2 (0.111 g).
Using a pH meter, slowly add 1 M NaOH under stirring to bring the pH to 7.4.
Transfer the solution to a 500 mL volumetric flask and add ultrapure (type 1) water to complete the volume.
This solution must be filtered through a 0.2 μm PES bottle filter inside of a laminar flood hood before use.
Store the bottle at 4 °C.
1 M NaOH
Weigh out 4 g of NaOH pellets.
In a beaker, add 75 mL of ultrapure (type 1) water.
Slowly add the NaOH pellets to the water while stirring until completely dissolved.
Transfer the solution to a 100 mL volumetric flask and add more ultrapure (type 1) water to complete the volume.
This solution can be stored in a brown glass bottle at room temperature.
CAUTION: The dissolution of NaOH is highly exothermic. This must be done slowly to avoid boiling. For larger volumes, consider keeping the mixing beaker on ice to avoid excessive heat generation.
GPMV buffer
10 mM HEPES, 150 mM NaCl, 2 mM CaCl2, 2 mM NEM, pH 7.4
In a 50 mL conical tube, add 12.5 mg of NEM.
Fill to the 50 mL line with wash buffer.
Once dissolved, filter this solution through a 0.22 μm syringe tip filter inside of a laminar flow hood before use.
Note: This solution must be prepared fresh each time GPMVs are to be produced, as the NEM is not stable in solution for prolonged duration.
3.5% m/v ammonium molybdate (IV)
In a 100 mL volumetric flask, add 3.5 g of ammonium molybdate (IV).
Add 50 mL of ultrapure (type 1) water and ensure that the solid is completely dissolved.
Fill to the 100 mL line with ultrapure (type 1) water.
Transfer to a brown glass bottle and store at 4 °C.
10% m/v ascorbic acid
In a 100 mL volumetric flask, add 10.0 g of ascorbic acid.
Add 50 mL of nanopure water and ensure that the solid is completely dissolved.
Fill the rest to the 100 mL line with nanopure water.
Transfer to a brown glass bottle and store at 4 °C.
Complete growth media
RPMI 1640, 100 U/mL pen-strep, 10% FBS, 10 mM HEPES, 1 mM sodium pyruvate, 50 mM β-mercaptoethanol
Inside of a laminar flow hood, add the following to a 500 mL bottle of RPMI 1640:
5 mL of penicillin-streptomycin (100×).
50 mL of FBS.
5 mL of HEPES (1 M).
5 mL of sodium pyruvate (100 mM).
1.75 μL of β-mercaptoethanol. CAUTION: β-mercaptoethanol is strongly odorous. Ensure adequate ventilation before using this product.
Store this medium at 4 °C.
Note: Working under aseptic conditions is essential here to avoid contaminating the cell culture.
8.9 N H2SO4
Measure 75.8 mL of nanopure water into a glass bottle.
Slowly add 24.2 mL of concentrated (95%–98%) H2SO4. CAUTION: The dilution of H2SO4 is exothermic and should be done with care. Keep the solution on ice and under constant stirring while slowly adding the acid.
1 mg/mL FAST-DiO
Dissolve 1.0 mg of FAST-DiO with 1.0 mL of DMSO.
Prepare aliquots of this master solution by dispensing 50 μL into separate 0.5 mL microfuge tubes.
Note: This compound is light sensitive, particularly when not incorporated into a lipid bilayer. Minimise exposure to ambient light. Using smaller aliquots minimises the number of freeze/thaw cycles for each aliquot.
1 mg/mL FAST-DiI
Dissolve 1.0 mg of FAST-DiO with 1.0 mL of DMSO.
Prepare aliquots of this master solution by dispensing 50 μL into separate 0.5 mL microfuge tubes.
Note: This compound is light sensitive, particularly when not incorporated into a lipid bilayer. Minimise exposure to ambient light. Using smaller aliquots minimises the number of freeze/thaw cycles for each aliquot.
Laboratory supplies
96-well microplates, black, non-binding surface with clear bottom (Corning, catalog number: 3651)
Silicone microplate covers (Corning, catalog number: 3090)
100 mm tissue culture dishes (Sarstedt, catalog number: 3902)
150 mm tissue culture dishes (Sarstedt, catalog number: 3903)
2 mL serological pipettes (Sarstedt, catalog number: 1252025)
5 mL serological pipettes (Sarstedt, catalog number: 1253025)
10 mL serological pipettes (Sarstedt, catalog number: 1254025)
25 mL serological pipettes (Sarstedt, catalog number: 1685020)
15 mL conical centrifuge tubes (Sarstedt, catalog number: 62.554.100)
50 mL conical centrifuge tubes (Sarstedt, catalog number: 62.547.004)
0.5 mL microfuge tubes (Sarstedt, catalog number: 72.704)
100 kDa centrifugal filter units (Amicon, Millipore, catalog number: UFC910024)
0.2 μm PES bottle filter units (ThermoFisher, catalog number: 569-0020)
10 mL syringes (BD, catalog number: 309604)
0.22 μm syringe filters (Sarstedt, catalog number: 83.1826.001)
16 mm × 150 mm glass reaction tubes (VWR, catalog number: 47729-580)
12 mm × 75 mm glass reaction tubes (VWR, catalog number: 47729-570)
Plastic plugs for 12 mm × 75 mm reaction tubes (VWR, catalog number: 60819-003)
Brown glass bottles (Sigma-Aldrich, catalog number: DWK218062454)
Microplate lids with silicone seal (Corning, catalog number: 07-200-699)
18 G needles (BD precision glide, catalog number: 305195)
Equipment
Plate reader (Molecular Devices, Spectramax i3)
Centrifuge (Thermo, IEC CL30) with swinging bucket rotor (S41*)
Laminar flow hood (VWR Microzone)
Incubator (Thermo, Heracell 150i)
Hot plate (Fisherbrand, Isotemp)
Aluminium heating block (Thermo Fisher, catalog number: 88880136)
pH meter (Fisherbrand, Accumet AE150)
Micropipettes (Gilson Pipetteman P200, catalog number: F144058M)
Vortex mixer (Scientific industries vortex genie-2, catalog number: SI-0236)
Metal bowl or glass beaker, large enough to contain a test tube rack and capable of being heated at 100 °C. Can be replaced for a water bath if one is available
Software and datasets
Prism 8 (GraphPad)
Excel, Office 16 (Microsoft)
Procedure
Cell culture
Retrieve one aliquot of 106 INS-1E cells from liquid nitrogen storage and thaw them slowly at room temperature. Once the cells have warmed enough to be safely handled, the tube can be further warmed by rolling it back and forth between the hands. CAUTION: Liquid nitrogen is cold enough to cause skin damage in cases of prolonged contact. Wear appropriate PPE when handling liquid nitrogen.
Once thawed, work under a laminar flow hood and maintain aseptic conditions. Transfer the cells to a 15 mL conical tube and add 10 mL of growth medium, pre-warmed to 37 °C. Centrifuge the cells at 500× g for 5 min at room temperature and remove the supernatant.
Resuspend the 106 cells in 10 mL of 37 °C complete growth medium and transfer to a 100 mm tissue culture dish. Store the culture dish inside of the incubator at 37 °C with 5% CO2.
After two days, passage the cells:
Remove the old growth medium and rinse with 2 × 5 mL of 37 °C HBSS.
After removing the HBSS, add 2 mL of 37 °C trypsin and incubate the cells for 5 min at 37 °C.
Retrieve the cells and inactivate the trypsin with 5 mL of 37 °C growth medium.
Collect the cells in a 15 mL conical tube and centrifuge at 500× g for 5 min at room temperature.
Discard the supernatant and resuspend the cell pellet in 10 mL of 37 °C growth media.
Transfer the cells to a new tissue culture dish and return them to the incubator.
Check on the cells daily until 80% confluency is reached and passage again.
After three passages, evenly split the cells (15 × 106 cells) into two 100 mm culture dishes.
After two days, check the confluency. If the cells are below 80% confluency, wait another day.
Once the cells have reached ≥ 80% confluency (≥ 15 × 106 cells), transfer the cells from one 100 mm culture dish into a 150 mm culture dish. Split the second culture dish into two 100 mm culture dishes (7.5 × 10⁶ cells each).
One dish serves as a reserve for continuing the culture growth, and the other serves as a source of cells to produce GPMVs. Maintain these as normal in the incubator, changing the medium and splitting the cells as necessary.
Allow the cells in the 150 mm culture dish to reach ≥ 80% confluency (≥ 33 × 106 cells) and split them evenly into two 150 mm culture dishes. These two 150 mm culture dishes will be used to produce GPMVs in the next steps. Maintain these two 150 mm culture dishes in the incubator at 37 °C with 5% CO2.
This process is graphically summarised in Figure 1.
Note: Working under aseptic conditions is essential here to avoid contaminating the cell culture.
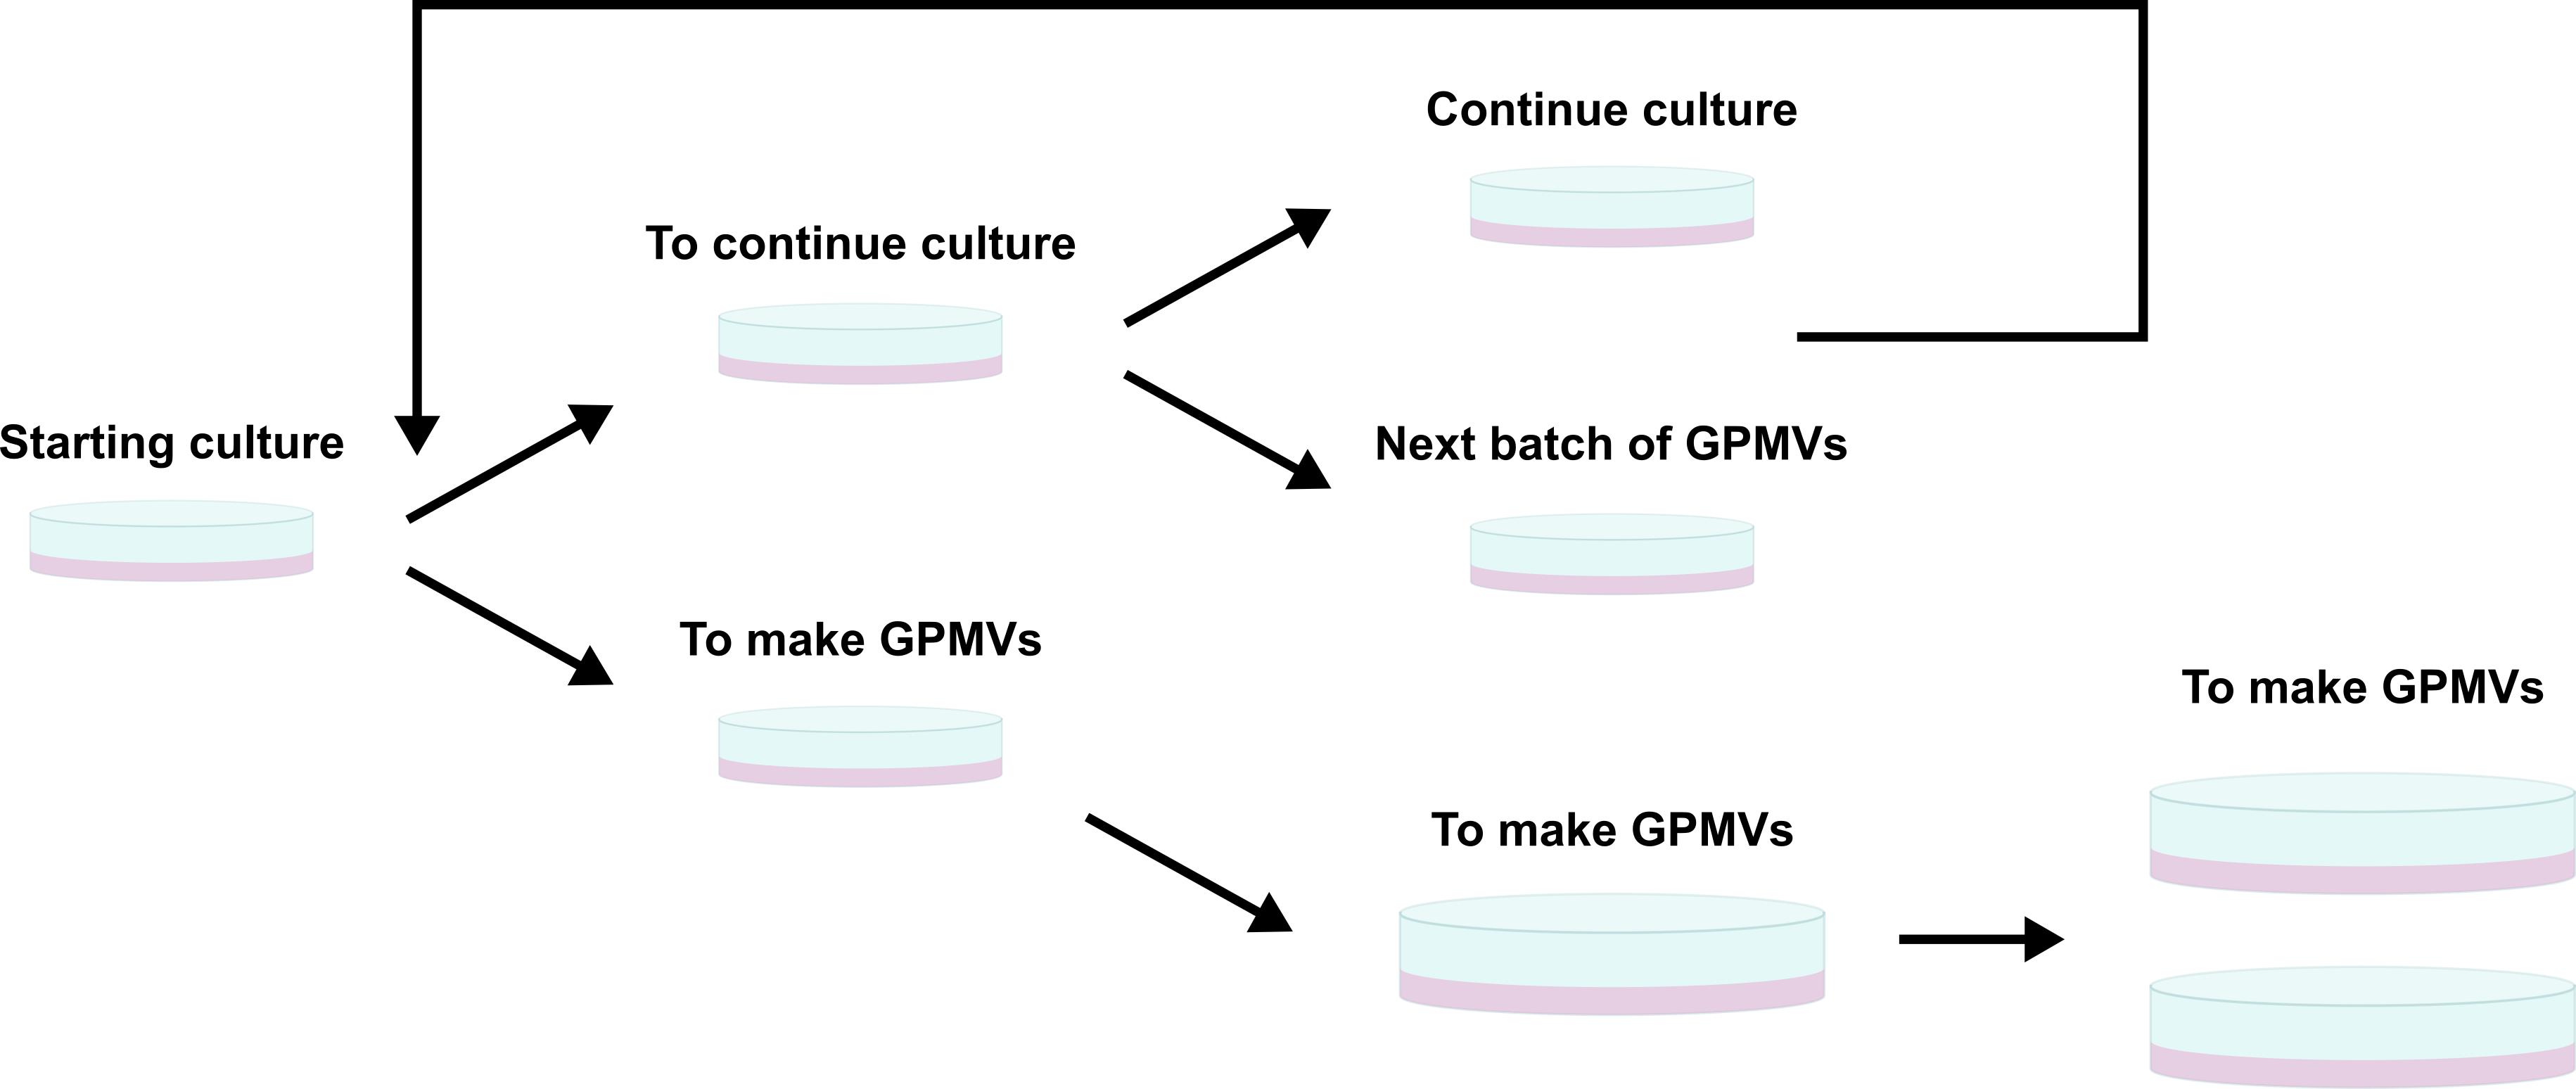
Figure 1. Schematic representation of cell culture and splitting to prepare cells for giant plasma membrane vesicles (GPMVs) production
GPMV formation
Retrieve the two 150 mm culture dishes from the incubator once they reach 80% confluency (33 × 106 cells). Discard the old growth medium and wash the cells twice with 10 mL of 37 °C HBSS.
Discard the HBSS and wash the cells twice with 10 mL of 37 °C wash buffer.
Discard the wash buffer and add 5 mL of 37 °C GPMV buffer to the cells.
Note: The GPMV buffer must be prepared fresh before each use, as the NEM is unstable in solution for prolonged periods of time. NEM was chosen as the GPMV-inducing agent due to its potent ability to induce GPMV formation and its low impact on peptide aggregation. Unlike other GPMV-inducing agents, NEM does not crosslink proteins but rather alkylates free cysteines (Scott, 1976; Erdinc Sezgin, 2022; I. Levental et al., 2010; K. R. Levental and Levental, 2015).
Incubate the cells in the GPMV buffer for 2 h at 37 °C with 5% CO2.
Retrieve the two 150 mm culture dishes from the incubator and carefully collect the liquid above the cells containing the GPMVs in one 15 mL conical tube per culture dish.
Centrifuge the GPMVs at 500× g for 5 min at room temperature to pellet any cell debris. Transfer the supernatant containing the GPMVs to two empty 15 mL conical tubes.
GPMVs labelling
To one 15 mL conical tube with the GPMVs, add 5 μL of the FAST-DiO solution (1 mg/mL) for a final concentration of 1 μg/mL and gently rock the tube back and forth for 10 s to mix it. To the second tube, add 2 μL of FAST-DiI solution (1 mg/mL) for a final concentration of 0.4 μg/mL and rock the tube back and forth gently for 10 s to mix.
Note: FAST-DiO and FAST-DiI stock solutions are light sensitive. To avoid degradation of the fluorophores, work in a dimly lit environment.
Incubate the GPMVs for 1 h at 37 °C to complete the labelling.
Recover the two tubes from the incubator and transfer the contents of each tube to a 100 kD Amicon centrifugal filter unit to concentrate the GPMVs and to reduce the amount of any unincorporated tracers.
Centrifuge the Amicon units at 400× g for 1 min and verify the volume remaining in the filter unit, ensuring that the entire volume does not pass through. Repeat these short centrifugations until 500 μL remain in each unit.
This process is graphically summarised in Figure 2.
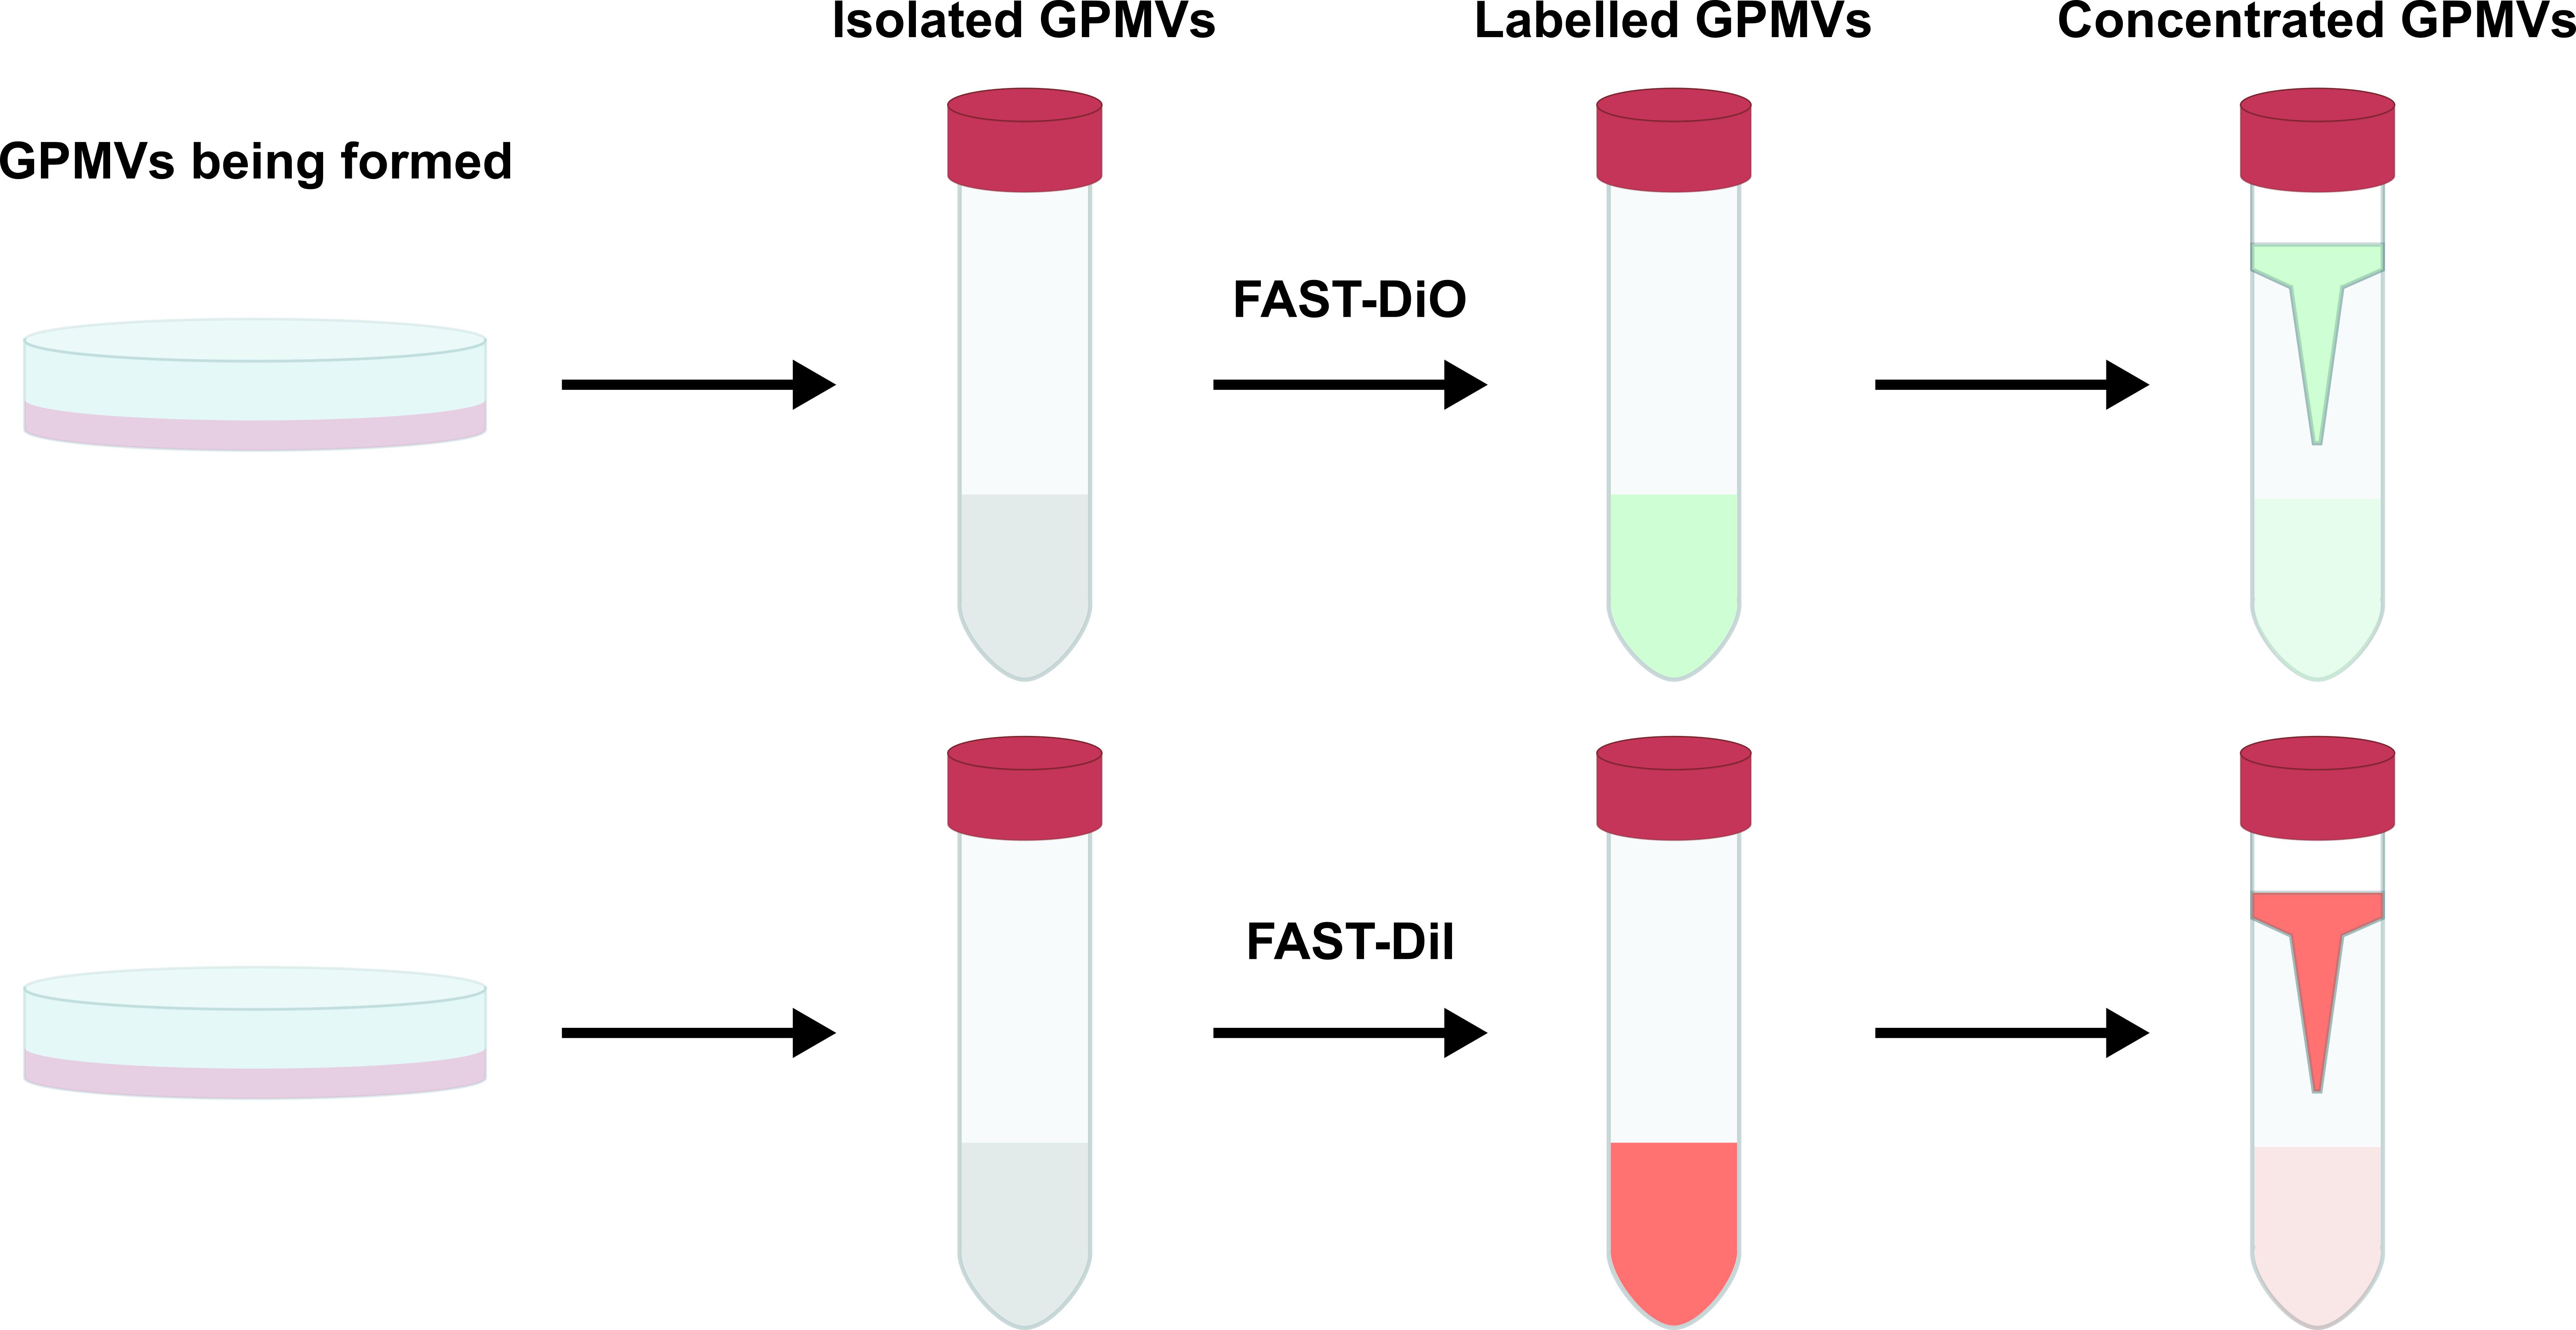
Figure 2. Workflow for the isolation and labelling of giant plasma membrane vesicles (GPMVs) formed from cultured cellsCarefully recover the GPMVs retained in the filter unit using a P200 pipette, transferring the labelled membranes into 1.5 mL microfuge tubes. The GPMVs prepared this way should be used within 48 h and can be stored at 4 °C if needed.
Note: While FAST-DiO and FAST-DiI are not particularly sensitive to photodegradation after being incorporated into the membranes, it is good practice to nonetheless avoid unnecessary exposure to ambient light.
Total phosphorus assay
In order to ensure experimental reproducibility and to accurately quantify the ratio between GPMVs and peptide, the concentration of phospholipids in the GPMV suspension can be measured through the total phosphorus assay.
Preheat an aluminium block to 210 °C on a hot plate.
Prepare a calibration curve using the phosphate standard reagent using 12 mm × 75 mm glass tubes. See Table 1 for the quantities suggested.
Table 1. Phosphorus quantities of PO43- standard
Quantity of P (μmol) Volume of PO43- standard (μL) 0.00000 0 0.00650 10 0.01625 25 0.03250 50 0.04875 75 0.06500 100 Transfer 100 μL of each GPMV suspension to 12 mm × 75 mm glass tubes.
Add 450 μL of 8.9 N H2SO4 to all tubes.
For each standard and sample to be analysed, puncture a plastic stopper five times with an 18 G needle to prevent the buildup of pressure during the next steps.
Heat the tubes on the aluminium block for 25 min, ensuring that the temperature remains between 200 and 220 °C. This reaction serves to digest the organic matter in the samples.
Remove the tubes and cool for 5 min until they can be handled. Add 150 μL of H2O2 to each tube, cap, and heat at the same temperature for 30 min. This reaction serves to remove any dark coloration that may develop in the reaction tubes due to the digestion of organic material.
Remove the tubes from heat and allow them to cool at room temperature. Meanwhile, prepare a 100 °C water bath by bringing a metal bowl of water to a boil on the hotplate.
Note: It is important that the bowl is large enough to place all the reaction tubes inside at the same time. This can be accomplished using a plastic test tube rack.
Transfer the residual liquid in each tube to a clean 16 mm × 150 mm glass tube using a P1000 micropipette.
Add 500 μL of 10% ascorbic acid, 500 μL of 3.5% ammonium molybdate (IV), and 3.9 mL of nanopure water.
Gently vortex the samples, cover each tube with a glass marble, and heat in the water bath for 7 min. Here, the reduction of the mixture by ascorbic acid permits the colorimetric reaction between phosphorus and ammonium molybdate.
Allow the tubes to cool for 5 min before transferring 200 μL of each into a 96-well microplate. Measure the absorbance in each well at 820 nm and calculate the concentration of phosphate using a linear regression. See the section on data analysis for details. CAUTION: Hot H2SO4 and H2O2 are caustic and should be handled with care. Use gloves, lab coat, safety glasses, and work inside of a chemical fume hood.
FRET kinetics
Using the phospholipid concentrations obtained from D, prepare dilutions of the GPMVs at 2× concentrations (100, 25, and 6.25 μM) in the GPMV buffer.
Transfer 50 μL of each mixed GPMV suspension to a 96-well microplate (black, non-binding surface with clear bottom) in triplicate. IMPORTANT: It is crucial to prepare the appropriate blanks to be able to normalise the data afterwards.
To each GPMV sample, add 50 μL of either GPMV buffer (blanks), IAPP freshly solubilised at 25 μM in GPMV buffer, or rat IAPP (control peptide) freshly solubilised at 25 μM in GPMV buffer.
Cover the microplate with the silicone lid to prevent evaporation.
In the plate reader, measure the fluorescence due to FRET every 10 min (λexcitation = 485 nm, λemission = 570 nm). Program the kinetics to perform a single agitation for 5 s and then record the fluorescence intensity from the bottom of the plate at 10 min intervals for 24 h with gain at the medium setting.
Note: While this protocol has been developed to detect plasma membrane damage associated with amyloidogenic peptides, it is likely to work with other, non-amyloidogenic peptides as well. Additionally, the aggregation of amyloidogenic peptides is likely sensitive to the number of measurements made during the experiment. It is therefore strongly recommended being consistent in the number of wells measured and the frequency at which the data points are collected.
Data analysis
Linear regression
Using the optical densities measured during the total phosphorus assay, perform a linear regression by plotting the optical density against the quantity of Pi (μmol) for the six standards. Sample data is shown below (Table 2, Figure 3). Using these data points, fit a linear function and display the slope, intercept, and correlation value for the regression.
Table 2. Standard curve obtained after total phosphorus assay
Pi standard (μL) Pi (μmol) OD at 820nm 0 0.00000 0.0525 10 0.00650 0.0768 25 0.01625 0.1047 50 0.03250 0.1477 75 0.04875 0.1919 100 0.06500 0.2558 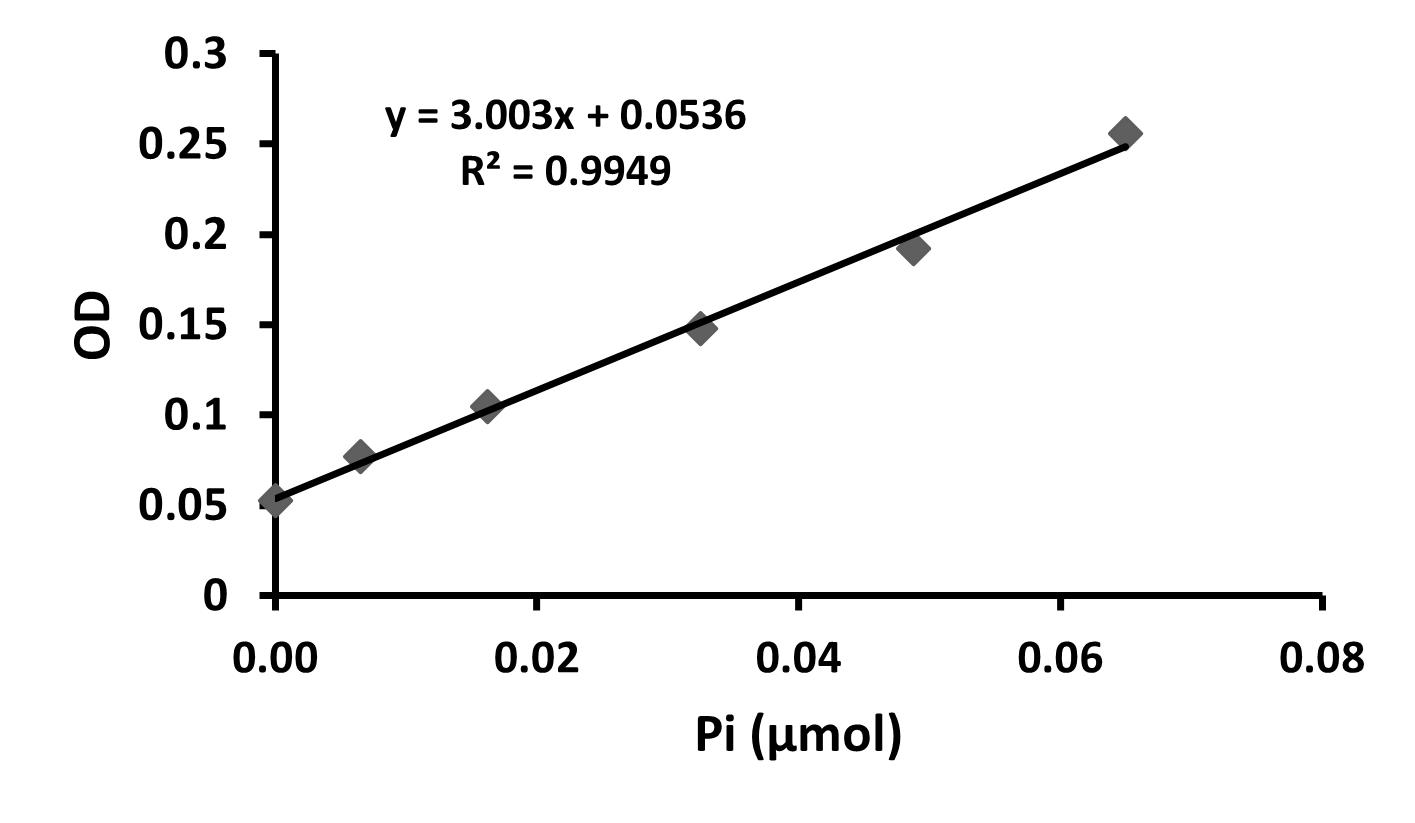
Figure 3. Linear regression from total phosphorus assayFrom the linear regression in Figure 3, the Pi content of the GPMV samples can be calculated using the equations below.
OD = slope × Qty Pi + intercept
Qty Pi = (OD - intercept)/slope
ConcGPMVs (μM) = (Pi μmol)/(100 μL) × 106
The values obtained from these calculations are shown below in Table 3, with the final Pi concentrations highlighted in green. These values correspond directly to the phospholipid concentration.
Table 3. Sample values obtained from the linear regression
Sample Volume used (μL) OD 820nm Pi (μmol) Pi (μmol/μL) Pi (μM) GPMVs 100 0.0958 0.01403 1.4036 × 10⁻⁴ 140.4 GPMV FDiO 75 0.0764 0.00758 1.0102 × 10⁻⁴ 101.0 GPMV FDiI 75 0.0822 0.00951 1.2677 × 10⁻⁴ 126.8
FRET kinetics
Average the fluorescence values of each sample across the corresponding triplicate wells.
Normalise the averaged data for each measurement as described by the equation below, where Fblank is the fluorescence intensity measured in the GPMVs in buffer, and Ftreated is the fluorescence of the GPMVs treated with human or rat IAPP.
Fnorm = Ftreated/Fblank
Fit the data with a Boltzman sigmoidal curve using GraphPad Prism by selecting Fit a curve with a non-linear regression in the analysis area and finding the Boltzman sigmoidal function in the section Classic equations from prior versions of prism, as shown in Figure 4. This can also be done in Excel or any other plotting software using the following equation:
f(x) = Fmin + (Fmax - Fmin)/(1 + eV(50-x)/k)
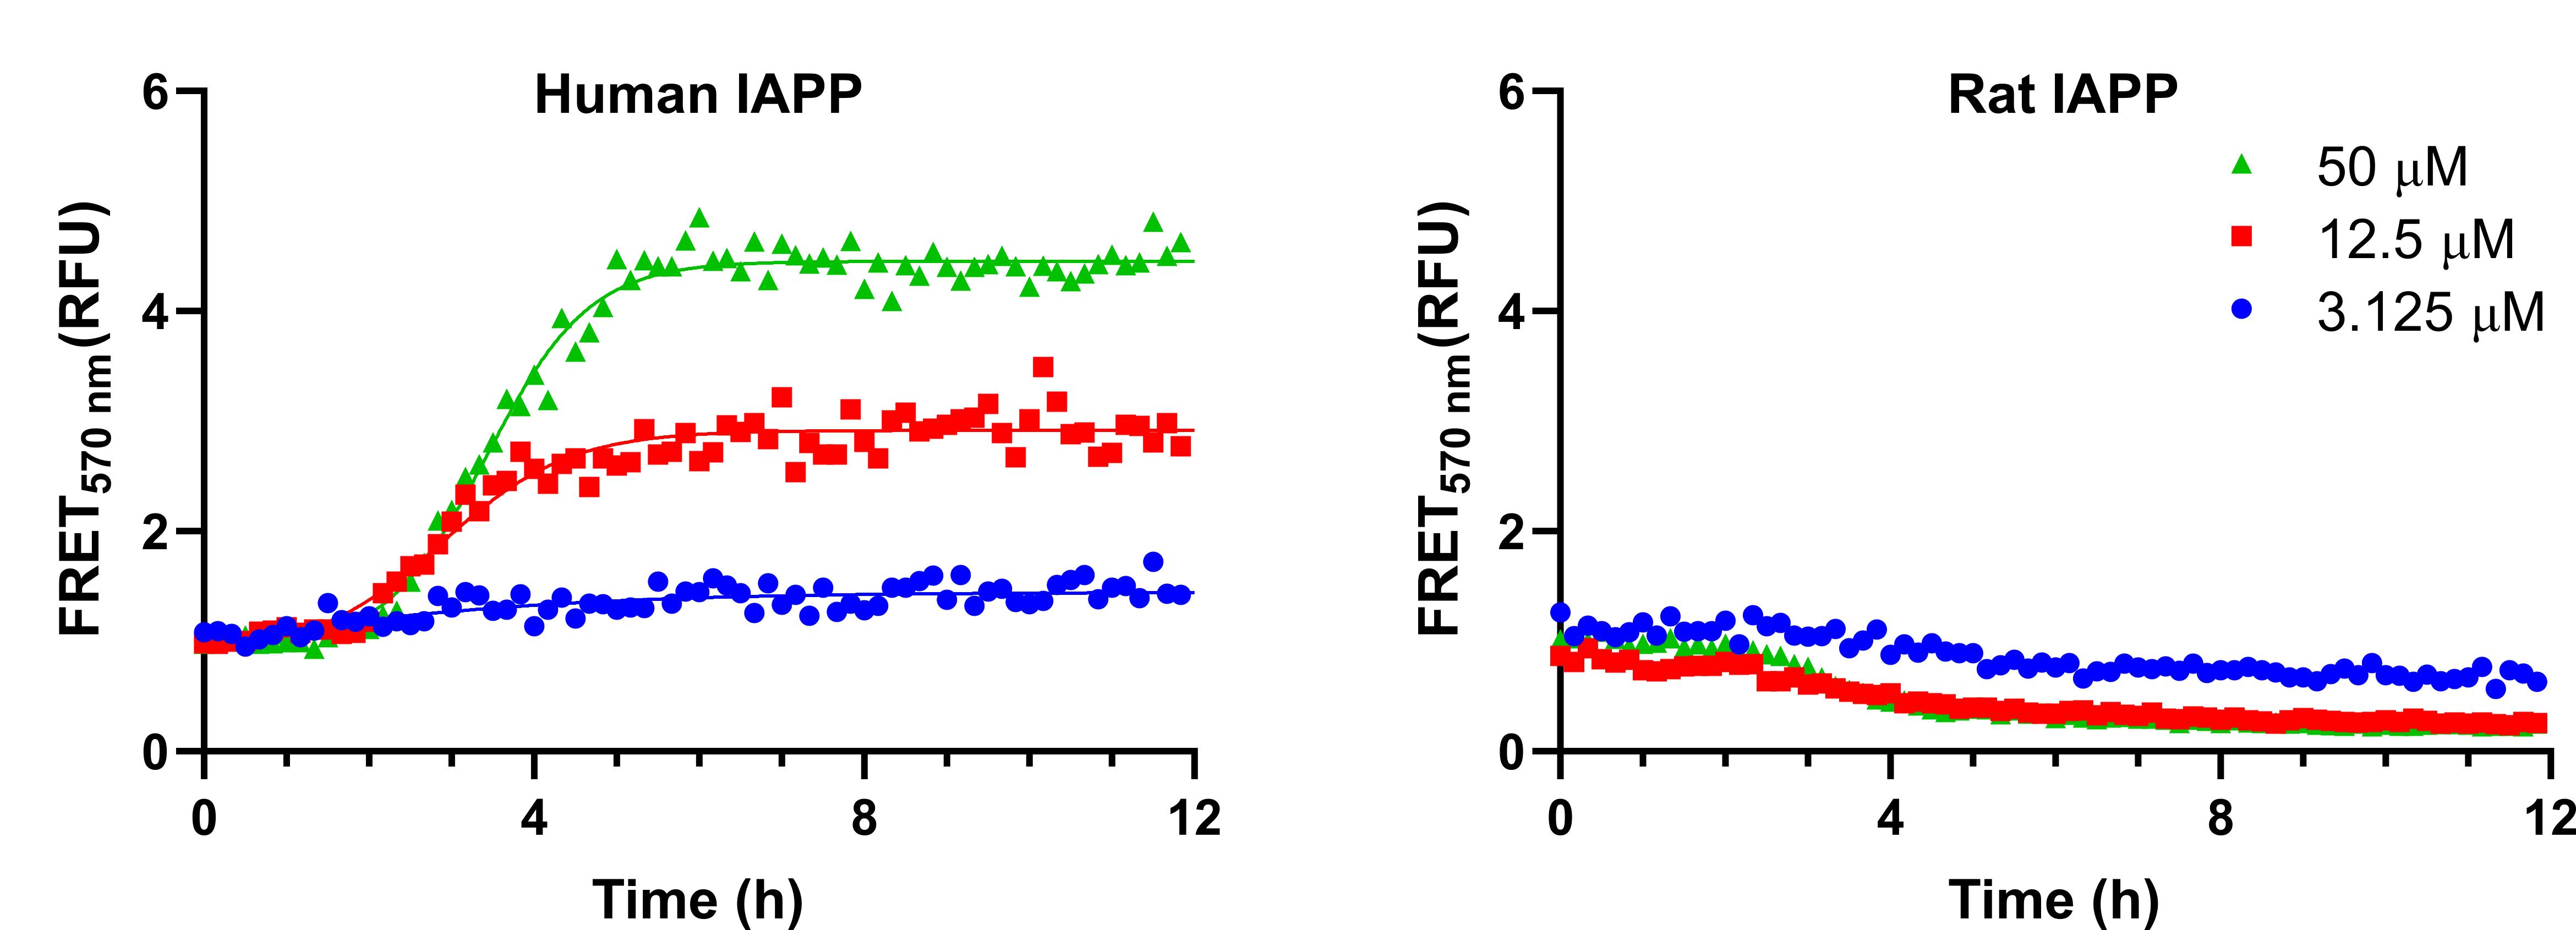
Figure 4. Representative fluorescence resonance energy transfer (FRET) kinetics obtained from FAST-DiO- and FAST-DiI-labelled giant plasma membrane vesicles (GPMVs)From the fitting, kinetic parameters, such as the top and bottom fluorescence values, the rate k, and the time to half max V50, can be extracted and compared as shown below in Figure 5. To compare the values between the two peptides, either a Student’s t-test or ANOVA can be used, depending on the number of conditions analysed.
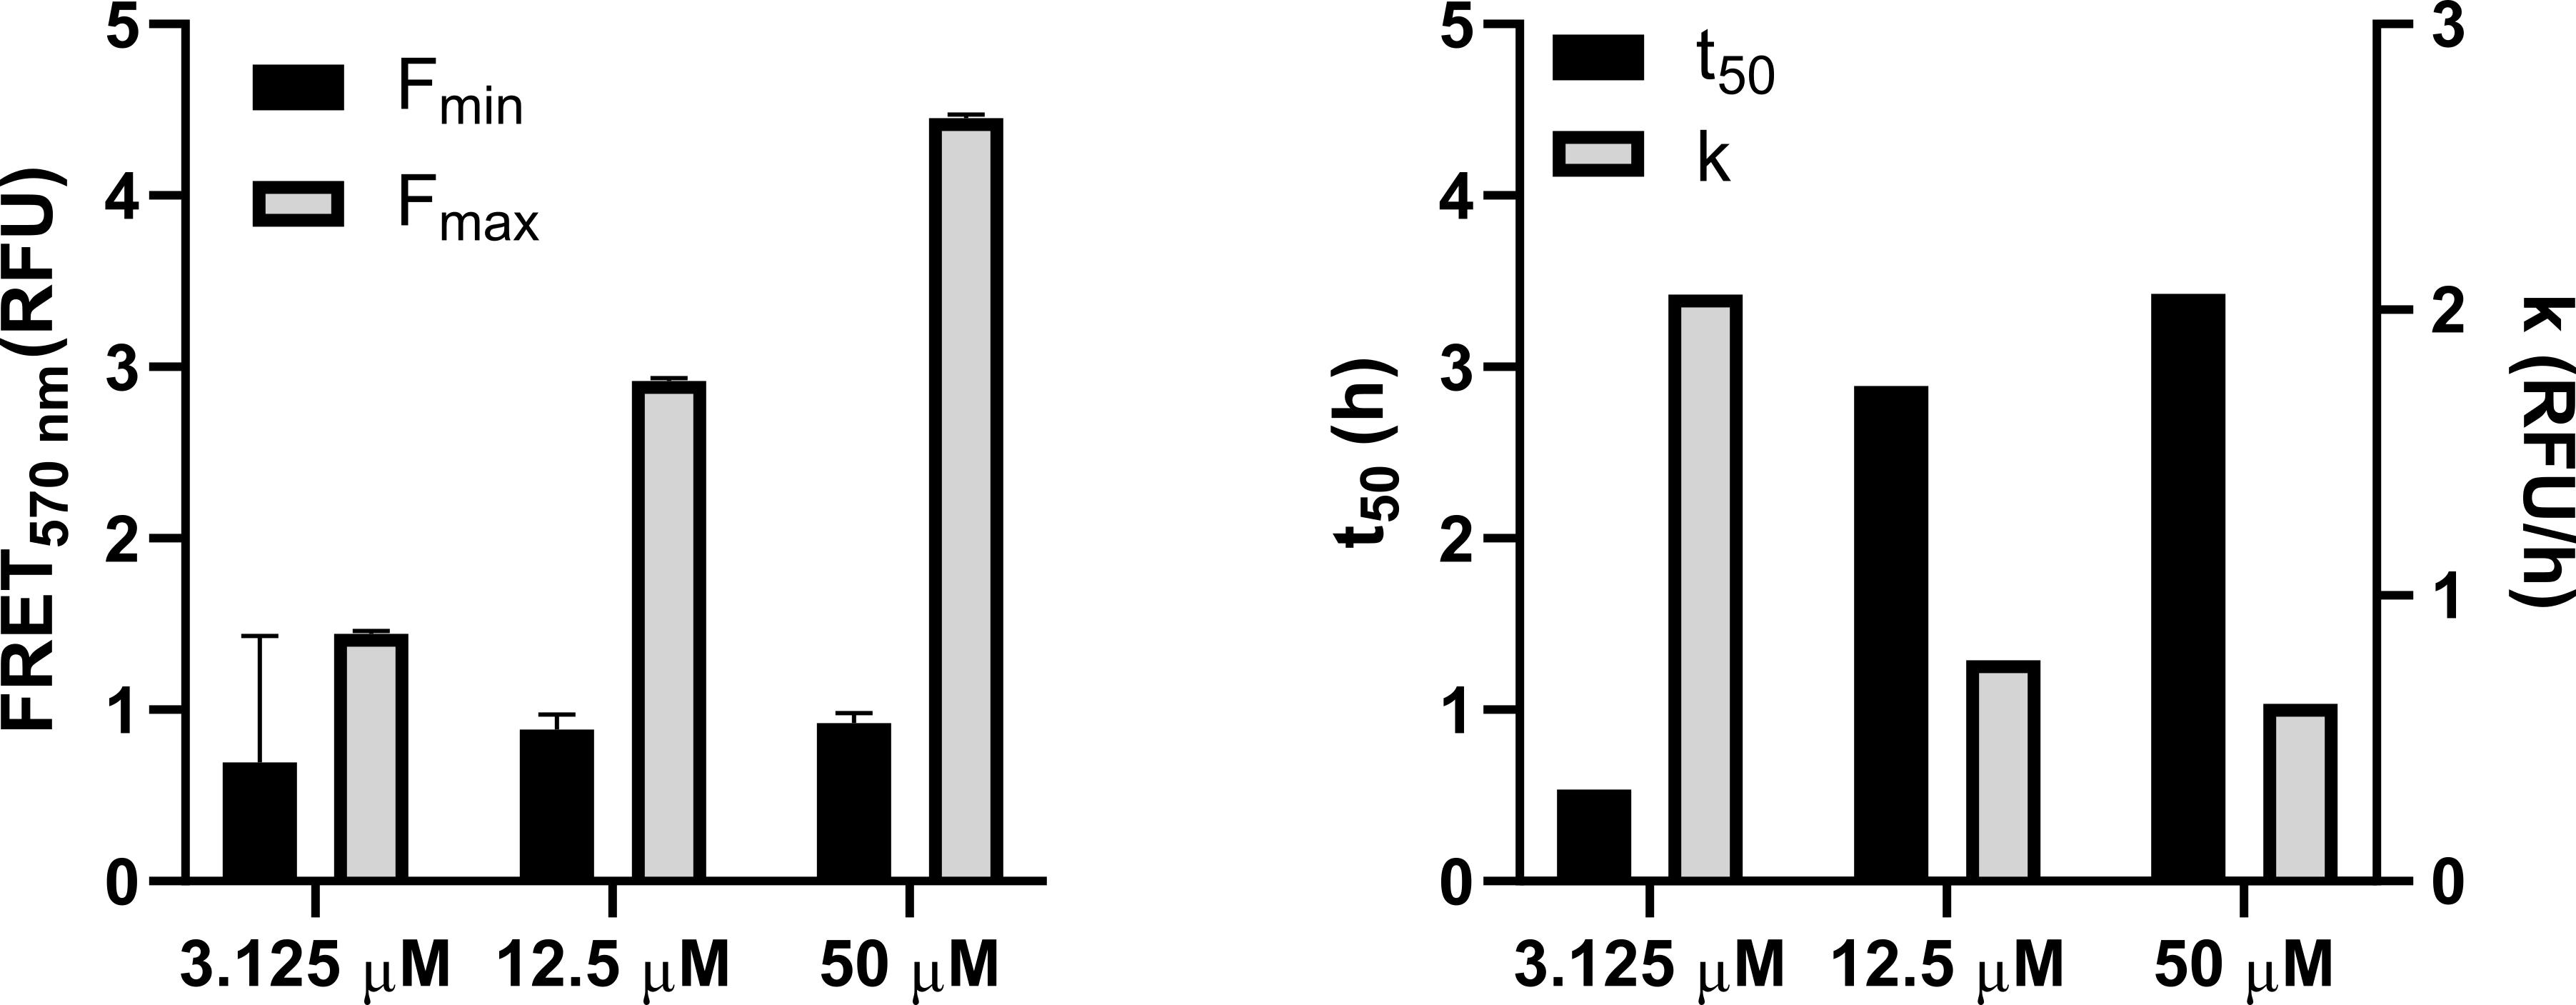
Figure 5. Kinetic parameters extracted from the Boltzman sigmoidal fitting to the data in Figure 4
Validation of protocol
Results from this protocol can be viewed in Figure 10 of the published article Sebastiao et al. (2023). Data were obtained in triplicate from independent GPMV preparations. The non-amyloidogenic rat IAPP was used as a control variable in all tests, and FRET values were normalised against the corresponding membranes in the absence of any peptide. Statistical analysis was done using a two-way ANOVA (GraphPad Prism 8) on the values extracted from the sigmoidal fitting.
General notes and troubleshooting
General notes
The rat INS-1E cells should not be kept for longer than 20 passages to ensure the reliability and quality of the GPMVs produced.
This process is applicable to other cell lines as well. It has been done using Chinese hamster ovarian cells (CHO-K1) without any modifications (Quittot et al., 2021). For other cell lines, optimization of GPMV production may be required.
It is important to maintain all parameters as consistent as possible due to the sensitive nature of amyloid self-assembly. Even varying the number or frequency of measurements made during the kinetic assay can alter the aggregation behaviour of amyloidogenic peptides (Sebastiao et al., 2017).
Troubleshooting (Table 4)
Table 4. Troubleshooting
| Issue | Solution |
| No phospholipids were detected in the total P assay | Vesicles are likely diluted. Either use a larger volume than 100 μL or further concentrate the vesicles using the Amicon. |
| Insufficient FRET signal is detected | Increase the quantity of FAST-DiO from 5 to 10 μL. |
| Kinetics are noisy | The process is inherently sensitive to many experimental parameters. Ensure that all peptide solutions are properly monomerised and completely dissolved before adding to the GPMVs. |
| Inability to fit a sigmoidal function | The sigmoidal response is typical for amyloid aggregation. It is not necessarily the response for associated membrane disruption. If required, select a different model to fit the data. |
Acknowledgments
This work was supported by the National Science and Engineering Research Counsel (NSERC) and the Quebec Research Funds for Nature and Technologies (FRQNT). The protocol was adapted from previous work (Sebastiao et al., 2023).
Competing interests
The authors declare no competing interests.
References
- Birol, M., Kumar, S., Rhoades, E. and Miranker, A. D. (2018). Conformational switching within dynamic oligomers underpins toxic gain-of-function by diabetes-associated amyloid. Nat. Commun. 9(1): 1312.
- Cao, P., Abedini, A., Wang, H., Tu, L. H., Zhang, X., Schmidt, A. M. and Raleigh, D. P. (2013).Islet amyloid polypeptide toxicity and membrane interactions. Proc. Natl. Acad. Sci. U. S. A.110(48):19279–19284.
- Harayama, T. and Riezman, H. (2018). Understanding the diversity of membrane lipid composition. Nat. Rev. Mol. Cell Biol. 19(5): 281–296.
- Kalappurakkal, J. M., Sil, P. and Mayor, S. (2020). Toward a new picture of the living plasma membrane. Protein Sci. 29(6): 1355–1365.
- Kusumi, A., Fujiwara, T. K., Chadda, R., Xie, M., Tsunoyama, T. A., Kalay, Z., Kasai, R. S. and Suzuki, K. G. (2012). Dynamic Organizing Principles of the Plasma Membrane that Regulate Signal Transduction: Commemorating the Fortieth Anniversary of Singer and Nicolson's Fluid-Mosaic Model. Annu. Rev. Cell Dev. Biol. 28(1): 215–250.
- Levental, I., Lingwood, D., Grzybek, M., Coskun, Ã. and Simons, K. (2010). Palmitoylation regulates raft affinity for the majority of integral raft proteins. Proc. Natl. Acad. Sci. U.S.A. 107(51): 22050–22054.
- Levental, K. R. and Levental, I. (2015). Giant Plasma Membrane Vesicles: Models for Understanding Membrane Organization. Curr. Top. Membr. 75: 25–57.
- Quittot, N., Fortier, M., Babych, M., Nguyen, P. T., Sebastiao, M. and Bourgault, S. (2021). Cell surface glycosaminoglycans exacerbate plasma membrane perturbation induced by the islet amyloid polypeptide. FASEB J. 35(2): e21306.
- Schlamadinger, D. E. and Miranker, A. D. (2014). Fiber-Dependent and -Independent Toxicity of Islet Amyloid Polypeptide. Biophys. J. 107(11): 2559–2566.
- Sciacca, M. F., Lolicato, F., Di Mauro, G., Milardi, D., D’Urso, L., Satriano, C., Ramamoorthy, A. and La Rosa, C. (2016). The Role of Cholesterol in Driving IAPP-Membrane Interactions. Biophys. J. 111(1): 140–151.
- Sciacca, M. F., Lolicato, F., Tempra, C., Scollo, F., Sahoo, B. R., Watson, M. D., García-Viñuales, S., Milardi, D., Raudino, A., Lee, J. C., et al. (2020). Lipid-Chaperone Hypothesis: A Common Molecular Mechanism of Membrane Disruption by Intrinsically Disordered Proteins. ACS Chem. Neurosci. 11(24): 4336–4350.
- Sciacca, M. F., Tempra, C., Scollo, F., Milardi, D. and La Rosa, C. (2018). Amyloid growth and membrane damage: Current themes and emerging perspectives from theory and experiments on Aβ and hIAPP. Biochim. Biophys. Acta Biomembr. 1860(9): 1625–1638.
- Scott, R. E. (1976). Plasma Membrane Vesiculation: A New Technique for Isolation of Plasma Membranes. Science 194(4266): 743–745.
- Sebastiao, M., Babych, M., Quittot, N., Kumar, K., Arnold, A. A., Marcotte, I. and Bourgault, S. (2023). Development of a novel fluorescence assay for studying lipid bilayer perturbation induced by amyloidogenic peptides using cell plasma membrane vesicles. Biochim. Biophys. Acta Biomembr. 1865(3): 184118.
- Sebastiao, M., Quittot, N. and Bourgault, S. (2017). Thioflavin T fluorescence to analyse amyloid formation kinetics: Measurement frequency as a factor explaining irreproducibility. Anal. Biochem. 532: 83–86.
- Serra-Batiste, M., Ninot-Pedrosa, M., Bayoumi, M., Gairí, M., Maglia, G. and Carulla, N. (2016). Aβ42 assembles into specific β-barrel pore-forming oligomers in membrane-mimicking environments. Proc. Natl. Acad. Sci. U. S. A. 113(39): 10866–10871.
- Sezgin, E. (2022). Giant plasma membrane vesicles to study plasma membrane structure and dynamics. Biochim. Biophys. Acta Biomembr. 1864(4): 183857.
- Sezgin, E., Kaiser, H. J., Baumgart, T., Schwille, P., Simons, K. and Levental, I. (2012). Elucidating membrane structure and protein behavior using giant plasma membrane vesicles. Nat. Protoc. 7(6): 1042–1051.
- Song, Y., Mittendorf, K. F., Lu, Z. and Sanders, C. R. (2014). Impact of Bilayer Lipid Composition on the Structure and Topology of the Transmembrane Amyloid Precursor C99 Protein. J. Am. Chem. Soc. 136(11): 4093–4096.
- Thakur, G., Pao, C., Micic, M., Johnson, S. and Leblanc, R. M. (2011). Surface chemistry of lipid raft and amyloid Aβ (1-40) Langmuir monolayer. Colloids Surf., B 87(2): 369–377.
- Zartner, L., Garni, M., Craciun, I., Einfalt, T. and Palivan, C. G. (2021). How Can Giant Plasma Membrane Vesicles Serve as a Cellular Model for Controlled Transfer of Nanoparticles? Biomacromolecules 22(1): 106–115.
- Zhang, X., St. Clair, J. R., London, E. and Raleigh, D. P. (2017). Islet Amyloid Polypeptide Membrane Interactions: Effects of Membrane Composition. Biochemistry 56(2): 376–390.
Article Information
Copyright
© 2023 The Author(s); This is an open access article under the CC BY license (https://creativecommons.org/licenses/by/4.0/).
How to cite
Sebastiao, M., Quittot, N., Marcotte, I. and Bourgault, S. (2023). Fluorescence Resonance Energy Transfer to Detect Plasma Membrane Perturbations in Giant Plasma Membrane Vesicles. Bio-protocol 13(19): e4838. DOI: 10.21769/BioProtoc.4838.
Category
Cell Biology > Cell structure > Plasma membrane
Biochemistry > Lipid > Membrane lipid
Biophysics > Biophotonics
Do you have any questions about this protocol?
Post your question to gather feedback from the community. We will also invite the authors of this article to respond.