- Protocols

- Articles and Issues
- For Authors
- About
- Become a Reviewer

Testing for Allele-specific Expression from Human Brain Samples
Published: Vol 13, Iss 19, Oct 5, 2023 DOI: 10.21769/BioProtoc.4832 Views: 1953
Reviewed by: Geoffrey C. Y. LauZhengrong YuanUte Angelika HoffmannAnonymous reviewer(s)
Original research article
The authors used this protocol in:
Aug 2022
Advertisement


Protocol Collections
Comprehensive collections of detailed, peer-reviewed protocols focusing on specific topics


Abstract
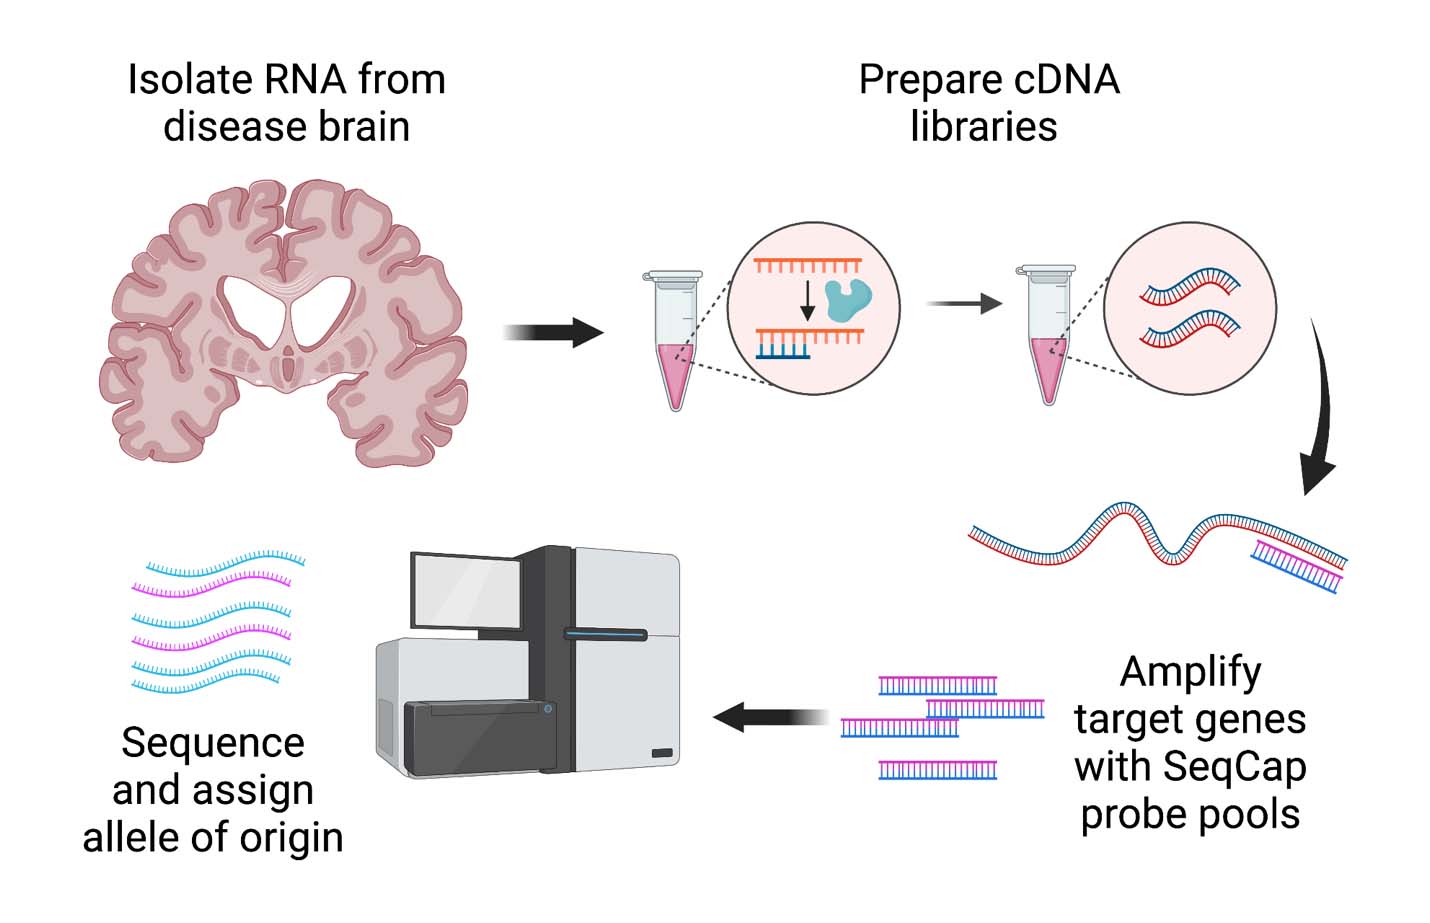
Many single nucleotide polymorphisms (SNPs) identified by genome-wide association studies exert their effects on disease risk as expression quantitative trait loci (eQTL) via allele-specific expression (ASE). While databases for probing eQTLs in tissues from normal individuals exist, one may wish to ascertain eQTLs or ASE in specific tissues or disease-states not characterized in these databases. Here, we present a protocol to assess ASE of two possible target genes (GPNMB and KLHL7) of a known genome-wide association study (GWAS) Parkinson’s disease (PD) risk locus in postmortem human brain tissue from PD and neurologically normal individuals. This was done using a sequence of RNA isolation, cDNA library generation, enrichment for transcripts of interest using customizable cDNA capture probes, paired-end RNA sequencing, and subsequent analysis. This method provides increased sensitivity relative to traditional bulk RNAseq-based and a blueprint that can be extended to the study of other genes, tissues, and disease states.
Key features
• Analysis of GPNMB allele-specific expression (ASE) in brain lysates from cognitively normal controls (NC) and Parkinson’s disease (PD) individuals.
• Builds on the ASE protocol of Mayba et al. (2014) and extends application from cells to human tissue.
• Increased sensitivity by enrichment for desired transcript via RNA CaptureSeq (Mercer et al., 2014).
• Optimized for human brain lysates from cingulate gyrus, caudate nucleus, and cerebellum.
Graphical overview
Background
Most single nucleotide polymorphisms (SNPs) associated with disease traits by genome-wide association studies (GWAS) are in non-coding regions of the genome. One way in which these SNPs may influence disease risk is via effects on expression of nearby genes as expression quantitative trait loci (eQTL). Public resources such as the Genotype-Tissue Expression (GTEx) Project allow scientists to easily query large datasets from multiple tissues from humans without disease for eQTL relationships between SNP variants and specific RNA transcripts in various organ tissues from healthy individuals. However, in many cases, investigators may want to understand whether an eQTL relationship extends to specific tissues from specific individuals; for example, either in tissues not queried by these databases or in individuals with a disease condition. Because the mechanistic basis for many eQTL effects is allele-specific expression (ASE), we developed a protocol for assaying ASE in brain tissue from human subjects with Parkinson’s disease (PD) who are heterozygous for the eQTL SNP in question, affecting the target gene GPNMB. This protocol builds on the ASE method described by Mayba et al. (2014) by enriching for the desired transcripts via an RNA CaptureSeq (Mercer et al., 2014) step and by adapting the protocol to assay human brain tissue as opposed to cultured cells. Furthermore, our protocol can be adapted to multiple complex traits and tissues to advance our mechanistic understanding of many non-coding risk variants with eQTL effects.
Materials and reagents
Biological materials
Human brain samples (acquired from University of Pennsylvania’s CNDR Brain Bank)
Reagents
TriZol (Invitrogen, catalog number: 15596026)
Qiagen RNeasy kit (Qiagen, catalog number: 74104)
Agilent Bioanalyzer RNA 6000 Nano Kit (Agilent, catalog number: 5067-1511)
Agilent Bioanalyzer DNA 1000 Nano (Agilent, catalog number: 5067-1504)
Agencourt AMPure XP beads (Agencourt, catalog number: A63881)
KAPA RNA HyperPrep Kit (KAPA/Roche Sequencing solutions, catalog number: KK8540)
Roche SeqCap RNA probes (Roche, custom designed, see Procedure below)
Roche SeqCap EZ Accessory kit v2 (Roche, catalog number: 07145594001)
Roche SeqCap EZ Hybridization and Wash Kit (Roche, catalog number: 05634261001)
Ethanol (Decon Labs, Inc., catalog number: 2716)
Water for RNA applications (Fisher bioreagents, catalog number: BP5611)
Laboratory supplies
1.5 mL plastic tubes (Eppendorf, catalog number: 022431021)
0.2 mL PCR tubes (Denville, catalog number: C18098-4)
Equipment
Bioanalyzer (Agilent 2100 Bioanalyzer, catalog number: G2939BA)
Thermocycler (Applied Biosystems, Veriti 96-well Thermal Cycler, catalog number: 4375786)
Sequencer (Illumina HiSeq 2500, catalog number: SY-401-2501)
Dyna-mag2 magnet (Thermo Fisher, catalog number: 12321D)
Vortex mixer (Fisherbrand, Brand, catalog number: 02-215-365)
Microcentrifuge (Eppendorf Model 5424, catalog number: 022620401)
NanoDrop or similar spectrophotometer
Software and datasets
RStudio
FastQC
Trimmomatic (Version 032)
STAR
WASP
VariantAnnotation
TxDb.Hsapiens.UCSC.hg19.knownGene
Procedure
RNA isolation from human brain samples
Dissect human postmortem brain samples as previously described (Chen-Plotkin et al., 2008). In our publication (Diaz-Ortiz et al., 2022), we used neurologically normal controls (NC, n = 2) and PD (n = 4) individuals, and we dissected the caudate nucleus, cingulate gyrus, and cerebellum.
Isolate total RNA from postmortem brain samples using TRIzol and RNeasy Mini columns as previously described (Chen-Plotkin et al., 2008).
Assess RNA concentration and purity by spectrophotometric measurement of 260/280 nm OD ratios using a NanoDrop.
Note: We require 260/280 ratios between 1.90 and 2.10 (for ratios outside this range, see General notes and troubleshooting).
Assess RNA integrity by capillary electrophoresis on an Agilent 2100 Bioanalyzer following the RNA 6000 Nano Kit guide.
Note: While RNA Integrity Numbers (RINs) of > 7 are desired for most applications, this may not be possible in all cases; our RINs varied between 5.2 and 9.0 (average 6.5). In cases where RIN < 6.5, visual inspection of Bioanalyzer traces is encouraged to ascertain the etiology (see General notes and troubleshooting). Example Agilent 2100 Bioanalyzer traces with corresponding RINs are shown in Figure 1.
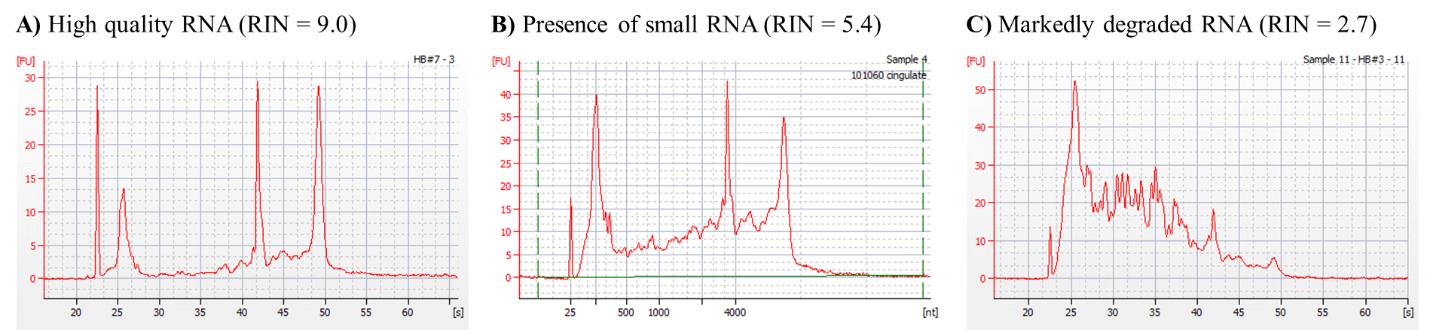
Figure 1. Example Bioanalyzer traces of RNA samples with various RNA integrity numbers (RINs), specifically RIN = 9.0 (A), RIN = 5.2 (B), and RIN = 3.2 (C). While both B and C have relatively low RIN numbers, the wide second peak from left to right in trace B is consistent with the presence of small RNAs, while the absence of four distinct peaks in trace C is consistent with true RNA degradation.Aliquot RNA isolates and store at -80 °C until use.
Note: We prepared multiple 20 μL aliquots from each brain sample isolated, so that each aliquot can be single used to minimize freeze-thaw effects, which can affect RNA quality and downstream steps.
Detailed description of sections B–G are adapted from the Roche SeqCap RNA Enrichment System User Guide.
cDNA Library preparation
Prepare libraries with the KAPA RNA HyperPrep Kit per the Roche SeqCap RNA Enrichment System User Guide. An overview of the procedure is provided below:
Add spike in controls.
Spike-in ERCC controls into 100 ng of total RNA following manufacturer’s instructions.
Adjust the volume of the spiked RNA sample to a total volume of 10 μL in PCR-grade water.
Fragment RNA into 100–200 bp fragments.
Mix 10 μL of spiked sample with 10 μL of 2× Fragment, Prime, and Elute Buffer on ice by pipetting up and down 10 times.
Place samples from step B2a in a thermocycler and run for 8 min at 94 °C.
Quickly place samples on ice for next step.
Perform first-cDNA-strand synthesis.
Prepare First Strand Master Mix on ice by mixing 11 μL of 1st Strand Synthesis Buffer and 1 μL of KAPA Script per sample.
Mix 10 μL of the First Strand Master Mix with 20 μL of fragmented RNA sample on ice by gently pipetting up and down several times.
Place samples from step B3b in a thermocycler and run for 10 min at 25 °C, 15 min at 42 °C, and 15 min at 70 °C, followed by a 4 °C hold until ready for next step.
Perform second strand synthesis.
Prepare Second Strand Master Mix on ice by mixing 31 μL of 2nd Strand Marking Buffer with 2 μL of 2nd Strand Synthesis Enzyme Mix per sample (for a total volume of 33 μL, which will be 10% in excess of the 30 μL needed for the next step).
Mix 30 μL of 1st strand cDNA (samples from step B3c) with 30 μL of the 2nd Strand Master Mix on ice by gently pipetting up and down several times.
Place samples from step B4b in a thermocycler and run for 30–60 min at 16 °C followed by a 4 °C hold until ready for next step.
Clean up double-stranded cDNA.
Mix 60 μL of double-stranded cDNA samples from step B4c with 108 μL of Agencourt AMPure XP beads (prewarmed to room temperature for 30 min and vortexed to ensure a homogeneous suspension) by gently pipetting up and down several times.
Incubate the tube at room temperature for 15 min to allow the cDNA to bind to the beads.
Place the tube on a dyna-mag2 magnet to capture the beads and incubate until the liquid is clear.
Carefully remove and discard the supernatant using a P200 pipette.
Keeping the tube on the magnet, add 200 μL of freshly prepared 80% ethanol.
Incubate the tube at room temperature for ≥ 30 s.
Carefully remove and discard the ethanol.
Repeat steps B5e–B5g.
Allow the beads to dry at room temperature until all ethanol evaporates. Visually inspect for any remaining drops of ethanol in the tube. The sample is sufficiently dry when no drops are left. Caution: Over-drying the beads (for longer than 3–5 min) may result in dramatic yield loss.
Remove the tubes from the magnet.
Perform A-tailing.
Prepare A-tailing Master Mix by mixing 24 μL of PCR-grade water, 3 μL of 10× KAPA A-Tailing Buffer, and 3 μL of KAPA A-Tailing Enzyme.
For each sample, resuspend beads from step B5i in 30 μL of A-tailing master mix by pipetting up and down.
Place samples in a thermocycler and run for 30 min at 30 °C and 20–30 min at 60 °C followed by a 4 °C hold until ready for next step.
Ligate adapters.
Generate a 700 nM adapter working dilution for each adapter ligation reaction.
Note: Adapter concentration should be adjusted for input RNA amount other than 100 ng per user guide appendix F.
Prepare Adapter Ligation Mix by mixing 16 μL of PCR-grade water, 14 μL of 5× KAPA Ligation Buffer, and 5 μL of KAPA T4 DNA Ligase per reaction.
Mix each 30 μL of A-tailing reaction from step B6c with 35 μL of the Adapter Ligation Master Mix by pipetting up and down.
To each sample from step B7c, add 5 μL of the SeqCap Library Adapter working dilution (with the desired Index) and mix by gently pipetting up and down 10 times.
Note: Record the index used for each sample.
Incubate at 20 °C for 15 min.
First post ligation cleanup.
To each 70 μL of adapter ligation reaction, add 70 μL of thawed PEG/NaCl solution, resulting in a total volume of 140 μL, and mix by pipetting up and down several times.
Incubate the tube at room temperature for 15 min to allow the cDNA to bind to the beads.
Place the tube on a magnet to capture the beads. Incubate until the liquid is clear.
Carefully remove and discard 135 μL of supernatant.
Repeat steps B5e–B5j (wash twice with 200 μL of freshly prepared 80% EtOH, then allow to dry at room temperature, as described in step B5).
Thoroughly resuspend the beads in 50 μL of elution buffer (10 mM Tris-HCl, pH 8.0).
Incubate the tube at room temperature for 2 min to allow the cDNA to elute off the beads.
Second post ligation cleanup.
To each 50 μL of resuspended cDNA with beads, add 50 μL of thawed PEG/NaCl solution and mix thoroughly whilst avoiding bubbles by pipetting up and down multiple times.
Incubate the tube at room temperature for 15 min to allow the cDNA to bind to the beads.
Place the tube on a magnet to capture the beads. Incubate until the liquid is clear.
Carefully remove and discard 95 μL of supernatant.
Repeat steps B5e–B5j (wash twice with 200 μL of freshly prepared 80% EtOH, then allow to dry at room temperature, as described in step B5).
Thoroughly resuspend the beads in 22.5 μL of elution buffer (10 mM Tris-HCl, pH 8.0) by vortexing briefly.
Incubate the tube at room temperature for 2 min to allow the cDNA to elute off the beads.
Place the tube on dyna-mag2 magnet to capture the beads and incubate until the liquid is clear.
Transfer 20 μL of the clear supernatant to a new 0.2 mL PCR tube.
Note: Samples can be stored at 4 °C for up to one week or at -20 °C for up to one month.
Pre-capture library amplification by LM-PCR
Prepare the Pre-Capture LM-PCR Master Mix on ice by mixing 25 μL of 2× KAPA HiFi HotStart ReadyMix and 5 μL of 10× KAPA Library Amplification Primer Mix per sample, pipetting up and down 10 times.
Mix 20 μL of sample generated in section B with 30 μL of Pre-Capture LM-PCR Master Mix on ice by pipetting up and down several times.
Transfer samples to a thermocycler and run at the following settings: 45 s at 98 °C; 11 cycles of 15 s at 98 °C, 30 s at 60 °C, and 30 s at 72 °C; 5 min at 72 °C; and hold at 4 °C.
Purify the amplified samples with Agencourt AMPure XP beads by mixing 1:1 volumes of amplified samples to beads and then following steps outlined in section B, step 5.
Note: Alternatively, use Qiagen QIAquick PCR Purification Kit.
Assess DNA purity by spectrophotometric measurement of 260/280 nm OD ratios using a NanoDrop.
Note: 260/280 ratios between 1.7 and 2.0 are recommended (for ratios outside this range, see General notes and troubleshooting).
Analyze DNA library quality on a Bioanalyzer using Agilent DNA 1000 chip following the Agilent 2100 Kit user guide.
Note: The average fragment size should be between 150 and 500 bp.
SeqCap RNA ChoiceTM probe pool design
Design SeqCap RNA probe pools, using Roche Sequencing Solutions Custom Design (Roche, WI).
We designed probes of approximately 60 bp in length with no more than 20 close matches in the genome, as determined by the Sequence Search and Alignment by Hashing Algorithm (SSAHA). The goal was to provide sufficient coverage of transcripts of interest (GPNMB, KLHL7) while minimizing potential off-target effects. A close match is defined as any genomic sequence that differs from one of the probe sequences by five or fewer single-base insertions, deletions, or substitutions. Select exonic probes that cover the transcript(s) of interest (here, GPNMB and KLHL7). While single mismatches within a 60 bp probe are typically not thought to affect hybridization dynamics, as a conservative measure to minimize SNP-mediated capture bias, we ensured that probes do not overlap any SNPs in linkage disequilibrium (r2 > 0.2) with the sentinel SNP (here, rs199347).
Target cDNA enrichment
Hybridize samples to SeqCap RNA probe pools.
Thaw 4.5 μL of SeqCap RNA probe pool aliquots (one per sample library, see user guide for instructions on how to generate these) on ice.
Spin down the lyophilized SeqCap HE Universal and SeqCap HE Index Oligos, then resuspend in PCR-grade water to 1 mM and vortex to mix. Combine the HE oligos such that the resulting HE oligo pool contains 50% SeqCap HE Universal Oligo and 50% of a mixture of the appropriate SeqCap HE Index oligos, for a combined amount of 2,000 pmol that is required for a single sequence capture experiment.
Combine equimolar amounts of cDNA libraries (already barcoded) from each brain sample for a total mass of 1 μg.
In a 1.5 mL tube, combine 5 μL of human COT DNA (control DNA included in SeqCap accessory kit v2), 1 μg of pooled cDNA from previous step, and 2,000 pmol of HE oligo pool.
Dry the samples from section E step 1d in a vacuum concentrator or at high heat at 60 °C and then resuspend in 7.5 μL of 2× Hybridization buffer with 3 μL of hybridization component A by vortexing and then spinning down for 10 s at maximum speed.
Place samples in a pre-warmed 95 °C heat block for 10 min to denature cDNA; then, centrifuge for 10 s at maximum speed.
Transfer 10.5 μL of sample to 4.5 μL aliquot of SeqCap RNA probe pool in a 0.2 mL PCR tube, vortex for 3 s, and spin down at maximum speed for 10 s.
Finally, hybridize the pooled cDNA library to SeqCap RNA probes by running in a thermocycler at 47 °C (lid temperature at 57 °C) for 16–20 h.
Wash and recover the captured multiplex cDNA sample.
Prepare the captured multiplex cDNA samples from section E step 1h by first ligating them to pre-washed capture beads (100 μL of beads per capture reaction in 0.2 mL tubes) in a thermocycler for 45 min at 47 °C with the lid at 57 °C.
Perform multiple washes, as specified in the Roche SeqCap RNA Enrichment System User’s Guide using the Dyna-mag2 magnet: once with 100 μL of 47 °C wash buffer I, twice with 200 μL of 47 °C stringent wash buffer, once with 200 μL of room temperature wash buffer I, once with 200 μL of room temperature wash buffer II, and once with 200 μL of room temperature wash buffer III).
Finally, resuspend the beads ligated to captured cDNA libraries in 50 μL of PCR-grade water.
Note: Samples can be stored at -20 °C until ready for post-ligation LM-PCR.
Perform target cDNA enrichment and sequencing as previously described (Mercer et al., 2014) using the SeqCap EZ Accessory kit v2, as summarized below:
Post-capture library amplification by LM-PCR
Prepare the Post-Capture LM-PCR Master Mix on ice by mixing 25 μL of 2× KAPA HiFi HotStart ReadyMix and 5 μL of Post-LM-PCR Oligos 1 & 2 (5 μM) per reaction.
Mix 20 μL of bead-bound captured cDNA (vortexed to ensure homogeneous suspension) or 20 μL of PCR-grade water (for negative control) with 30 μL of Post-Capture LM-PCR Master Mix.
Transfer samples to a thermocycler and run at the following settings: 45 s at 98 °C; 14 cycles of 15 s at 98 °C, 30 s at 60 °C, and 30 s at 72 °C; 5 min at 72 °C; and hold at 4 °C.
Purify the amplified samples with Agencourt AMPure XP beads by adding 180 μL of prepared beads to 100 μL of amplified sample and then following steps outlined in section B step 5.
Note: Alternatively, use Qiagen QIAquick PCR Purification Kit.
Assess DNA purity and quality with NanoDrop and bioanalyzer as specified in the pre-capture library amplification section.
Note: The desired 260/280 ratio is 1.7–2.0, and the desired fragment size is 150–500 bp. If either of these conditions is not met, that is a red flag.
Sequencing
Pool post-capture PCR amplified libraries.
Perform paired-end sequencing of DNA sequencing of pooled libraries.
Note: We performed this sequencing on an Illumina HiSeq 2500.
Data analysis
Our approach to read mapping and testing for ASE has been previously described in Diaz-Ortiz et al. (2022) (in Materials and Methods, subsection Read mapping and ASE analyses), but is listed in more detail below, also including analysis scripts (see Supplementary Information 2 and 3).
Assess sequencing data, trim reads, and filter for poor-quality reads prior to mapping.
To assess RNA-seq reads quality we employed FastQC (Andrews, 2010), while for reads quality filtering and trimming we used Trimmomatic (Version 032) (Bolger et al., 2014). We ran Trimmomatic to remove low-quality fragments in a 4 base wide sliding window (average window quality below PHRED 20), and low quality leading and trailing bases (below PHRED 10). We also dropped all the reads with average PHRED quality below 25, as well as reads shorter than 75 bases. Depending on the sample, 65%–80% of reads passed this trimming and filtering step, resulting in 6.5–24 million read pairs per sample for mapping.
Map reads to the human genome.
To perform unbiased allele specific read mapping to the reference human genome (hg19), we applied a WASP–STAR pipeline (Figure 2, reproduced from Figure S7 of Diaz-Ortiz et al., 2022). First, we mapped reads with STAR (Dobin and Gingeras, 2016), applying 2-step alignment, and filtered them for mapping bias using WASP (van de Geijn et al., 2015). Before proceeding with variant calling, we removed duplicate reads using rmdup_pe.py script incorporated into WASP pipeline. To call and filter single nucleotide variants (SNV), we used GATK tools; HaplotypeCaller, SelectVariants, and VariantFiltration.
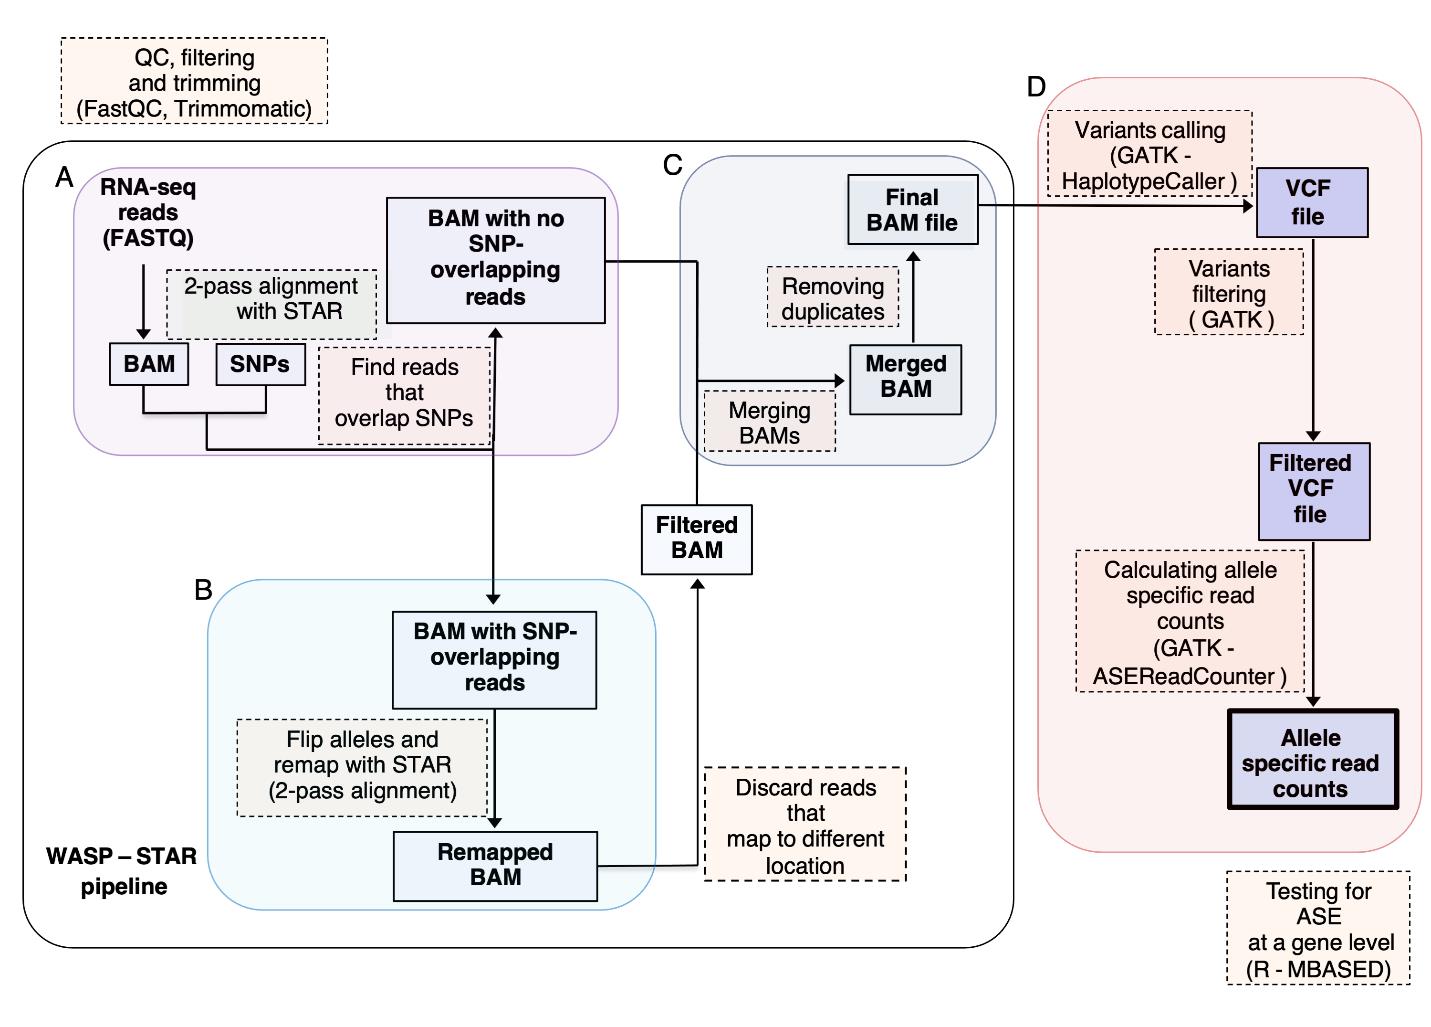
Figure 2. Allele-specific expression (ASE) workflow. (A) RNA-seq data were first QC filtered and then mapped to the human reference genome (GRChg37) with STAR aligner using a 2-step approach. To remove allelic bias, the aligned reads were split into reads that did and did not overlap with single nucleotide variants (SNVs) and into separate BAM files. (B) The SNV genotypes were flipped in all reads that overlapped a SNV (in each read the genotype was swapped with that of the other allele) and re-mapped to reference genome again. Reads that did not re-map to the original location were discarded. (C) Filtered BAM files were then merged with BAM files that did not overlap with SNVs. Duplicate reads were removed using rmdup_pe.py script incorporated into the WASP pipeline. (D) SNVs were called and filtered using GATK tools. The allele specific counts were obtained by ASEReadCounter GATK tools. MBASED algorithm was used to test for ASE at the gene level. This figure is reproduced from Figure S7 of Diaz-Ortiz et al. (2022).Obtain ASE specific read counts.
We obtained allele-specific read counts by GATK - ASEReadCounter. In order to filter out intergenic variants, we functionally annotated SNVs using VariantAnnotation (Obenchain et al., 2014) and TxDb.Hsapiens.UCSC.hg19.knownGene (Carlson and Maintainer, 2015) R packages.
Test for ASE.
To test for ASE at the gene level, we first selected proxy SNPs that were highly linked (r2 > 0.6) with rs199347 and located within a coding region for the gene of interest in order to assign allele of origin. Where possible, it may be useful to select several proxy SNPs per locus, as the number of aligned reads with sequence data at each ASE proxy SNP may differ. For GPNMB, we ultimately assigned the allele of origin for each transcript read based on genotype at rs199355, but we initially performed ASE analyses for both rs199355 and rs5850. Because both SNPs yielded identical results, we presented the data for rs199355, which had greater read counts. For KLHL7, we assigned the allele of origin based on genotype at rs2072368, as there were few alternative ASE proxy SNPs available. We then tested for allelic imbalance with a beta-binomial model with overdispersion using the MBASED R package (Mayba et al., 2014). P-values were adjusted for false discovery rate using the Benjamini-Hochberg method (Benjamini and Hochberg, 1995).
Note: An example of the read count data for GPNMB in its raw form is provided in Table S1 to give the reader a sense of the variability in counts obtained in a typical experiment. Table S1 also provides statistical information from a number of alternative binomial testing and FDR correction methods.
Validation of protocol
Two aspects of our results (some of which are highlighted in Diaz-Ortiz et al., 2022) suggest the reproducibility of our protocol. First, GPNMB consistently showed ASE when assayed by proxy SNP rs199355, with a reproducible effect size and direction across individuals who were heterozygous at the sentinel locus (rs199347) regardless of brain region samples or disease-state. Secondly, when ASE for this locus was assayed with a probe targeting a second proxy exonic SNP (rs8580, data not shown), the results did not differ significantly.
Additionally, various aspects of our work highlight both internal and external validity of our work. The internal validity of our assay is supported by the results from two individual populations not shown in Diaz-Ortiz et al. (2022): 1) individuals who were homozygous at the proxy SNP (rs8580), and 2) individuals who were homozygous at the sentinel SNP (rs199347) but heterozygous at the proxy SNP (rs8580). While for individuals in category 1 one would expect monoallelic expression (i.e., 100% ASE), for individuals in category 2 one would expect near equal expression of both alleles (i.e., absence of ASE). As expected, our assay showed allele counts consistent with monoallelic expression for individuals in category 1 and non-significant ASE for individuals in category 2 (Table S2). Finally, the directionality of the effect is consistent with previously published eQTL for this locus in healthy individuals (GTEx Consortium, 2017), supporting the external validity of our assay.
General notes and troubleshooting
Troubleshooting
NanoDrop 260/280 ratio outside of desired range for RNA sample: if the 260/280 ratio is outside the ideal range, this could reflect some impurity contaminating the sample (for example, a ratio of less than 1.7 would be suggestive of either phenol or protein contamination). We would suggest doing an ethanol precipitation or using the Qiagen QIAquick PCR Purification Kit to increase the sample purity.
RIN < 7 for RNA sample: when dealing with difficult-to-obtain human tissue, RINs may be lower when compared to samples originating from cultured cells. This may be due to either true RNA degradation (Figure 1C) or the presence of small RNAs (Figure 1B). We recommend visually inspecting the traces to distinguish between these possible causes and, in the latter, attempting small RNA cleanup of the sample.
Spectrophotometric analysis of negative LM-PCR control on NanoDrop suggests DNA yield that is more than a negligible amount: this is suggestive of either A) unincorporated LM-PCR primers being carried over or B) contamination. We recommend visually inspecting the DNA 1000 bioanalyzer trace for the negative control. A sharp peak below the 150 bp range is consistent with primers carried over from the LM-PCR reaction. However, a signal in the 150–500 bp range suggests contamination.
Acknowledgments
This work was supported by the NIH (F31 NS113481 to MDO, RO1 NS115139 to A.C.P., U19 AG062418 to A.C.P.), a Biomarkers Across Neurodegenerative Diseases (BAND) grant from the Michael J. Fox Foundation/Alzheimer’s Association/Weston Institute. A.C.P. is additionally supported by the Parker Family Chair, the Chan Zuckerberg Initiative Neurodegeneration Challenge Network, and the AHA/Allen Brain Health Initiative.
Competing interests
M.D.O. and A.C.P. are the inventors of a provisional patent submitted to the University of Pennsylvania that relates to targeting GPNMB as a potential therapeutic in Parkinson’s Disease.
Ethical considerations
The study of brain samples from autopsy specimens is not considered human subjects’ research. However, informed consent to brain donation was obtained from all subjects prior to death, with consent verified at the time of death by the guardian/next of kin.
References
- Andrews, S. (2010). FastQC: A Quality Control Tool for High Throughput Sequence Data [online]. Accessed: 12 July 2021.
- Benjamini, Y. and Hochberg, Y. (1995). Controlling the False Discovery Rate: A Practical and Powerful Approach to Multiple Testing. J. R. Stat. Soc. B. 57(1): 289–300.
- Bolger, A. M., Lohse, M. and Usadel, B. (2014). Trimmomatic: a flexible trimmer for Illumina sequence data. Bioinformatics 30(15): 2114–2120.
- Carlson, M. and Maintainer, B. P. (2015). TxDb.Hsapiens.UCSC.hg19.knownGene: Annotation package for TxDb object(s). R package.
- Chen-Plotkin, A. S., Geser, F., Plotkin, J. B., Clark, C. M., Kwong, L. K., Yuan, W., Grossman, M., Van Deerlin, V. M., Trojanowski, J. Q., Lee, V. Y., et al. (2008). Variations in the progranulin gene affect global gene expression in frontotemporal lobar degeneration. Hum. Mol. Genet. 17(10): 1349–1362.
- Diaz-Ortiz, M. E., Seo, Y., Posavi, M., Carceles Cordon, M., Clark, E., Jain, N., Charan, R., Gallagher, M. D., Unger, T. L., Amari, N., et al. (2022). GPNMB confers risk for Parkinson’s disease through interaction with α-synuclein. Science 377(6608): eabk0637.
- Dobin, A. and Gingeras, T. R. (2016). Optimizing RNA-Seq Mapping with STAR. In: Carugo, O. and Eisenhaber, F. (Eds.). Data Mining Techniques for the Life Sciences (pp. 245–262). Methods in Molecular Biology. Humana Press, New York.
- van de Geijn, B., McVicker, G., Gilad, Y. and Pritchard, J. K. (2015). WASP: allele-specific software for robust molecular quantitative trait locus discovery. Nat. Methods 12(11): 1061–1063.
- GTEx Consortium (2017). Genetic effects on gene expression across human tissues. Nature 550(7675): 204–213.
- Mayba, O., Gilbert, H. N., Liu, J., Haverty, P. M., Jhunjhunwala, S., Jiang, Z., Watanabe, C. and Zhang, Z. (2014). MBASED: allele-specific expression detection in cancer tissues and cell lines. Genome Biol. 15(8): e1186/s13059-014-0405-3.
- Mercer, T. R., Clark, M. B., Crawford, J., Brunck, M. E., Gerhardt, D. J., Taft, R. J., Nielsen, L. K., Dinger, M. E. and Mattick, J. S. (2014). Targeted sequencing for gene discovery and quantification using RNA CaptureSeq. Nat. Protoc. 9(5): 989–1009.
- Obenchain, V., Lawrence, M., Carey, V., Gogarten, S., Shannon, P. and Morgan, M. (2014). VariantAnnotation: a Bioconductor package for exploration and annotation of genetic variants. Bioinformatics 30(14): 2076–2078.
Supplementary information
The following supporting information can be downloaded here:- Allele specific expression workflow.sh
- MBASED beta-binomial with overdispersion GPNMB unphased with simulations.R
- Scripts inWORDformat 6 28 23
- Table S1. ASEProtocol
- Table S2. rs199355 Allele Counts in special cases
Article Information
Copyright
© 2023 The Author(s); This is an open access article under the CC BY-NC license (https://creativecommons.org/licenses/by-nc/4.0/).
How to cite
Readers should cite both the Bio-protocol article and the original research article where this protocol was used:
- Diaz-Ortiz, M. E., Jain, N., Gallagher, M. D., Posavi, M., Unger, T. L. and Chen-Plotkin, A. S. (2023). Testing for Allele-specific Expression from Human Brain Samples. Bio-protocol 13(19): e4832. DOI: 10.21769/BioProtoc.4832.
- Diaz-Ortiz, M. E., Seo, Y., Posavi, M., Carceles Cordon, M., Clark, E., Jain, N., Charan, R., Gallagher, M. D., Unger, T. L., Amari, N., et al. (2022). GPNMB confers risk for Parkinson’s disease through interaction with α-synuclein. Science 377(6608): eabk0637.
Category
Neuroscience > Nervous system disorders > Parkinson's disease
Molecular Biology > RNA > RNA sequencing
Systems Biology > Genomics > Sequencing
Do you have any questions about this protocol?
Post your question to gather feedback from the community. We will also invite the authors of this article to respond.