- Protocols

- Articles and Issues
- For Authors
- About
- Become a Reviewer

A qPCR Method to Distinguish between Expression of Transgenic and Endogenous Copies of Genes
Published: Vol 13, Iss 15, Aug 5, 2023 DOI: 10.21769/BioProtoc.4784 Views: 1772
Reviewed by: Anonymous reviewer(s)
Original research article
The authors used this protocol in:

Sep 2022
Advertisement


Protocol Collections
Comprehensive collections of detailed, peer-reviewed protocols focusing on specific topics


Related protocols
Abstract
Study of gene function in eukaryotes frequently requires data on the impact of the gene when it is expressed as a transgene, such as in ectopic or overexpression studies. Currently, the use of transgenic constructs designed to achieve these aims is often hampered by the difficulty in distinguishing between the expression levels of the endogenous gene and its transgene equivalent, which may involve either laborious microdissection to isolate specific cell types or harvesting tissue at narrow timepoints. To address this challenge, we have exploited a feature of the Golden Gate cloning method to develop a simple, restriction digest–based protocol to differentiate between expression levels of transgenic and endogenous gene copies. This method is straightforward to implement when the endogenous gene contains a Bpi1 restriction site but, importantly, can be adapted for most genes and most other cloning strategies.
Key features
• This protocol was developed to determine the expression level of an ectopically expressed transcription factor with broad native expression in all surrounding tissues.
• The method described is most directly compatible with Golden Gate cloning but is, in principle, compatible with any cloning method.
• The protocol has been developed and validated in the model plant Arabidopsis thaliana but is applicable to most eukaryotes.
Graphical overview
Background
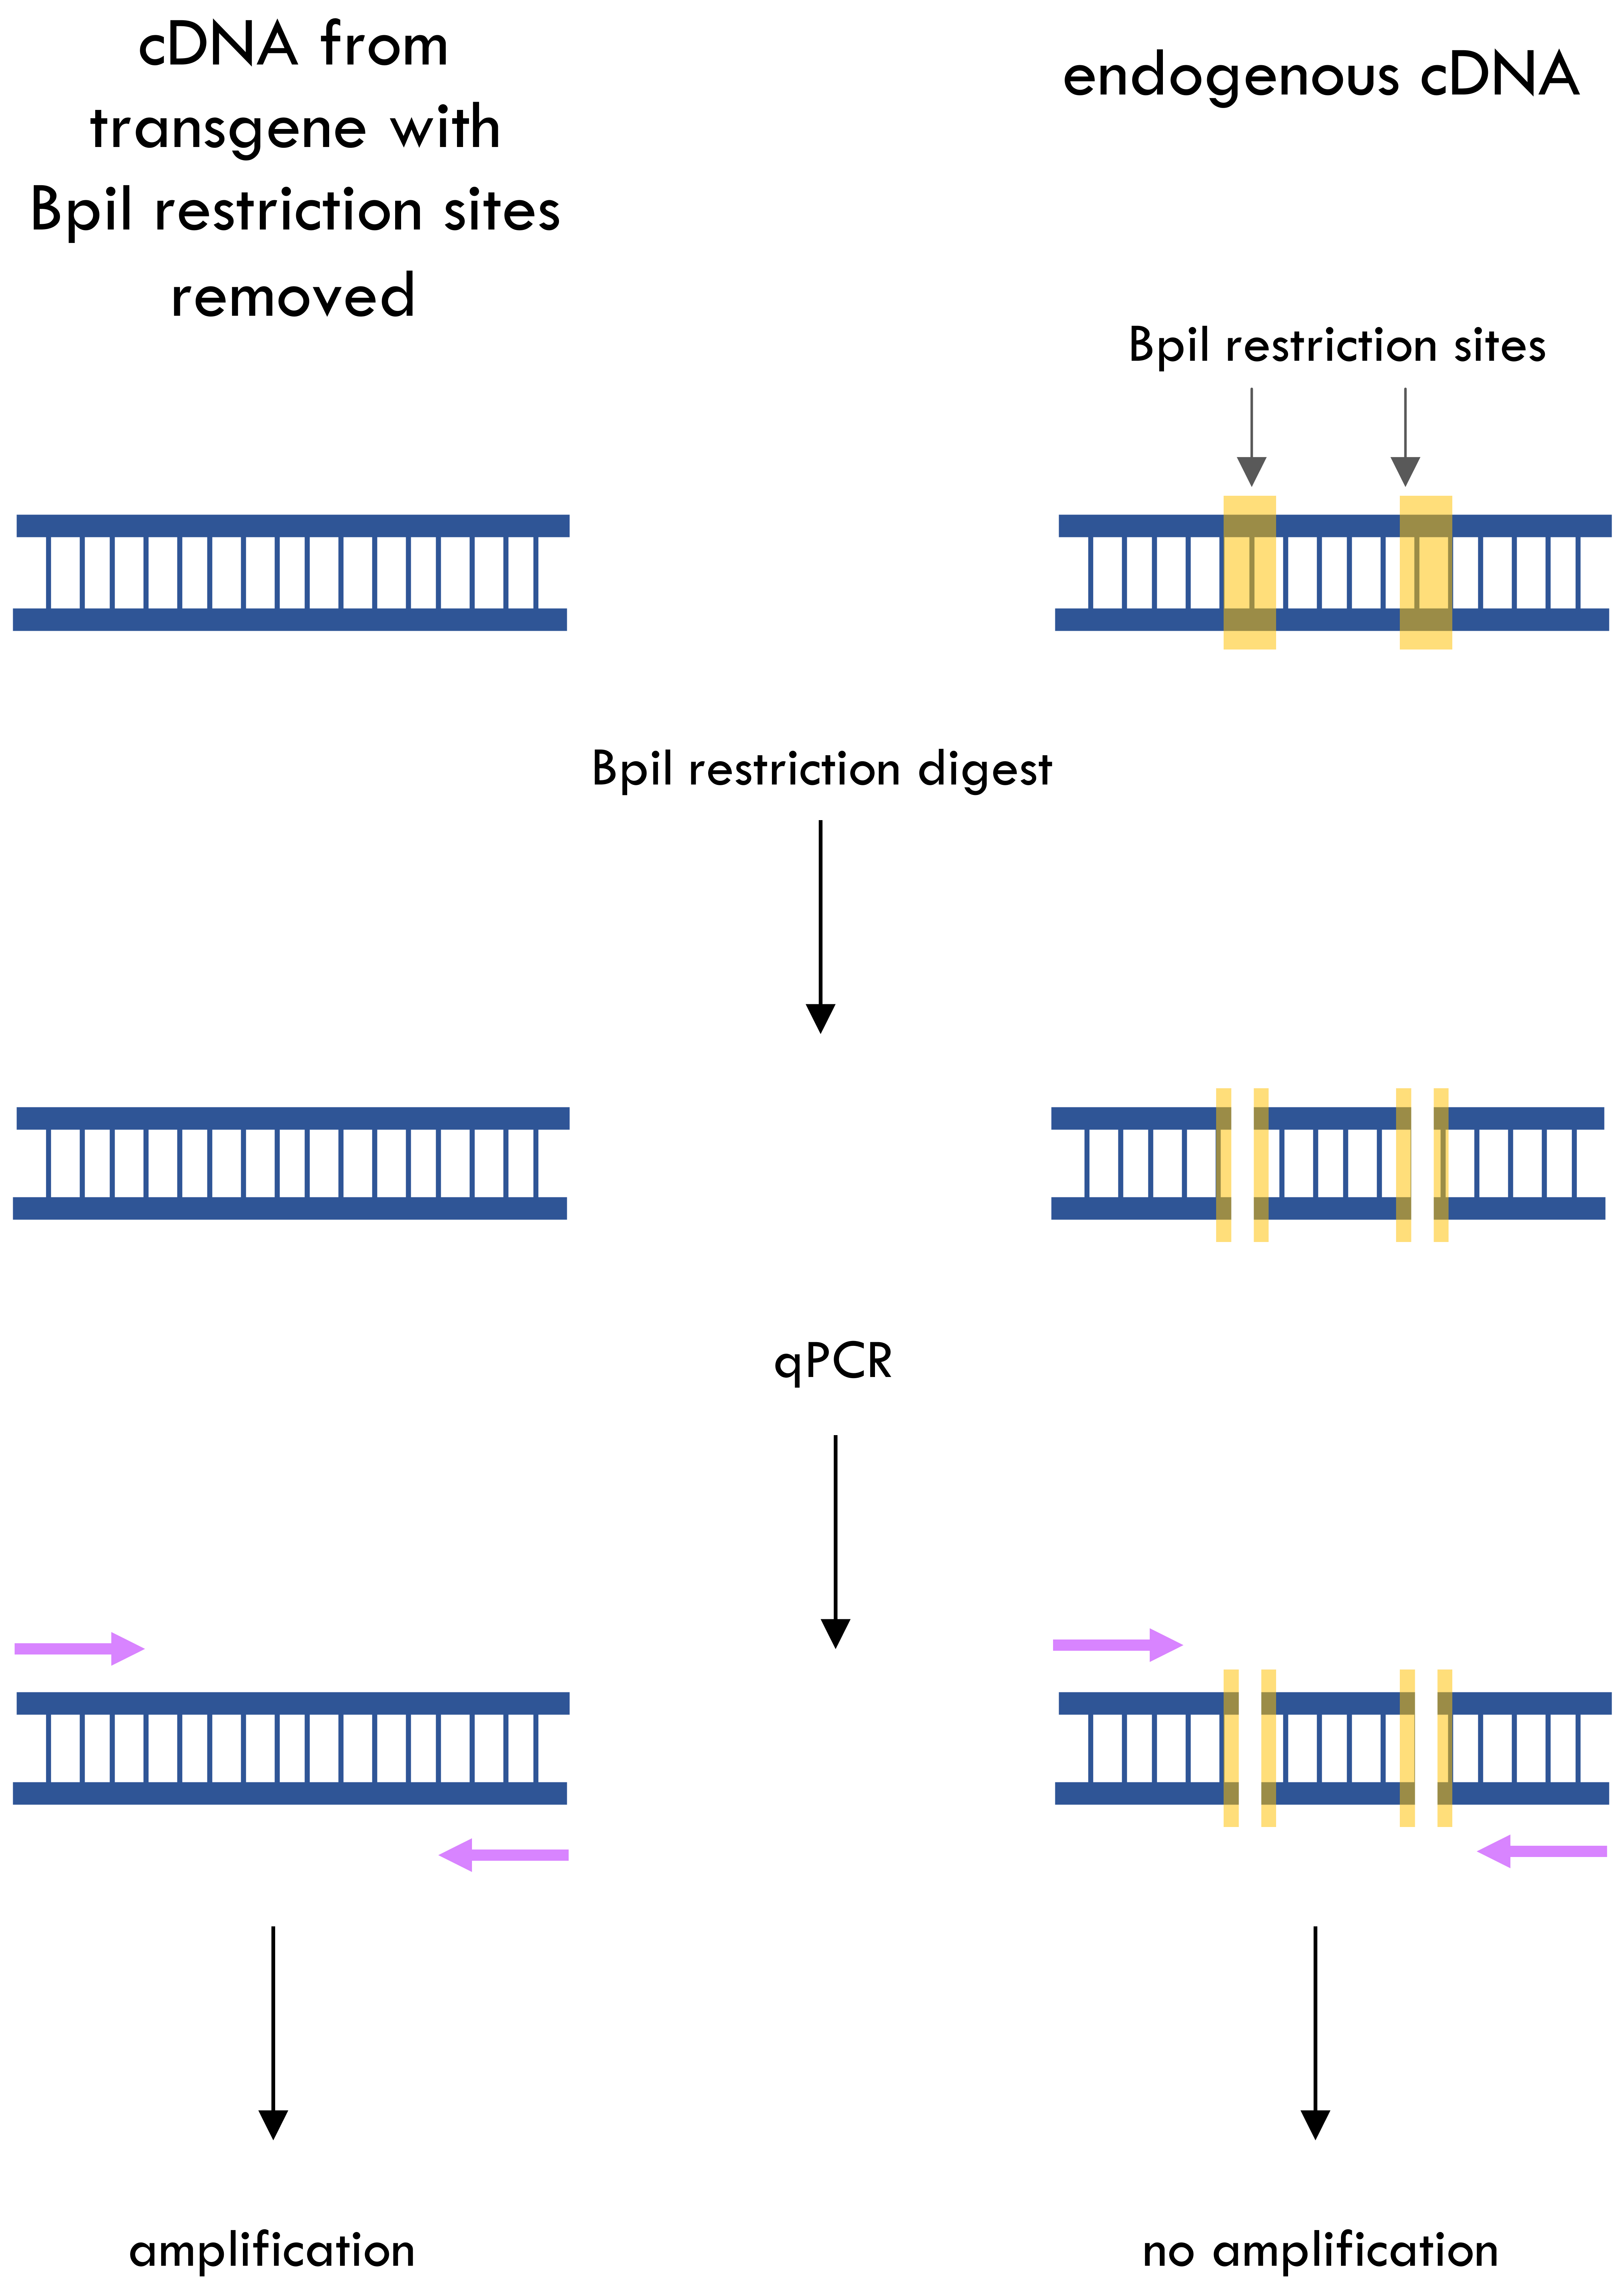
Quantifying specific spatial or temporal expression of a transgenically expressed endogenous gene against a background of high or overlapping expression of the native endogenous sequence remains a long-standing problem in eukaryotic molecular research. To overcome this, we have developed a protocol based on the introduction of a synonymous mutation into the transgenic copy of the endogenous gene to remove a restriction enzyme cleavage site. This is frequently a feature of the assembly of Golden Gate Cloning constructs (the so-called domestication process, involving excision of key Type IIS restriction nuclease sites) (Engler et al., 2008; Weber et al., 2011). This restriction site difference can then be exploited to differentiate between endogenous and transgenic expression by digesting complementary DNA (cDNA) from transgenic individuals with the relevant restriction enzyme, which will cleave endogenous cDNA but will leave the transgene cDNA uncut. Misexpression of an endogenous gene in a tissue where it is not normally expressed using a cell type–specific promoter is a commonly used experimental technique (Prelich, 2012). However, if that cell type is temporally or spatially difficult to isolate, it can be challenging to determine accurately the levels of overexpression that have been achieved without technically complex and laborious dissection. The protocol removes the need to isolate the specific cell types to confirm expression but instead allows this to be done on RNA extracted from bulk tissues.
Essentially, the protocol set out below involves making a domesticated version of the transgene missing a restriction site present in the endogenous sequence and transforming it into the organism under study. Following RNA extraction and standard reverse transcription, an additional digestion step is introduced whereby the cDNA is restricted using the enzyme targeting the site now only present in cDNA from the endogenous gene. Subsequent qPCR, using primers amplifying a region of the gene containing the restriction site, will thus only amplify cDNA specific to the transgene, leaving the endogenous cDNA unaffected—since it can no longer serve as a template for amplification. qPCR on this digested cDNA using primers amplifying a region of a housekeeping gene that does not contain the restriction site allows the calculation of relative expression levels using the 2-ΔΔC(T) method (Livak and Schmittgen, 2001). Although this protocol is simplest to implement in cases where Golden Gate cloning is used and an endogenous Bpi1 restriction enzyme cut site has been removed, with planning during cloning this same principle can also be adapted to any other cloning strategy by the introduction of a synonymous mutation that removes a restriction enzyme cleavage site from the transgene. Overall, this technique allows very rapid and accurate estimation of the transgene expression level, as negligible endogenous cDNA survives cleavage and thus expression levels detected by qPCR reflect only the transgene. cDNA from wildtype organisms can, of course, be used to determine approximate control levels of endogenous gene expression and, in the case of inducible transgenes, a more accurate estimate of endogenous gene expression can be obtained by sampling cDNA from uninduced tissue.
This method was developed by Bezodis et al. (2022) to detect expression from inducible constructs that ectopically express high levels of homeodomain transcription factors in a spatially and temporally restricted region of the germline lineage of the model plant Arabidopsis thaliana. While the transcription factors of interest are normally not expressed in the germline, they are expressed significantly throughout the surrounding somatic tissues. These endogenous transcripts thus constitute a major component of the RNA collected from whole tissues but, by digesting cDNA from the endogenous gene copy carrying the functional restriction site, this method avoids the laborious task of dissecting out cells in which only the transgene is expressed. The combination of this qPCR strategy and the use of imaging markers has permitted both the location and extent of transgene expression to be accurately determined using promoters driving expression in specific germline cell types over a short period. We have found the use of an inducible system to be particularly helpful, as it provides a control expression level to confirm that the digest has worked effectively at removing expression of the endogenous gene and matching construct-driven expression to observed phenotypes (Bezodis et al., 2022). Induction uses a two-component LhGR/pOp6 expression system (Craft et al., 2005) and a protocol for this system has been published (Samalova et al., 2019), including for use in reproductive tissues (Schubert et al., 2022). We note, however, that the protocol does not require an inducible system, nor is it limited to Arabidopsis or, in fact, to plants.
Materials and reagents
Biological materials
Gene synthesis; GeneArt Gene Synthesis (Thermo Fisher Scientific, UK)
Laboratory supplies
RNeasy Plant Mini kit (Qiagen, catalog number: 74904)
RNase-free DNase set (Qiagen, catalog number: 79254)
Bpi1 (Bbs1) restriction enzyme (Thermo Fisher Scientific, catalog number: ER1011)
qPCRBIO cDNA synthesis kit (PCR Biosystems Ltd, catalog number: PB30.11-10)
SuperScriptTM IV First-Strand Synthesis System (Thermo Fisher Scientific, catalog number: 18091050)
qPCR SyGreen Mix (PCR Biosystems Ltd, catalog number: PB20.12-05)
qPCR plates (Applied Biosystems, Thermo Fisher Scientific, catalog number: 4346906)
Microamp Fast Optical 96-well reaction plates with barcode (Thermo Fisher Scientific, catalog number 4346906)
Adhesive PCR plate seals (Thermo Scientific, catalog number: AB-0558)
Equipment
MiniAmp thermal cycler (Thermo Fisher Scientific)
StepOnePlus real-time PCR system (Applied Biosystems, Thermo Fisher Scientific)
NanoDrop (Thermo Scientific, Labtech, ND1000, Thermo Fisher Scientific)
Software
Construct design and sequence analysis was carried out using SnapGene software (www.snapgene.com); a plasmid editor, ApE, is a suitable freely available alternative (Davis and Jorgensen, 2022)
qPCR data analysis was performed using Thermo Fisher Data Connect Design & Analysis Software
Procedure
Transgene design
Key to this method is the removal of a Bpi1 restriction site from the coding region of the gene that is to be expressed as a transgene. This is frequently required for Golden Gate cloning (Engler et al., 2008; Weber et al., 2011) and has been described in previous protocols (Engler and Marillonnet, 2014). For other cloning methods, any suitable restriction site(s) can be removed.
RNA extraction, cDNA synthesis, qPCR
This step is only relevant if using the inducible system as in Bezodis et al. (2022). This protocol may be used for any system in which a transgenic copy of an endogenous gene is expressed.
Our validation experiments on Arabidopsis thaliana (described below) utilised an inducible expression system active in inflorescences (Bezodis et al., 2022; Schubert et al., 2022). At least four biological replicates are recommended for achieving highly reproducible results.
Select Arabidopsis plants with at least four inflorescence apices; mark two inflorescences for pre-induction and two for post-induction expression, with small pieces of tape of different colours.
Collect the two pre-induction inflorescence apices, harvesting all buds that have not clearly been fertilised. Snap freeze in liquid nitrogen and store at -80 °C until all samples are ready for RNA extraction.
Apply induction as described (Schubert et al., 2022) to the other two marked inflorescences, harvested 18 h after induction.
Extract RNA using the method appropriate for the system being used. For the work in which this method was developed, RNeasy Plant Mini kit with on-column DNA digest was used, following manufacturer’s recommended methods (Note 1).
Synthesize cDNA from the resultant RNA. The qPCRBIO cDNA synthesis kit and SuperScript IV Reverse Transcriptase have been tested; the resultant cDNA, following manufacturer’s recommended protocol, proved suitable for use with this method.
cDNA digestion:
Determine approximate cDNA concentration by NanoDrop (Note 2).
Dilute cDNA to 250 ng/μL in molecular biology grade water (Note 3).
Digest cDNA in 96-well PCR plates in 20 μL reactions as below (Table 1):
Table 1. Components for cDNA Restriction Digest
Component Volume 250 ng/μL diluted cDNA 14 μL Bpi1 4 μL 10× digestion buffer 2 μL Mix by pipetting and spin down plates in a plate centrifuge at ~1,200× g for 30 s.
Perform digestion in a thermocycler as below, with lid temperature 103 °C (Table 2).
Table 2. Thermocycler run for cDNA Restriction Digest
Thermocycler step Step 1 Step 2 Step 3 Duration 8 h 20 min hold Temperature 37 °C 65 °C 4 °C
Primer design and qPCR
Primer design
Primers are needed to amplify an endogenous control housekeeping gene and the gene of interest. The amplification product should be in the region of 70–200 bp with an annealing temperature of > 60 °C.
For the housekeeping gene, such as ubiquitin or tubulin, the region amplified should not contain a Bpi1 site (or other restriction enzymes being used), whilst for the gene of interest the region amplified must contain a region that contains a Bpi1 (or other restriction enzyme) site in the endogenous copy that has been removed as described in section A. Selection of housekeeping genes as controls for qPCR has been discussed previously (Czechowski et al., 2005) and depends on the aims of the specific experiment and tissue being used (Dekkers et al., 2012). Protocol validation by Bezodis et al. (2022) used AtUBQ10 (AT4G05320), which is more stable than some other commonly used reference genes (Czechowski et al., 2005).
Once a suitable region for amplification has been chosen, optimal primers can be designed using primer3 (primer3.ut.ee) (Untergasser et al., 2012).
qPCR reaction
Perform qPCR in Microamp Fast Optical 96-well reaction plates with Adhesive PCR plate seals in either 10 or 20 μL reactions; for the latter, volumes below should be doubled (Table 3).
Table 3. Components for qPCR
Component Volume Digested cDNA 1 μL 2× SyGreen qPCR Master Mix 5 μL 10 μM forward primer and 10 μM reverse primer stock solution 1 μL Molecular biology grade water 3 μL Perform qPCR on a StepOnePlus real-time PCR system programmed as shown below (Table 4). A melt curve is used to check primer specificity. Lid temperature set to 103 °C.
Table 4. Real-time PCR system run for qPCR
Thermocycler step Step 1 Step 2 Duration 3 min 15 s 30 s Temperature 95 °C 95 °C 60 °C Number of cycles 1 40
Data analysis
qPCR data are analysed either by manual calculation using Excel or more easily with Thermo Fisher Data Connect Design & Analysis Software, which allows quantification of expression using the 2-ΔΔC(T) method (Livak and Schmittgen, 2001). The level of expression of the transgene from digested cDNA is normalised to the level of housekeeping gene used. As described, it is important that the region of the housekeeping gene amplified does not include a restriction enzyme target and, if properly designed as described, the analysis will be no different to any other qPCR experiment. It is important to use the number of biological replicates as the sample size for statistical analyses, as the technical replicates should be averaged and used only to ensure values from the same sample are similar. Various methods of analysis of qPCR data are available, which have been reviewed by Pabinger et al. (2014). Application of this protocol does not change the data analysis.
Notes
Numerous kits from different manufacturers are available and method should follow manufacturer’s recommended protocol.
Sufficient cDNA is needed for at least six qPCR reactions to allow the amplification of a control housekeeping gene for normalisation and the transgenically expressed endogenous gene of interest, at least in triplicate for technical replicates. This is in addition to the biological replicates described in point B1.
This concentration must be lower than the concentration of the most diluted sample; otherwise, RNA extraction and cDNA synthesis should be repeated.
Validation of protocol
Data validating this protocol can be found in our preprint Bezodis et al. (2022) deposited on bioRxiv at doi.org/10.1101/2022.09.15.508103; relevant data are shown in Figure 1D–1G.
Acknowledgments
We thank Vinay Shukla for help with operation of the qPCR machine and data analysis methods and Jasmine Staples for help designing the graphical overview. This work was carried out and funded as part of an Mbiol masters project in the Department of Plant Sciences (now Department of Biology), University of Oxford.
Competing interests
We have no competing interests.
References
- Bezodis, W., Prescott, H. and Dickinson, H. (2022). Misexpression of the Homologues of Bryophyte Gametophyte-to-Sporophyte Control Genes in Arabidopsis Results in Germline Reprogramming and Phenotypes that Mirror Apomictic Development. bioRxiv: e508103.
- Craft, J., Samalova, M., Baroux, C., Townley, H., Martinez, A., Jepson, I., Tsiantis, M. and Moore, I. (2005). New pOp/LhG4 vectors for stringent glucocorticoid-dependent transgene expression in Arabidopsis. Plant J. 41(6): 899–918.
- Czechowski, T., Stitt, M., Altmann, T., Udvardi, M. K. and Scheible, W. R. (2005). Genome-Wide Identification and Testing of Superior Reference Genes for Transcript Normalization in Arabidopsis. Plant Physiol. 139(1): 5–17.
- Davis, M. W. and Jorgensen, E. M. (2022). ApE, A Plasmid Editor: A Freely Available DNA Manipulation and Visualization Program. Front. Bioinf. 2: e818619.
- Dekkers, B. J. W., Willems, L., Bassel, G. W., van Bolderen-Veldkamp, R. P., Ligterink, W., Hilhorst, H. W. M. and Bentsink, L. (2012). Identification of Reference Genes for RT–qPCR Expression Analysis in Arabidopsis and Tomato Seeds. Plant Cell Physiol. 53(1): 28–37.
- Engler, C., Kandzia, R. and Marillonnet, S. (2008). A One Pot, One Step, Precision Cloning Method with High Throughput Capability. PLoS One 3(11): e3647.
- Engler, C. and Marillonnet, S. (2014). Golden Gate Cloning. In: Valla, S. and Lale, R. (Eds.). DNA Cloning and Assembly Methods (pp. 119–131). Methods in Molecular Biology. Humana Press, Totowa, NJ.
- Livak, K. J. and Schmittgen, T. D. (2001). Analysis of Relative Gene Expression Data Using Real-Time Quantitative PCR and the 2−ΔΔCT Method. Methods 25(4): 402–408.
- Pabinger, S., Rödiger, S., Kriegner, A., Vierlinger, K. and Weinhäusel, A. (2014). A survey of tools for the analysis of quantitative PCR (qPCR) data. Biomol. Detect. Quantif. 1(1): 23–33.
- Prelich, G. (2012). Gene Overexpression: Uses, Mechanisms, and Interpretation. Genetics 190(3): 841–854.
- Samalova, M., Kirchhelle, C. and Moore, I. (2019). Universal Methods for Transgene Induction Using the Dexamethasone‐Inducible Transcription Activation System pOp6/LhGR in Arabidopsis and Other Plant Species. Curr. Protoc. Plant Biol. 4(2): e20089.
- Schubert, J., Li, Y., Mendes, M. A., Fei, D., Dickinson, H., Moore, I. and Baroux, C. (2022). A procedure for Dex-induced gene transactivation in Arabidopsis ovules. Plant Methods 18(1): e1186/s13007–022–00879–x.
- Untergasser, A., Cutcutache, I., Koressaar, T., Ye, J., Faircloth, B. C., Remm, M. and Rozen, S. G. (2012). Primer3—new capabilities and interfaces. Nucleic Acids Res. 40(15): e115–e115.
- Weber, E., Engler, C., Gruetzner, R., Werner, S. and Marillonnet, S. (2011). A Modular Cloning System for Standardized Assembly of Multigene Constructs. PLoS One 6(2): e16765.
Article Information
Copyright
© 2023 The Author(s); This is an open access article under the CC BY-NC license (https://creativecommons.org/licenses/by-nc/4.0/).
How to cite
Bezodis, W., Prescott, H., Vlad, D. and Dickinson, H. (2023). A qPCR Method to Distinguish between Expression of Transgenic and Endogenous Copies of Genes. Bio-protocol 13(15): e4784. DOI: 10.21769/BioProtoc.4784.
Category
Molecular Biology > DNA > DNA cloning
Molecular Biology > DNA > Gene expression
Do you have any questions about this protocol?
Post your question to gather feedback from the community. We will also invite the authors of this article to respond.