- Protocols

- Articles and Issues
- For Authors
- About
- Become a Reviewer

LiverQuant: An Improved Method for Quantitative Analysis of Liver Pathology
Published: Vol 13, Iss 14, Jul 20, 2023 DOI: 10.21769/BioProtoc.4776 Views: 2764
Reviewed by: Masahiro MoritaAmr Galal Abdelraheem IbrahimNimesha Tadepalle

Protocol Collections
Comprehensive collections of detailed, peer-reviewed protocols focusing on specific topics


Related protocols
Abstract
Current means to quantify cells, gene expression, and fibrosis of liver histological slides are not standardized in the research community and typically rely upon data acquired from a selection of random regions identified in each slide. As such, analyses are subject to selection bias as well as limited subsets of available data elements throughout the slide. A whole-slide analysis of cells and fibrosis would provide for a more accurate and complete quantitative analysis, along with minimization of intra- and inter-experimental variables. Herein, we present LiverQuant, a method for quantifying whole-slide scans of digitized histologic images to render a more comprehensive analysis of presented data elements. After loading images and preparing the project in the QuPath program, researchers are provided with one to two scripts per analysis that generate an average intensity threshold for their staining, automated tissue annotation, and downstream detection of their anticipated cellular matrices. When compared with two standard methodologies for histological quantification, LiverQuant had two significant advantages: increased speed and a 50-fold greater tissue area coverage. Using publicly available open-source code (GitHub), LiverQuant improves the reliability and reproducibility of experimental results while reducing the time scientists require to perform bulk analysis of liver histology. This analytical process is readily adaptable by most laboratories, requires minimal optimization, and its principles and code can be optimized for use in other organs.
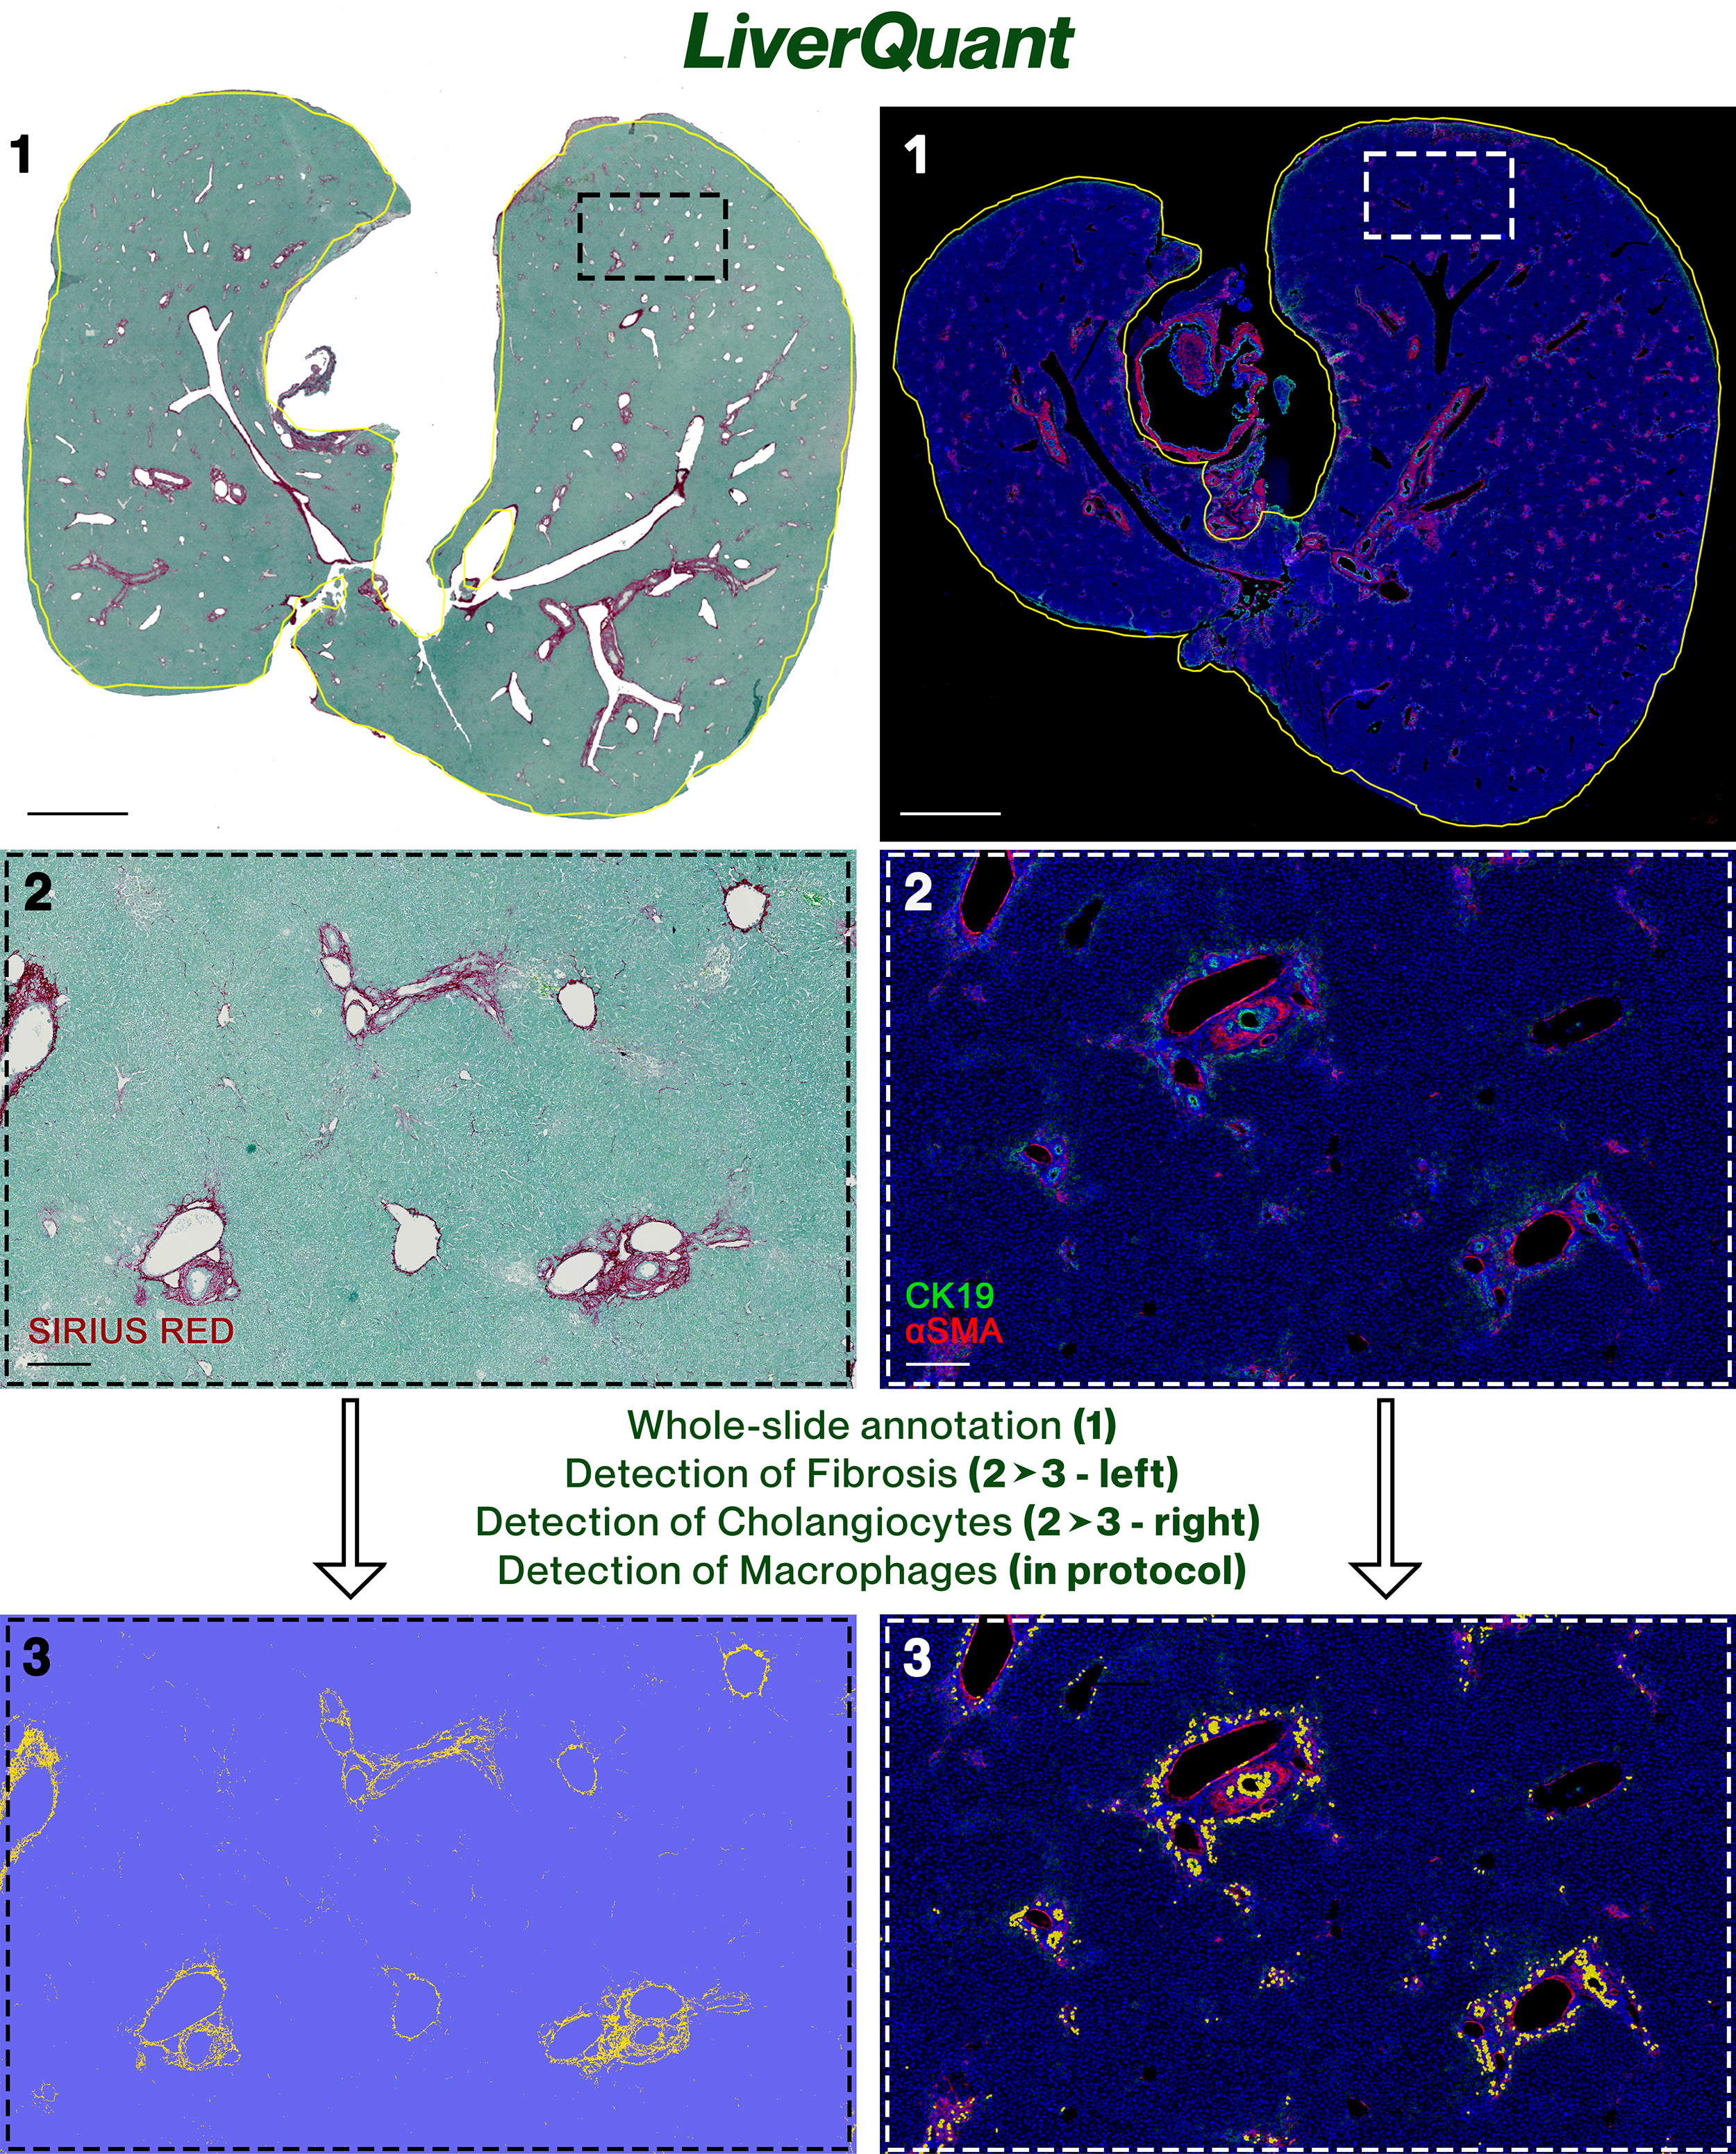
Graphical overview
Background
Histology is the use of immunodetection-based reagents to visualize cellular and extracellular compartments of tissue, usually via thin-slice light or fluorescent microscopic analysis. Histologic analysis is routinely applied daily in clinical and research settings and is considered essential for visually assessing the structure and pathology of the tissue under study. Advances in cell-based immunohistochemical and immunofluorescent detection protocols have led to multi-faceted progress in most biological fields (Kamimoto et al., 2020; Ramachandran et al., 2020; Tan et al., 2020; Taylor, 2020; Guilliams et al., 2022). Historically, light microscopy has been utilized by pathologists to determine disease etiology as well as determining the extent or degree of damage. More recently, there has been a need, more so in research settings, to provide quantitation of cellular infiltrates, proliferation, and cell-specific expression of selected protein markers, to define the cellular response to damage as well as to identify pathways of repair (Ben-Moshe and Itzkovitz, 2019; Saviano et al., 2020; Hu et al., 2022). The typical method of quantifying cells or fibrosis has been to randomly select regions of interest (ROI) and manually count cells or notable puncta (Abercrombie, 1946; Endo et al., 2002; Baratta et al., 2009; Vogel et al., 2015; Baghdasaryan et al., 2016; Husain et al., 2018). There are no standards for this approach but, by definition, there are inadvertent opportunities for significant regional cherry-picking, and as it does not take into account the entire tissue area of the slide, this method may not provide accurate quantitation (Baker, 2016; Murphy and Aguinis, 2022). Moreover, staining variation between and within slides, small sample sizes (< 1,000 detections/sample), extensive use of laboratory time, and no agreed-upon method all limit the utility and applicability of these methods between experiments and laboratories (Gurcan et al., 2009; Alturkistani et al., 2016; Bogen, 2019).
To address these issues, we focus on this over-arching problem using a specific model organ, the liver. The liver serves as the human body’s biofilter and can be highly reactive in response to disease, genetic predisposition, or external challenges (Nagy et al., 2020). The main cell types in the liver include parenchymal hepatocytes, liver sinusoidal endothelial cells, Kupffer cells/macrophages, cholangiocytes, and endothelium (Heymann and Tacke, 2016). Biomarkers of liver-related injury predominately present through the recruitment of F4/80+ macrophages, an increase in the extracellular production of collagen, and the rapid expansion of cholangiocytes (Fabris et al., 2019).
In this report, we present our experience with an automated whole-slide approach to quantify cells and fibrosis in standard liver slide histology termed LiverQuant. LiverQuant is a new customizable method that uses scripts written in QuPath to automate the detection of macrophages, fibrosis, and cholangiocytes in whole-slide scanned images of liver tissue. QuPath is a free, open-source program for analyzing pathology, and can be used by anyone with an efficient computer (Bankhead et al., 2017). Recently, LiverQuant methodology was used to quantitate various cell types and fibrosis in a novel genetic-based mouse model of biliary atresia, the liver conditional knockout of Pkd1l1 (Hellen et al., 2023).
While this protocol is intended for the detection of specific cell and extracellular markers within the liver, its principles and code can be optimized for use in other organs, within any species, and can be accomplished using either Mac or Windows-based computers.
Materials and reagents
CK19, 1:100 (DSHB, catalog number: TROMA-III)
Alpha-actin (αSMA), 1:250 (Sigma, catalog number: A2547)
F4/80, 1:300 (Cell Signaling, catalog number: CS70076)
Picosirius Red/Fast Green, KIT (Chondrex, catalog number: 9046)
2° Antibodies (immunofluorescence), 1–100 (Alexa Fluor® Invitrogen)
HRP, mouse (immunohistochemistry), 1–100 (Cell Signaling, catalog number: 8125)
SignalStain® DAB (immunohistochemistry), KIT (Cell Signaling, catalog number: 8059)
DAPI, 1:1,000 (Invitrogen, catalog number: D1306)
Equipment
Vectra Polaris Scanner
Note: Any microscope or scanner that can scan whole sections is sufficient.
Computer: tested and optimized with Precision 5820 (2021) with Intel 4.7 GHz processor, Nvidia Quadro RTX4000, 64 GB of RAM, 4 TB SSD, two 8 TB hard drives on RAID 0, and a 30" monitor. Additionally validated with MacBook Pro (2020), M1 processor, and 16 GB of RAM
Note: This protocol is achievable with computers/laptops that have less computing power.
Software
QuPath 0.4.2 open-source software (https://qupath.github.io/)
QuPath scripts are available at https://github.com/DominickHellen/LiverQuant
GraphPad Prism (https://www.graphpad.com)
Procedure
Immunohistochemistry and scanning
The method utilized for isolation, preparation, and scanning of liver sections will not be covered within this protocol. All mouse liver sections that were used for this method were fixed in a standard approach with paraformaldehyde, embedded in paraffin, sectioned at 5 μm thickness, and stained using the appropriate immunohistochemical techniques. Within this study, we will be using mouse sections that were stained using primary antibodies against cytokeratin 19 (cholangiocytes) with α-smooth muscle actin as an endothelial counterstain, F4/80 (macrophages), and picosirius red (collagen) with a Fast Green counterstain. For additional details see Hellen et al. (2023). All sections were imported into QuPath in NDPI file format taken using a Vectra Polaris scanner at 40× magnification. QuPath supports a bank of file extensions for importing, spanning greater than 150 different file formats. Prior to importing files for downstream analysis using QuPath, it is suggested to transfer the desired files onto the computer that will be used for quantification. This will aid in speed and processing time, as internal file access speed is typically the most rate-limiting factor in any of these analyses. It is additionally recommended that an entire cross-section (whole slide) is scanned into QuPath, rather than individual smaller ROIs.
Downloading GitHub files (https://github.com/DominickHellen/LiverQuant)
Navigate to the GitHub repository link.
Download the ZIP file of contents by clicking <> Code → Download ZIP (Figure 1A).
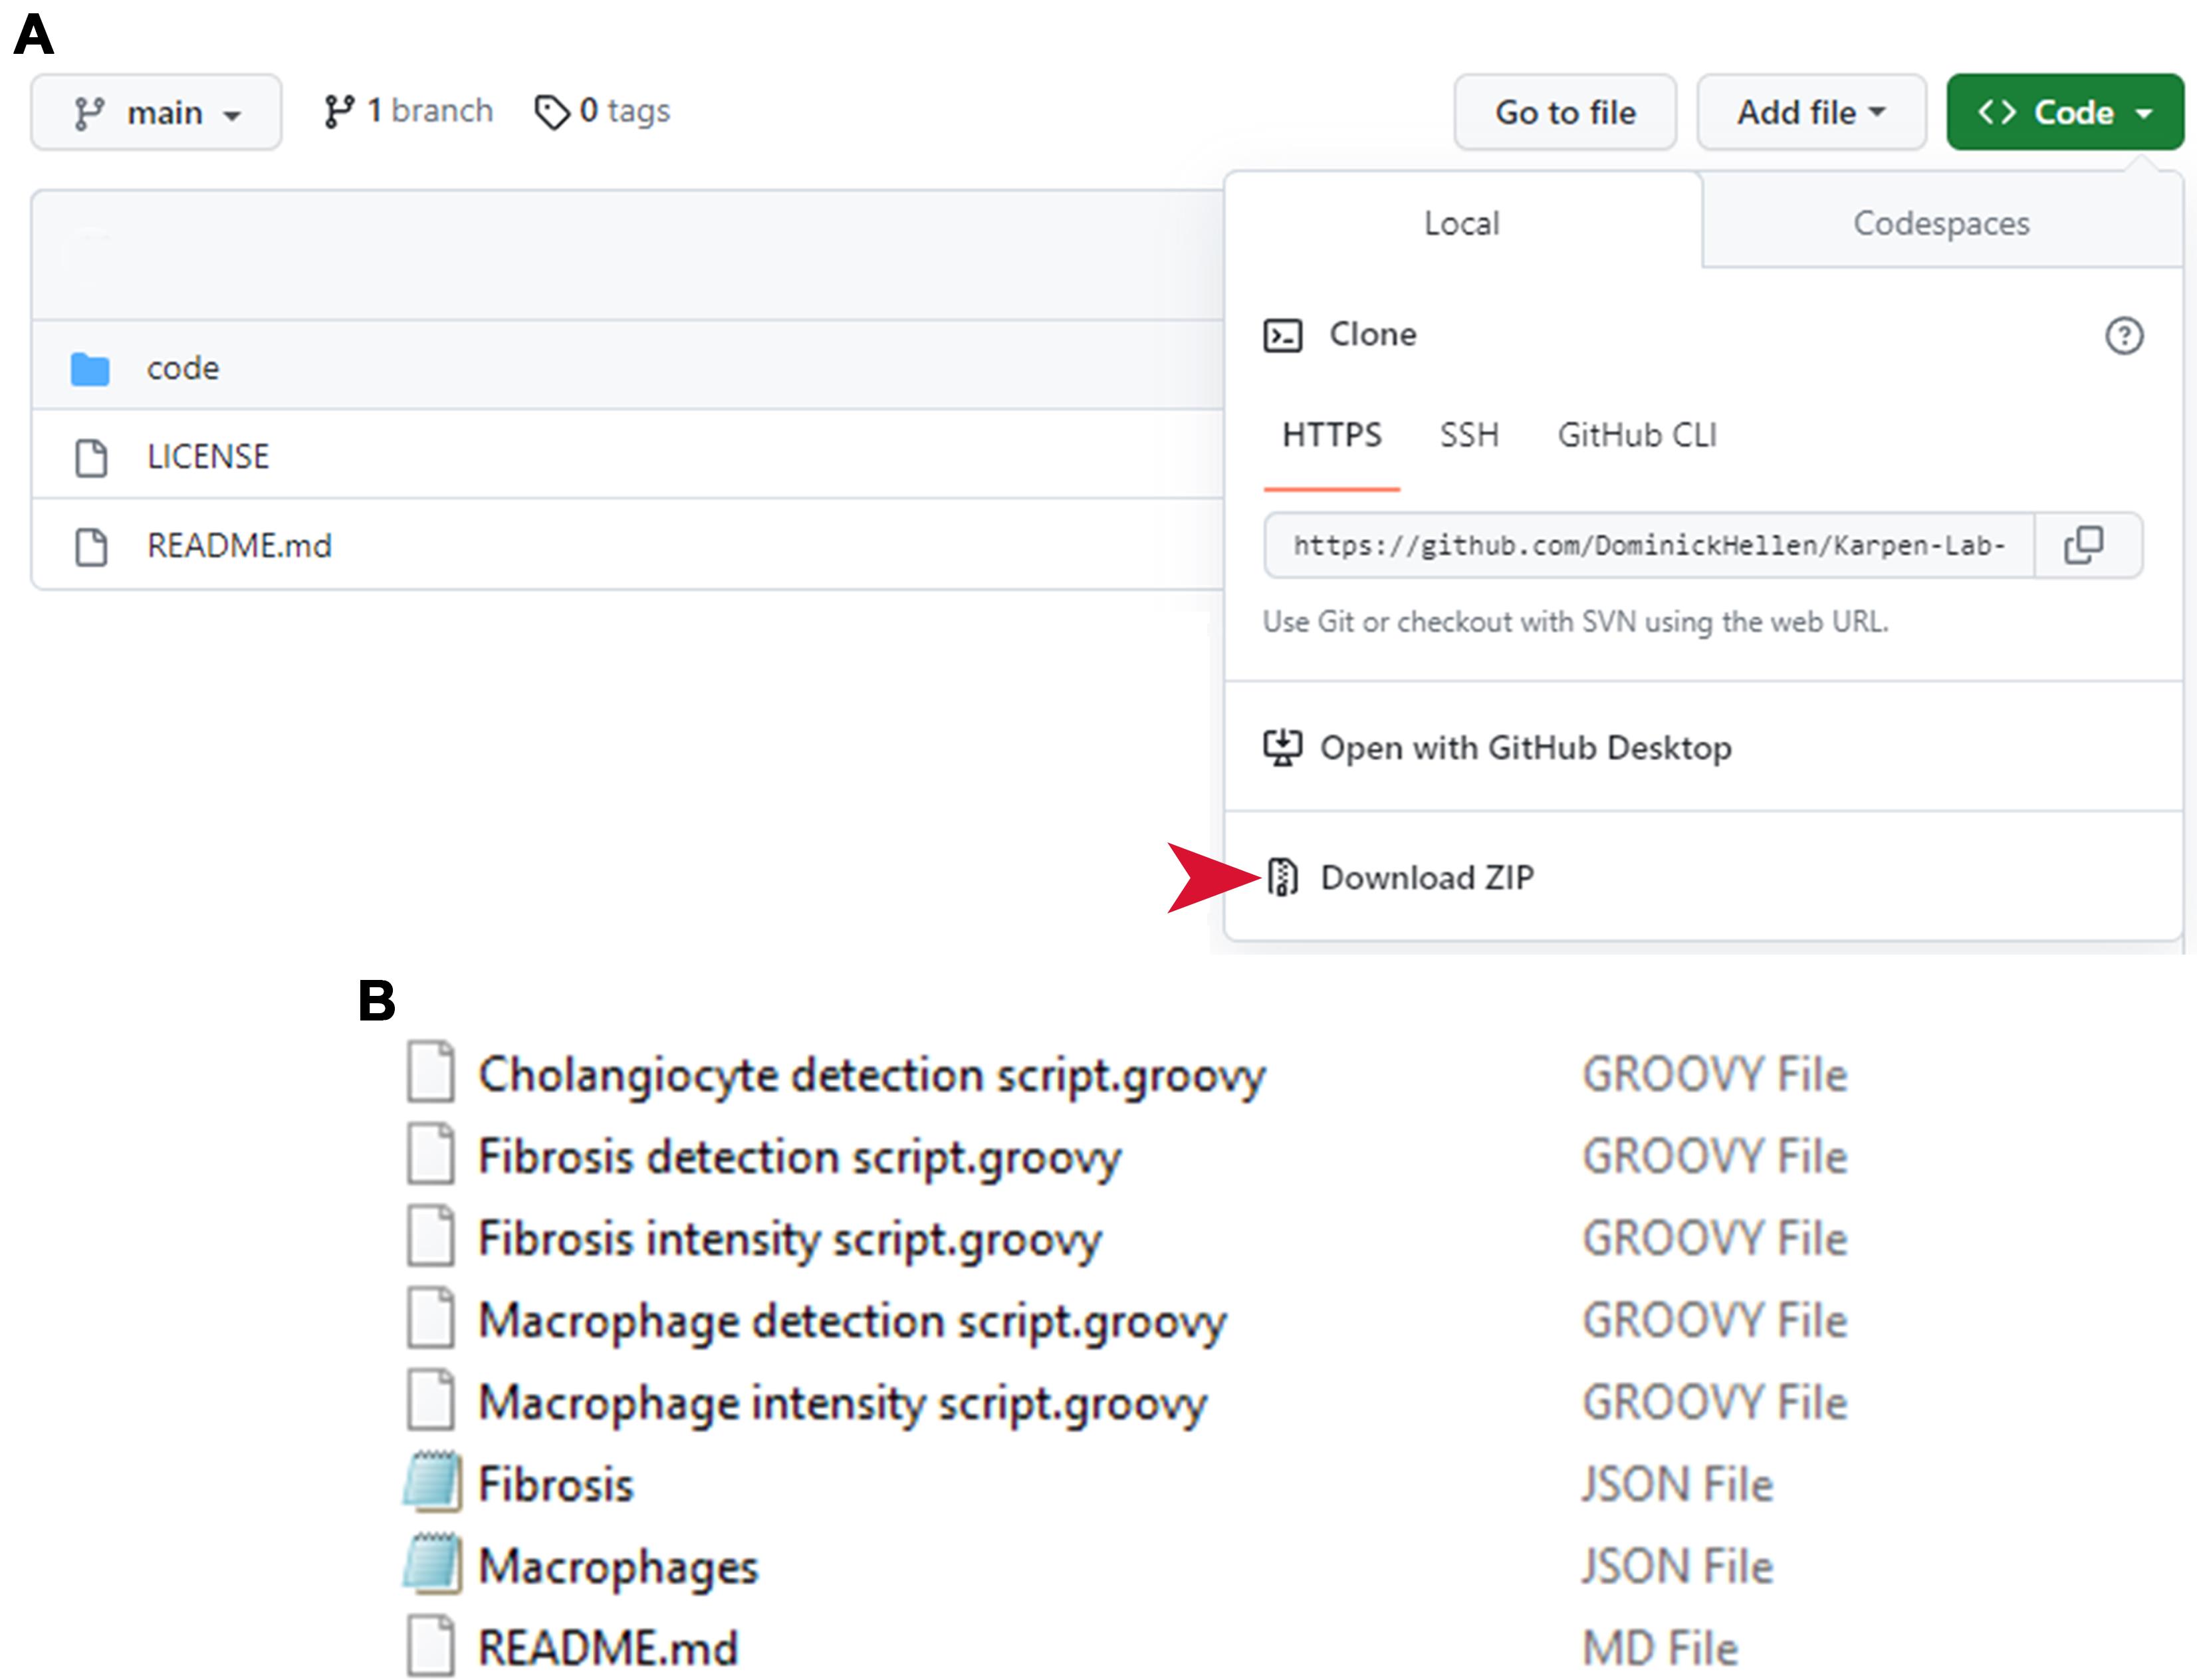
Figure 1. Retrieving LiverQuant files from GitHub. (A) All files necessary for the protocol are available for download online. The red arrow indicates exactly where to download the necessary files. B) All .GROOVY and .JSON files should be available for use after download and unzipping.Unpack ZIP files by right-clicking → Open.
All files for LiverQuant Bio-Protocol should be within the code folder (Figure 1B).
Preparing the project
Preparing a project in QuPath starts with creating a folder in a file manager of choice (e.g., Mac Finder, Windows File Explorer). To have all files of interest in the right place, it is better to create a folder on the computer and place all files within that folder.
Within the designated folder that contains all the files of interest, create another folder. This will be the hub that QuPath will use for all related paths and metadata (Figure 2A).
Note: Keep this folder empty and entitle it New Folder.
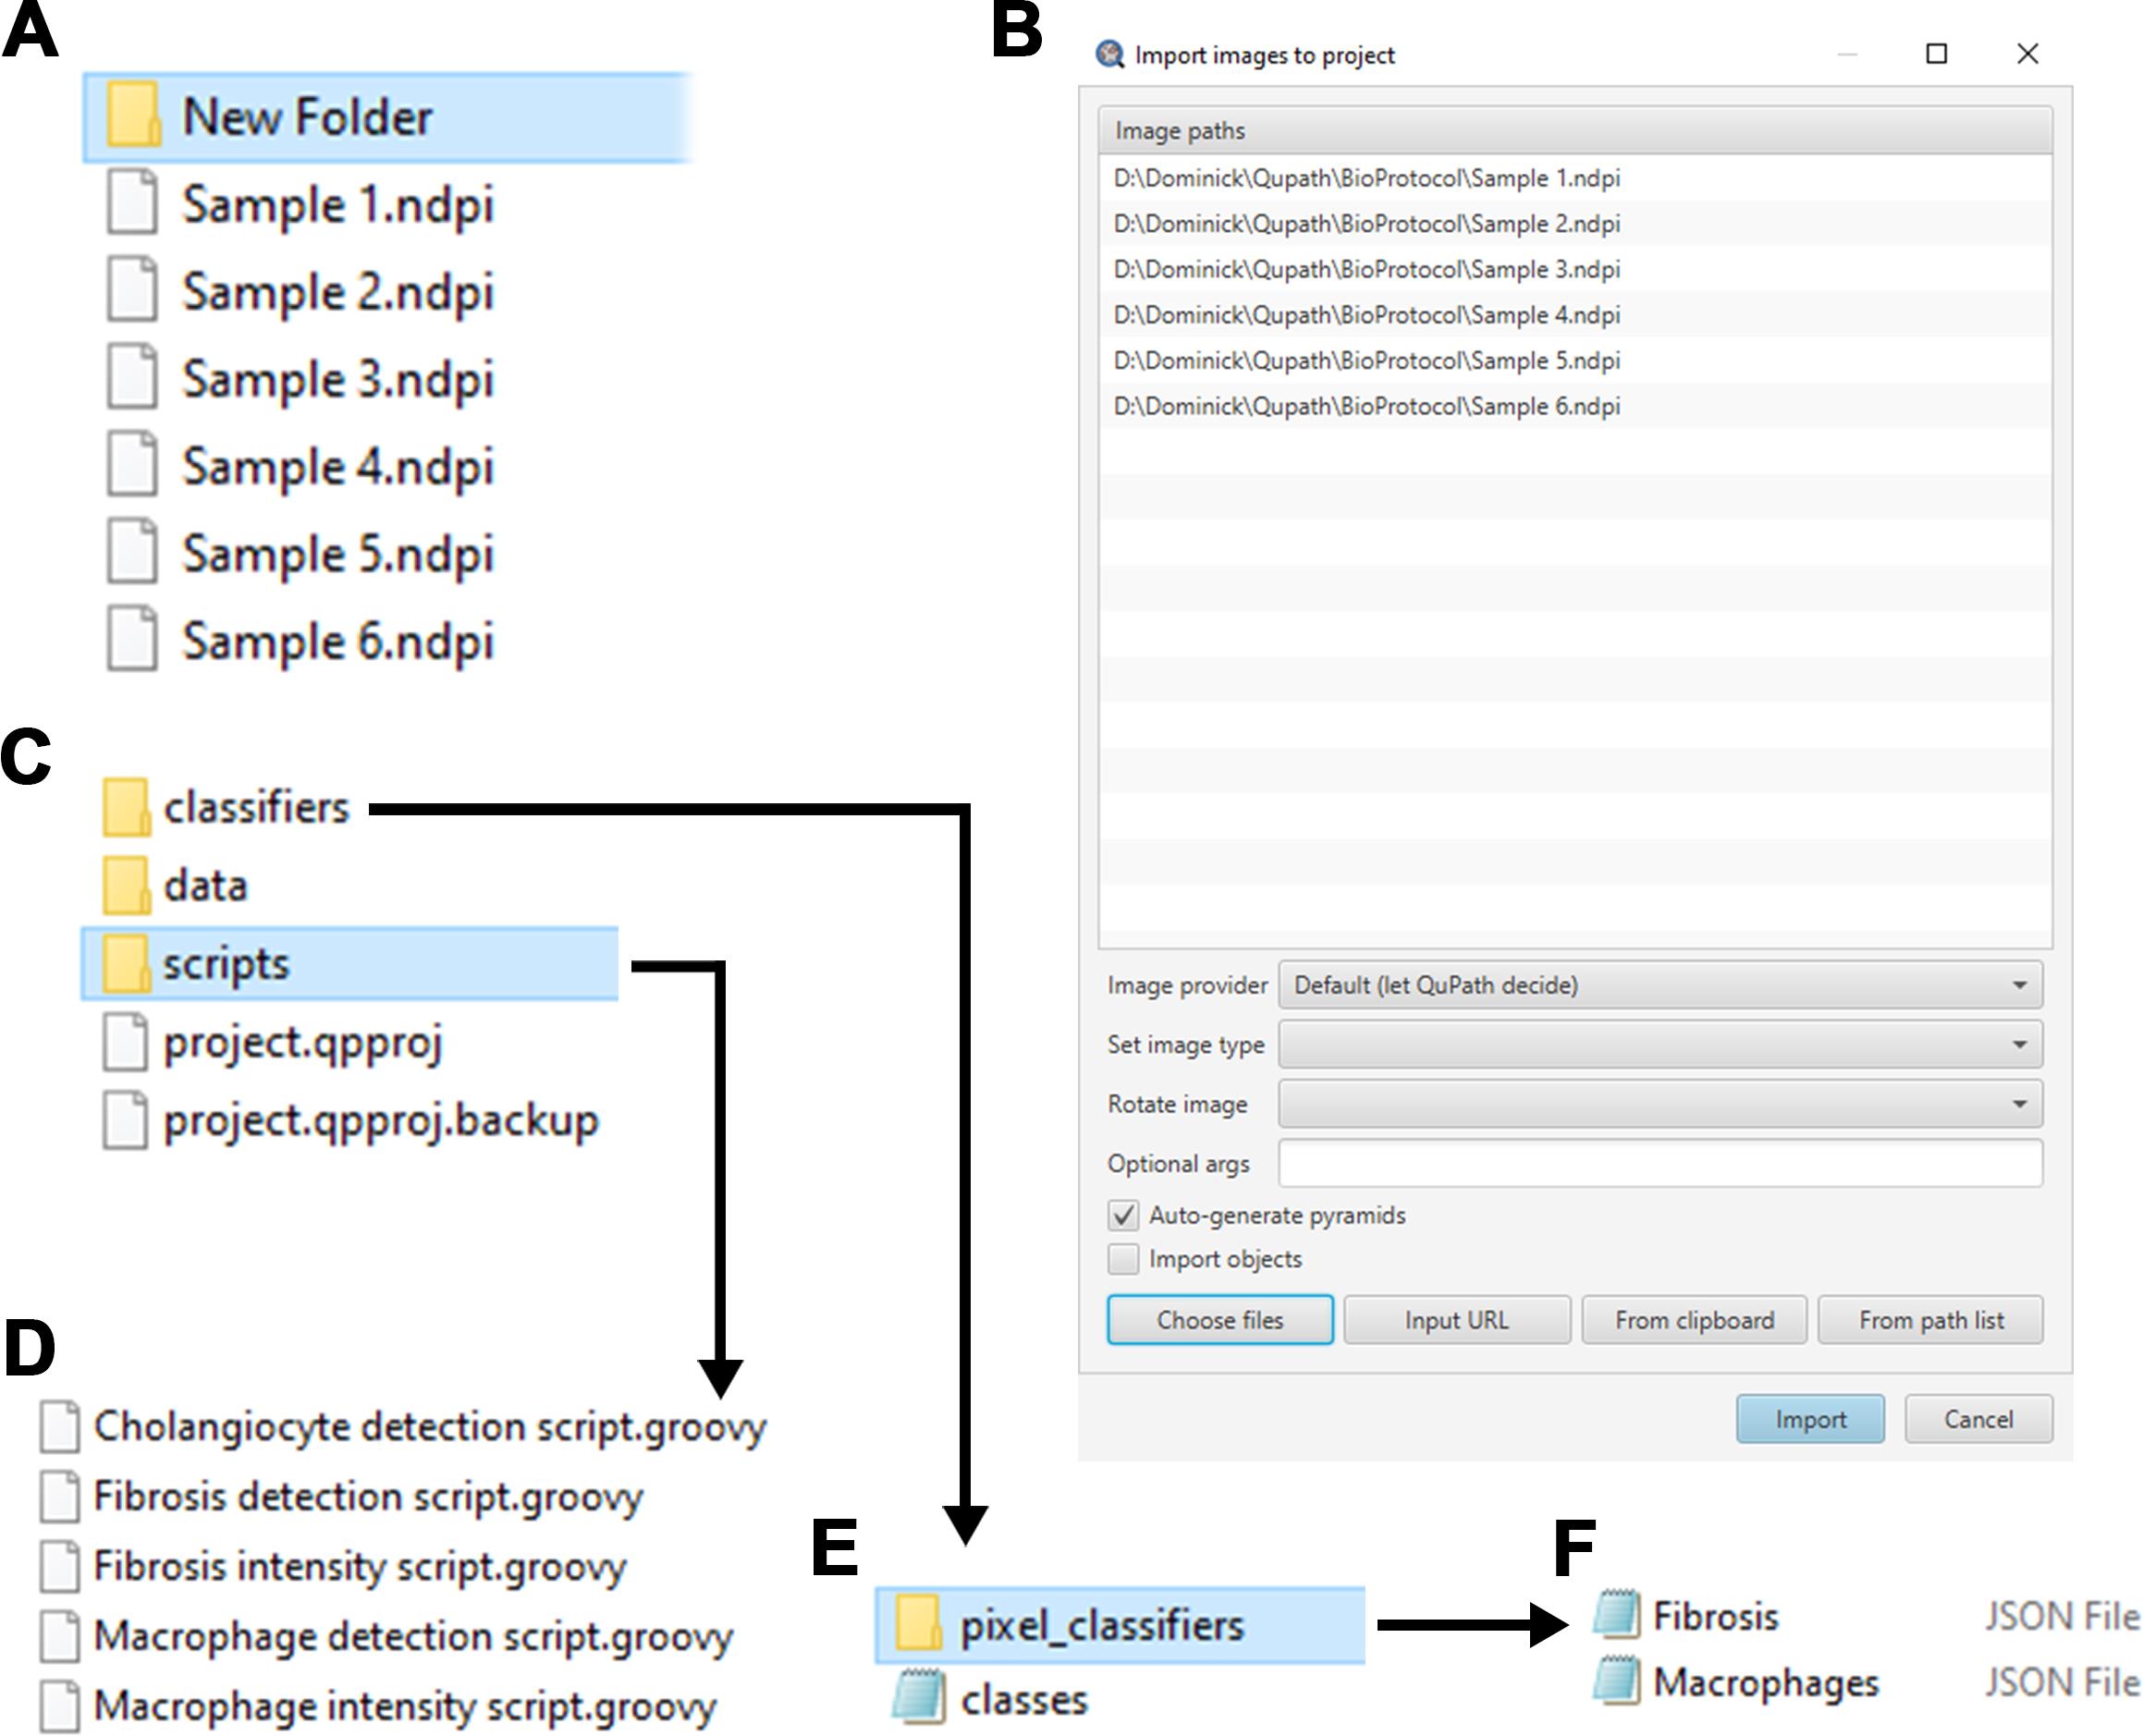
Figure 2. Preparing LiverQuant. A) Representative image of the New Folder where the images and scripts needed for analysis will be stored. B) Example of images ready to be imported into QuPath. C) Within New Folder, generate the scripts folder, where D) all downloaded .GROOVY scripts should be placed. E) Within the classifiers folder, generate pixel_classifiers folder, and F) place all downloaded .JSON files.Download the most recent edition of QuPath and start the program.
Note: These scripts have been designed and tested using QuPath v0.4.3.
Create a project within QuPath using the Create Project button.
Navigate to the empty New Folder that has been created in step 1 and click Select folder.
The Add images button within QuPath should now be accessible. Click Add images and proceed to add the desired histological image files.
After selecting chosen images, click Open.
Verify that all of the images are added to the Import Images to project pop-up and click Import (Figure 2B).
Leave the Image provider as Default (let QuPath decide).
Leave the image type blank.
Note: Image type will vary depending on the analysis (Brightfield H-DAB – Macrophages, Brightfield Other – Fibrosis, or Fluorescence – Cholangiocytes) and is automatically selected within the detection scripts.
Do not choose to rotate the image, as it can occasionally slow down QuPath’s ability to read the file.
Leave Auto-generate pyramids checked.
Note: Most whole-slide scanned images are pyramidal, which carries data at multiple resolutions and can be sub-sampled depending on the analysis.
The Import objects option can remain unchecked for a new project.
Finally, navigate back to the New Folder in the file manager and add a folder entitled scripts (Figure 2C).
Place Fibrosis detection script, Macrophage detection script, Cholangiocyte detection script, Fibrosis intensity script, and Macrophage intensity script (.GROOVY files), taken from the GitHub link, into the scripts folder (Figure 2D).
Note: These scripts should show up in the toolbar under Automate > Project scripts…
Within New Folder, open classifiers, and create a new folder entitled pixel_classifiers (Figure 2E).
Add the Fibrosis and Macrophage .JSON files into the pixel_classifiers folder (Figure 2F).
QuPath immunohistochemical and immunofluorescent analysis
Whole-slide analysis of immune cell types, fibrosis, and biliary tract composition (cholangiocytes) can provide researchers with an efficient understanding of liver health. This protocol will outline the automated quantification of macrophages, fibrosis, and cholangiocytes within whole-slide sections of liver tissue, respectively. This section will be divided by the respective arc of liver histology chosen for analysis. Each protocol relies heavily upon customizable scripts written in the Groovy language within QuPath. The scripts are open-source and contain detailed annotations of each function and command used for their respective analysis. It is highly recommended to analyze the scripts prior to performing analyses in order to avoid potential pitfalls, optimize, and understand possible errors.
Automated quantification of macrophages within QuPath
Note: For this type of analysis, the 3,3′-Diaminobenzidine (DAB) chromogenic dye was used to detect the secondary antibody attached to the primary anti-F4/80 antibody.
Open one image by double-clicking the image icon.
Set the image type to Brightfield H-DAB (Figure 3A).
(Automatic Thresholding) Annotate three ROIs (using the brush tool) within the image that are good samples of how intense the macrophage stain is (Figure 3B).
Tip: The larger the ROIs, the more accurate the downstream analysis will be.
Note: Self-thresholding is outlined in section H.
When finished annotating, run the macrophage intensity analysis by going to Automate → Project scripts… and clicking on Macrophage intensity script.
For this script to run effectively, researchers need to type in their directory pathname on lines 24 and 29.
Note: This protocol segment provides the Macrophage detection script with an average intensity threshold for quantification specific to the selected histological samples.
Once the Macrophage intensity script is completed, open the Macrophage detection script in Automate → Project scripts… → Macrophage detection script.
Within the Macrophage detection script, right-click and click Run… > Run for project.
The script will automate whole tissue annotation (Figure 3C) and quantify macrophages for each image (Figure 3D).
Notes:
i. The running time for each image is approximately 3 min.
ii. Self-annotation for each image is covered in section I.
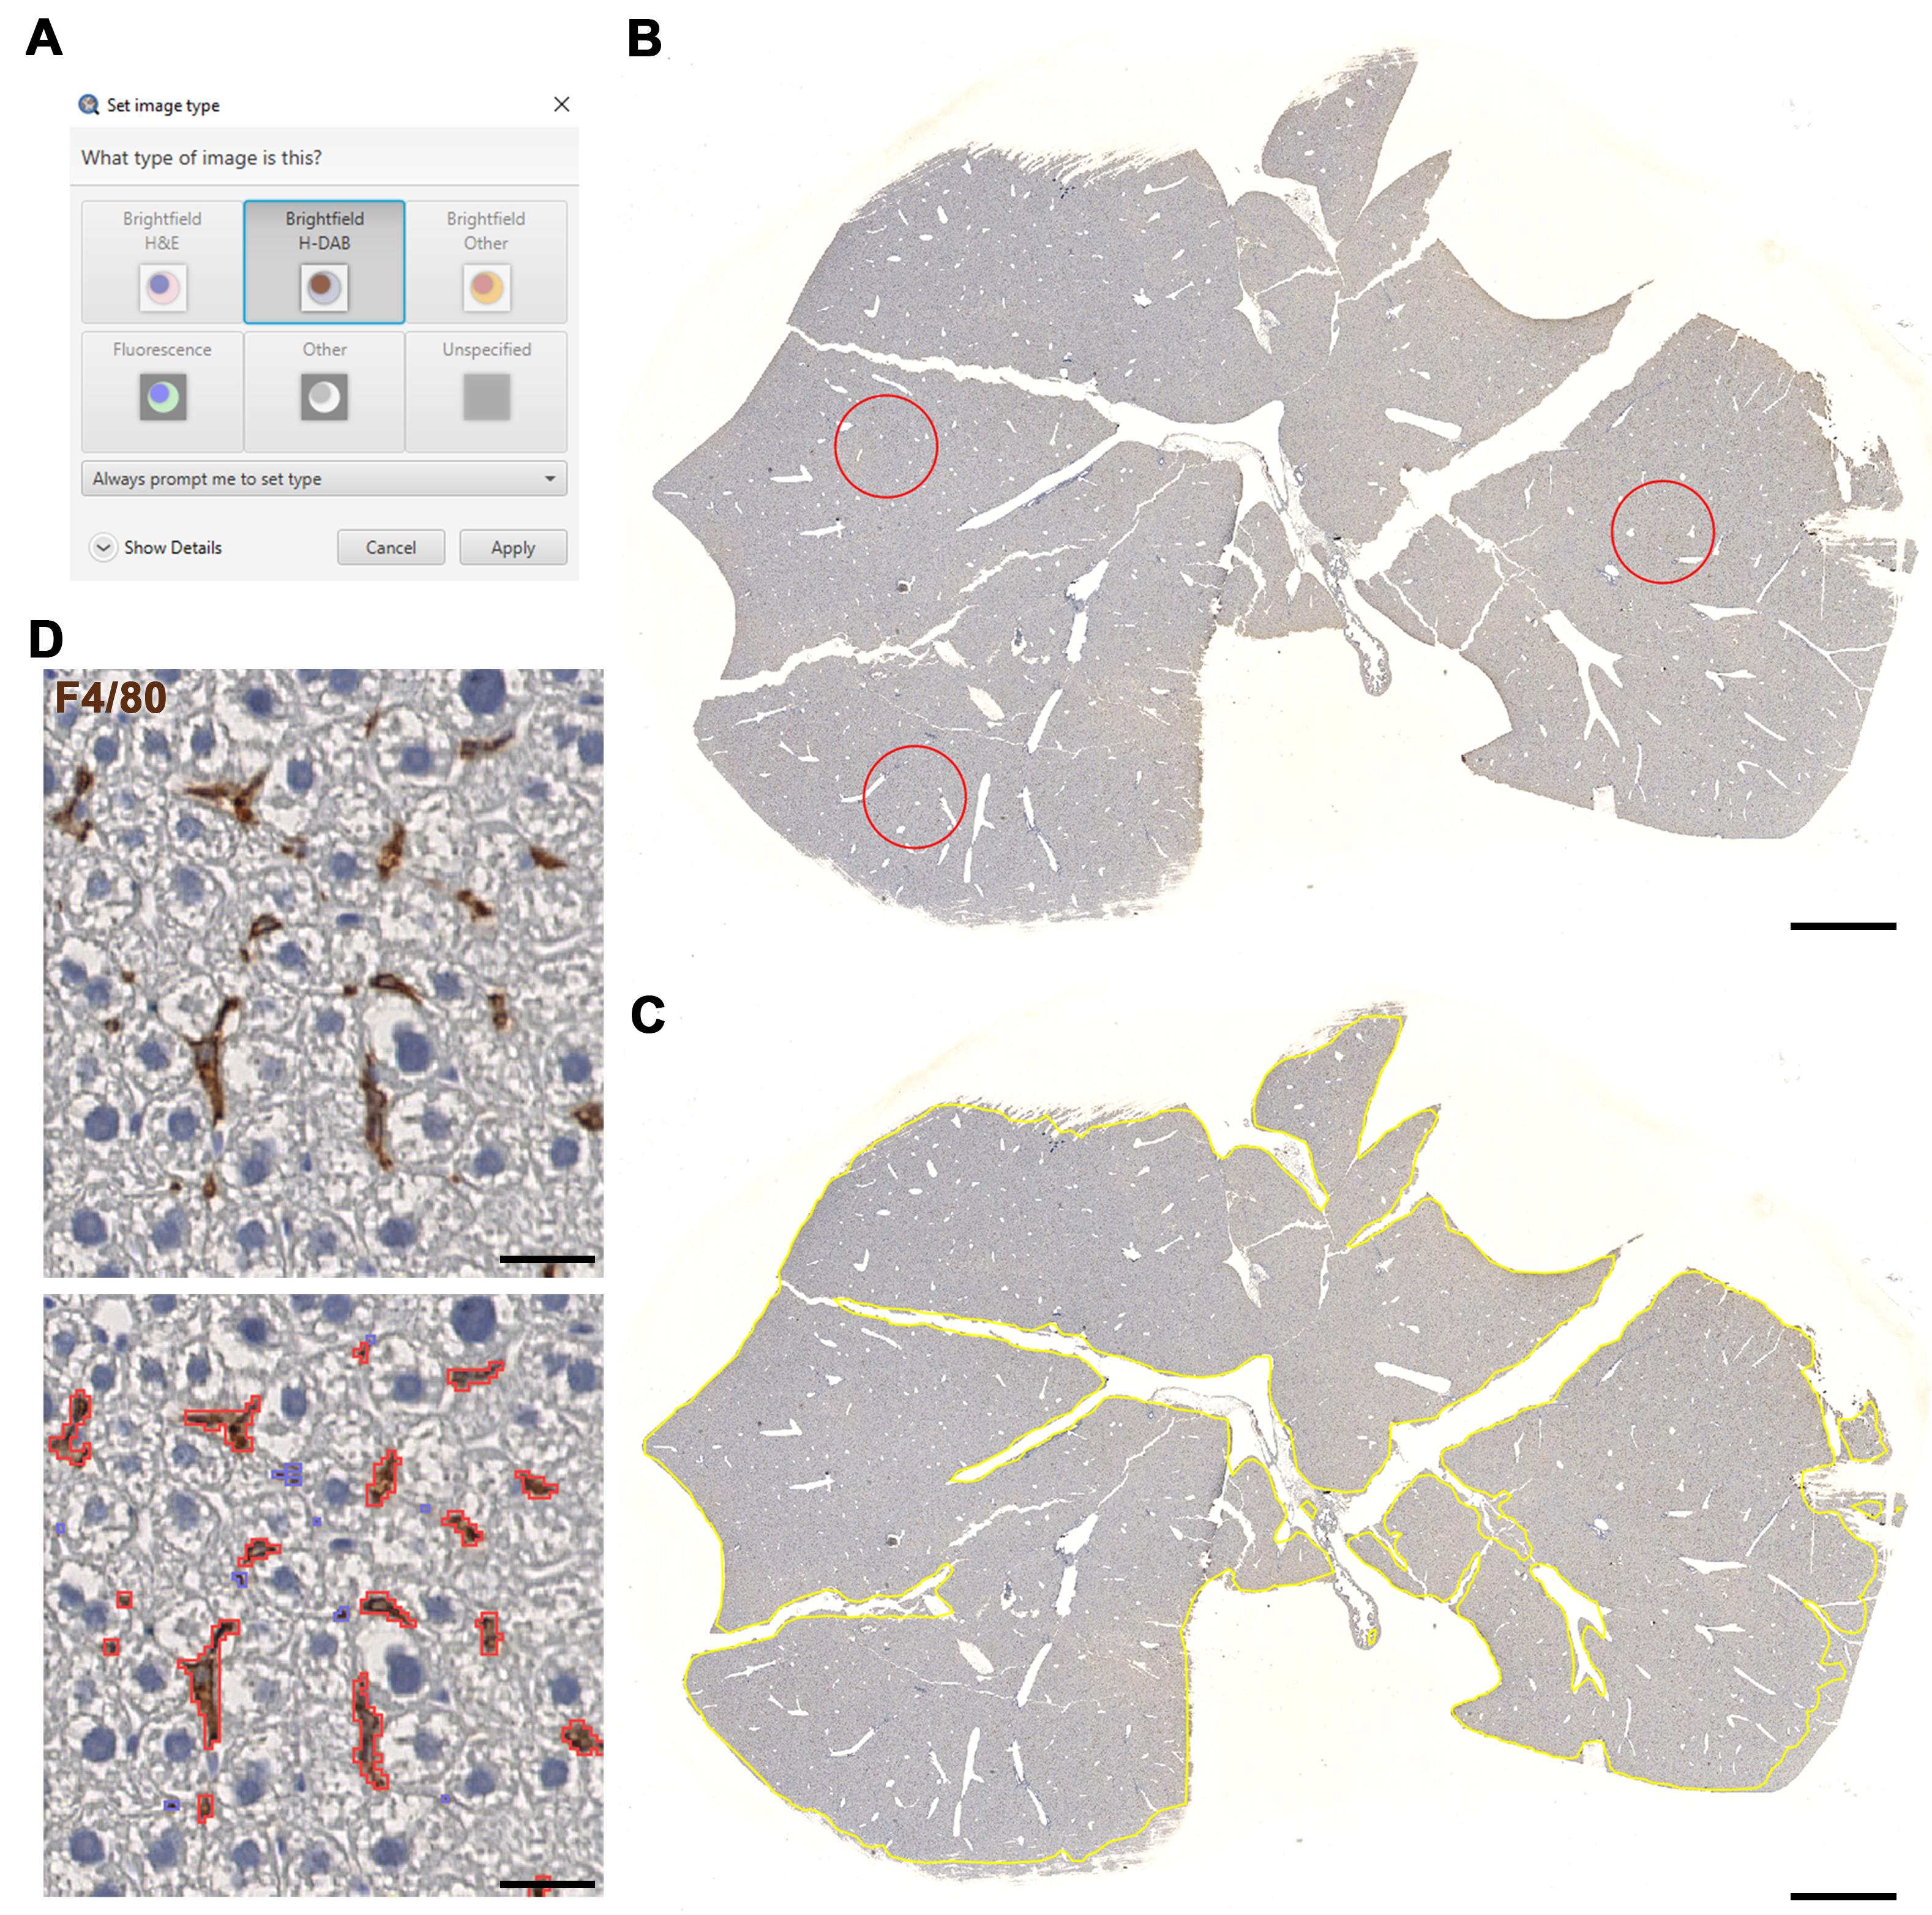
Figure 3. Macrophage detection using LiverQuant. A) Upon opening the chosen DAB-stained image, set the image type to Brightfield H-DAB. B) Example of three annotations used for the Macrophage intensity script to gather an average intensity of DAB staining. C) The Macrophage detection script will automate tissue annotation and D) generate positive macrophage detections (red). B and C, scale bars: 2 mm. D, scale bars: 25 μm.If satisfied with the analysis, proceed to section J to export measurements.
Automated quantification of fibrosis within QuPath
Note: For this analysis, a picosirius red stain with a Fast Green counterstain was used. Of course, a different counterstain can be used and still achieve accurate results.
Open one image by double-clicking the image icon.
Set the image type to Brightfield Other (Figure 4A).
(Automatic Thresholding) Annotate three ROIs (using the brush tool) within the image that are good samples of how intense the picosirius red stain is (Figure 4B).
Tip: The larger the ROIs, the more accurate the downstream analysis will be.
Note: Self-thresholding is outlined in section H.
When finished annotating, run the fibrosis intensity analysis by going to Automate → Project scripts… and clicking on Fibrosis intensity script.
For this script to run effectively, researchers need to type in their directory pathname on lines 24 and 29.
Note: This protocol segment provides the Fibrosis detection script with an average intensity threshold for quantification specific to the samples.
Once the Fibrosis intensity script is completed, open the Fibrosis detection script in Automate → Project scripts… → Fibrosis detection script.
Within the Fibrosis detection script, right-click and click Run… > Run for project.
The script will automate whole-tissue annotation (Figure 4C) and quantify fibrosis for each image (Figure 4D).
Notes:
i. The running time for one image is approximately 2 min.
ii. Self-annotation is outlined in section I.
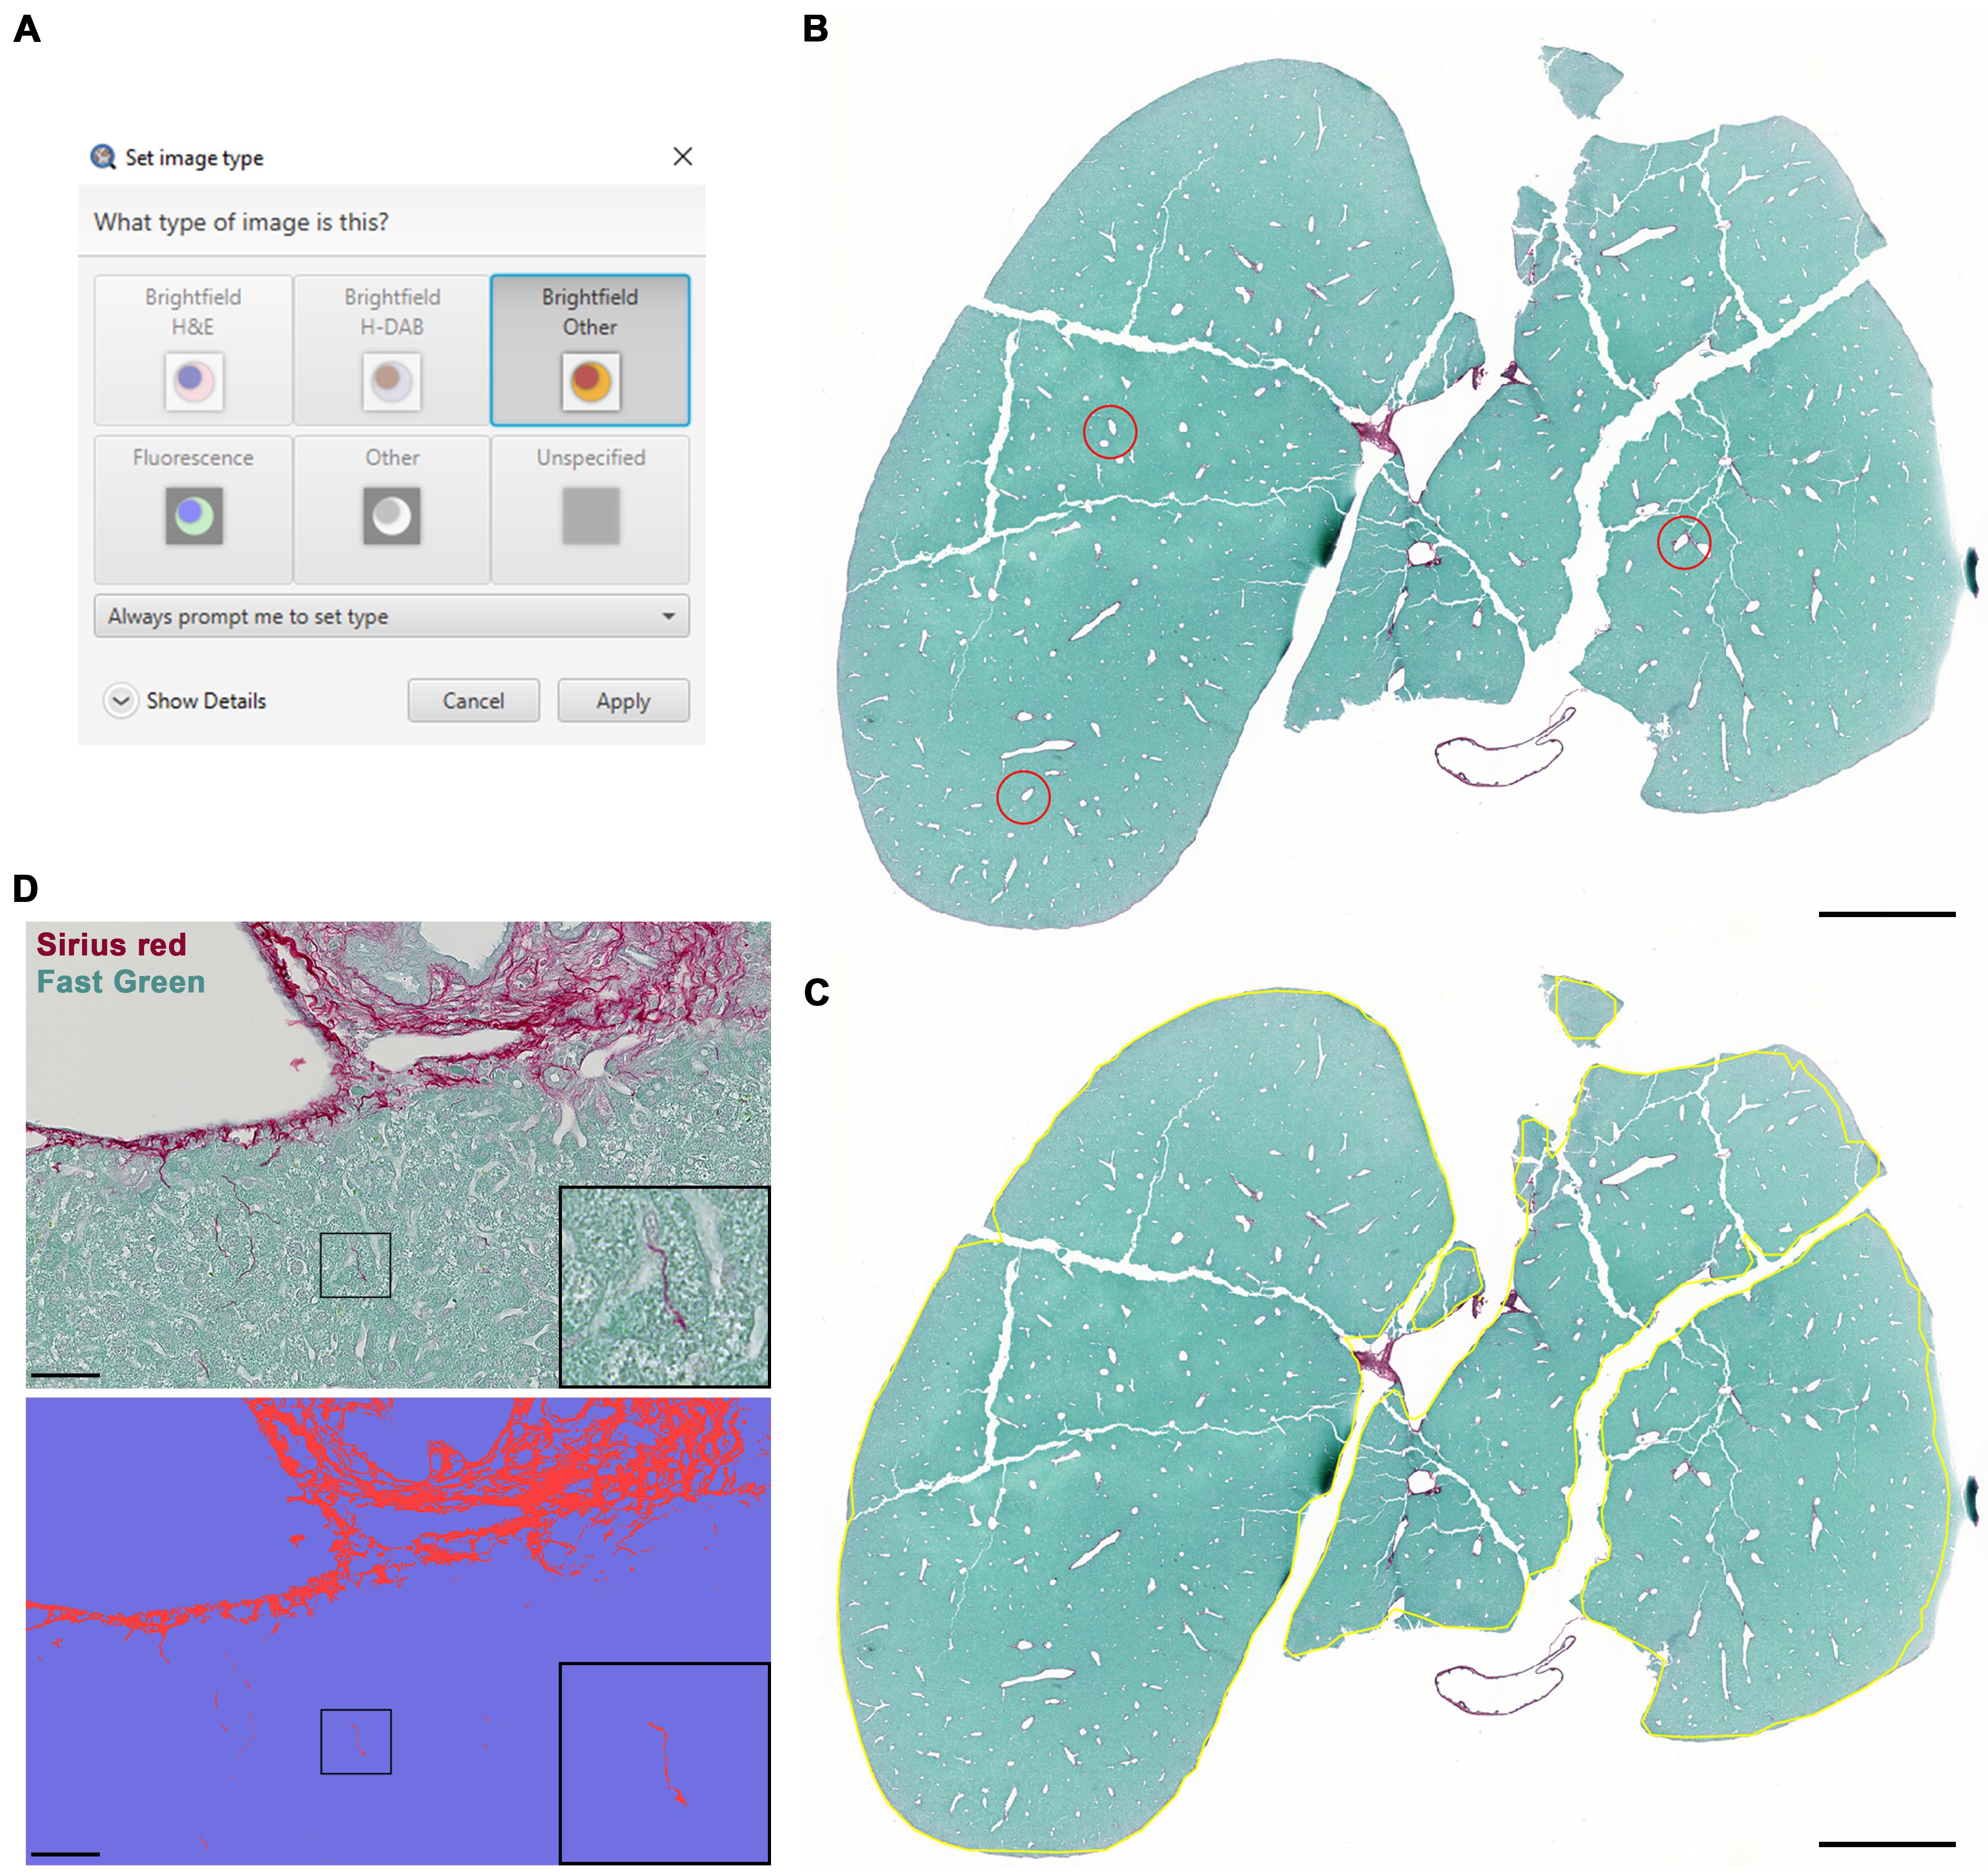
Figure 4. Fibrosis detection using LiverQuant. A) After opening the chosen picosirius red–stained image, set the image type to Brightfield Other. B) Example of three annotations used for the Fibrosis intensity script to gather an average intensity of picosirius red staining. C) The Fibrosis detection script will automate tissue annotation and D) differentiate between positive (fibrotic septa-red) and negative (parenchymal-blue) staining. B and C, scale bars: 2 mm. D, scale bars: 50 μm.If satisfied with the analysis, proceed to section J to export measurements.
Automated detection of cholangiocytes within QuPath
Note: The script that was written for cholangiocyte detection utilizes the positive cell detection plugin found within QuPath. It may be useful to further optimize the Positive cell detection plugin to a ROI within the slide and apply its values to the .GROOVY script for batch analysis. The most important parameter to adjust, as mentioned in the .GROOVY script is threshold.
Open one image by double-clicking the image icon.
Set the image type to Fluorescence (Figure 5A).
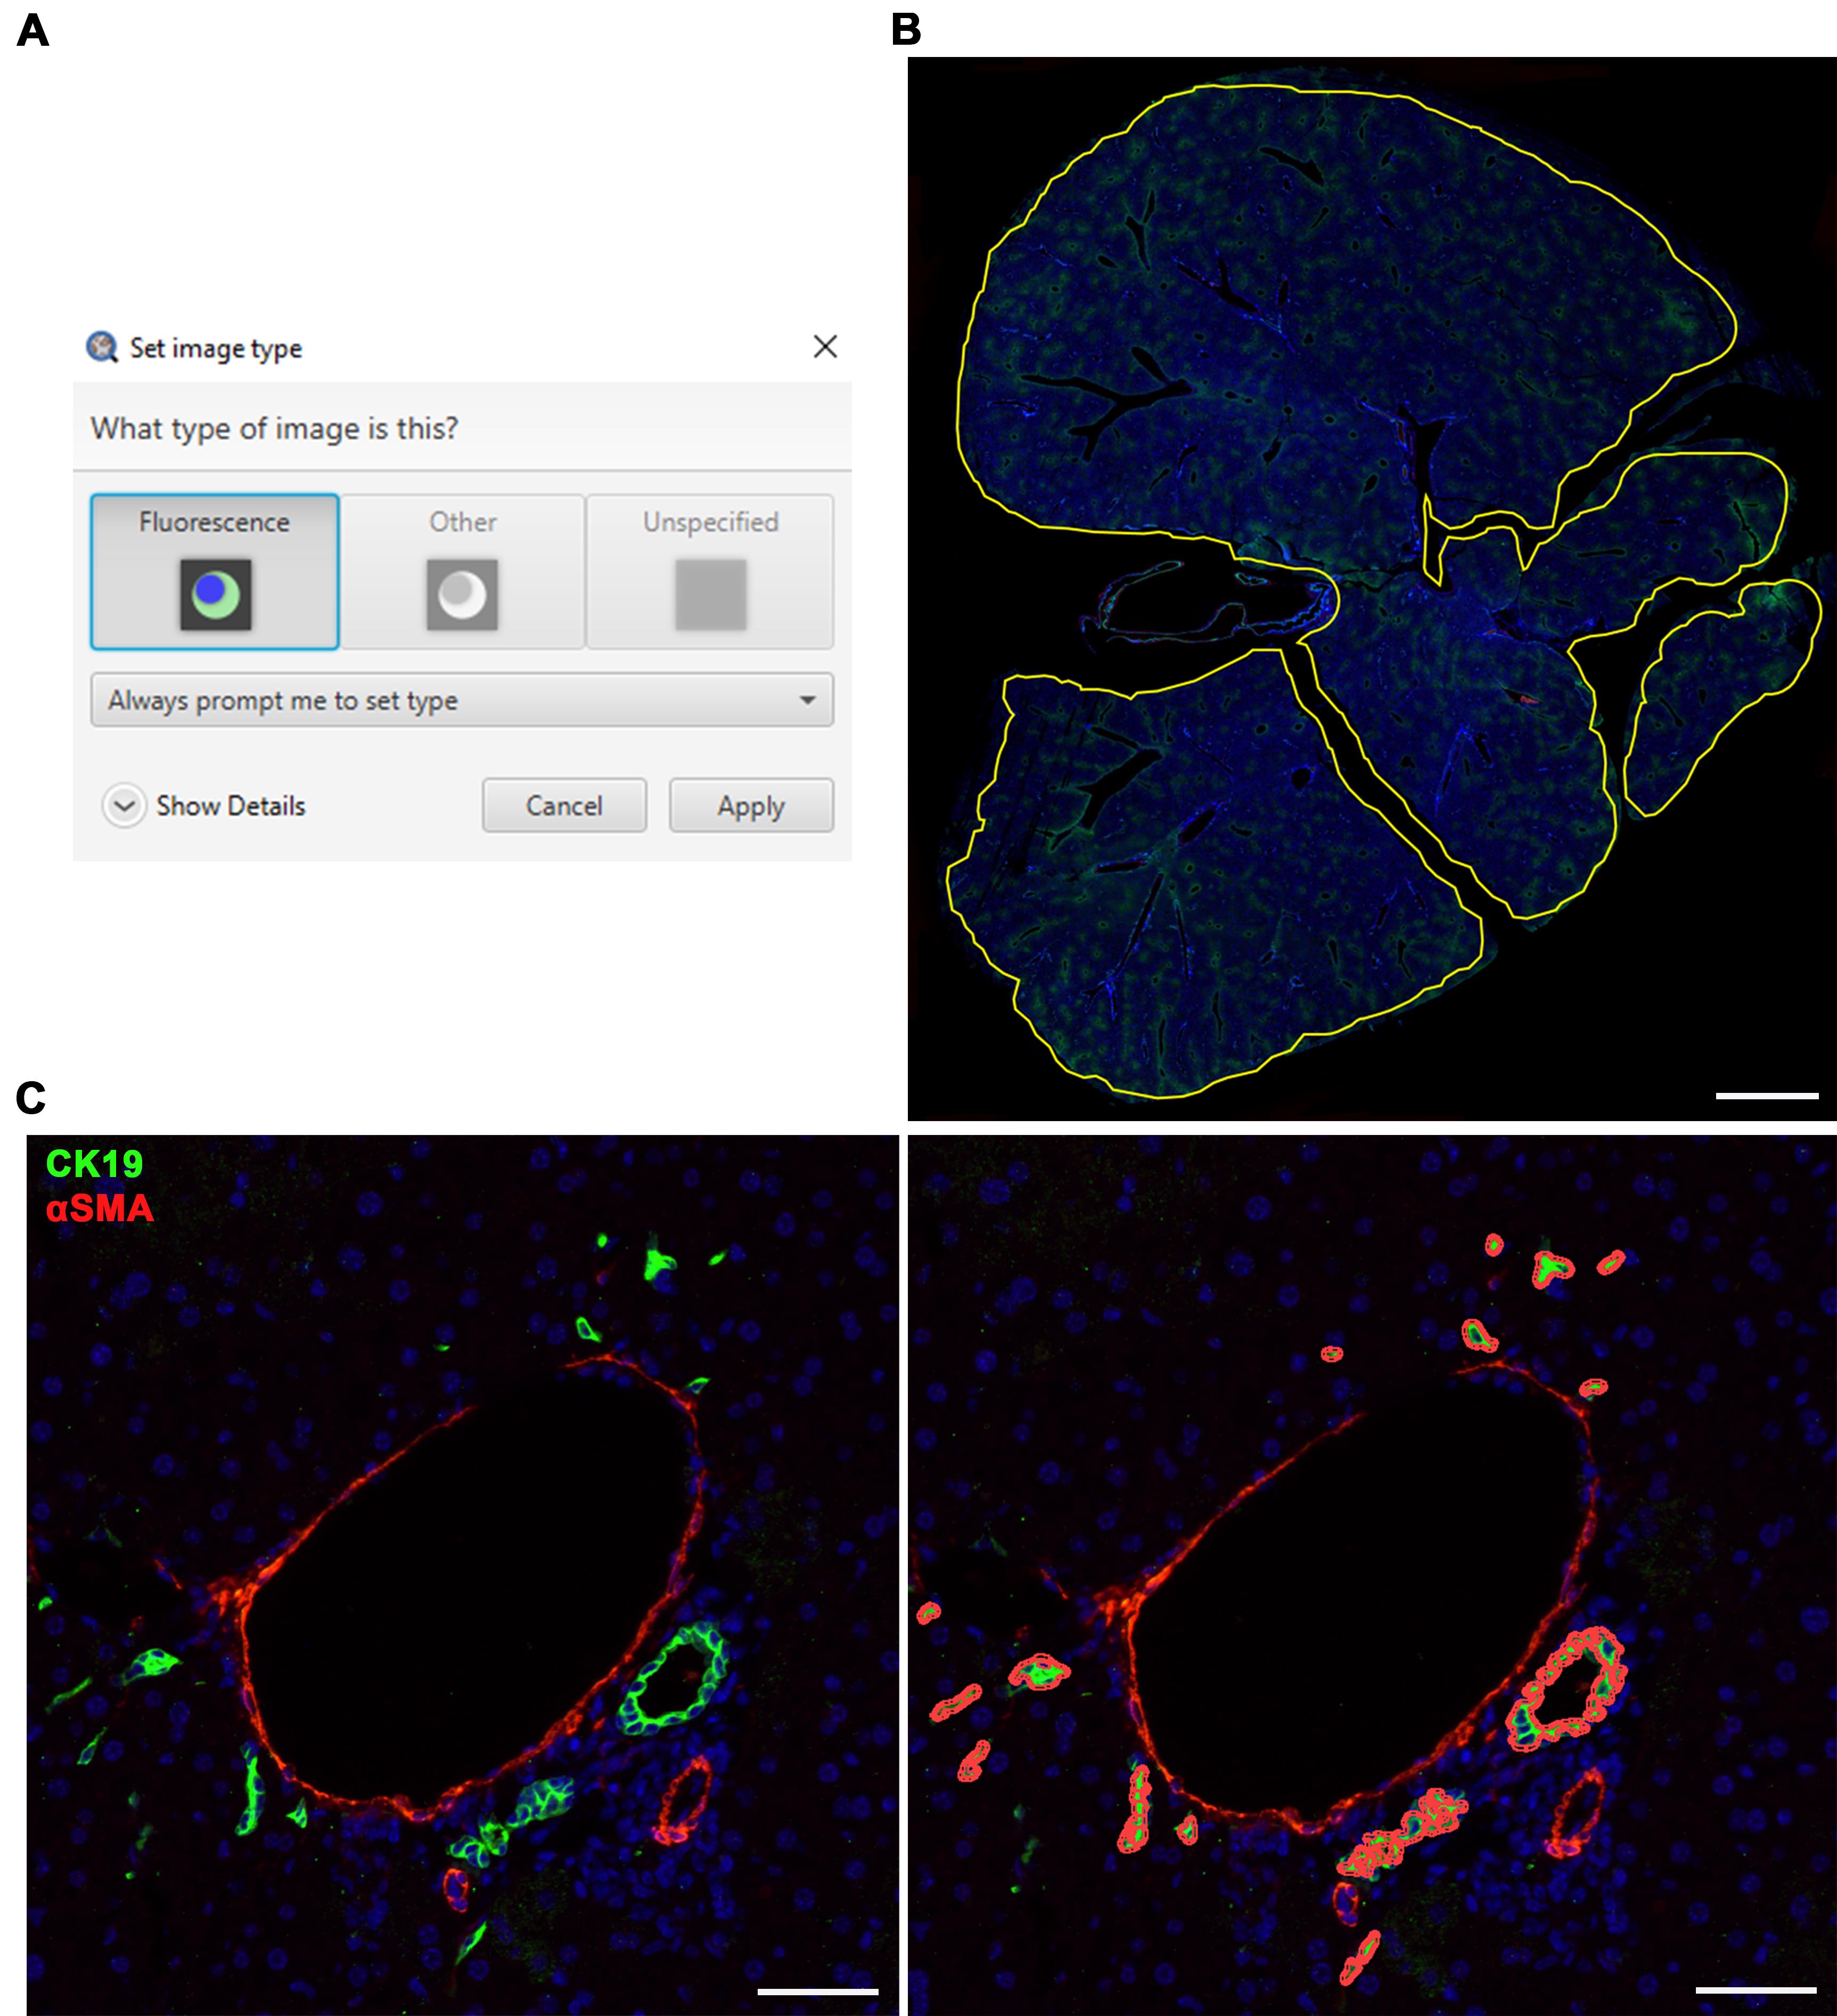
Figure 5. Cholangiocyte detection using LiverQuant. A) Upon opening the chosen cytokeratin 19 (CK19) stained image, set the image type to Fluorescence. B) The Cholangiocyte detection script will automate tissue annotation and C) generate positive cholangiocyte detections. B, scale bar: 2 mm. C, scale bars: 50 μm. αSMA: Smooth muscle alpha-actin.Begin the analysis by going to Automate → Project scripts… and clicking on Cholangiocyte detection script.
Within the Cholangiocyte detection script, right-click and click Run… > Run for project.
The script will automate whole tissue annotation (Figure 5B) and quantify cholangiocytes for each image (Figure 5C).
Notes:
i. The running time for one image is approximately 5 min.
ii. Self-annotation is outlined in section I.
Proceed to section J for exporting measurements if satisfied with the analysis.
Self-thresholding for fibrosis and macrophages detection within QuPath
Open one image by double-clicking the image icon.
Set the image type to Brightfield (H-DAB) (Figure 3A) for macrophages or Brightfield (other) (Figure 4A) for fibrosis.
Annotate an area of interest (using the brush tool).
When finished annotating, zoom in on any area of interest.
This area will be used as a probe to determine the appropriate filters to quantify the macrophages or fibrosis within the scanned image.
Open the Pixel classification tool within the Classify menu bar and select Pixel classification > Create thresholder.
Within the Create thresholder pop-up, adjust the parameters to accurately quantify macrophages (Figure 6A) or Fibrosis (Figure 6B).
Note: To visualize the positive and negative selections, make sure the Show pixel classification button has been clicked (the button with the letter C on it).
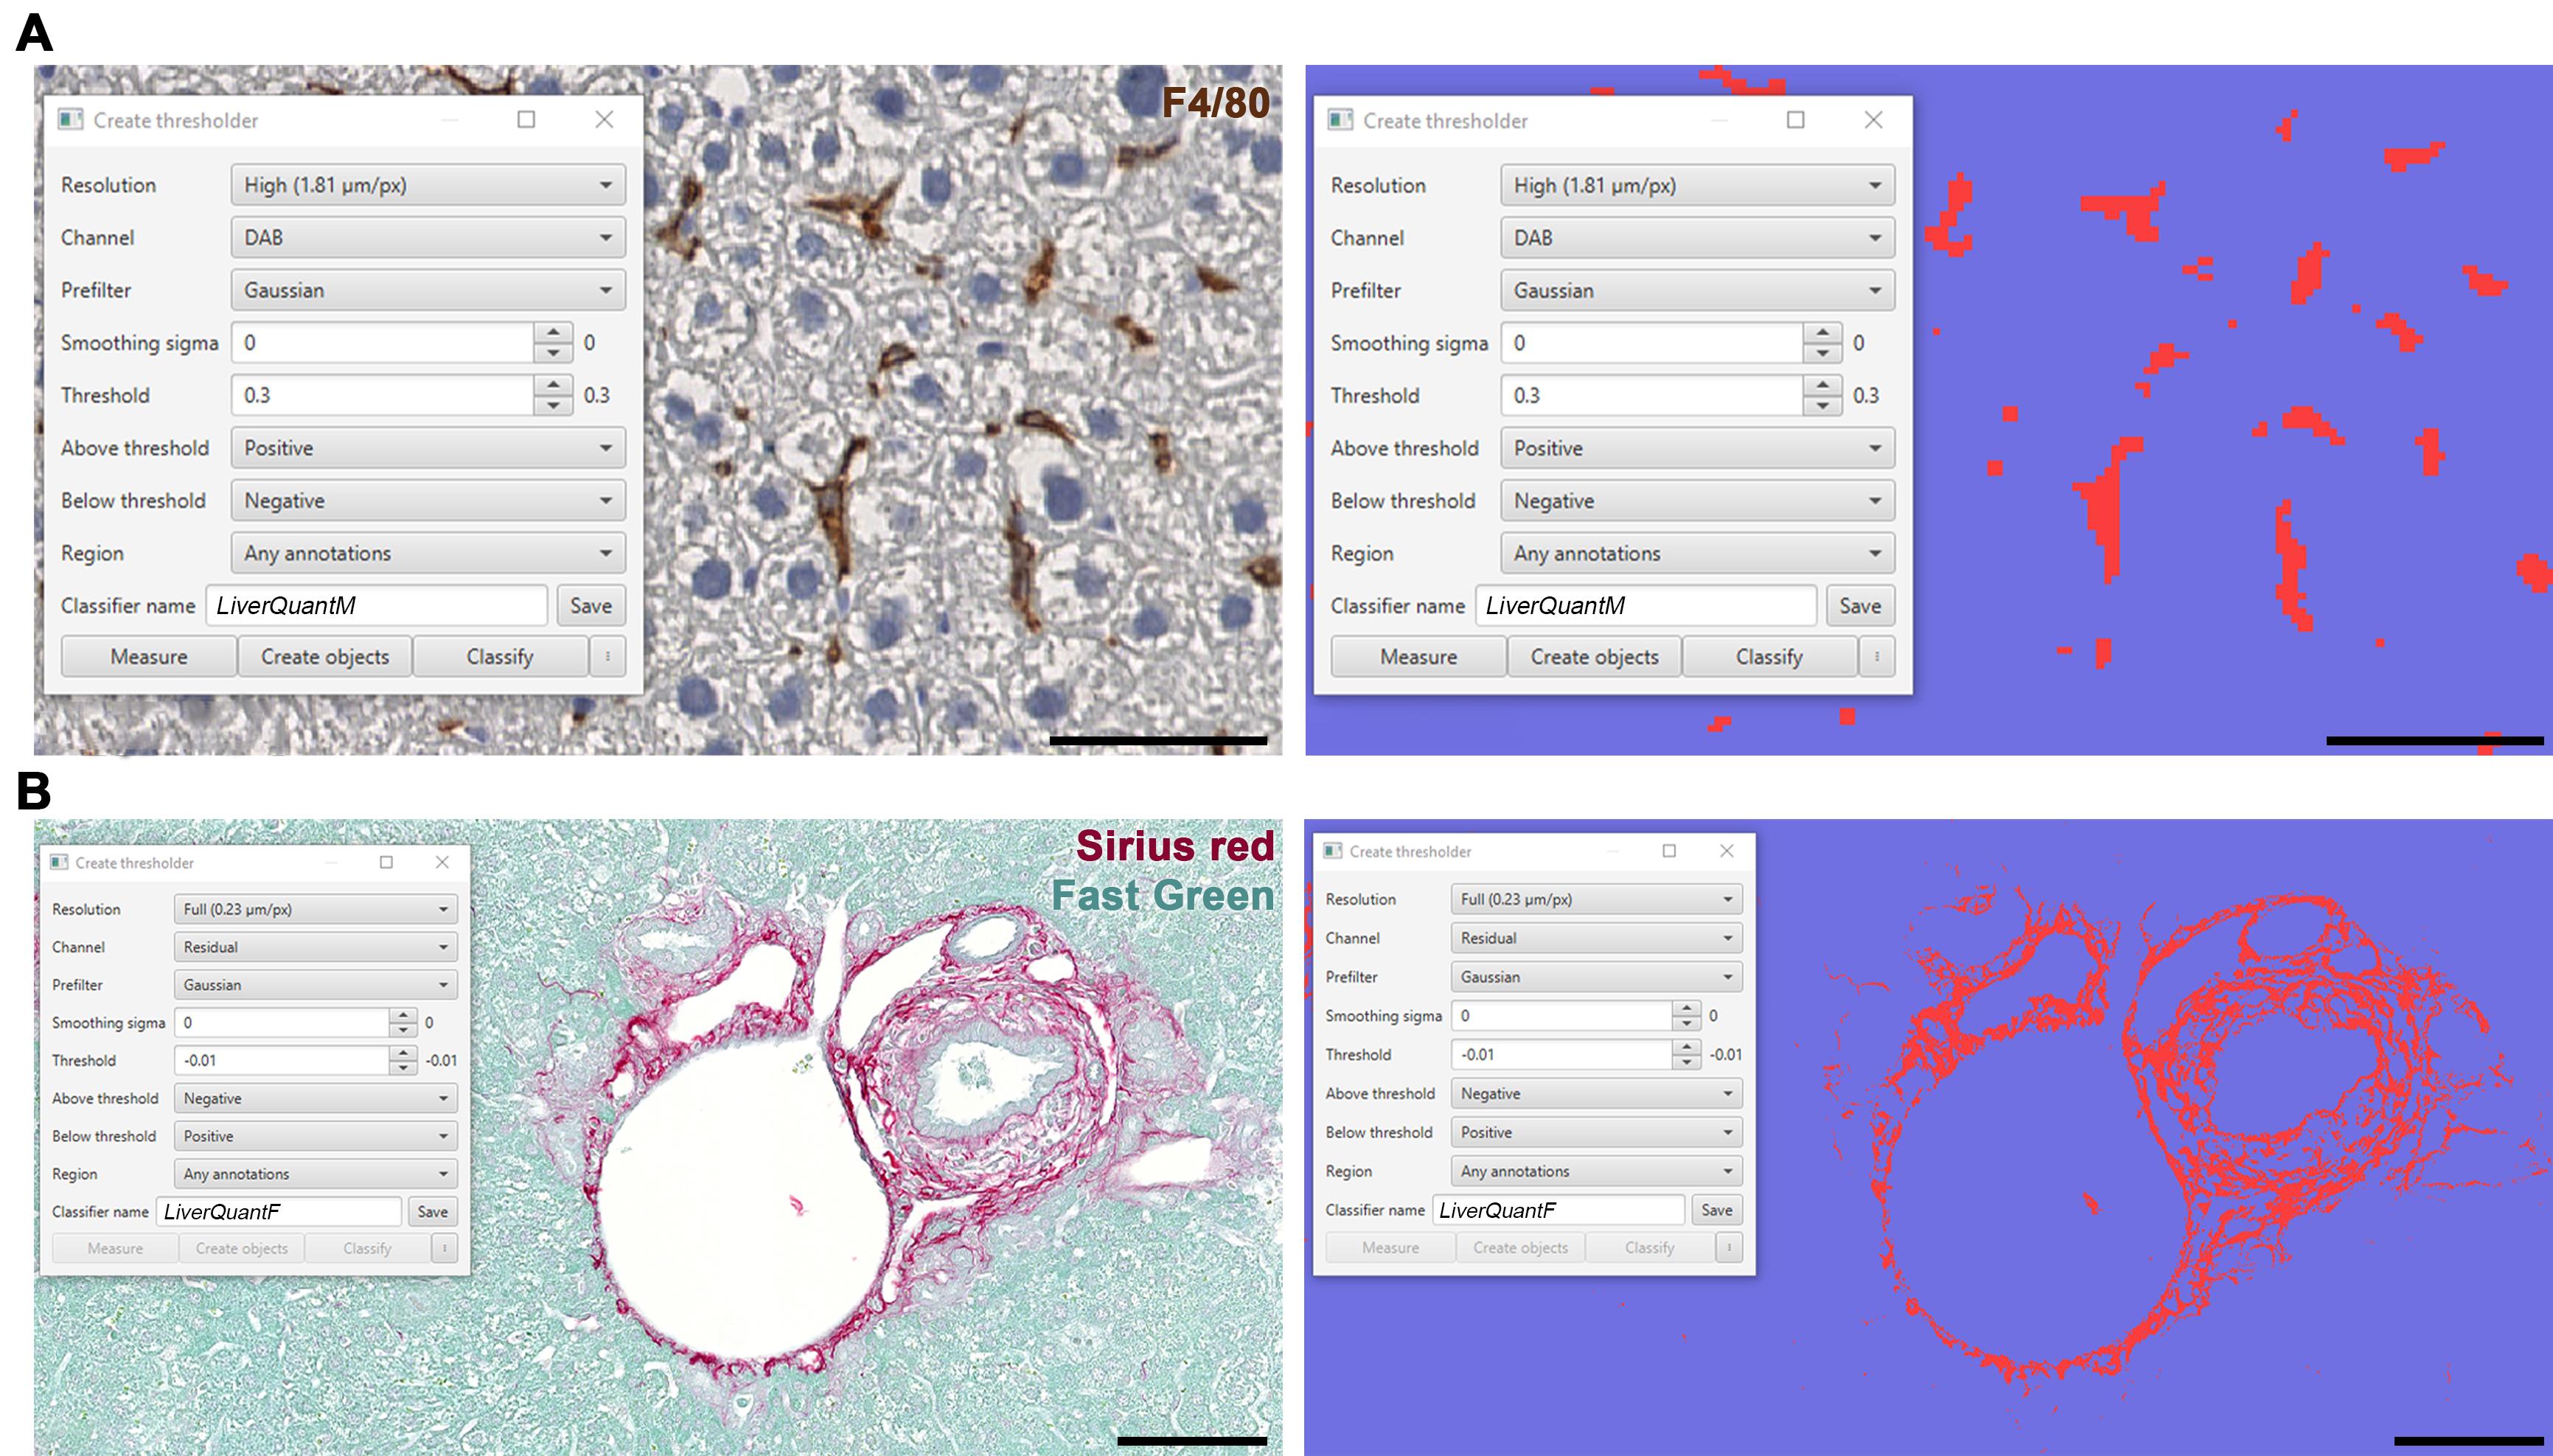
Figure 6. Self-thresholding for downstream LiverQuant analysis. A) Representative photo of Create thresholder tool in QuPath for macrophage, and B) fibrosis detection, respectively. A, scale bars: 50 μm. B, scale bars: 100 μm.For macrophage detection:
Set Above threshold to Positive and Below threshold to Negative.
For fibrosis detection:
Set Above threshold to Negative and Below threshold to Positive.
Set Channel to Dab for macrophages and Residual for fibrosis.
Set Resolution to High.
Note: The higher the resolution, the slower QuPath will function in the analysis of the section of interest.
Smoothing Sigma can remain at 0 and can be changed to 1 if background staining is strong to help eliminate possible false positive detections.
Starting threshold should be 0.2 for macrophages and 0.0 for fibrosis and optimized from there to isolate true-positive dab or picosirius staining, respectively. Macrophages will show up as red and the background as blue (Figure 6A). Fibrotic septa will show up as red and the background as blue (Figure 6B).
Set Region to Any annotations.
Enter the Classifier name as LiverQuantM to utilize the Macrophage detection script and LiverQuantF to utilize the Fibrosis detection script.
After optimizing the threshold for LiverQuantM or LiverQuantF, proceed to step E6 or F6 for batch detection of macrophages or fibrosis, respectively.
Annotating slides by hand within QuPath
Note: Self-annotation must be followed by the specific steps outlined below.
Annotate the desired areas within each image that require quantification using QuPath’s brush tool (Figure 7A).
Tip: Avoid liver borders, and longitudinally cut large central veins or portal triads, as some will have false-positive staining.
Tip: To subtract annotation, hold Alt for Windows or Command for Mac while annotating.
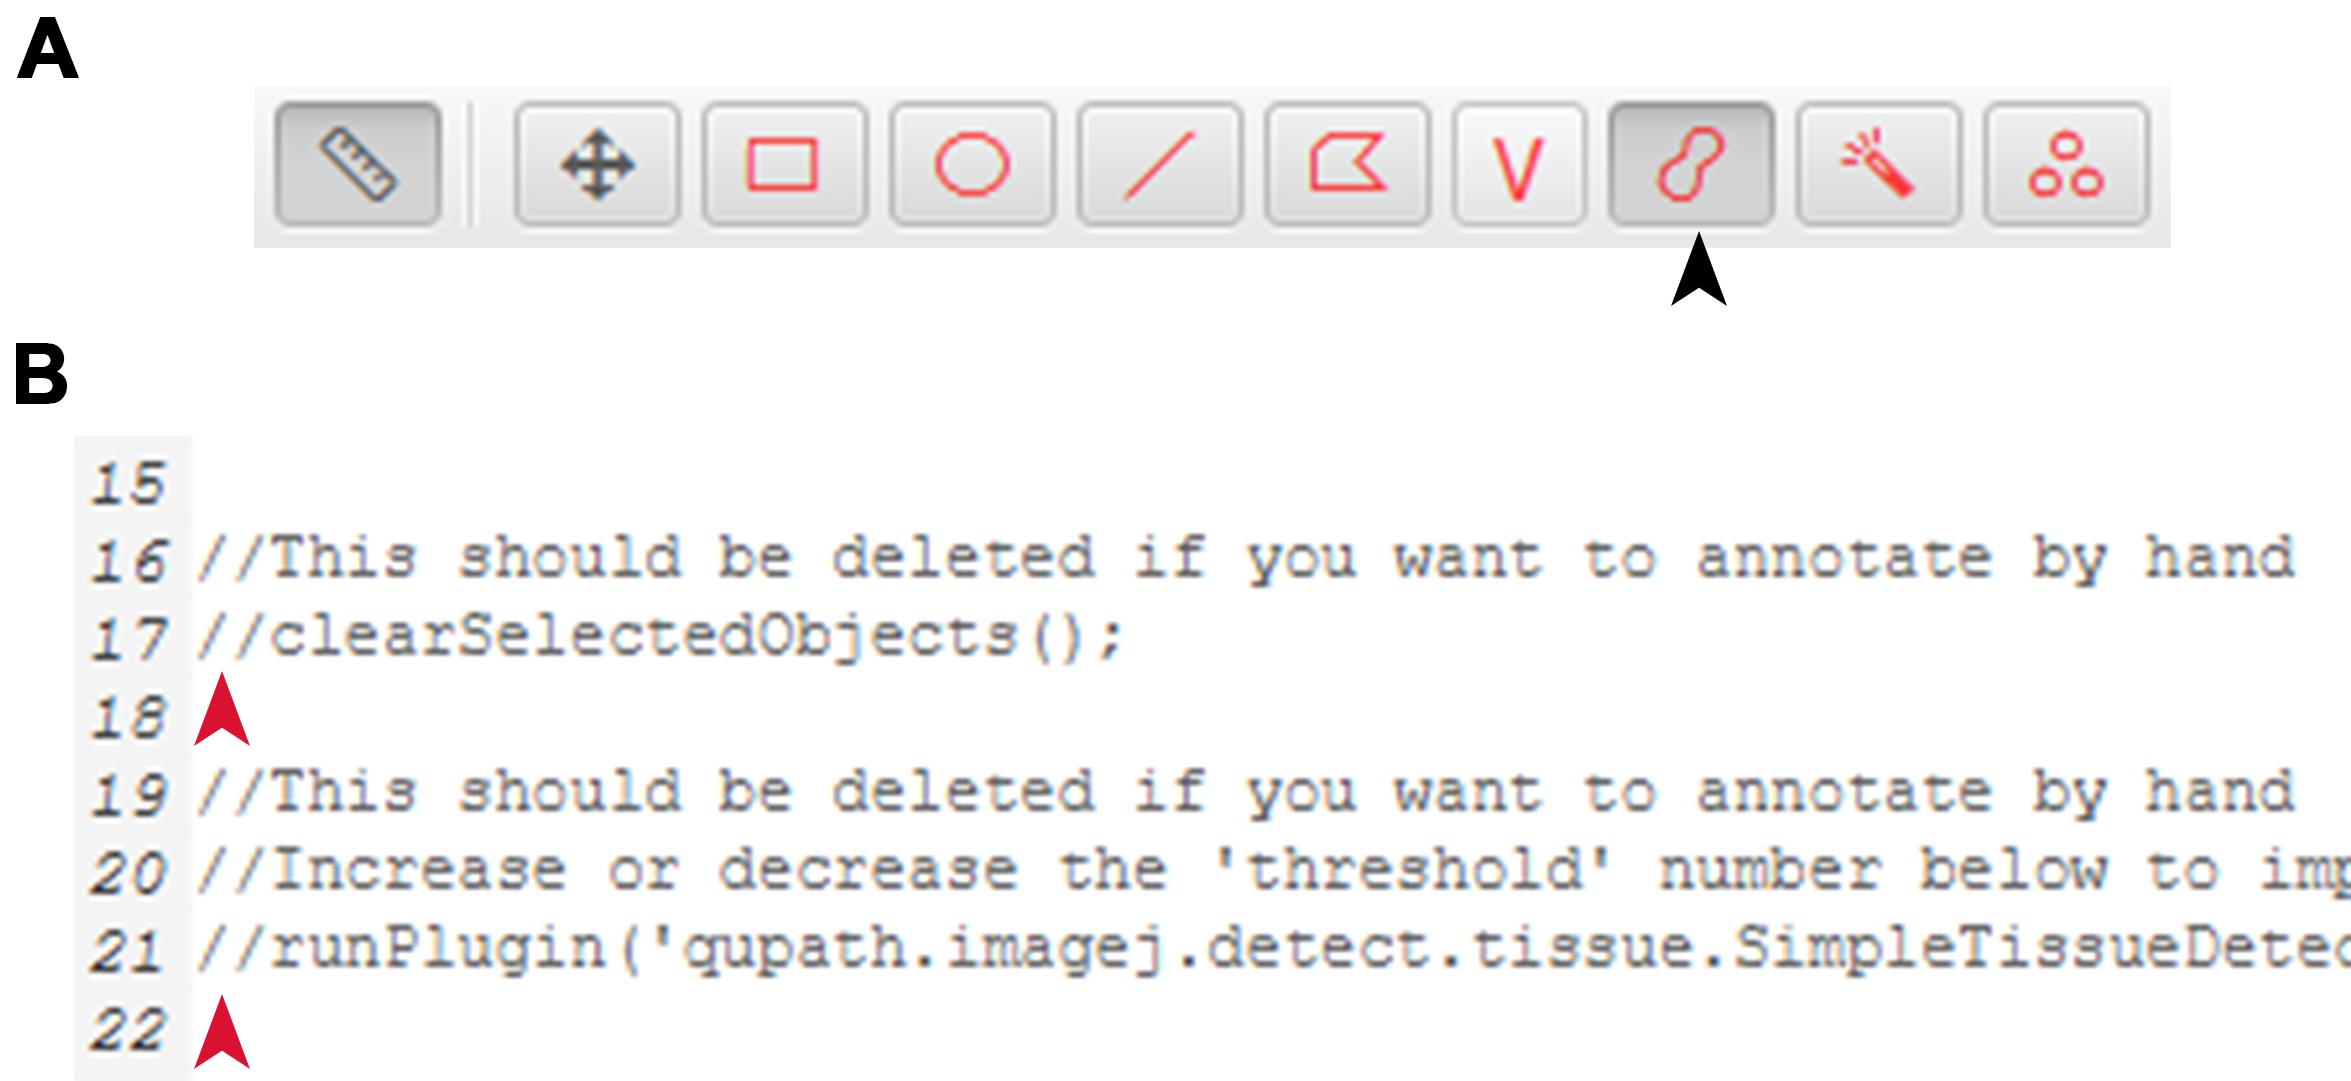
Figure 7. Self-annotation for downstream LiverQuant analysis. A) Location of the brush annotation tool in the QuPath toolbar is indicated with a black arrow. B) Representative photo of where two slashes // should be placed for self-annotation within any of the detection scripts. Red arrow indicates exact location to place //.Open the detection script for the specified analysis (e.g., Macrophage detection script, Fibrosis detection script, and Cholangiocyte detection script).
Place two // before lines 17 and 21 of the script (Figure 7B).
Tip: An alternative is to delete both of these lines.
Note: If this is not done, each annotation that is already created will be deleted and replaced by an automated annotation.
Proceed to step E6, F6, or G4 for batch detection of macrophages, fibrosis, or cholangiocytes, respectively.
Exporting measurements
To export measurements, click on Measure > Export measurements, move all the samples analyzed to the Selected side, choose the appropriate Output file destination, and make sure the Export type is set to Annotations and the Separator is set to Comma (.csv). Finally, click Export.
The exported .csv file should contain all the data needed for analysis.
For macrophages, the measurement for comparative analysis is Detections (Figure 8A).
Note: Divide Detections by Area μm2 and multiply by 1,000,000 to normalize to area.
For fibrosis, the measurement for comparative analysis is LiverQuantF: Positive% (Figure 8B).
For cholangiocytes, the measurement for comparative analysis is Num Positive per mm2 (Figure 8C).
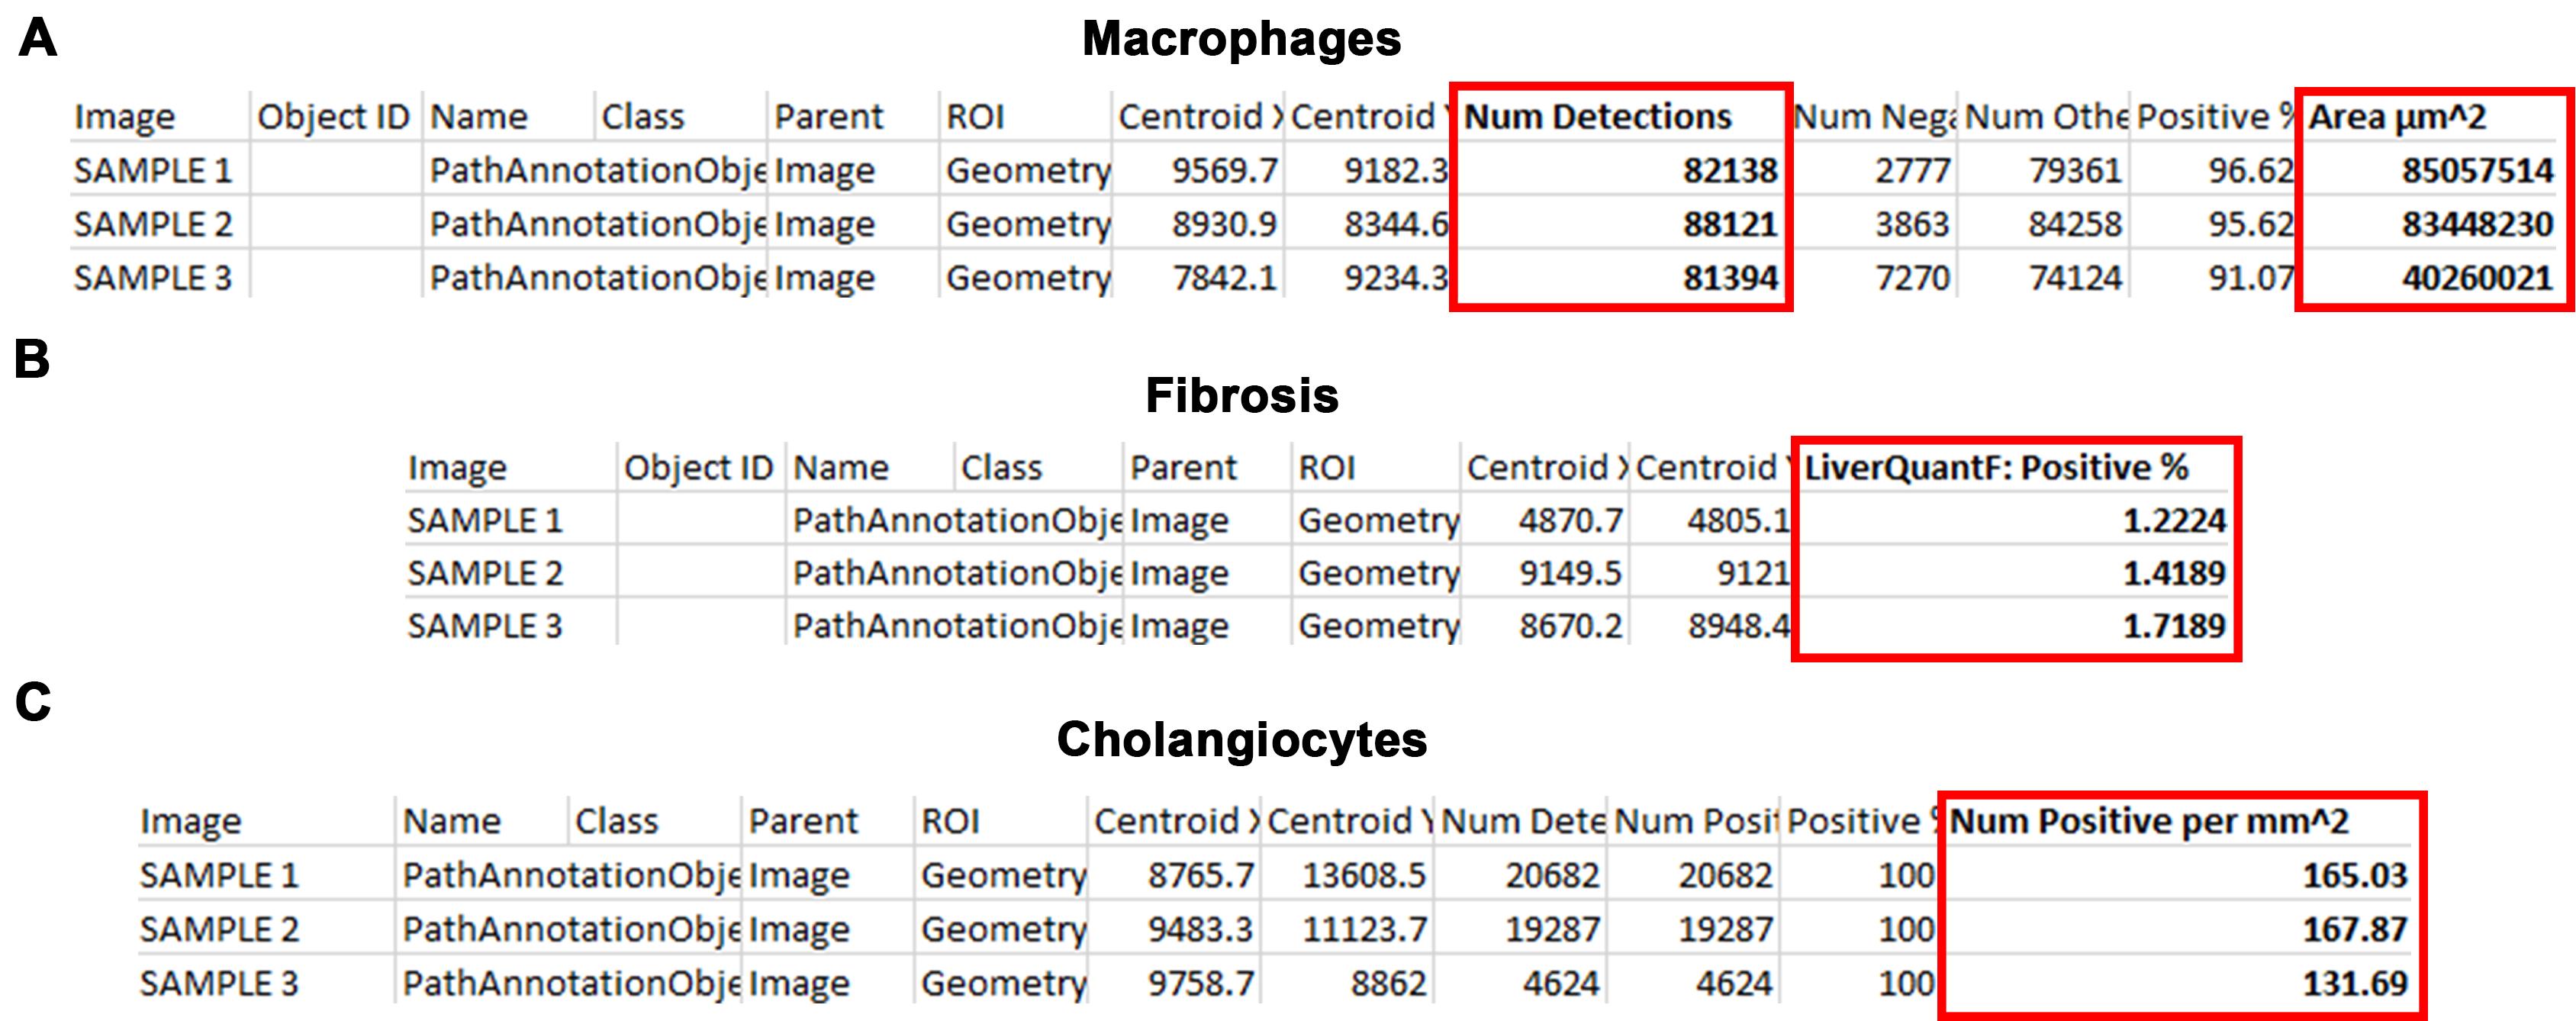
Figure 8. Measurements generated by LiverQuant for comparative analyses. Representative photos from the .csv files generated by exporting LiverQuant measurements for A) macrophages, B) fibrosis, and C) cholangiocytes. Red box indicates the important metric for data analysis.
Data analysis
The detection of macrophages, fibrosis, and cholangiocytes using the described protocol has been recently published (Hellen et al., 2023). In summary, the number of macrophages, fibrosis, and cholangiocytes were compared in a genetic model of biliary atresia (the Pkd1l1 liver conditional knockout mouse) between control and Pkd1l1-deficient livers. Macrophages, fibrosis, and cholangiocytes were all significantly increased within the knockout group, and those levels were further exacerbated in response to additional liver injury (bile duct ligation). All comparative analyses using the normalized exported measurements (Detections for macrophages, LiverQuantF: Positive % for fibrosis, and Num Positive per mm2 for cholangiocytes) (Figure 8) can be undertaken in PRISM, R, or Microsoft Excel. In most comparative workflows, a Student’s t-test or one-way ANOVA is sufficient. It is recommended that these comparisons be done using an n ≥ 5 for each group.
Validation of protocol
Fibrosis (Picosirius Red/Fast Green), cholangiocyte (CK19), and macrophage (F4/80) counts were analyzed from the same mouse liver slides using three methodologies: manual count, FIJI, and LiverQuant. Analysis in FIJI was done using a standard cell-counting approach whereby a Python-based script was used to threshold → convert to binary → watershed → analyze particles (Collins, 2007; Crowe and Yue, 2019; Szafranska et al., 2021). Standard metrics such as accuracy, rate of detection, and slide areas covered by maximum ROI were used to assess and establish the validity of LiverQuant.
Accuracy for macrophage and cholangiocyte cell detections was determined by comparing the number of positive cell classifications within the same ROI in LiverQuant and FIJI against the amount quantified by manual cell counting. Photoconversion to binary of a fibrosis-stained ROI resulted in the detection of all septa (manual count) and was compared to the amount recognized using LiverQuant and FIJI. The average rate for each methodology was calculated through the division of positive detections by the amount of time taken (in seconds). The largest ROI area that an individual could accurately quantify (manual count), and that FIJI could similarly work with to accurately detect cells, served as their respective maximum ROIs.
The package of scripts in LiverQuant, when compared to two conventional methodologies of histological quantification (manual and FIJI), demonstrated comparable accuracy of detection and quantification of fibrosis and cell counts (Figure 9A). Importantly, LiverQuant had two significant advantages over conventional quantitative methodologies: increased speed (Figure 9B) and a 50-fold greater tissue area coverage (Figure 9C).
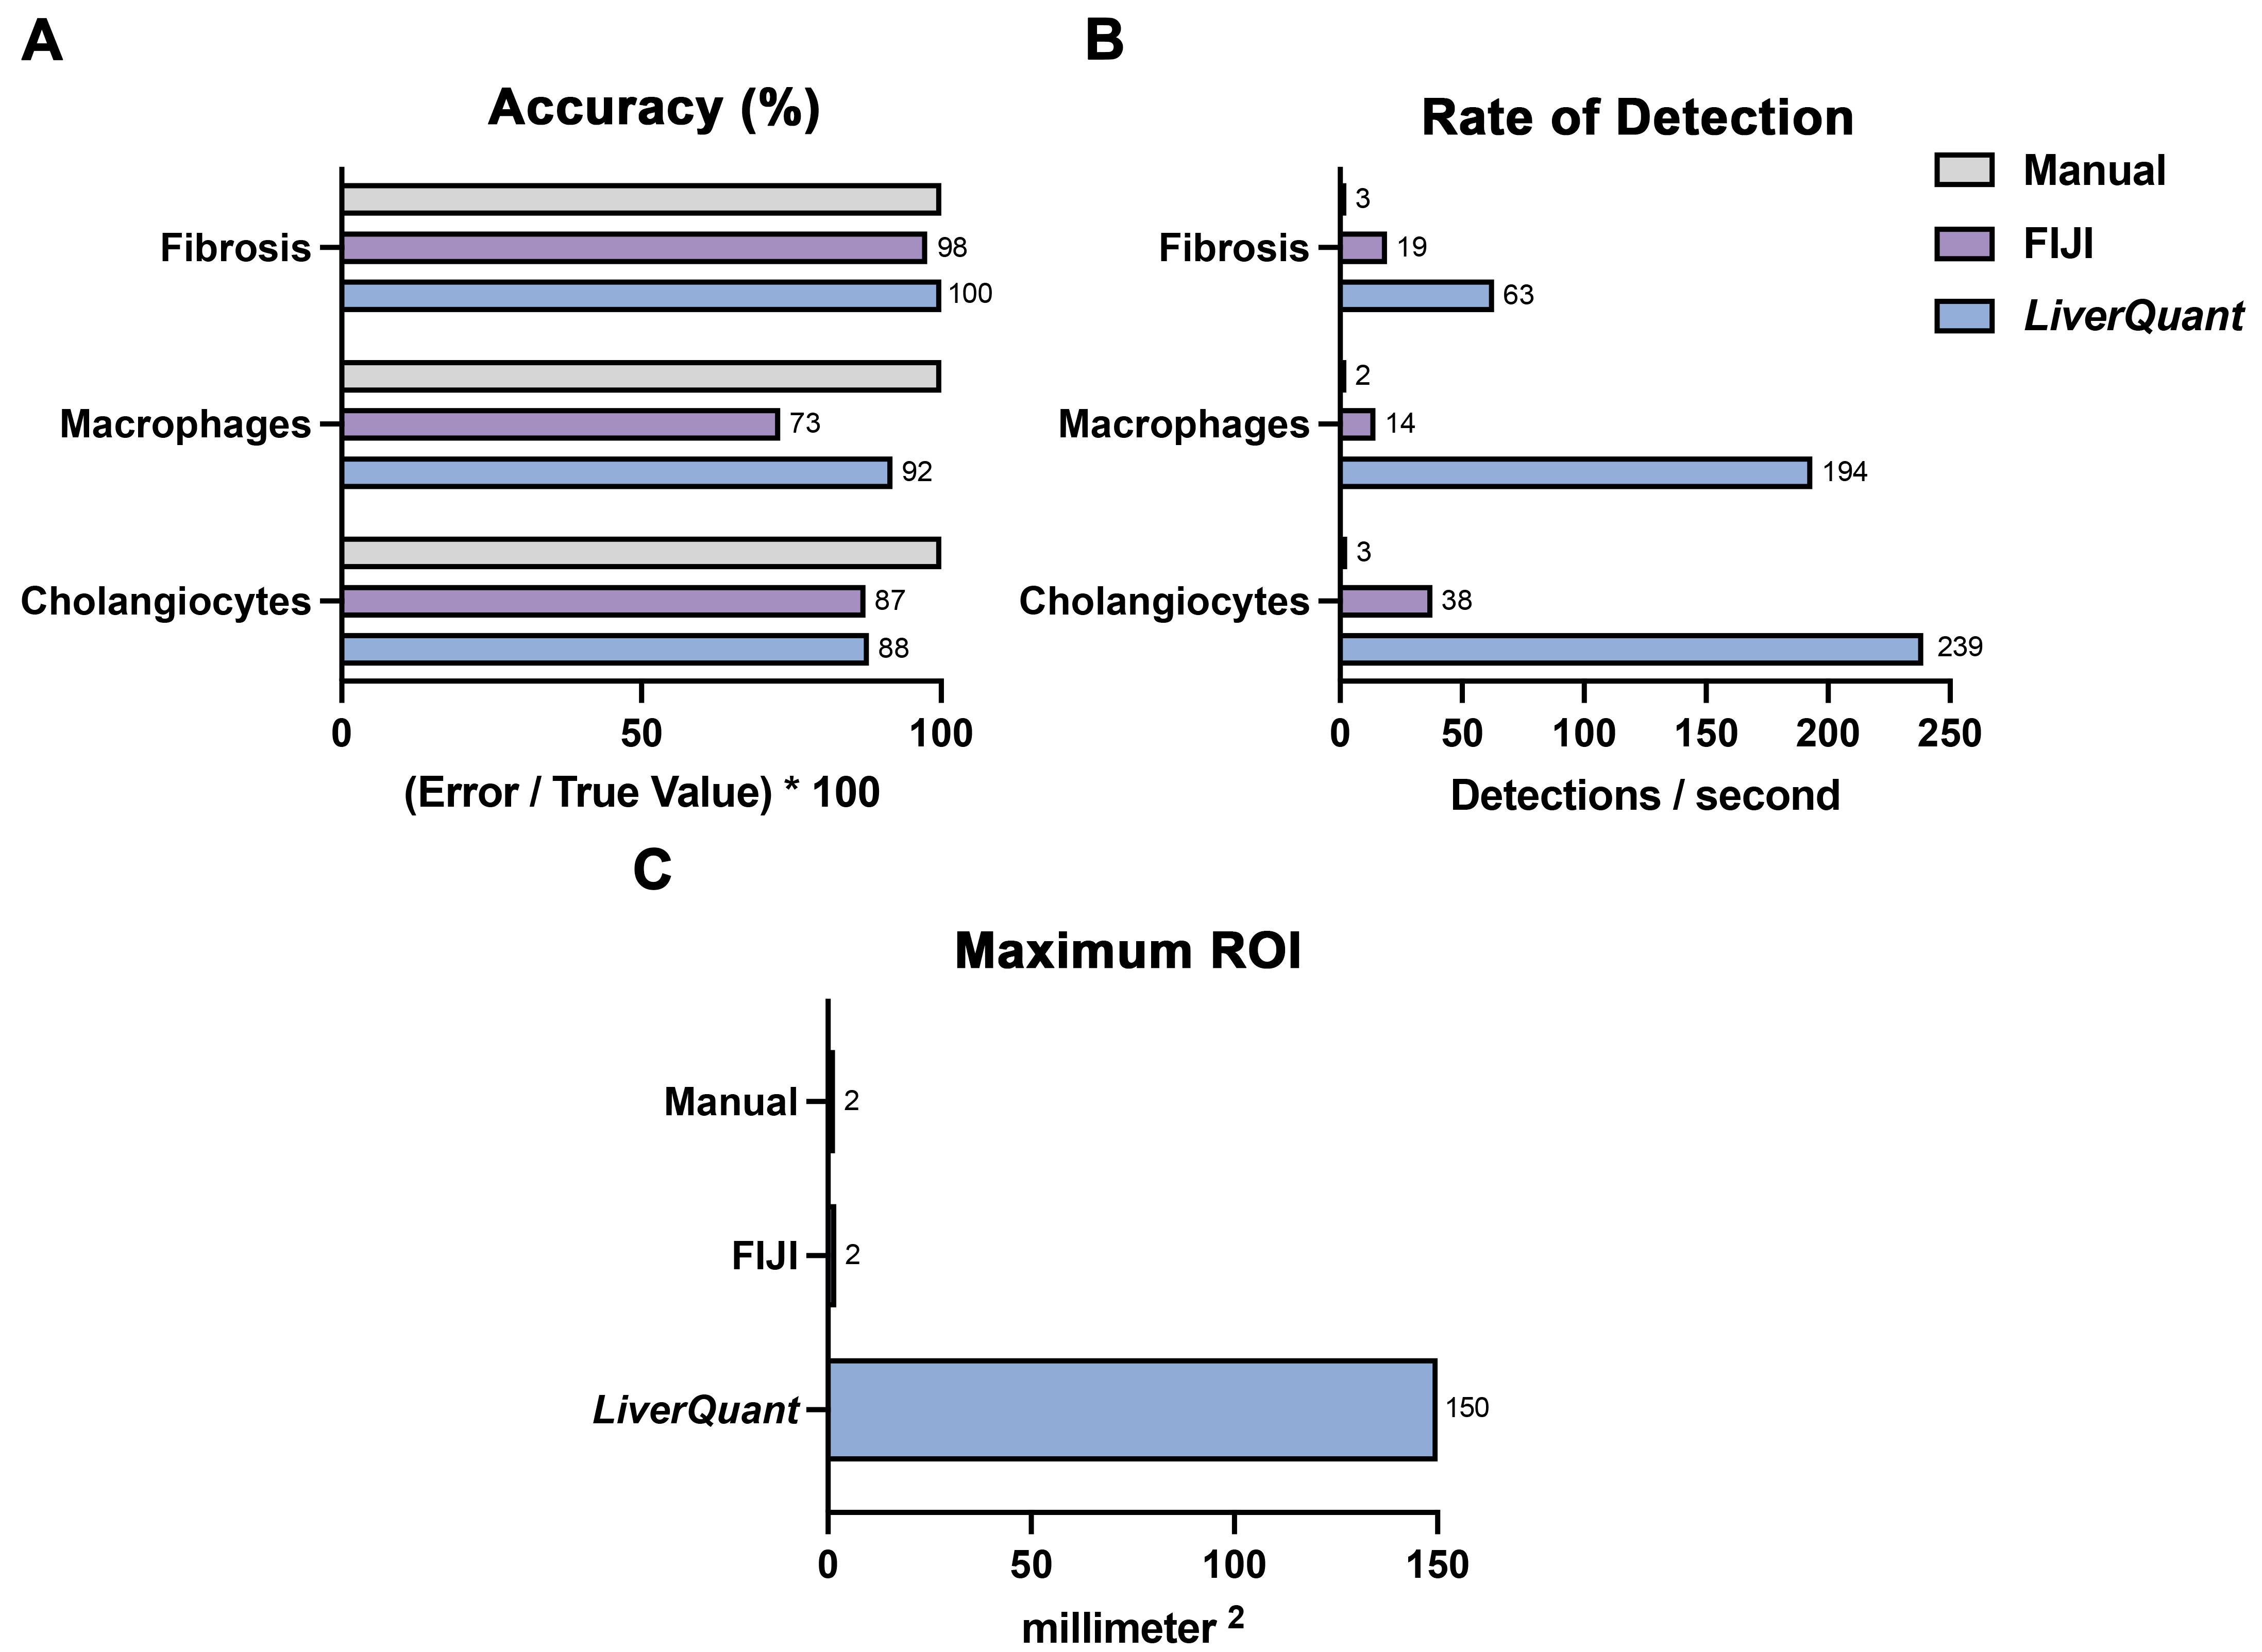
Figure 9. Evaluation of the LiverQuant methodology. A) Fibrosis, macrophage, and cholangiocyte quantification accuracy was compared in LiverQuant, FIJI, and manual counting (True Value; 100%). B) Detections per second for cell counts and fibrosis was faster in LiverQuant vs. FIJI and manual counting. C) The maximum ROI that LiverQuant can utilize for accurate profiling of histological matrices is greater than that of FIJI and manual.
Acknowledgments
Dominick J. Hellen received funding from the NIH (5T32GM008490-30). Saul J. Karpen received funding from the Mason Trust and the Meredith Brown Foundation.
Competing interests
D.H.: None
S.J.K.: Consultant for Albireo, Hemoshear, Intercept, Mirum
Ethical considerations
All mouse experiments were approved by the Emory University Institutional Care and Use Committee (IACUC).
References
- Abercrombie, M. (1946). Estimation of nuclear population from microtome sections. The Anatomical Record 94(2): 239–247.
- Alturkistani, H. A., Tashkandi, F. M. and Mohammedsaleh, Z. M. (2016). Histological Stains: A Literature Review and Case Study. Glob. J. Health Sci. 8(3): 72.
- Baghdasaryan, A., Fuchs, C. D., Österreicher, C. H., Lemberger, U. J., Halilbasic, E., Påhlman, I., Graffner, H., Krones, E., Fickert, P., Wahlström, A., et al. (2016). Inhibition of intestinal bile acid absorption improves cholestatic liver and bile duct injury in a mouse model of sclerosing cholangitis. J. Hepatol. 64(3): 674–681.
- Baker, M. (2016). Reproducibility crisis. Nature 533(26): 353–366.
- Bankhead, P., Loughrey, M. B., Fernández, J. A., Dombrowski, Y., McArt, D. G., Dunne, P. D., McQuaid, S., Gray, R. T., Murray, L. J., Coleman, H. G., et al. (2017). QuPath: Open source software for digital pathology image analysis. Sci. Rep. 7(1): 16878.
- Baratta, J. L., Ngo, A., Lopez, B., Kasabwalla, N., Longmuir, K. J. and Robertson, R. T. (2009). Cellular organization of normal mouse liver: a histological, quantitative immunocytochemical, and fine structural analysis. Histochem. Cell Biol. 131(6): 713–726.
- Ben-Moshe, S. and Itzkovitz, S. (2019). Spatial heterogeneity in the mammalian liver. Nat. Rev. Gastroenterol. Hepatol. 16(7): 395–410.
- Bogen, S. A. (2019). A Root Cause Analysis Into the High Error Rate in Clinical Immunohistochemistry. Appl. Immunohistochem. Mol. Morphol. 27(5): 329–338.
- Collins, T. J. (2007). ImageJ for microscopy. BioTechniques 43: S25–S30.
- Crowe, A. R. and Yue, W. (2019). Semi-quantitative Determination of Protein Expression Using Immunohistochemistry Staining and Analysis: An Integrated Protocol. Bio Protoc 9(24): e3465.
- Endo, K., Yoon, B. I., Pairojkul, C., Demetris, A. J. and Sirica, A. E. (2002). ERBB-2 overexpression and cyclooxygenase-2 up-regulation in human cholangiocarcinoma and risk conditions. Hepatology 36(2): 439–450.
- Fabris, L., Fiorotto, R., Spirli, C., Cadamuro, M., Mariotti, V., Perugorria, M. J., Banales, J. M. and Strazzabosco, M. (2019). Pathobiology of inherited biliary diseases: a roadmap to understand acquired liver diseases. Nat. Rev. Gastroenterol. Hepatol. 16(8): 497–511.
- Guilliams, M., Bonnardel, J., Haest, B., Vanderborght, B., Wagner, C., Remmerie, A., Bujko, A., Martens, L., Thoné, T., Browaeys, R., et al. (2022). Spatial proteogenomics reveals distinct and evolutionarily conserved hepatic macrophage niches. Cell 185(2): 379–396.e38.
- Gurcan, M. N., Boucheron, L. E., Can, A., Madabhushi, A., Rajpoot, N. M. and Yener, B. (2009). Histopathological Image Analysis: A Review. IEEE Rev. Biomed. Eng. 2: 147–171.
- Hellen, D. J., Bennett, A., Malla, S., Klindt, C., Rao, A., Dawson, P. A. and Karpen, S. J. (2023). Liver-restricted deletion of the biliary atresia candidate gene Pkd1l1 causes bile duct dysmorphogenesis and ciliopathy. Hepatology 77(4): 1274–1286.
- Heymann, F. and Tacke, F. (2016). Immunology in the liver — from homeostasis to disease. Nat. Rev. Gastroenterol. Hepatol.13(2): 88–110.
- Hu, S., Liu, S., Bian, Y., Poddar, M., Singh, S., Cao, C., McGaughey, J., Bell, A., Blazer, L. L., Adams, J. J., et al. (2022). Single-cell spatial transcriptomics reveals a dynamic control of metabolic zonation and liver regeneration by endothelial cell Wnt2 and Wnt9b. Cell Rep. Med. 3(10): 100754.
- Husain, H., Latief, U. and Ahmad, R. (2018). Pomegranate action in curbing the incidence of liver injury triggered by Diethylnitrosamine by declining oxidative stress via Nrf2 and NFκB regulation. Sci. Rep. 8(1): e1038/s41598-018-26611-1.
- Kamimoto, K., Nakano, Y., Kaneko, K., Miyajima, A. and Itoh, T. (2020). Multidimensional imaging of liver injury repair in mice reveals fundamental role of the ductular reaction. Commun. Biol. 3(1): e1038/s42003-020-1006-1.
- Lemaigre, F. P. (2020). Development of the Intrahepatic and Extrahepatic Biliary Tract: A Framework for Understanding Congenital Diseases. Annu. Rev. Pathol.: Pathol. Mech. Dis. 15(1): 1–22.
- Murphy, K. R. and Aguinis, H. (2022). HARKing: How Badly Can Cherry-Picking and Question Trolling Produce Bias in Published Results?. In: Key Topics in Behavioral Sciences (pp. 93–109). Springer.
- Nagy, P., Thorgeirsson, S. S. and Grisham, J. W. (2020). Organizational Principles of the Liver. In: Irwin M. Arias MD, Harvey J. Alter MD, MACP, James L. Boyer MD, David E. Cohen MD, PhD, David A. Shafritz MD, Snorri S. Thorgeirsson MD, PhD, Allan W. Wolkoff MD (Eds.). The Liver: Biology and Pathobiology (pp. 1–13).
- Ramachandran, P., Matchett, K. P., Dobie, R., Wilson-Kanamori, J. R. and Henderson, N. C. (2020). Single-cell technologies in hepatology: new insights into liver biology and disease pathogenesis. Nat. Rev. Gastroenterol. Hepatol. 17(8): 457–472.
- Saviano, A., Henderson, N. C. and Baumert, T. F. (2020). Single-cell genomics and spatial transcriptomics: Discovery of novel cell states and cellular interactions in liver physiology and disease biology. J. Hepatol. 73(5): 1219–1230.
- Szafranska, K., Holte, C., Kruse, L., Mao, H., Øie, C., Szymonski, M., Zapotoczny, B. and McCourt, P. (2021). Quantitative analysis methods for studying fenestrations in liver sinusoidal endothelial cells. A comparative study. Micron 150: 103121.
- Tan, W. C. C., Nerurkar, S. N., Cai, H. Y., Ng, H. H. M., Wu, D., Wee, Y. T. F., Lim, J. C. T., Yeong, J. and Lim, T. K. H. (2020). Overview of multiplex immunohistochemistry/immunofluorescence techniques in the era of cancer immunotherapy. Cancer Commun. 40(4): 135–153.
- Taylor, C. R. (2020). Milestones in Immunohistochemistry and Molecular Morphology. Appl. Immunohistochem. Mol. Morphol. 28(2): 83–94.
- Vogel, B., Siebert, H., Hofmann, U. and Frantz, S. (2015). Determination of collagen content within picrosirius red stained paraffin-embedded tissue sections using fluorescence microscopy. MethodsX 2: 124–134.
Article Information
Copyright
© 2023 The Author(s); This is an open access article under the CC BY-NC license (https://creativecommons.org/licenses/by-nc/4.0/).
How to cite
Hellen, D. J. and Karpen, S. J. (2023). LiverQuant: An Improved Method for Quantitative Analysis of Liver Pathology. Bio-protocol 13(14): e4776. DOI: 10.21769/BioProtoc.4776.
Category
Immunology > Immune cell imaging > Epifluorescence Microscopy
Cell Biology > Cell imaging > Fixed-tissue imaging
Do you have any questions about this protocol?
Post your question to gather feedback from the community. We will also invite the authors of this article to respond.