- Protocols

- Articles and Issues
- For Authors
- About
- Become a Reviewer

A Novel Method for Measuring Mitochondrial Respiratory Parameters in Wheat Paleae (Paleae Superior) Using the XF24 Analyzer
Published: Vol 13, Iss 15, Aug 5, 2023 DOI: 10.21769/BioProtoc.4767 Views: 1384
Reviewed by: Samik BhattacharyaNishanth SekarPriyanka Das
Advertisement


Protocol Collections
Comprehensive collections of detailed, peer-reviewed protocols focusing on specific topics


Abstract
Understanding the influence of secondary metabolites from fungi on the mitochondria of the host plant during infection is of great importance for the knowledge of fungus–plant interactions in general; it could help generate resistant plants in the future and in the development of specifically acting plant protection products. For this purpose, it must first be possible to record the mitochondrial parameters in the host plant. As of the date of this protocol, no measurements of mitochondrial respiration parameters have been performed in wheat paleae. The protocol shown here describes the measurements using the XF24 analyzer, which measures the rate of oxygen consumption in the sample by changes in the fluorescence of solid-state fluorophores. This procedure covers the preparation of samples for the XF24 analyzer and the measurement of mitochondrial parameters by adding specific mitochondrial inhibitors. It also shows the necessary approach and steps to be followed to obtain reliable, reproducible results. This is a robust protocol that allows the analysis of mitochondrial respiration directly in the wheat paleae. It demonstrates an important add-on method to existing screenings and also offers the possibility to test the effects of early infection of plants by harmful fungi (e.g., Fusarium graminearum) on mitochondrial respiration parameters.
Key features
• This protocol offers the possibility of testing the effects of early infection of plants by pathogens on mitochondrial respiration parameters.
• This protocol requires a Seahorse XF24 Flux Analyzer with Islet Capture Microplates and the Seahorse Capture Screen Insert Tool.
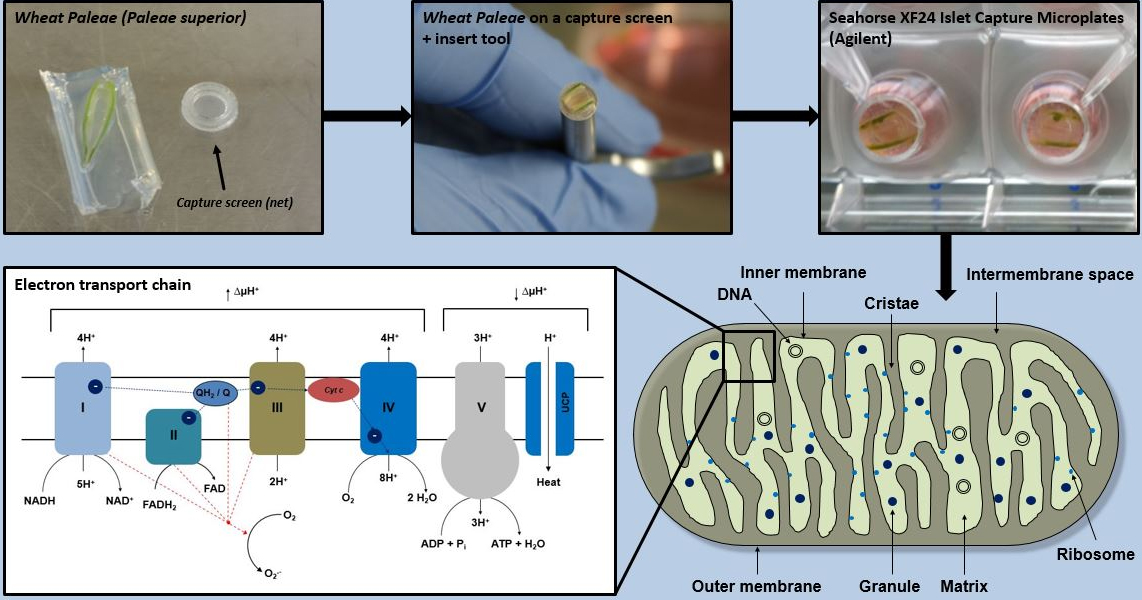
Graphical overview
Background
The filamentous ascomycete Fusarium graminearum is the main pathogen causing Fusarium head blight (FHB) in wheat (McMullen et al., 1997). The consequences of host plant infection lead to significant quantitative and economic losses (Goswami and Kistler, 2004), as the infection results in incompletely formed grains. During infection, Fusarium graminearum produces a variety of secondary metabolites, low-molecular-weight molecules that are generally not necessary for the growth or developmental processes of the fungus but result in contamination of the grain with harmful mycotoxins (Shwab and Keller, 2008). Contaminated grain thus becomes unusable as food for humans and animals.
One of these mycotoxins is butenolide, which was first isolated in 1967 and shown to be toxic to mitochondrial respiration in rat cardiac muscle tissue (Wang et al., 2009). Further studies revealed that mitochondria of muscle tissue are affected. This includes swelling, disruption of the double membrane, and disruption of mitochondrial respiration (Wang et al., 2007 and 2009; Pei et al., 2013). Whether plant mitochondria are also affected by butenolide has not yet been investigated in detail. However, the impairment of animal mitochondria by butenolide could be an indication of a possible effect of this metabolite on plant mitochondria. Therefore, understanding the function of these substances on mitochondria during infection is of great importance for the knowledge of fungus–plant interaction in general and should help to produce resistant plants in the future.
Because the measurement of mitochondrial respiration in cells from plant cultures may not fully reflect the real situation, we describe here a method for measuring mitochondrial respiration parameters in wheat paleae (paleae superior) using an XF24 Extracellular Flux Analyzer. To date, no measurements of mitochondrial respiratory parameters have been performed in wheat paleae. The XF24 analyzer is a respirometer based on a multi-well plate that measures oxygen consumption rate (OCR) by changes in the fluorescence of solid-state fluorophores (Gerencser et al., 2009). To obtain a mitochondrial respiration profile, mitochondrial agents are automatically injected through various ports during testing (Divakaruni et al., 2014). This procedure involves preparation of samples for the XF24 analyzer and the measurement of mitochondrial parameters by addition of specific mitochondrial inhibitors.
The analysis of mitochondrial respiration in these samples is an important addition to existing studies and also offers the possibility to test the effects of early infection of plants with harmful fungi on mitochondrial respiration parameters. This could contribute to the development of resistant plants as well as specifically acting plant protection products. In addition to questions on resistance to fungal attack, this protocol can be used to investigate questions relating to mitochondrial activity in wheat in more detail or to use mitochondrial parameters as a supplement to classical phenotyping.
Materials and reagents
Centrifuge tubes 15 and 50 mL (Sarstedt, catalog numbers: 62.554.001, 62.547.254)
Petri dishes (Sarstedt, catalog number: 83.3902)
Pipette tips 10, 20, 200, and 1,000 μL (Sarstedt, catalog numbers: 70.1130, 70.116, 70.760.002, 70.762)
Sterile filter 0.2 μm (Sarstedt, catalog number: 83.1826.001)
Wheat paleae (kept on 1.6% agarose gel at 4 °C for a maximum of 36 h) (prevention of dehydration during transport)
KCl (Carl Roth, catalog number: 6781.3)
KH2PO4 (Carl Roth, catalog number: 3904.2)
Na2HPO4·12H2O (Carl Roth, catalog number: N350.1)
NaCl (Carl Roth, catalog number: 3957.3)
NaOH (Carl Roth, catalog number: 6771.3)
Seahorse XF calibrant solution (Agilent Technologies, catalog number: 100840-000)
Seahorse XF Cell Mito Stress Test kit [oligomycin, FCCP (Carbonyl cyanide-4-(trifluoromethoxy)phenylhydrazone), and rotenone/antimycin A] (Agilent Technologies, catalog number: 103015-100); store at -20 °C
Agarose standard (Carl Roth, catalog number: 3810.3)
Dulbecco’s modified Eagle’s medium, high glucose (Sigma-Aldrich, catalog number: D7777-10L), storage at 4 °C
10 M NaOH (for adjustment of pH values) (see Recipes)
1.6% agarose gel (see Recipes)
1× PBS (see Recipes)
XF assay medium (see Recipes)
Equipment
Scalpel, stainless steel (Carl Roth, catalog number: T997.1)
Seahorse Capture Screen Insert Tool (Agilent Technologies, catalog number: 101135-100)
Seahorse XF24 Islet Capture FluxPak containing sensor cartridges and Islet Capture Microplates (Agilent Technologies, catalog number: 101174-100)
Tweezers, stainless steel (Carl Roth, catalog number: 2687.1)
Incubator at 37 °C without CO2 (GFL, catalog number: 4010)
pH Meter FiveEasyTM F20 (Mettler Toledo, catalog number: 30266626)
Pipettes, Eppendorf Research® Plus 10, 20, 200, and 1,000 μL (Eppendorf, catalog numbers: 3123000020, 3123000039, 3123000055, 3123000063)
Seahorse XF24 Flux Analyzer (Agilent Technologies, model: XF24, catalog number: 100737-100)
Software and datasets
Seahorse XF24 Flux Analyzer Software (instrument software) (Agilent Technologies, Version 1.8.1.1)
Wave (analysis software) (Agilent Technologies, Version 2.6.1)
GraphPad Prism (statistical software) (GraphPad Software, Inc., Version 9.5.1)
Procedure
Day before the assay
Hydrate the sensor cartridge in Seahorse XF calibrant solution according to the manufacturer’s instructions one day prior to measurement in a non-CO2 incubator.
Turn on the XF24 analyzer to preheat the system to 37 °C.
Day of the assay
Sample preparation
The previously cultivated wheat flowers (see Notes) are separated from a spike with a scalpel and the wheat paleae is then isolated from the flowers (Figure 1).
Wash the wheat paleae five times in 1× PBS.
After this step, the wheat paleae can be used directly for measurement or stored in 1.6% agarose at 4 °C until further use. The storage time at this temperature is seven days maximum (see Notes).
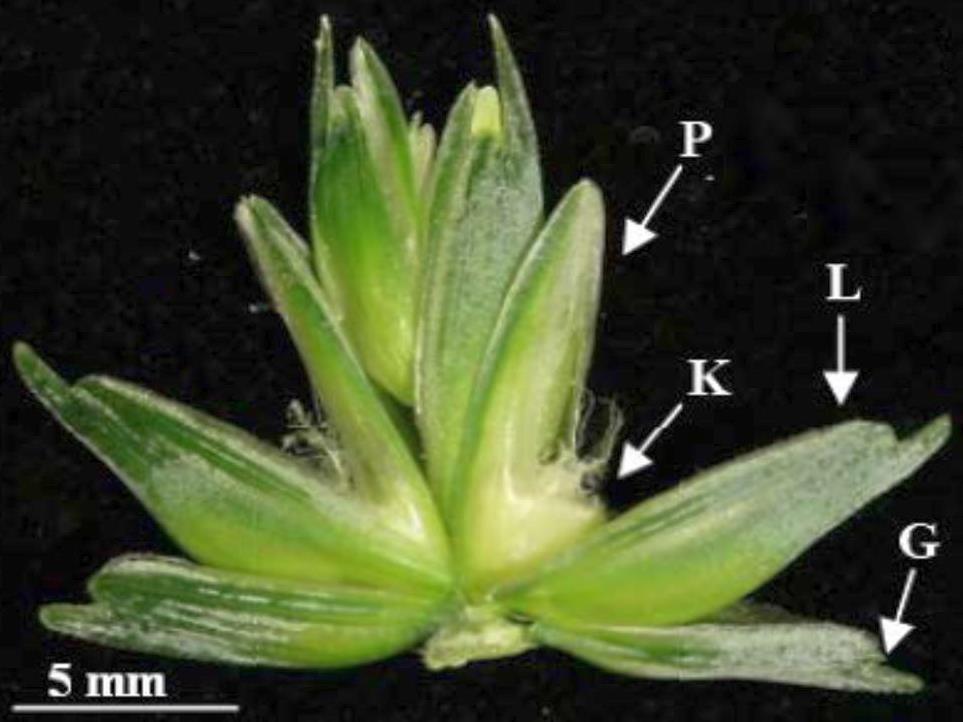
Figure 1. Structure of a wheat flower. P = Paleae, L = Lemma, K = Caryopsis, G = Gluma. Scale bar = 2 mm. Figure from Glasenapp (2017).
Assay
Prepare the XF assay medium and heat to 37 °C.
Take the wheat flower from the 1× PBS or agarose gel and wash it again five times in 1× PBS to remove any remaining impurities or residues of agarose (Figure 2A).
After removing the lower as well as the upper part of the wheat paleae, wash again in 1× PBS (Figure 2C).
Put the wheat paleae with its concave side (side with the wings) down, on a net [Figure 2B, 2C, and 2G (7–9)].
It is important to ensure that the wings of the wheat paleae side are facing down towards the capture screen. This orientation is essential for the measurement, as the side facing the capture screen gets detected by the sensor (Figure 2G).
Add 450 μL of XF assay medium into each well of the Islet Capture microplate.
Incubate the Islet Capture microplate in the incubator (without CO2) at 37 ° C for 45 min to adjust the wheat paleae to the new XF assay medium.
Load the injection ports of the sensor cartridge as programmed (see the programming of the XF controller), follow the instructions of the XF Analyzer, and start the calibration of the sensor cartridge.
When calibration is complete, place the Islet Capture microplate in the XF Analyzer and start the measurement.
Data analysis is performed with the Seahorse analysis software Wave.
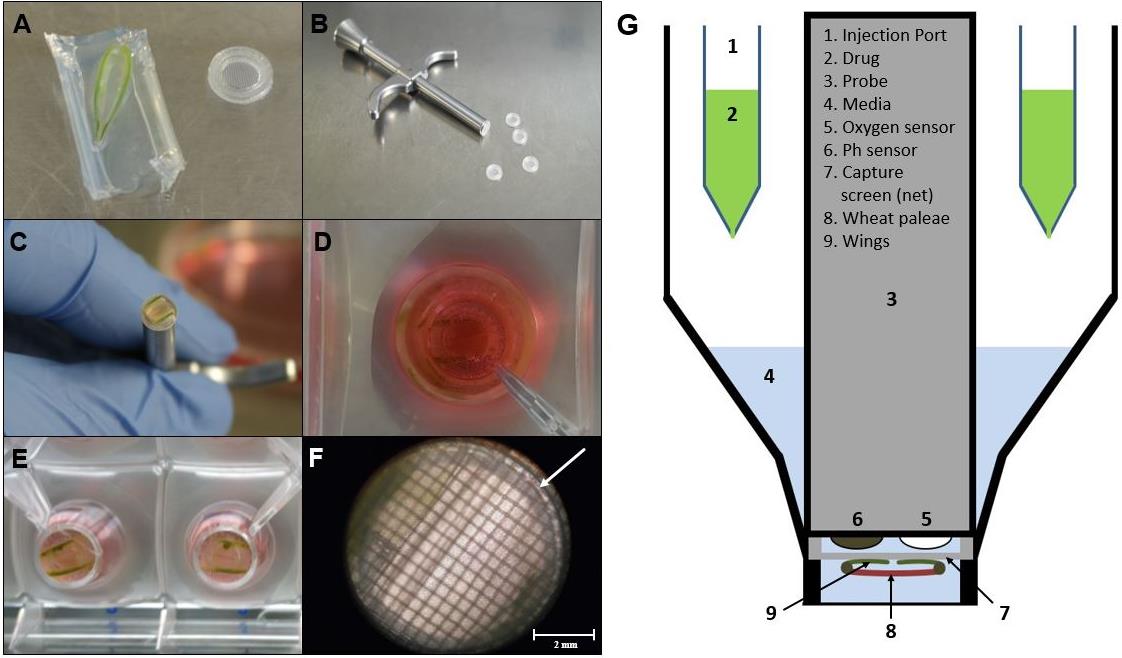
Figure 2. Microscopic image of wheat paleae in the XF24 Islet Capture microplate. The wheat paleae (A) must be placed on the net such that its upper side with its so-called wings points downwards in contact with the capture screen. The sample must then be placed in the multi-well plate, using the capture screen insert tool (B, C). Top view (D) and view from below (E) of wheat paleae inserted into the multi-well plate. The processed wheat paleae should cover the entire surface of the capture screen to ensure that the same area is always measured (D–F). The measurement of oxygen consumption takes place over the surface within the ring marked with the arrow (F). Schematic setup of the XF24 measuring system with an Islet Capture microplate (G). Scale bar = 2 mm.
Programming the XF controller
This section describes the individual program steps of the XF controller for measuring the OCR as shown in Figures 3 and 4. The stress reagents are diluted to a final concentration of 4 μM with XF assay medium. The concentration of oligomycin, FCCP, and rotenone/antimycin A should be determined in a preliminary experiment for the respective experimental conditions. The injection of the stress reagent should be simultaneously carried out in all wells. All measurements are done in several cycles. Each cycle involves 4 min mixing, 2 min waiting, and 3 min OCR and extracellular acidification rate (ECAR).
Workflow of the XF controller
Calibrate probes.
Time of Delay: 15 min.
First Loop: 3 times (Basal state).
Mixing: 4 min
Time of Delay: 2 min
Measurement: 3 min
Injection of Port A (50 μL of oligomycin, 4 μM final concentration).
Use oligomycin to block the ATP synthase.
Then, the decrease in OCR corresponds to the amount of oxygen used for ATP synthesis.
Second Loop: 6 times (decrease of ATP-linked respiration)
Mixing: 4 min
Time of Delay: 2 min
Measurement: 3 min
Injection of Port B (55 μL of FCCP, 4 μM final concentration).
The decoupling of the respiratory chain by FCCP allows the maximal respiration and the spare respiratory capacity to be determined independently of the proton gradient.
Third Loop: 3 times (potentially uncoupled respiration).
Mixing: 4 min
Time of Delay: 2 min
Measurement: 3 min
Injection of Port C (60 μL of rotenone/antimycin A, 4 μM final concentration).
In the last Loop, complexes I and II are blocked by the addition of rotenone and antimycin A. The remaining oxygen consumption thus depends only on the non-mitochondrial respiration.
Fourth Loop: 6 times (non-mitochondrial respiration).
Mixing: 4 min
Time of Delay: 2 min
Measurement: 3 min
End of Program.
Data analysis
Data can be analyzed using GraphPad Prism 9.5.1 (GraphPad Software, Inc.). Values are presented as mean ± SEM. Five replicates per experimental group are recommended.
Validation of protocol
This method is routinely used in our laboratory. N = 20+. Data are analyzed using Prism 9.5.1 (GraphPad Software, Inc.). Values are presented as mean ± SEM or individual values. Five replicates per experimental group are recommended. Background wells (distributed over the plate to exclude temperature effects) and wildtype wheat paleae with and without inhibitors are used as controls. Also, different orientations of wheat paleae were applied in the experimental setup. Prior to the use of this assay, extensive establishment and validation work was carried out over a period of several weeks. This protocol was published in the PhD thesis “Studies on early infection of wheat Paleae by Fusarium graminearum” by the Hamburg University and additionally presented at international congresses (Glasenapp, 2017).
Representative data
Measurement of OCR in wheat paleae according to the proceeding steps (Figure 3) shows the typical course after addition of the four stress reagents oligomycin, FCCP, and rotenone/antimycin A as depicted by the black curve in Figure 4.
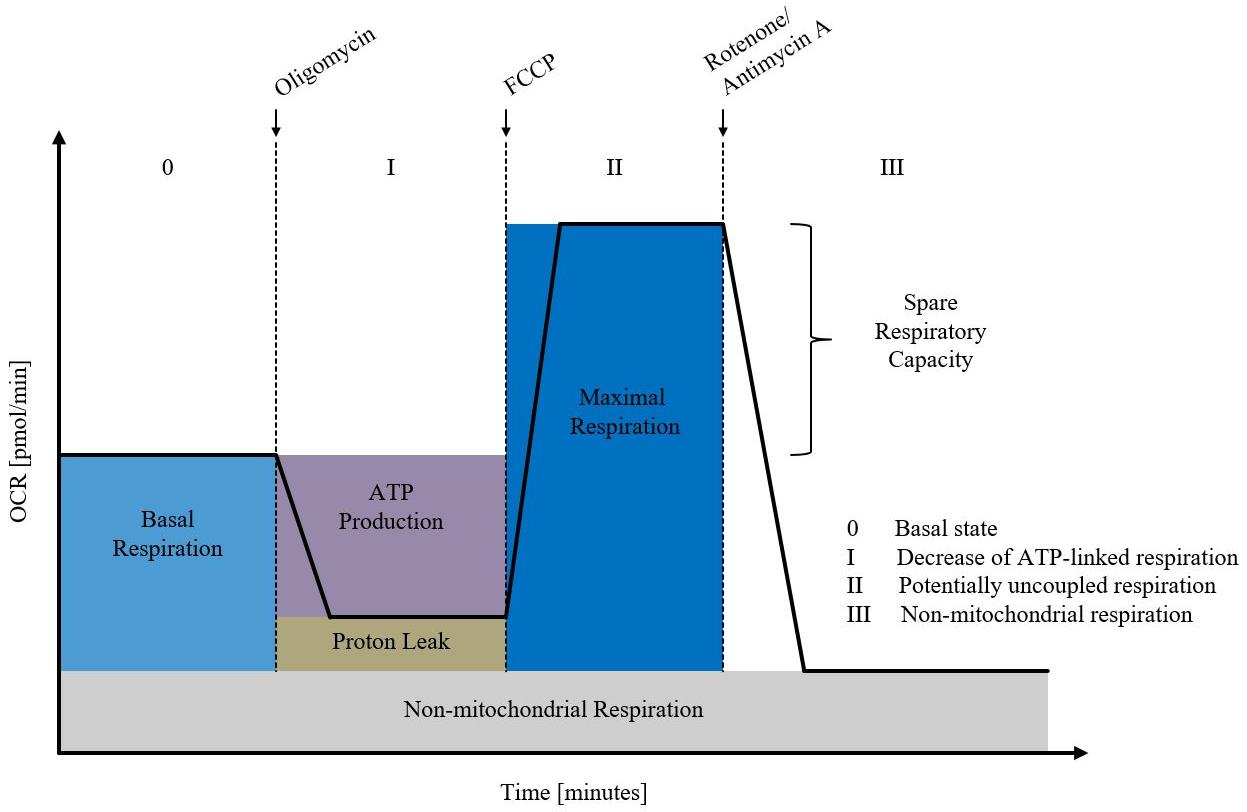
Figure 3. Exemplary XF24 measurement using the XF Cell Mito Stress Test kit (Agilent Technologies). Shown is the oxygen consumption rate (OCR; pmoles/min) as a function of time (minutes). First, the basal respiration is recorded. The addition of oligomycin determines proton leakage and ATP-linked respiration. FCCP is used to measure maximal respiration. Antimycin A and rotenone block respiration of the mitochondria, to determine non-mitochondrial respiration. Figure created after the template of Agilent Technologies (Agilent Technologies. Retrieved October 15, 2019, from https://www.agilent.com/en/products/cell-analysis/seahorse-xf-consumables/kitsreagents-media/seahorse-xf-cell-mito-stress-test-kit#additionalinformation).
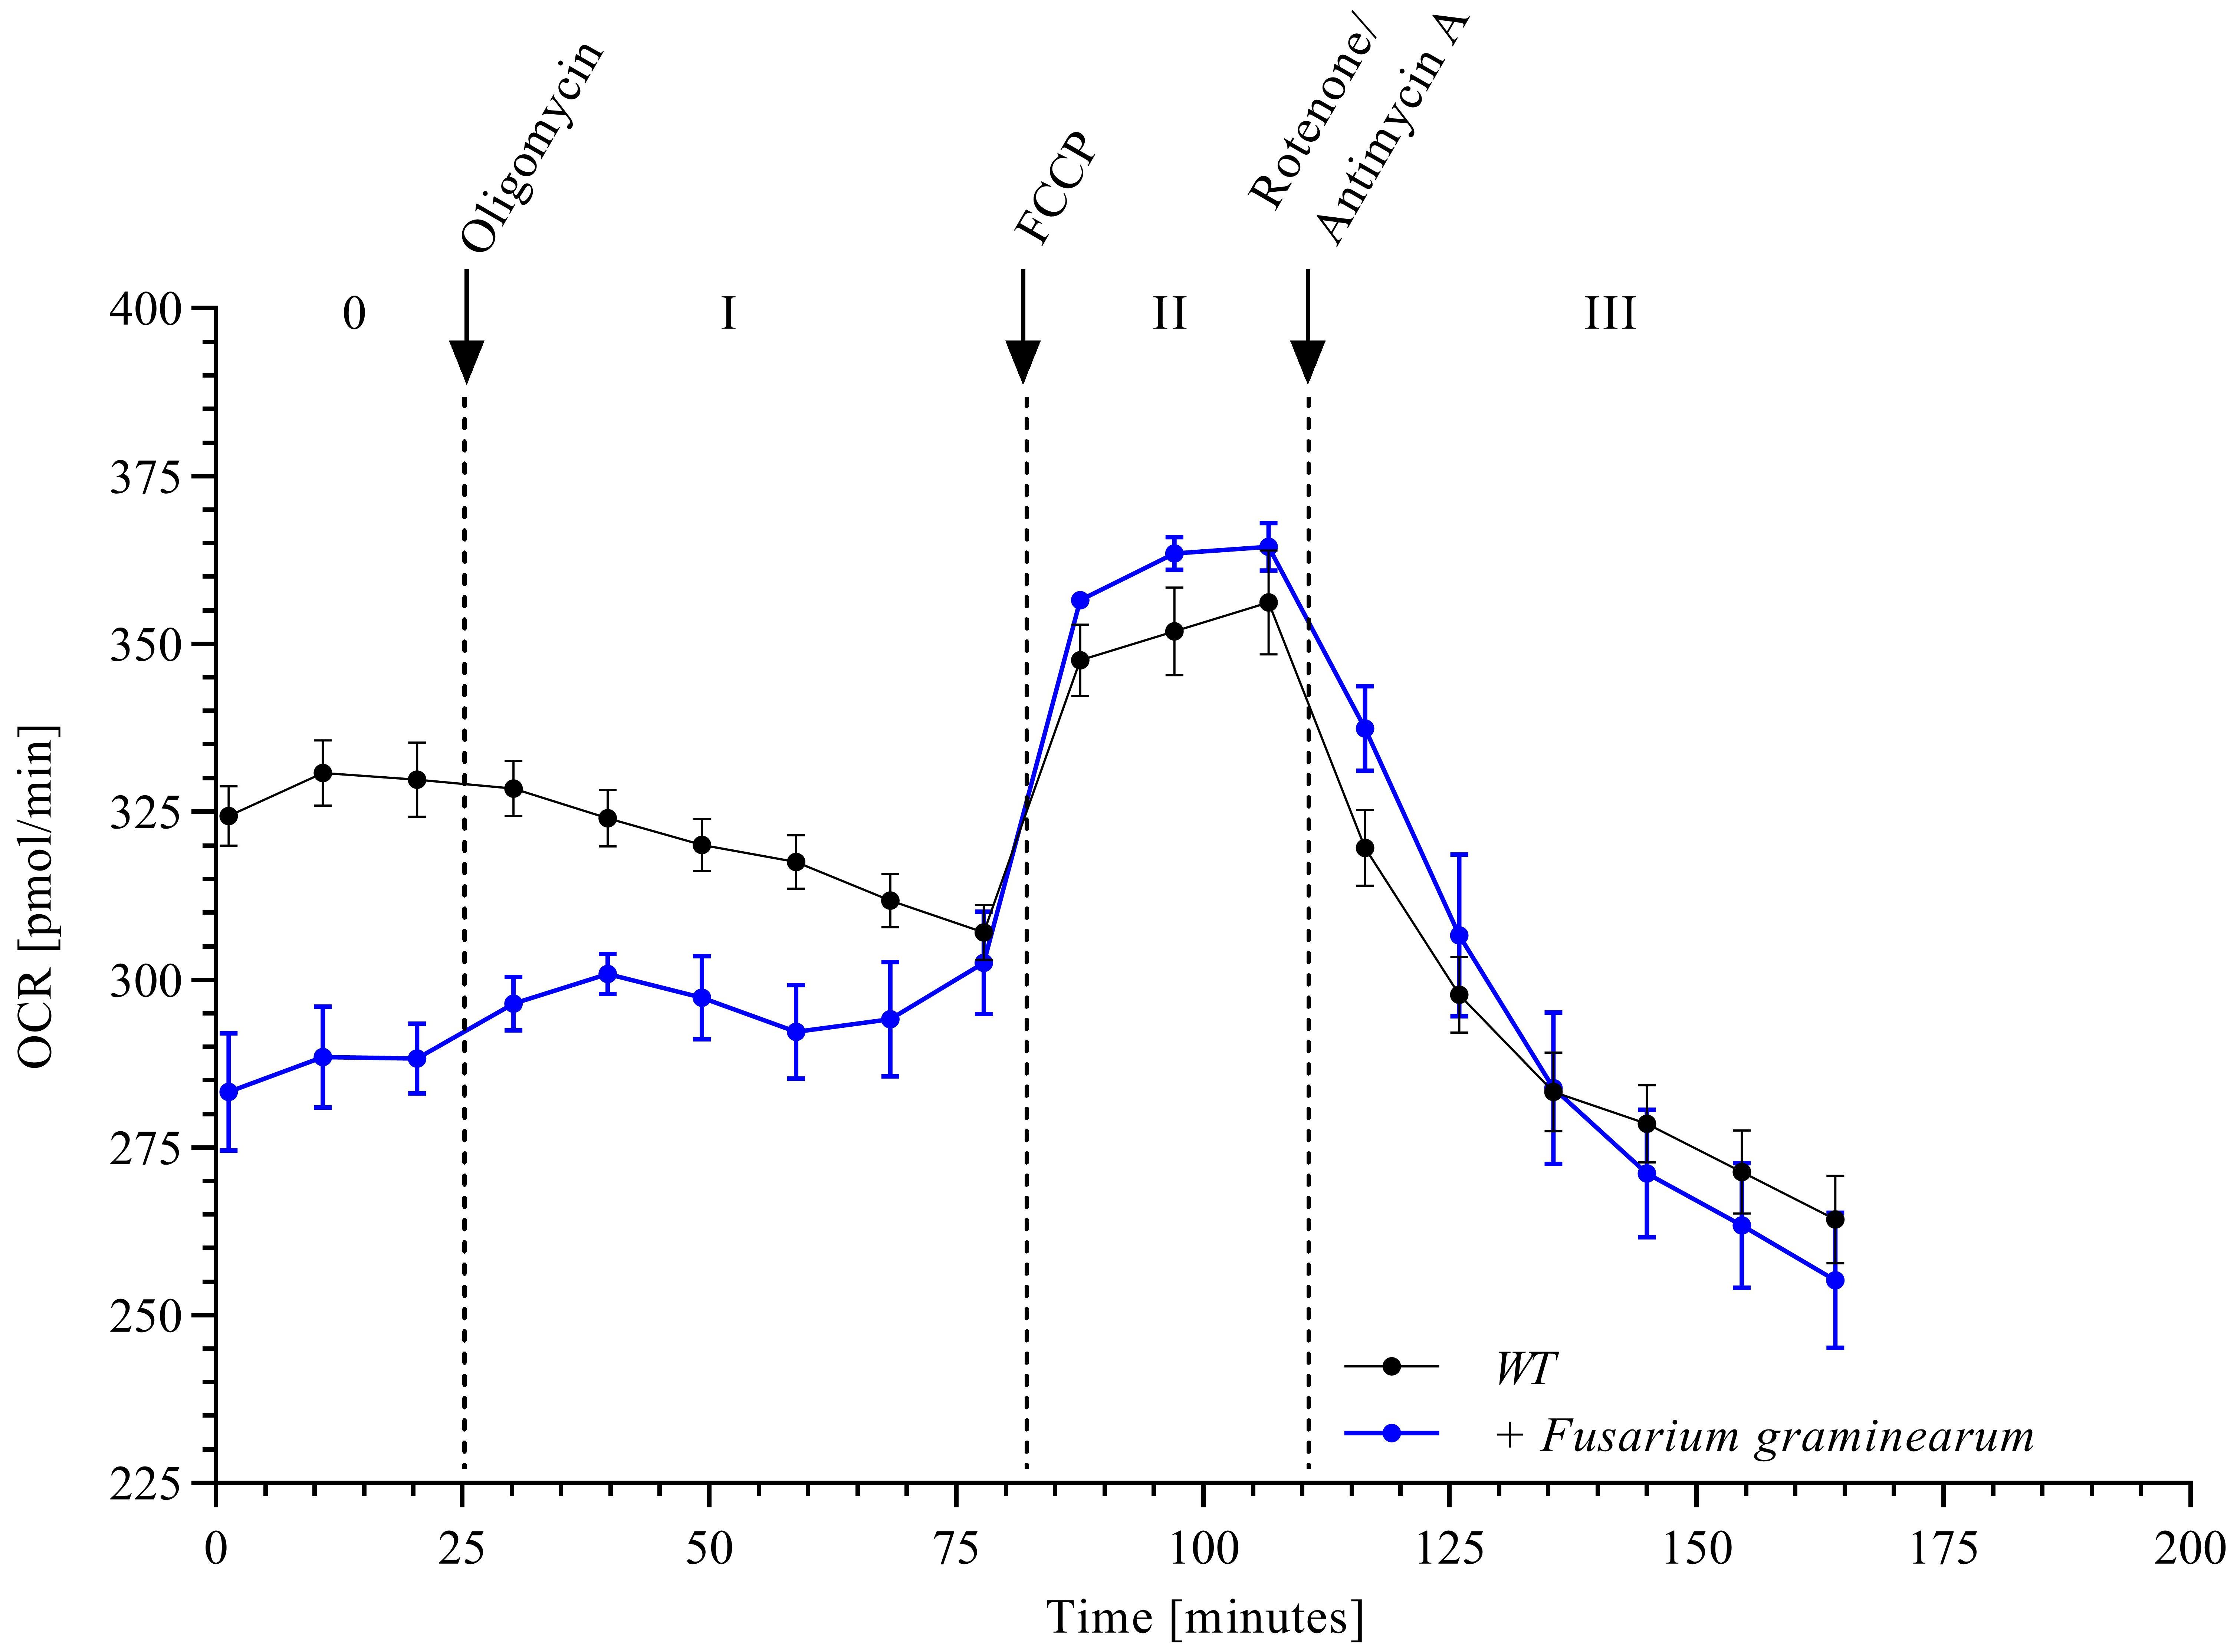
Figure 4. Oxygen consumption rate (OCR) in wheat paleae. Scheme depicting the main stages after injecting the four active ingredients in three injecting steps. This makes it possible to determine the efficiency of the individual complexes within the respiratory chain in wildtype wheat paleae (WT) (n = 10, mean ± SEM) and wheat paleae infected with Fusarium graminearum (n = 3, mean ± SEM).
Notes
The measurement of OCR in wheat paleae described here was highly reproducible. Also, different orientations of wheat paleae were applied in the experimental setup. Prior to the use of this assay, extensive establishment and validation work was carried out over a period of several weeks.
The concentration of oligomycin, FCCP, and rotenone/antimycin A should be determined in a preliminary experiment for the respective experimental conditions. The indicated concentrations may differ for other samples. In preliminary studies, the concentration of 4 μM was determined. Lower concentrations show, in contrast to cell cultures, no or little effects.
Because wheat paleae are a complex cell system in which the substances simply take longer to penetrate the entire sample, a higher concentration and more measurement points, as stated in the Seahorse manual, must be used.
After removing the wheat paleae from the rest of the plant, these can be embedded in 1.6% agarose gel and stored at 4 °C. The samples should be stored for a maximum of seven days. It is important to perform the OCR measurement during this period, as the respiration parameters decrease significantly after.
The orientation of the wheat paleae in the measurement chamber is important because the wings are the most accessible for measuring mitochondrial respiration. Thus, the wings should be oriented in the direction of the sensors (Figure 2G). This is confirmed in samples where the wings are removed or placed facing away from the sensor (Figure 5).
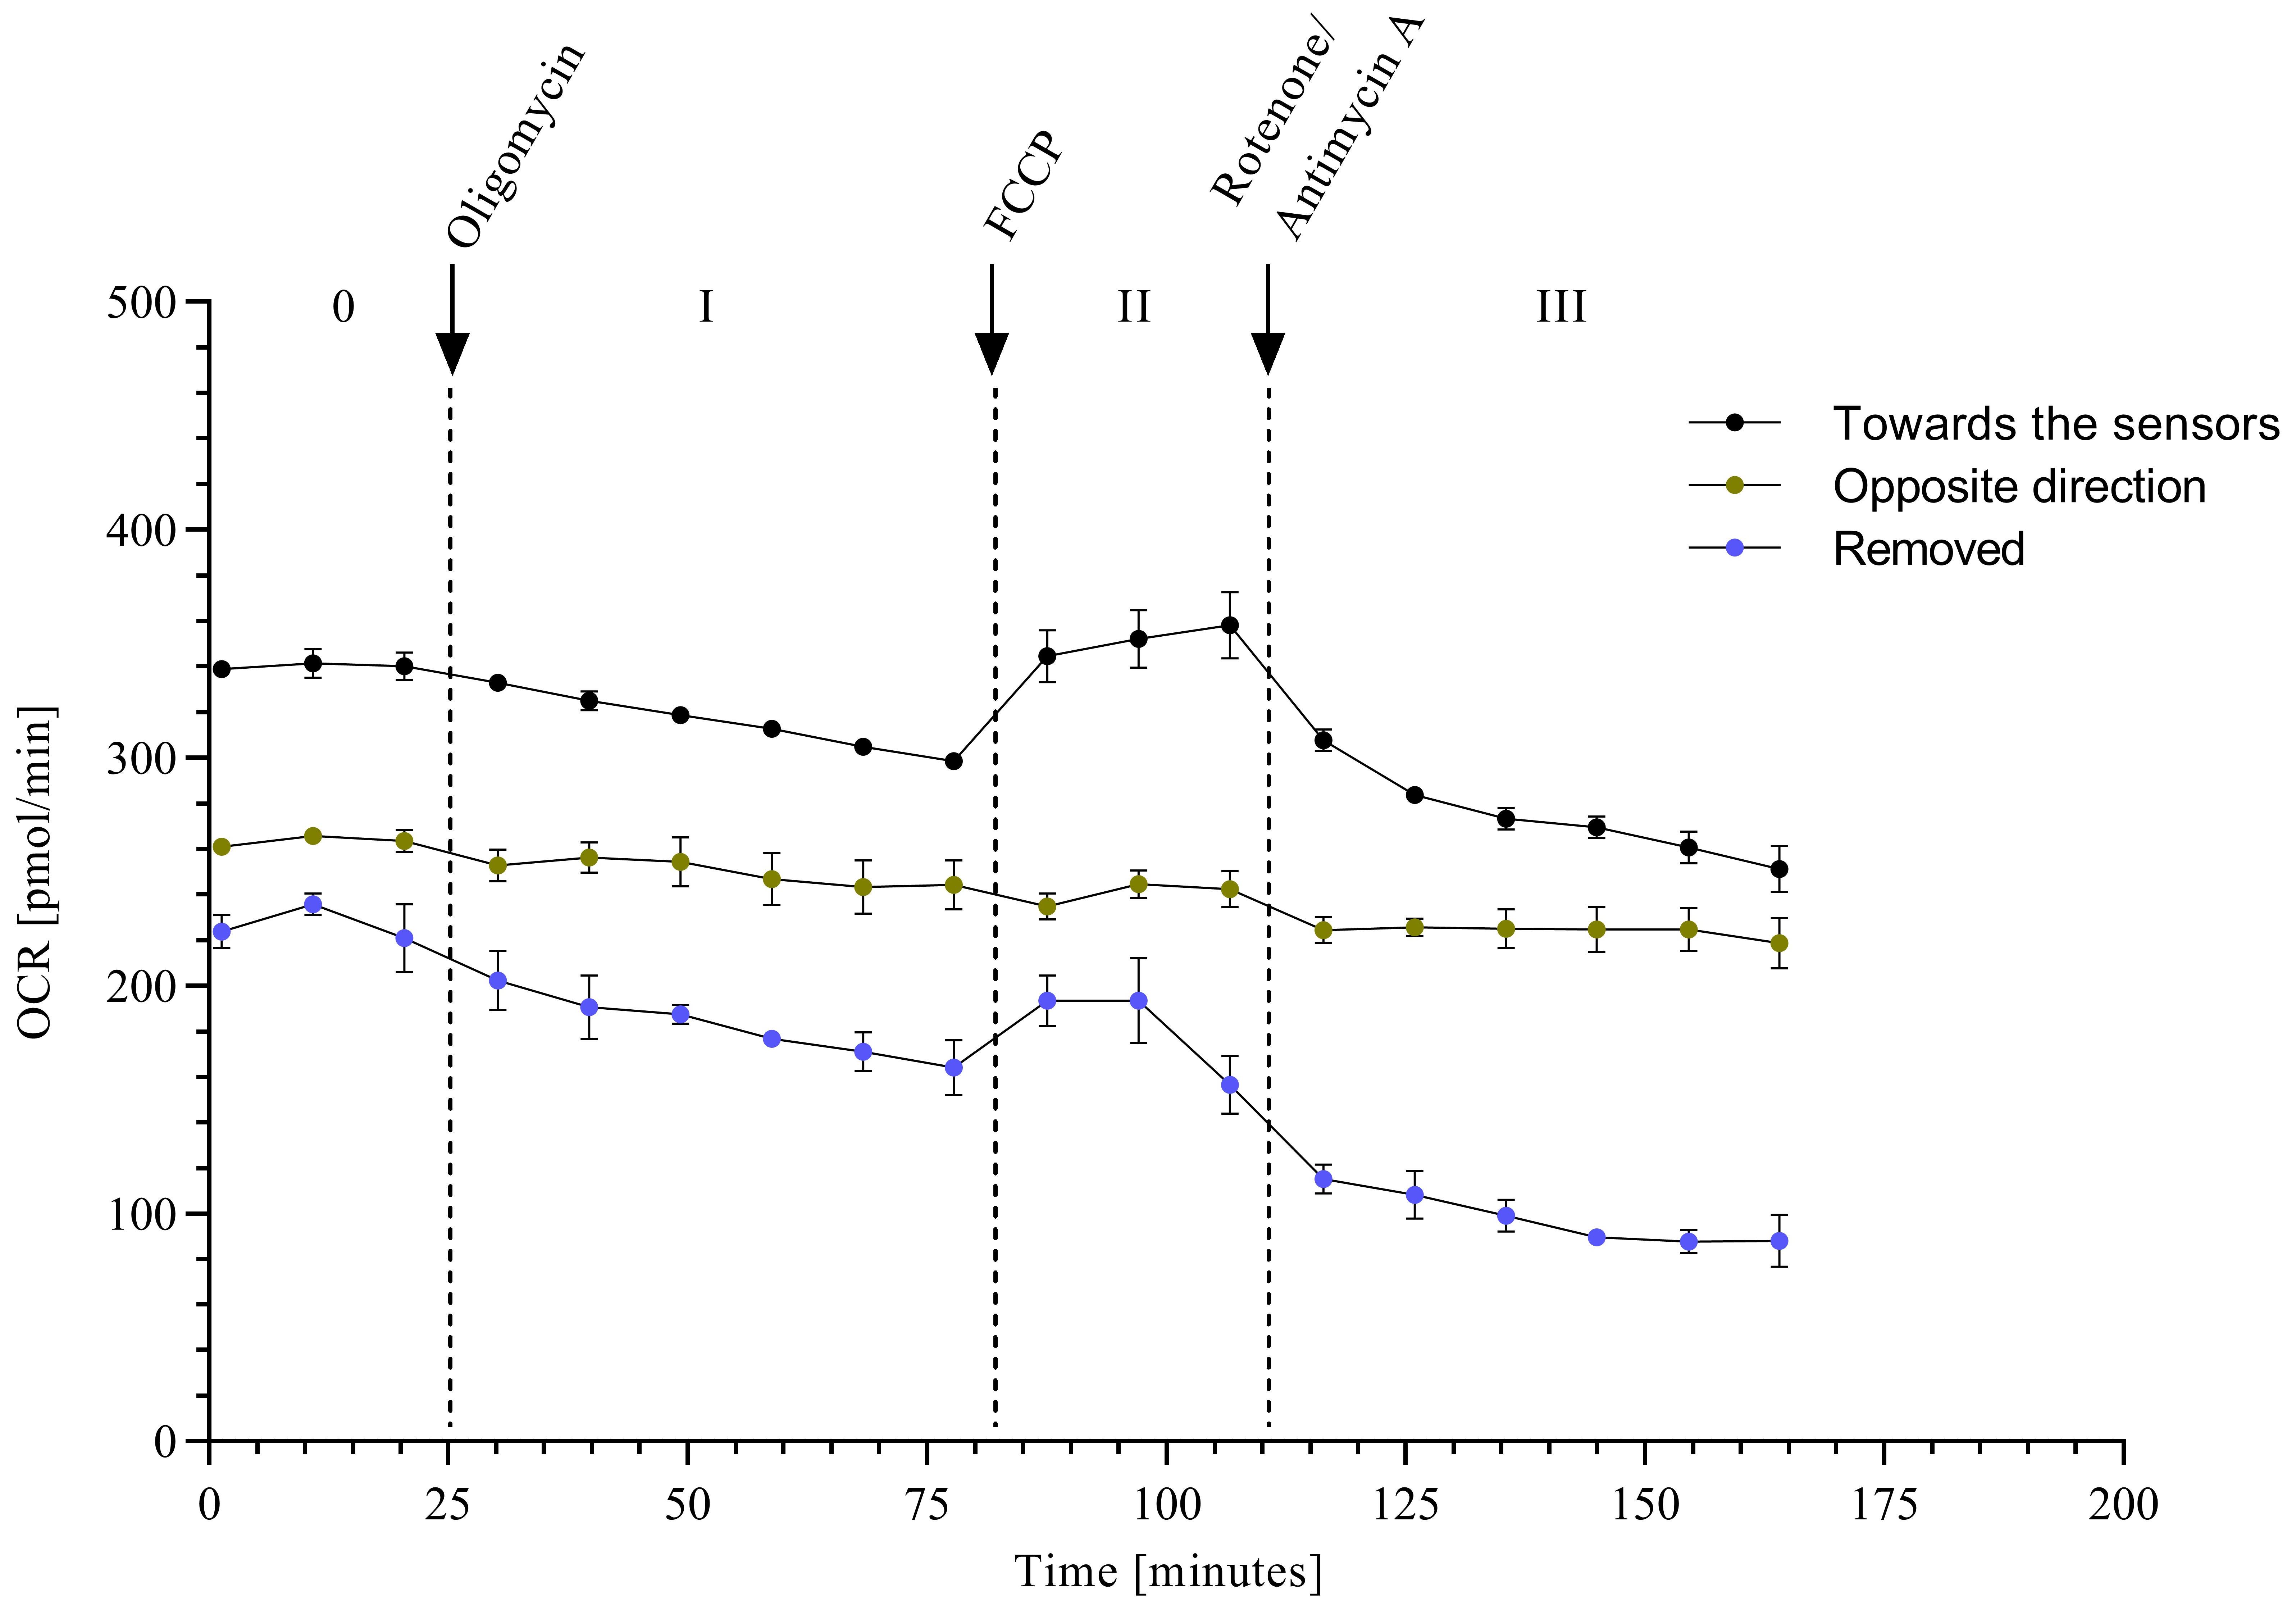
Figure 5. Oxygen consumption rate (OCR) in wheat paleae of different orientations. Shown are the curves of wheat paleae with different orientation or removal of the wings in the Seahorse XF24 Flux Analyzer (n = 5, mean ± SEM).The wheat cultivar Nandu (Lochow-Petkus, Bergen-Wohlde, Germany) used for the studies was cultivated in a growth chamber for approximately six weeks at 18–20 °C with 70% relative humidity and a photoperiod of 16 h until flowering.
Based on the measured OCR values (Figure 4), further mitochondrial parameters such as basal respiration, ATP production, but also maximum respiration or proton leak can be analyzed using the Seahorse software (Wave) (Figure 3).
The only limitation of this protocol is the requirement of Seahorse XF24 Flux Analyzer with Islet Capture microplates and the Seahorse Capture Screen Insert Tool equipment.
The Islet Capture microplate includes 24 wells, leaving four wells empty to be used as background.
Recipes
10 M NaOH
40 g of NaOH
add 100 mL of ddH2O
1.6% agarose gel
1.6 g of agarose
add 100 mL of ddH2O
1× PBS
8 g of NaCl
0.20 g of KCl
2.88 g of Na2HPO4·12H2O
1.24 g of KH2PO4
add 1 L of ddH2O, pH 7.4
XF assay medium
0.675 g of Dulbecco’s modified Eagle’s medium, high glucose
add 50 mL of ddH2O, sterile filtering, pH 7.4
Acknowledgments
The authors thank Dr. Anika Glasenapp for the kind supply of samples. They also thank Dr. Wilhelm Schäfer for scientific advice. This study was supported by the BMBFFHprofUnt2012 “MitoFunk” (03FH022PX2) and by the Baden-Württemberg Ministry of Science, Research and Art. This protocol was modified based on the previous work from Schniertshauer et al (2019).
Competing interests
One of the authors has a consulting contract with MSE Pharmazeutika GmbH, Bad Homburg, Germany.
References
- Divakaruni, A. S., Paradyse, A., Ferrick, D. A., Murphy, A. N. and Jastroch, M. (2014). Analysis and Interpretation of Microplate-Based Oxygen Consumption and pH Data. Methods Enzymol. 547: 309–354.
- Gerencser, A. A., Neilson, A., Choi, S. W., Edman, U., Yadava, N., Oh, R. J., Ferrick, D. A., Nicholls, D. G. and Brand, M. D. (2009). Quantitative Microplate-Based Respirometry with Correction for Oxygen Diffusion. Anal. Chem. 81(16): 6868–6878.
- Goswami, R. S. and Kistler, H. C. (2004). Heading for disaster: Fusarium graminearum on cereal crops. Mol. Plant Pathol 5(6): 515–525.
- Glasenapp, A. (2017). Studies on early infection of wheat Paleae by Fusarium graminearum. PhD thesis. Hamburg University.
- McMullen, M., Jones, R. and Gallenberg, D. (1997). Scab of Wheat and Barley: A Re-emerging Disease of Devastating Impact. Plant Disease 81(12): 1340–1348.
- Pei, J., Fu, W., Yang, L., Zhang, Z. and Liu, Y. (2013). Oxidative Stress Is Involved in the Pathogenesis of Keshan Disease (an Endemic Dilated Cardiomyopathy) in China. Oxid. Med. Cell. Longevity 2013: 1–5.
- Shwab, E. K. and Keller, N. P. (2008). Regulation of secondary metabolite production in filamentous ascomycetes. Mycol. Res. 112(2): 225–230.
- Schniertshauer, D., Gebhard, D. and Bergemann, J. (2019). A New Efficient Method for Measuring Oxygen Consumption Rate Directly ex vivo in Human Epidermal Biopsies. Bio-protocol 9(5): e3185.
- Wang, Y. M., Peng, S. Q., Zhou, Q., Wang, M. W., Yan, C. H., Wang, G. Q. and Yang, H. Y. (2007). The oxidative damage of butenolide to isolated erythrocyte membranes. Toxicol. In Vitro 21(5): 863–869.
- Wang, Y. M., Liu, J. B. and Peng, S. Q. (2009). Effects of Fusarium Mycotoxin Butenolide on Myocardial Mitochondria In Vitro. Toxicol. Mech. Methods 19(2): 79–85.
Article Information
Copyright
© 2023 The Author(s); This is an open access article under the CC BY-NC license (https://creativecommons.org/licenses/by-nc/4.0/).
How to cite
Schniertshauer, D. and Bergemann, J. (2023). A Novel Method for Measuring Mitochondrial Respiratory Parameters in Wheat Paleae (Paleae Superior) Using the XF24 Analyzer. Bio-protocol 13(15): e4767. DOI: 10.21769/BioProtoc.4767.
Category
Plant Science > Plant physiology > Metabolism
Cell Biology > Cell-based analysis > Mitochondrial respiration
Do you have any questions about this protocol?
Post your question to gather feedback from the community. We will also invite the authors of this article to respond.