- Protocols

- Articles and Issues
- For Authors
- About
- Become a Reviewer

Measuring Myeloperoxidase Activity as a Marker of Inflammation in Gut Tissue Samples of Mice and Rat
Published: Vol 13, Iss 13, Jul 5, 2023 DOI: 10.21769/BioProtoc.4758 Views: 2808
Reviewed by: Pilar Villacampa AlcubierreRajesh ThippeshappaMarieta Ruseva

Protocol Collections
Comprehensive collections of detailed, peer-reviewed protocols focusing on specific topics


Abstract
Myeloperoxidase (MPO) is an enzyme contained in lysosomal azurophilic granules of neutrophils. MPO activity has been shown to correlate with the number of neutrophils in histological sections of the gastrointestinal tract and is therefore accepted as a biomarker of neutrophil invasion in the gut. This protocol describes an easy, cost-effective kinetic colorimetric assay to quantify myeloperoxidase activity in intestinal tissue samples. It is explained using tissue collected in mice but can also be used for other laboratory animals. In a first step, tissue specimens are homogenized using a phosphate buffer containing 0.5% hexadecyltrimethylammonium bromide (HTAB), which extracts MPO from neutrophils. The obtained supernatant is added to a reagent solution containing o-dianisidine dihydrochloride, which is a peroxidase substrate. Finally, the change in absorption is measured via spectrophotometry and converted to a standardized unit of enzyme activity. The assay is illustrated and compared to a commercially available enzyme-linked immunoassay (ELISA), demonstrating that MPO activity does not necessarily correlate with MPO protein expression in tissue samples.
Key features
• Optimized for use in mice and rats but can also be used for samples of other species.
• Measures enzymatic activity instead of mRNA or protein expression.
• Requires a spectrophotometer.
• Can be performed in duplo using 10 mg of (dry-blotted) gut tissue or more.
Graphical overview

Background
The presence of inflammatory infiltrates in the gastrointestinal tract is one of the hallmark characteristics of diseases such as ulcerative colitis and Crohn’s disease (Xavier and Podolsky, 2007). The pathogenesis of these diseases is frequently studied in rodents exposed to colitis-inducing chemicals such as acetic acid, dextran sodium sulfate (DSS), and 2,4,6-trinitrobenzene sulfonic acid (TNBS), or in genetically engineered mice that are prone to develop gastrointestinal inflammation spontaneously (Mizoguchi, 2012). To assess which factors contribute to the development, maintenance, and resolution of inflammation in the gut, the availability of sensitive assays to quantify this inflammation is essential.
Several methods are used to quantify the presence of inflammatory infiltrates in the gut. First, the degree of inflammation can be scored by quantifying the shortening and thickening of the intestinal wall via the weight:length ratio of the relevant region within the gastrointestinal tract (Solomon et al., 2010). Second, scoring systems can be used to assess the presence of ulcerations at an endoscopic, macroscopic, or microscopic level (Solomon et al., 2010; Heylen et al., 2013; Erben et al., 2014). Third, quantitative polymerase chain reactions (qPCR), bead-based immunoassays, or conventional enzyme-linked immunoassays (ELISAs) can be used to quantify the expression of pro-inflammatory cytokines such as tumor necrosis factor α (TNF-α) or interleukin 1β (IL-1β) (Khan et al., 2004; Yan et al., 2009; Kim et al., 2012). Finally, myeloperoxidase (MPO) activity can be measured as a biomarker of inflammation. MPO is a peroxidase contained within lysosomal azurophilic granules in neutrophils and released upon activation of the immune system (Schultz and Kaminker, 1962). It has been shown to correlate well with the number of neutrophils in histological sections and is therefore a simple, objective biochemical alternative to the labor-intensive histological analysis of inflammatory infiltrates (Krawisz et al., 1984).
The presence of MPO in tissue samples can be assessed in different ways. First, expression at the mRNA or protein level can be measured by means of qPCR or commercially available sandwich ELISAs, respectively. Second, kinetic assays can be used to evaluate enzymatic activity. In this protocol, we describe a simple, cost-effective kinetic colorimetric assay to determine MPO activity in intestinal tissue supernatant of mice. In addition, we compare our assay to an ELISA, demonstrating that the MPO concentration of the tissue does not necessarily reflect its enzymatic activity. The protocol consists of several steps. First, obtained tissue samples are homogenized in a potassium phosphate buffer containing 0.5% hexadecyltrimethylammonium bromide (HTAB), which solubilizes the enzyme. Next, the supernatant is added to a reagent solution containing o-dianisidine dihydrochloride. This peroxidase substrate turns brownish upon oxidation and can be detected via spectrophotometry (λ = 460 nm).
This protocol was developed and used to measure MPO activity in intestinal tissues of mice and rat (Moreels et al., 2001; Ruyssers et al., 2009; Vermeulen et al., 2011). It could, however, be easily adapted to measure MPO activity in human gastrointestinal biopsies, or in samples derived from other organs. However, spectrophotometric interference by tissue myoglobin or vascular hemoglobin can occur, requiring adaptations of the protocol for organs such as the heart or brain (Kuebler et al., 1996; Xia and Zweier, 1997).
Materials and reagents
Reagents
di-Potassium hydrogen phosphate (K2HPO4) (VWR, catalog number: 71003, CAS number: 7758-11-4), store at room temperature
Dulbecco’s phosphate buffered saline (DPBS), including calcium and magnesium (Gibco, catalog number: 14040133), store at room temperature
Hexadecyltrimethylammonium bromide (Sigma-Aldrich, catalog number: H5882, CAS number: 57-09-0), store at room temperature
Hydrogen peroxide 30% (H2O2) (Merck, catalog number: 107209, CAS number: 7722-84-1), store at 4 °C
o-Dianisidine dihydrochloride (Sigma-Aldrich, catalog number: D3252, CAS number: 20325-40-0), store at 4 °C
Potassium dihydrogen phosphate (KH2PO4) (Merck, catalog number: 104873, CAS number: 7778-77-0), store at room temperature
Sodium chloride 0.9% for injection (NaCl) (B. Braun, catalog number: 76363, CAS number: 7647-14-5), store at room temperature
Deionized water (H2O), prepared using the Elix® water purification system (see Equipment), store at room temperature
Solutions
Potassium phosphate buffer (pH = 6.0) (see Recipes)
Homogenization buffer (see Recipes)
Assay reagent (see Recipes)
Recipes
Potassium phosphate buffer (pH = 6.0)
Prepare a 50 mM KH2PO4 solution by dissolving 6.805 g of KH2PO4 in 1 L of deionized H2O.
Prepare a 50 mM K2HPO4 solution by dissolving 5.706 g of K2HPO4 in 0.5 L of deionized H2O.
Adjust the pH of the KH2PO4 solution by gradually adding the 50 mM K2HPO4 solution, until a pH of 6.0 is reached.
Homogenization buffer
Dissolve 2.5 g of hexadecyltrimethylammonium bromide in 500 mL of potassium phosphate buffer.
Assay reagent (light sensitive; use amber bottles wrapped in silver foil to store this solution)
Prepare a 1% H2O2 solution by adding 100 μL of a 30% H2O2 solution to 2,900 μL of the potassium phosphate buffer.
Prepare a 0.05% H2O2 solution by adding 200 μL of a 1% H2O2 solution to 3,800 μL of the potassium phosphate buffer.
Dissolve 66.8 mg of o-dianisidine dihydrochloride in 4 mL of 0.9% NaCl solution.
Prepare the assay reagents by mixing 4 mL of 0.05% H2O2 solution, 4 mL of the o-dianisidine dihydrochloride solution, and 392 mL of the potassium phosphate buffer.
Laboratory supplies
Cryotubes Cryo.STM, 2 mL (Greiner Bio-One, catalog number: 126263)
Precellys® tubes, 2 mL (Bertin Technologies, catalog number: 9000538)
Cuvettes, 4.2 mL (Sarstedt, catalog number: 67.741)
Reusable oral gavage needle, 10 G × 25 mm (PetSurgical, catalog number: AFN2425S)
Syringe with luer lock tip, 5 mL (Terumo, catalog number: SS*05SE1)
Dissection material (scissors, fine tweezers)
Equipment
Elix® water purification system (Millipore, catalog number: ZLXS50020)
Progard® TL1 Cl2 pretreatment tap water filter (Milli-Q, catalog number: PR0GTLCS1)
Handheld pH meter (Oakton Instruments, model: pH 6+, catalog number: 35613-22)
Precellys® 24 tissue homogenizer (Bertin Technologies, catalog number: P000669-PR240-A)
Centrifuge (Eppendorf, catalog number: 5425R)
UV/Vis Spectrometer (ATI Unicam, model: UV2-100)
Software
Excel® (Microsoft) or any other software suitable for basic data manipulation
Procedure
Tissue collection
Euthanize the mouse by cervical dislocation. Alternatively, a different humane method of euthanasia such as carbon dioxide inhalation can be used.
Carefully open the abdominal cavity without damaging the intestines by making a midline incision.
Remove ±3 cm of the relevant part of the gastrointestinal tract of the abdominal cavity, place it in a Petri dish containing ice-cold DPBS solution, and flush with a gavage needle attached to a 5 mL syringe containing DPBS to remove the luminal content. Alternatively, fecal material can be removed by gently squeezing the intestines with a pair of tweezers.
Clean the gut tissue by removing any remaining mesenteric fat and then cut open the intestines along the mesenteric border.
Collect a representative tissue sample (0.5 cm × 0.5 cm; ± 20–30 mg), dry it on a paper towel, weigh it, place it in a cryovial, and subsequently freeze the specimen in liquid nitrogen. To remain unbiased, it is good practice to always collect samples in the same region of the gastrointestinal tract (i.e., always take the most distal or proximal part of the colon). Examples of tissue samples of correct size are shown in Figure 1.
After collection of all mouse samples, store them at -80 °C until further experiments are performed.
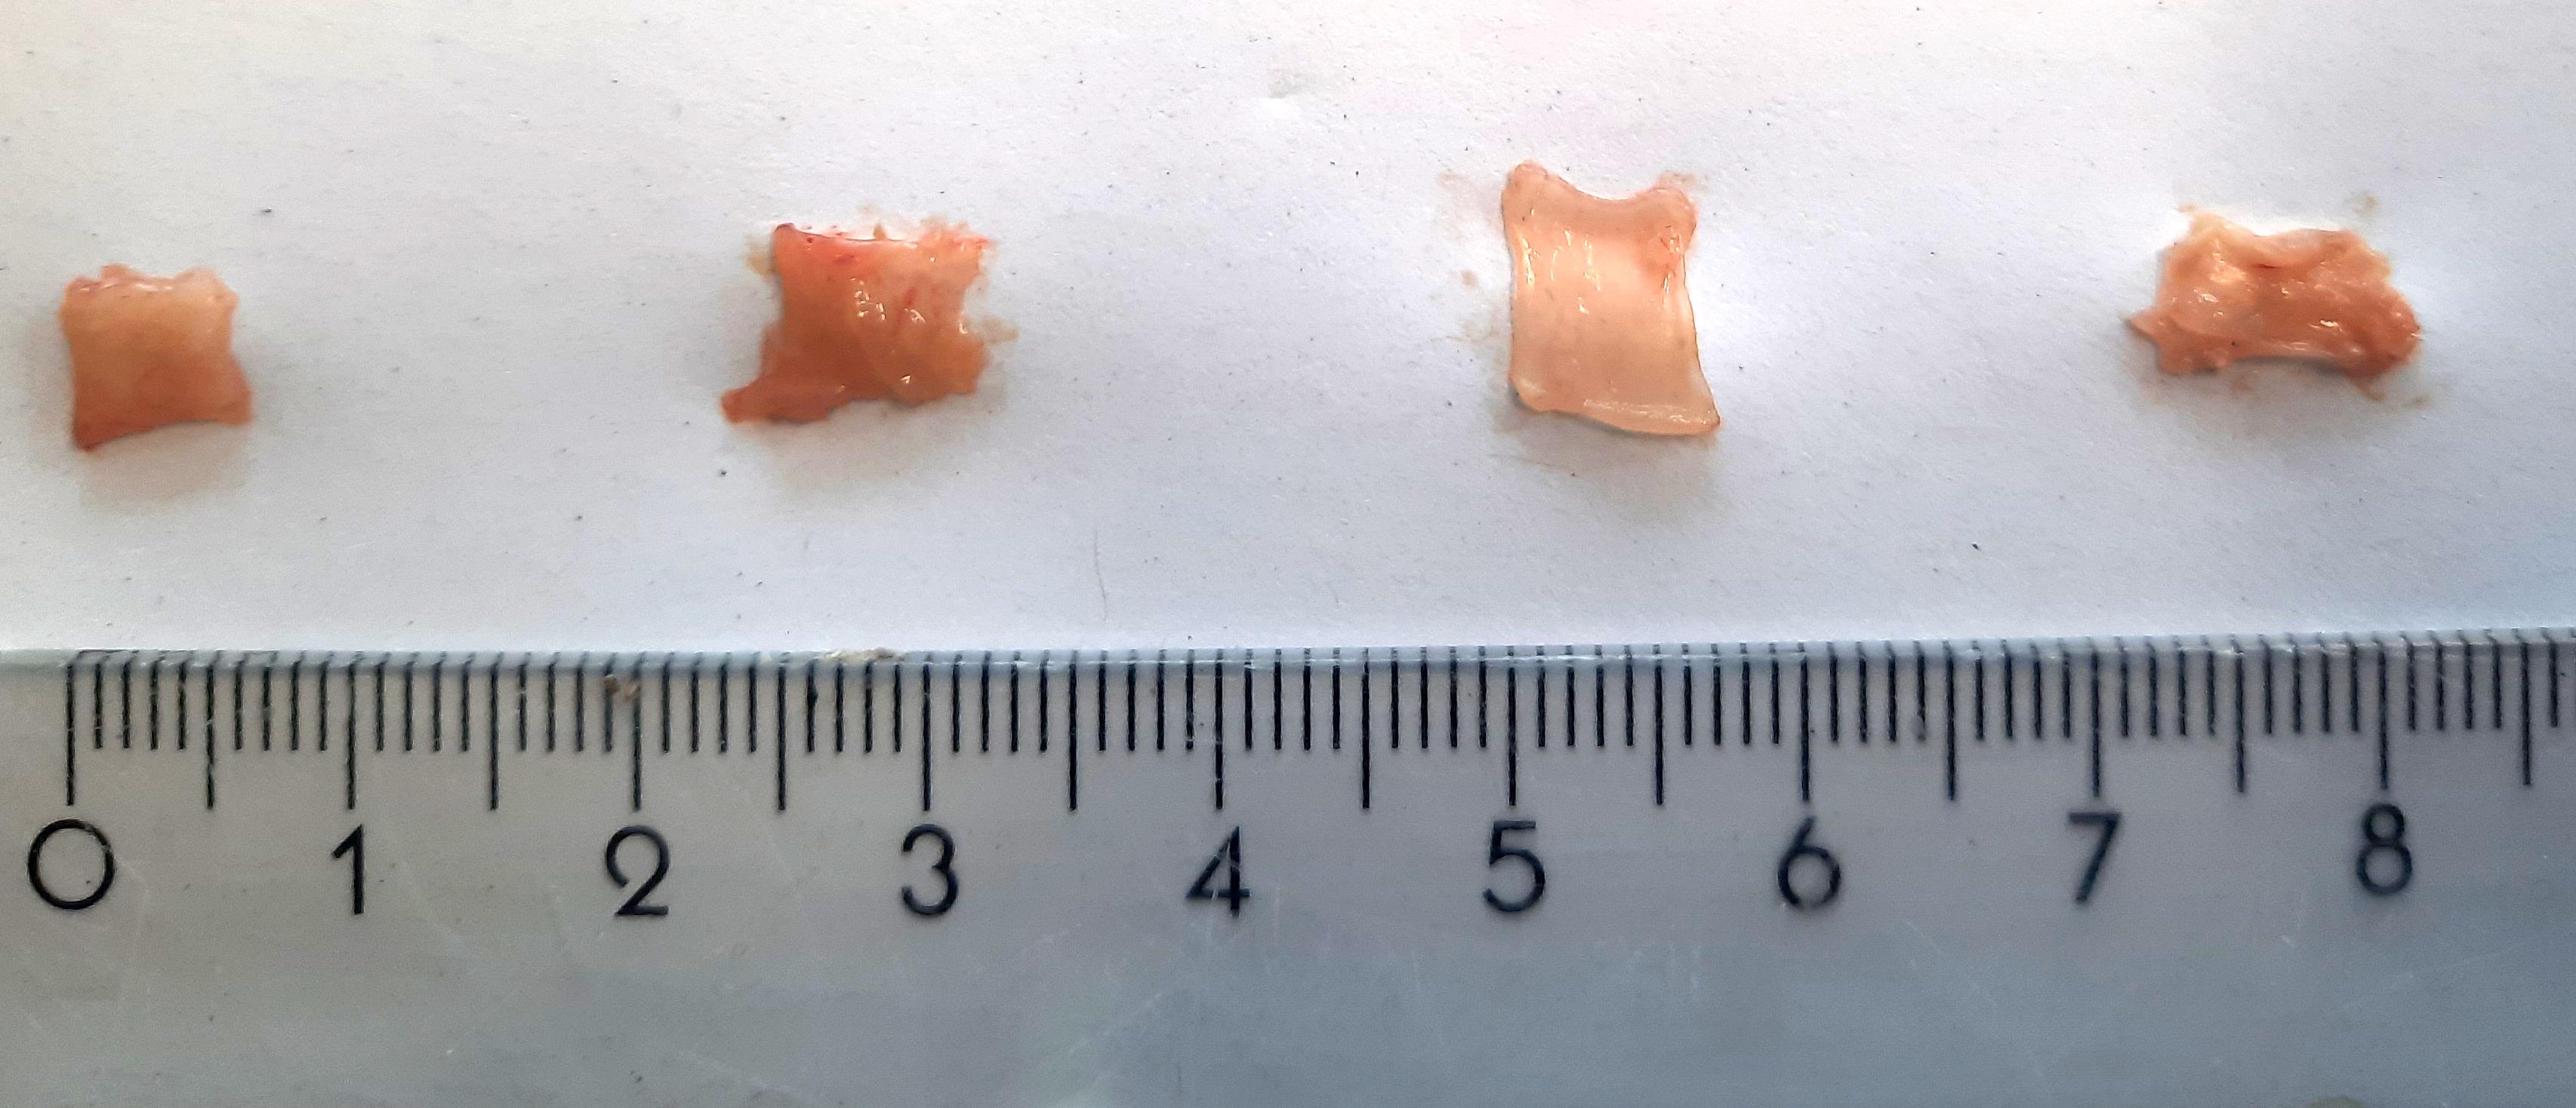
Figure 1. Gut tissue samples of an appropriate size for the myeloperoxidase (MPO) assay. The exact size depends on the animal species and inflammatory state of the tissue. From left to right, representative samples of distal colon (25 mg), proximal colon (27 mg), ileum (22 mg), and glandular stomach (22 mg) of a healthy C57BL/6J mouse are shown.
Tissue homogenization
Take the tissue samples from the freezer, transfer them to Precellys® tubes, and place these on ice. When labeling the Precellys® tubes, place the identifier on the side of the tube since the homogenization procedure can make identifiers written on the cap illegible.
Use a pipette to add 0.02 mL/mg tissue of homogenization buffer (Recipe 2) to the samples.
Place the tubes in the homogenizer and dissociate the tissue samples (6,000 rpm; 20 s shaking > 20 s break > 20 s shaking > 60 s break).
Place the tubes on ice and wait for 30 min to allow for the foam, which is formed during the homogenization, to disappear.
Centrifuge the samples (18,000× g for 15 min at 4 °C).
Use a pipette to collect the supernatant in 1.5 mL Eppendorf tubes and place these on ice. The pellet can be discarded.
Myeloperoxidase activity assay
Start the UV/Vis spectrometer and specify the necessary settings:
Measurements are kinetic.
Absorbance is measured at a wavelength of 460 nm (bandwidth 2.0 nm).
The change in absorbance is measured during the first 60 s after the start of the chemical reaction.
Open the lid of the spectrophotometer and place a 3 mL cuvette in the cuvette holder of the device. Pay attention to the correct orientation of the cuvette, i.e., with the clear windows in line with the light source and detector.
Use a pipette to add 2,900 μL of assay reagent (Recipe 3) to the cuvette.
Use a pipette to add 100 μL of sample supernatant to the cuvette, mix the sample by repetitive pipetting (5–10 times using a pipette set at 2 mL), close the lid of the spectrophotometer, and then promptly start the spectrophotometric measurement.
After the 60-second measurement, note the absolute absorption values at 0 and 60 s in Excel.
Replace the cuvette by a clean one and repeat the procedure for the other samples. Ideally, the assay is performed in duplo or in triplo.
Data analysis
Calculation of MPO activity in tissue samples
Calculate the change in absorbance (ΔAbs) by subtracting the measured absorbance at 0 s from the absorbance at 60 s.
Derive the MPO activity of the sample by implementing Beer’s law:
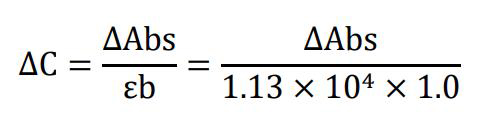
where ΔC is the change in concentration of the oxidized form of o-dianisidine in μM/min; ΔAbs is the change in absorbance of the sample after 60 s; ϵ is the extinction coefficient of oxidized o-dianisidine, which has been determined to be 1.13 × 10⁴ μM/cm for a wavelength of 460 nm at room temperature (Worthington and Worthington, 2011); and b is the optical path length, which is 1 cm for the cuvettes recommended in this protocol.
Express the MPO activity in units per gram of tissue. A unit of MPO is defined as the enzymatic activity that converts 1 μmol of hydrogen peroxidase to water in 1 min at room temperature and can be calculated using:
where Act is the enzymatic activity in unit per gram of tissue; ΔC is the change in concentration of the oxidized form of o-dianisidine in μM/min; Vreac is the volume of the supernatant that is used in the cuvette, which is 0.1 mL in the described protocol; and Csn is the concentration of the generated supernatant, which is 0.05 g of tissue per milliliter of homogenization buffer.
Note that for samples with very high activity levels, the supernatant could be further diluted to obtain accurate measures of enzyme activity.
Data example
To illustrate the assay, 12-week-old female C57BL/6J mice were exposed to 3% DSS for seven days via autoclaved drinking water to induce acute colitis (Kim et al., 2012; Breugelmans et al., 2020). Control mice received autoclaved drinking water without the addition of DSS. After a one-week treatment, DSS-treated mice showed signs of colitis, i.e., weight loss, diarrhea, and rectal bleeding. To confirm the inflammatory state of the animals, MPO activity was determined in tissue supernatant derived from the distal colon. To illustrate the importance of determining MPO activity instead of MPO content, a commercially available ELISA (Invitrogen, catalog number: EMMPO) was performed to quantify MPO protein expression levels on the same tissue supernatant, according to the instructions of the manufacturer.
MPO activity in the distal colon of DSS-treated mice was significantly higher than in control animals [DSS: 5.46 (4.05–8.14) U/g tissue vs. control: 0.30 (0.22–0.47) U/g tissue, p < 0.01 for n = 6 animals/group, Figure 2A]. Despite the increased peroxidase activity in the distal colon of DSS-exposed mice, the MPO protein expression did not differ between the groups [DSS: 42.67 (34.53–58.75) ng/g tissue vs. control: 45.05 (39.60–49.92) ng/g tissue, p = 0.78, Figure 2B]. Notably, MPO protein content and enzymatic activity were not correlated (rS = 0.30, p = 0.34, Figure 2C). Potentially, the capacity of gut tissue to inhibit peroxidase activity is lost upon the exposure to DSS (Ormrod et al., 1987).
Figure 2. MPO activity and protein expression levels in a mouse model for acute DSS-induced colitis. A) MPO activity, measured according to our protocol, is increased in DSS-exposed mice. B) MPO protein expression, measured using an ELISA kit, is not altered by exposure to DSS. C) MPO protein expression and enzymatic activity are not correlated. All quantifications were performed in duplo. Analysis by means of a Mann-Whitney U test (A, B) or Spearman’s rank correlation test (C) for n = 6 animals per group. DSS, dextran sulfate sodium; MPO, myeloperoxidase activity.
Validation of protocol
This MPO assay was previously used by our group to quantify inflammation in acute and chronic colitis models in both mice and rat (Moreels et al., 2004; Ruyssers et al., 2009; Vermeulen et al., 2011). We demonstrated that MPO activity correlated well with other markers for inflammation in TNBS-induced colitis in the rat (Vermeulen et al., 2011) and in the adoptive transfer colitis model in mice (Heylen et al., 2013).
General notes and troubleshooting
For the tissue homogenization to be successful, it is best to avoid the use of large tissue samples. We have observed that the best results are obtained when the gastrointestinal tract is cut open longitudinally. The Precellys® tubes allow for a maximum volume of ± 1.5 mL, corresponding to a maximum tissue weight of 75 mg.
Our protocol expresses the obtained MPO activity in units per gram of tissue. Alternatively, one can express the MPO activity in units per gram of tissue protein content. To this end, total protein content needs to be assessed on the tissue supernatant obtained in section B. Commercially available kits, such as the Pierce BCA protein assay (Thermo Fisher, catalog number: 23227) can be used for this measurement.
Sections B (tissue homogenization) and C (myeloperoxidase assay) can be performed on separate days. To do so, collect the tissue supernatant in cryovials and store these at -80 °C until the MPO activity is to be determined.
In our hands, intra-assay variability for an assay performed in duplo was 8.89% for DSS-exposed animals and 75.51% for controls. Note that the high coefficient of variability in control animals could be attributed to the very low read-out values in this group.
Acknowledgments
This work was supported by a BOF-TOP grant of the University of Antwerp (grant number 35018). The quantification of MPO activity in gastrointestinal tissue supernatant was adapted from the work of Krawisz and colleagues (Krawisz et al., 1984).
The authors would like to thank the lab technicians of the Laboratory of Experimental Medicine and Paediatrics for their help with experiments and for critically reviewing the protocol. The graphical abstract was constructed using BioRender.
Competing interests
The authors declare that there are no conflicts of interest.
Ethical considerations
Animal experiments were performed after obtaining approval of the Ethical Committee for Animal Testing of the University of Antwerp (ECD-file 2021-88).
References
- Breugelmans, T., Van Spaendonk, H., De Man, J. G., De Schepper, H. U., Jauregui-Amezaga, A., Macken, E., Lindén, S. K., Pintelon, I., Timmermans, J. P., De Winter, B. Y., et al. (2020). In-depth study of transmembrane mucins in association with intestinal barrier dysfunction during the course of T cell transfer and DSS-induced colitis. J Crohns Colitis 14(7): 974-994.
- Erben, U., Loddenkemper, C., Doerfel, K., Spieckermann, S., Haller, D., Heimesaat, M. M., Zeitz, M., Siegmund, B. and Kühl, A. A. (2014). A guide to histomorphological evaluation of intestinal inflammation in mouse models. Int J Clin Exp Pathol 7(8): 4557-4576.
- Heylen, M., Deleye, S., De Man, J. G., Ruyssers, N. E., Vermeulen, W., Stroobants, S., Pelckmans, P. A., Moreels, T. G. and De Winter, B. Y. (2013). Colonoscopy and μPET/CT are valid techniques to monitor inflammation in the adoptive transfer colitis model in mice. Inflamm Bowel Dis 19(5): 967-976.
- Khan, S. S., Smith, M. S., Reda, D., Suffredini, A. F. and McCoy, J. P. Jr. (2004). Multiplex bead array assays for detection of solubile cytokines: comparisons of sensitivity and quantitative values among kits from multiple manufacturers. Cytometry B Clin Cytom 61(1): 35-39.
- Kim, J. J., Shajib, S., Manocha, M. M. and Khan, W. I. (2012). Investigating intestinal inflammation in DSS-induced model of IBD. J Vis Exp (60): 3678.
- Kuebler, W. M., Abels, C., Schuerer, L. and Goetz, A. E. (1996). Measurement of neutrophil content in brain and lung tissue by a modified myeloperoxidase assay. Int J Microcirc Clin Exp 16(2): 89-97.
- Krawisz, J. E., Sharon P. and Stenson W. F. (1984). Quantitative assay for acute intestinal inflammation based on myeloperoxidase activity: Assessment of inflammation in rat and hamster models. Gastroenterology 87(6): 1344-1350.
- Mizoguchi, A. (2012). Animal models of inflammatory bowel disease. Prog Mol Biol Transl Sci 105(1): 263-320.
- Moreels, T. G., De Man, J. G., De Winter, B. Y., Herman, A. G. and Pelckmans, P. A. (2001). How to express pharmacological contractions of the inflamed rat intestine. Naunyn Schmiedebergs Arch Pharmacol 364(6): 524-533.
- Moreels, T. G., Nieuwendijk R. J., De Man J. G., De Winter B. Y., Herman A. G., Van Marck E. A. and Pelckmans P. A. (2004). Concurrent infection with Schistosoma mansoni attenuates inflammation induced changes in colonic morphology, cytokine levels, and smooth muscle contractility of trinitrobenzene sulphonic acid induced colitis in rats. Gut 53(1): 99-107.
- Ormrod, D. J., Harrison, G. L. and Miller, T. E. (1987). Inhibition of neutrophil myeloperoxidase activity by selected tissues. J Pharmacol Methods 18(2): 137-142.
- Ruyssers, N. E., De Winter, B. Y., De Man, J. G., Loukas, A., Pearson, M. S., Weinstock, J. V., Van den Bossche, R. M., Martinet, W., Pelckmans, P. A. and Moreels, T. G. (2009). Therapeutic potential of helminth soluble proteins in TNBS-induced colitis in mice. Inflamm Bowel Dis 15(4): 491-500.
- Solomon, L., Mansor, S., Mallon, P., Donnelly, E., Hoper, M., Loughrey, M., Kirk, S. and Gardiner, K. (2010). The dextran sulphate sodium (DSS) model of colitis: an overview. Comp Clin Pathol 19(1): 235-239.
- Schultz, J. and Kaminker, K. (1962). Myeloperoxidase of the leucocyte of normal human blood. I. Content and localization. Arch Biochem Biophys 96: 465-467.
- Vermeulen, W., De Man, J. G., Nullens, S., Pelckmans, P. A., De Winter, B. Y. and Moreels, T. G. (2011). The use of colonoscopy to follow inflammatory time course of TNBS colitis in rats. Acta Gastroenterol Belg 74(2): 304-311.
- Worthington, K. and Worthington, V. (2011). Worthington Enzyme Manual. Worthington Biochemical Corporation. 13feb2023. https://www.worthington-biochem.com/products/peroxidase/manual
- Xavier, R. J. and Podolsky, D. K. (2007). Unravelling the pathogenesis of inflammatory bowel disease. Nature 448(7152): 427-434.
- Xia, Y. and Zweier, J. L. (1997). Measurement of myeloperoxidase in leukocyte-containing tissues. Anal Biochem 245(1): 93-96.
- Yan, Y., Kolachala, V., Dalmasso, G., Nguyen, H., Laroui, H., Sitaraman, S. V. and Merlin, D. (2009). Temporal and spatial analysis of clinical and molecular parameters in dextran sodium sulfate induced colitis. PLoS One 4(6): e6073.
Article Information
Copyright
© 2023 The Author(s); This is an open access article under the CC BY-NC license (https://creativecommons.org/licenses/by-nc/4.0/).
How to cite
Hanning, N., De Man, J. G. and De Winter, B. Y. (2023). Measuring Myeloperoxidase Activity as a Marker of Inflammation in Gut Tissue Samples of Mice and Rat. Bio-protocol 13(13): e4758. DOI: 10.21769/BioProtoc.4758.
Category
Immunology > Immune cell function > Neutrophil
Biochemistry > Protein > Activity
Do you have any questions about this protocol?
Post your question to gather feedback from the community. We will also invite the authors of this article to respond.