- Protocols

- Articles and Issues
- For Authors
- About
- Become a Reviewer

Visualizing Loss of Plasma Membrane Lipid Asymmetry Using Annexin V Staining
(*contributed equally to this work) Published: Vol 13, Iss 14, Jul 20, 2023 DOI: 10.21769/BioProtoc.4754 Views: 2538
Reviewed by: Alexandros AlexandratosVishal NehruEVANGELOS THEODOROUTakashi Nishina
Original research article
The authors used this protocol in:
Mar 2022

Protocol Collections
Comprehensive collections of detailed, peer-reviewed protocols focusing on specific topics


Abstract
Loss of plasma membrane lipid asymmetry contributes to many cellular functions and responses, including apoptosis, blood coagulation, and cell fusion. In this protocol, we describe the use of fluorescently labeled annexin V to detect loss of lipid asymmetry in the plasma membrane of adherent living cells by fluorescence microscopy. The approach provides a simple, sensitive, and reproducible method to detect changes in lipid asymmetry but is limited by low sample throughput. The protocol can also be adapted to other fluorescently labeled lipid-binding proteins or peptide probes. To validate the lipid binding properties of such probes, we additionally describe here the preparation and use of giant unilamellar vesicles as simple model membrane systems that have a size comparable to cells.
Key features
• Monitoring loss of lipid asymmetry in the plasma membrane via confocal microscopy.
• Protocol can be applied to any type of cell that is adherent in culture, including primary cells.
• Assay can be adapted to other fluorescently labeled lipid-binding proteins or peptide probes.
• Giant unilamellar vesicles serve as a tool to validate the lipid binding properties of such probes.
Graphical overview

Imaging the binding of fluorescent annexin V to adherent mammalian cells and giant vesicles by confocal microscopy. Annexin V labeling is a useful method for detecting a loss of plasma membrane lipid asymmetry in cells (top image, red); DAPI can be used to identify nuclei (top image, blue). Giant vesicles are used as a tool to validate the lipid binding properties of annexin V to anionic lipids (lower image, red).
Keywords: Confocal microscopyBackground
A characteristic feature of many biological membranes is that their phospholipids are asymmetrically distributed across the lipid bilayer, a phenomenon known as transbilayer lipid asymmetry. A prominent example is the plasma membrane of animal cells, in which the phospholipids phosphatidylcholine and sphingomyelin are concentrated in the exoplasmic leaflet, whereas the aminophospholipids phosphatidylserine (PS) and phosphatidylethanolamine (PE) are restricted to the cytosolic leaflet (van Meer et al., 2008). Transbilayer lipid asymmetry is essential for several vital cellular functions, including the regulation of membrane protein activity, signaling, and vesicle formation in the secretory and endocytic pathways (Sprong et al., 2001; Ewers and Helenius, 2011; van Meer, 2011; Sebastian et al., 2012). In animals, loss of transbilayer lipid asymmetry has been linked to processes such as blood coagulation (Lentz, 2003; Jackson, 2011), cell adhesion (Schlegel et al., 1985; Malhotra et al., 1996; Wautier et al., 2011), macrophage recognition (Krahling et al., 1999), apoptosis (Bevers and Williamson, 2016), and myotube formation (van den Eijnde et al., 2001). The establishment and regulation of lipid asymmetry are therefore crucial for cells, and several membrane proteins have evolved to fulfill the function of cross-bilayer phospholipid transporters, comprising lipid flippases, floppases, and scramblases (Hankins et al., 2015; Ristovski et al., 2021).
Several methods have been developed to analyze the loss of phospholipid asymmetry in the plasma membrane of eukaryotic cells. These include chemical approaches using e.g., trinitrobenzene sulfonic acid or fluorescamine, which covalently react with amino groups of lipids and proteins (Marinetti et al., 1976; Pomorski et al., 2003). As the probes are membrane impermeant, only aminophospholipids exposed to the cell surface are modified and can then be detected by thin-layer chromatography or mass spectrometry. However, this approach is not suitable for live-cell imaging. More recent methods are based on fluorescently labeled lipid-binding proteins that can be added to the cells. One example is the PS-specific probe lactadherin, which binds to PS with a nanomolar affinity and without the need for cofactors (Waehrens et al., 2009). Another example is annexin V, a member of the annexin family of Ca2+-dependent, non-covalent lipid-binding proteins. Annexin V binds negatively charged lipids with relatively high affinity and is used extensively for the detection of exofacial PS by flow cytometry or microscopy (Koopman et al., 1994; Vermes et al., 1995; Tait et al., 2004). A new generation of fluorescent probes is based on cyclic peptides that successfully mimic the function of lipid-binding proteins and benefit from their small size, ease of labeling, and cofactor-free PS recognition (Hanshaw et al., 2005; DiVittorio et al., 2006; Zheng et al., 2011).
In this protocol, we describe the use of fluorescently labeled lipid-binding protein sensors to detect the loss of lipid asymmetry in living cells by fluorescence microscopy, exemplified on mouse C2C12 wild-type myoblasts and corresponding knockout cells lacking the P4-ATPase flippase subunit CDC50A (also known as TMEM30A). Deletion of CDC50A results in loss of the aminophospholipid flippase activity and constitutive loss of plasma membrane lipid asymmetry (Grifell-Junyent et al., 2022). The approach is illustrated using commercially available annexin V conjugated to Alexa Fluor 568, but other fluorescently labeled lipid-binding proteins or peptide probes can also be used.
To validate the specificity and sensitivity of such lipid binding probes, we also describe here the use of giant unilamellar vesicles (GUVs) as simple model membrane systems. One of the major advantages of using GUVs as model membrane systems is their similarity in size to cells. This allows GUVs to be observed directly under the microscope, making them a convenient and accessible tool for lipid-binding studies. By preparing GUVs with defined lipid compositions, the specificity and sensitivity of lipid-binding probes can be evaluated and their accuracy and reproducibility in live cell experiments can be ensured (Weingärtner et al., 2012; Chandra and Datta, 2022). GUVs with defined lipid compositions can be prepared by various methods, including swelling, PVA or agarose swelling, and electroformation using indium tin oxide glass slides and droplet transfer methods (Angelova and Dimitrov, 1986; Weinberger et al., 2013; Bhatia et al., 2015; Shimane and Kuruma, 2022). In this study, we describe the swelling method due to its simplicity. For alternative preparation methods, the reader is referred to other bio-protocols (Parigoris et al., 2020; Mathiassen and Pomorski, 2022). Our protocol provides a reliable and efficient method for detecting loss of lipid asymmetry in living cells and can be adapted for use with a variety of lipid-binding proteins.
Materials and reagents
Mammalian cell culture
In this study, we used mouse myoblast cells (C2C12; cell number: ACC 565, DSMZ Braunschweig, Germany) and the corresponding knockout cells lacking CDC50A (Grifell-Junyent et al., 2022) that were cultured in growth medium (see Recipe 1). Optimal culture media and conditions may differ for other cell lines.
Basal cell culture medium for growth (e.g., high glucose DMEM, without pyruvate; Sigma-Aldrich, catalog number: D5796), store at 4 °C
Ethanol absolute ≥ 99.8% (VWR, catalog number: 20821.321)
Ethylene glycol-bis(2-aminoethylether)-N,N,N′,N′-tetraacetic acid (EGTA) (e.g., Sigma-Aldrich, catalog number: E4378)
Fetal bovine serum (FBS), heat inactivated before use (e.g., Capricorn Scientific, catalog number: FBS-11A), store at -20 °C
Hanks’ balanced salt solution, Ca2+ and Mg2+ free (HBSS) (e.g., Sigma-Aldrich, catalog number: H6648), store at 4 °C
35 mm polymer bottom dishes (e.g., Ibidi, catalog number: 81156)
1.5 mL microcentrifuge tubes (Sarstedt, catalog number: 72.690.001)
Penicillin-streptomycin, 100× solution (e.g., Sigma-Aldrich, catalog number: P4333), store at -20 °C
Pipette controller (e.g., accu-jet pro, Brand, catalog number: 263 00)
Polypropylene tubes, 15 mL capacity (e.g., Falcon tubes, Sarstedt, catalog numbers: 62.554.502 and 62.547.254)
Sterile serological pipettes (e.g., Serological pipettes of 5, 10, and 25 mL; Sarstedt, catalog numbers: 86.1253.001, 86.1254.001, and 86.1685.001)
Sterile culture vessels T-75 flasks (e.g., Sarstedt, catalog number: 83.3911)
Trypsin-EDTA solution (e.g., Sigma-Aldrich, catalog number: T3924), store at -20 °C
Trypan Blue solution, 0.4% (e.g., Thermo Fischer Scientific, catalog number: 15250061)
Growth medium (see Recipe 1)
For annexin V labeling
Annexin V conjugated to Alexa Fluor 568 (e.g., Roche, catalog number: A13202), store at 4 °C
4’,6-Diamidino-2-phenyl-indol-dihydrochlorid (DAPI) (e.g., Sigma-Aldrich, catalog number: D9542)
Dead cell staining reagents, e.g., SYTOX Blue (Thermo Scientific, catalog number: S34857)
Ice
Tyrode’s balanced salt solution with Ca2+ (TBSS + Ca2+; see Recipe 2), store at 4 °C
Tyrode’s balanced salt solution without Ca2+ (TBSS - Ca2+; see Recipe 3), store at 4 °C
DAPI stock solution (1 mg/mL) (see Recipe 4)
Note: This procedure has also been successfully performed using FITC-labeled lactadherin (e.g., Haematologic Technologies, catalog number: BLAC-FITC).
For the preparation of giant unilamellar vesicles (GUVs)
1,2-dioleoyl-sn-glycero-3-phosphocholine (DOPC) (Avanti® Polar Lipids, catalog number: 850375)
1,2-dioleoyl-sn-glycero-3-phosphoethanolamine (DOPE) (Avanti® Polar Lipids, catalog number: 850725)
1,2-dioleoyl-sn-glycero-3-phospho-L-serine (sodium salt) (DOPS) (Avanti® Polar Lipids, catalog number: 840035)
Calcium chloride (CaCl2) (Grüssing, catalog number: 10043-52-4)
Chloroform, ethanol-stabilized and certified for absence of HCl (Sigma-Aldrich, catalog number: 32211-M)
Detergent/soap
Ethanol, 70% (Sigma-Aldrich, catalog number: 64-17-5)
Glucose (Duchefa Biochemie, catalog number: G0802.5000)
HEPES (Carl Roth, catalog number: 7365-45-9)
Ice
Magnesium chloride hexahydrate (MgCl2·6H2O) (Sigma-Aldrich, catalog number: 7791-18-6)
Methanol ≥ 99.8% (VWR, catalog number: 67-56-1)
Potassium hydroxide (KOH) (Sigma-Aldrich, catalog number: 1310-58-3)
Potassium chloride (KCl) (Merck, catalog number: 7447-40-7)
Sodium chloride (NaCl) (Carl Roth, catalog number: 7647-14-5)
Sucrose (Duchefa Biochemie, catalog number: S0809.5000)
Lipid stock in chloroform (see Recipe 5)
Swelling buffer (320 mM sucrose) (see Recipe 6)
Binding buffer (see Recipe 7)
Note: Store or keep all reagents at room temperature, except indicated items. All buffers are prepared the day before and stored at 4 °C.
Equipment
General
Analytical balance (e.g., Sartorius Entris-I II, 220 g/0.1 mg; Buch Holm, catalog number: 4669128)
Computer with monitor (e.g., DELL U2415)
Confocal laser scanning microscope (e.g., Leica TCS SP8 confocal laser scanning microscope, Leitz, Wetzlar, Germany, equipped with a 63×/1.20 water objective)
Eppendorf Research® plus pipettes P20, P200, P1000 (Eppendorf, catalog numbers: 3123000039, 3123000055, 3123000063)
Eppendorf tube, 2 mL (Merck, catalog number: EP0030120094)
Freezers -20 °C and -80 °C
Magnetic stirrer (e.g., IKAMAG®, DREHZAHL ELECTRONIC, IKA, Staufen im Breisgau, Germany)
Magnets
pH meter (pH-Meter 761 Calimatic, Knick, Berlin, Germany)
Pipette tips 10, 200, 1,000 μL (Sarstedt, catalog numbers: 70.760.002, 70.3030.020, 70.3050.020)
Refrigerator (5 °C)
Water distillation system
For cell culture
Autoclave sterilizer (e.g., Systec VX-65, Systec, Linden, Germany)
Biological safety cabinet certified for handling biological materials (e.g., Herasafe KSP Class II Biological Safety Cabinets, Thermo Fisher Scientific)
Centrifuge with rotor for 15 and 50 mL polypropylene tubes (e.g., Eppendorf 5810 R; Wesseling, Germany)
Incubator with humidity and gas control to maintain 37 °C and 95% humidity in an atmosphere of 5% CO2 in air (e.g., Binder, Tuttlingen, Germany)
Inverted phase contrast microscope equipped with a 10× objective (HI PLAN I 10×/0.22 PH1; Leica DMi1, Mannheim, Germany)
Neubauer counting chamber (improved dark lines, 0.1 mm) and cover glasses (20 mm × 26 mm × 0.4 mm)
Water bath (e.g., WPE45 Memmert, Schwabach, Germany) for mammalian cells and for NBD-lipid labeling (Julabo CORIO C-BT5, catalog number: 9011305)
For preparation of GUVs
Cover glass slides (26 mm × 76 mm, #1.5, Thermo Fisher Scientific, Life Technologies Corporation Eugene)
Flow cabinet to work with organic solvents
Glass beads, 3 mm (Merck, catalog number: 104015)
Glass desiccator Boro 3.3 with a socket in the lid, 20 cm, including stopcock (Brand, catalog number: 65238)
Glass pipettes (e.g., graduated pipettes BLAUBRAND® Type 3 Class AS, 10 mL, graduation: 10 mL; Carl Roth, catalog number: HXT8.1)
Glass slide (Thermo Scientific, microscope slides 76 mm × 26 mm, catalog number: MEZ 101026)
Glass vials (Rotilabo® screw neck ND8 vials, brown/white glass, 1.5 mL; Carl Roth, catalog number: KE30.1) with screw caps (without a borehole, without septum, PP, black, ND8; Carl Roth, catalog number: KE39.1)
Glass tubes (Carl Roth, catalog number: DURAN C208.1)
Hamilton 700 Series syringes 25, 100, 1,000 μL (Hamilton Company, Nevada, USA)
High vacuum grease (DOW CORNING, 65201 Wiesbaden, made in USA, Artwork Nr. 0315)
Ice bucket (e.g., Magic Touch 2TM ice bucket with lid; Sigma-Aldrich, catalog number: BAM168072002)
O-ring (28 mm × 1 mm, Nanion Technologies, München)
Parafilm (PARAFILM® M; Sigma-Aldrich, catalog number: P7793-1EA)
Rotavapor® R-100 Evaporator with I-100 Controller and V-100 vacuum pump (Flawil, Switzerland)
Scissors
Ultra-violet/ozone probe and surface decontamination unit (e.g., Novascan Technologies Inc., Boone, IA, USA)
Vortex mixer (e.g., Vortex Genie 2 Scientific Industries Inc., catalog number: SI-0236)
Vacuum Pump V-100 with Interface I-100 (Buchi, catalog numbers: 11593636 and 11593655D)
Wipes (Precision Wipes, KIMTECH Science, Kimberly-Clark® Professional, catalog number: 7552)
Software
ImageJ (Wayne, Rasband, S., U. S. National Institutes of Health, Bethesda, Maryland, USA, https://imagej.nih.gov/ij/index.html , version v.153q)
Leica Application Suite AF (LAS AF, Leitz, Wetzlar, Germany)
Microsoft Excel (Microsoft Corporation, 2018)
PowerPoint (Microsoft Corporation, 2018)
OriginPro (OriginLab, 2023)
Procedure
The following procedure outlines four main steps: (A) preparation of mammalian cells, (B) cell counting, (C) annexin V staining of adherent cells, and (D) preparation of GUVs. The last step was originally applied to study the binding specificity of annexin V to different membrane lipid compositions (Weingärtner et al., 2012; Grifell-Junyent et al., 2022). We recommend this analysis before applying new probes in cell studies.
Preparation of mammalian cells
Grow adherent cells in sterile culture vessels (T-75 flask) in growth medium (see Recipe 1) in a tissue culture incubator (37 °C, 5% CO2, 95% humidity) until they reach ~60%–70% confluency.
Caution: C2C12 cells will differentiate if grown too confluent and start to fuse. Differentiation and fusion are accompanied by transcriptional changes, which can lead to different results.
Aspirate and discard growth media with sterile serological pipette.
Wash cells twice with 5 mL of HBSS (Ca2+ and Mg2+ free, pre-warmed at 37 °C) using a sterile serological pipette.
Add 1.5 mL of trypsin-EDTA solution (pre-warmed at 37 °C) using a sterile serological pipette and incubate the T-75 flasks in a tissue culture incubator (37 °C, 5% CO2, 95% humidity). Tilt the vessel back and forth a few times to make sure the thin layer of trypsin is evenly spread.
After 5 min, check for detachment by gently tilting vessel and/or observing under the microscope. If all cells have not detached in 5 min, incubate an additional 1–2 min and check again. Continue to incubate and check as necessary, only until cells are no longer attached to the plate surface.
Caution: Avoid prolonged incubation period with trypsin-EDTA solution.
Stop trypsinization by adding 7.5 mL of growth medium (pre-warmed at 37 °C, see Recipe 1) to the cell suspension.
Transfer the cell suspension into a 15 mL Falcon tube and set aside 100 μL in a 1.5 mL microcentrifuge tube for cell counting, e.g., using the hemocytometer (see section B).
Centrifuge cells in the 15 mL Falcon tube at 300× g for 5 min at room temperature and discard the supernatant to remove the trypsin-EDTA containing medium from the cells.
Add 10 mL of fresh growth medium (pre-warmed at 37 °C, see Recipe 1) to the cell pellet and re-suspend completely by gently pipetting up and down using a serological pipette.
Caution: Cells in suspension settle quickly. After counting, we recommend gently re-suspending the cell suspension approximately every 2–3 min when seeding multiple dishes.
After counting (see section B), seed 1.5 × 10⁴ cells per 35 mm polymer bottom dishes and add growth medium (pre-warmed at 37 °C, see Recipe 1) up to a final volume of 1 mL per dish.
Note: Prepare sufficient Petri dishes for control samples (see section C). We used a low cell number for seeding because C2C12 is a fast-growing cell line (doubling time: ~20 h) and this cell number guarantees that single cells are still present when the assay is performed the next day.
Keep the cells in a tissue culture incubator (37 °C, 5% CO2, 95% humidity) overnight.
Cell counting (supplemental; if information on cell counting is not required, proceed to section C)
The purpose of this step is to quantify the cell concentration to resuspend the cells at the appropriate concentration for the assay. We routinely use the trypan blue hemocytometer assay. Alternative cell counting methods such as automatic cell counters may be used.
Prepare the hemocytometer by cleaning the chambers and coverslip with ethanol. Dry the hemocytometer by using lint-free tissue. Place the glass coverslip over the counting chambers.
Note: The correct placement is indicated by the appearance of the Newton rings.
Add 100 μL of 0.4% trypan blue solution to 100 μL of cell suspension (step A7) to obtain a 1:1 dilution using a P200 Eppendorf pipette.
Load the hemocytometer with 10 μL of cell suspension per counting chamber with a P20 Eppendorf pipette and examine immediately under an inverted phase contrast microscope at low magnification (e.g., 5–10× magnification).
Critical: To ensure accurate results, it is important to avoid over- or underfilling the cell suspension chamber.
Count the number of viable (seen as bright cells) and non-viable cells (stained blue) in the large outer quadrants.
Calculate the percentage of viable cells: % viable cells = [1.00 - (number of blue cells ÷ number of total cells)] × 100. Cell viability should be at least 95%.
Calculate the cell concentration based on the premise that each square accounts for a volume of 10-4 mL of cell suspension.
To obtain the total number of viable cells per milliliter of aliquot, multiply the total number of viable cells by 2 (the dilution factor for trypan blue) and the correction factor of 104 (volume of each square).
Annexin V staining of adherent cells
We suggest that at least four samples are prepared (Figure 1): i) a negative control without staining to determine background fluorescence, ii) a sample stained with DAPI only, iii) a sample to be stained with DAPI and annexin V in the presence of calcium, and iv) a sample to be stained with DAPI and annexin V in the absence of calcium.

Figure 1. Schematic illustration of the annexin V binding assay. Preparation of a negative control without DAPI and annexin V staining, a control with DAPI-stained cells, and cells stained with DAPI and annexin V conjugated to Alexa Fluor 568 for 10 min on ice with TBSS with or without calcium, respectively. The negative control without staining is used to assess the level of background fluorescence in the sample. This is important because even in the absence of a fluorescent stain, there may still be some level of background fluorescence present due to autofluorescence or other sources. DAPI staining (at a final concentration of 10 μg/mL) is used for visualization of nuclei and cell counting. Non-specific binding of Ca2+-dependent annexin V is tested in the same assay by using TBSS without Ca2+.Prior to the start of the assay, prepare TBSS with and without calcium (± Ca2+; see Recipes 2 and 3) and a DAPI stock solution (see Recipe 4).
Note: Annexin V requires the presence of Ca2+ to bind to PS. TBSS without Ca2+ is used as a negative control.
To prepare the cells for labeling, carefully aspirate and discard the growth medium using a P1000 Eppendorf pipette.
Wash cells twice with 1 mL of TBSS (± Ca2+; cooled on ice, see Recipes 2 and 3) using a P1000 Eppendorf pipette.
After washing, add 0.5 mL of TBSS (± Ca2+; cooled on ice, see Recipes 2 and 3) using a P1000 Eppendorf pipette.
Add 5 μL of the annexin V conjugated to Alexa Fluor 568 using a P20 Eppendorf pipette and incubate for 10 min on ice in the dark.
Note: Skip steps C5–C8 for the negative control (i); skip steps C5–C7 for the sample only stained with DAPI (ii).
Remove staining solution and wash the cells twice with 1 mL of TBSS (± Ca2+; cooled on ice, see Recipes 2 and 3) using a P1000 Eppendorf pipette.
After washing, add 0.5 mL of TBSS (± Ca2+; cooled on ice, see Recipes 2 and 3) using a P1000 Eppendorf pipette.
Add DAPI stock solution to a final concentration of 10 μg/mL (stock 1 mg/mL: add 5 μL using a P20 Eppendorf pipette). Incubate the cells at room temperature for 10 min in the dark.
Note: At the concentration used here, DAPI stains the nucleus of both live and dead cells and is used for the visualization of nuclei and cell counting. When using DAPI for dead cell staining, a final concentration of 0.1 μg/mL is recommended. Alternatively, other dead cell staining reagents such as SYTOX Blue can also be used.
Remove staining solution and wash cells twice with 1 mL of TBSS (± Ca2+; cooled on ice, see Recipes 2 and 3) using a P1000 Eppendorf pipette.
Add 1 mL of TBSS (± Ca2+; cooled on ice, see Recipes 2 and 3) using a P1000 Eppendorf pipette and image on the microscope.
Preparation of GUVs
Prepare the stock and working solutions of the lipids
Clean the Hamilton syringes by flushing them ten times with chloroform:methanol (1:1, v:v).
Caution: Chloroform is a hazardous solvent. Conduct all work in a fume hood, while wearing proper protective clothing.
To have a 5 mg/mL lipid film, transfer 500 μL of a 10 mg/mL DOPC stock solution (see Recipe 5) into a round bottom glass tube on ice using Hamilton syringes. For 5 mg/mL DOPC:DOPE or DOPE:DOPS lipid mix, add 9 mol DOPC and 1 mol DOPE or DOPS (lipid stocks, see Recipe 5). In this study, the lipid mixtures DOPC:DOPE and DOPC:DOPS will be named only DOPE and DOPS, respectively.
Caution: Avoid any use of plastic ware when handling organic solvents. For more complex or different lipid mixtures, the volume of used lipids needs to be adjusted.
Evaporate the organic solvent at room temperature under reduced pressure in a rotary evaporator at 250 mbar for 2–4 h followed by evaporation at ~10 mbar for 15 min (see Figure 2A and 2B).
Store the lipid film at -20 °C until use.
Dissolve the lipid film in 1 mL of chloroform:methanol (1:1; v:v).
Transfer into a glass vial with screw caps closed with parafilm and store it at -20 °C.
Cleaning of the glass slides
Clean the glass slides with detergent, deionized water, and 70% ethanol.
Dry the slides with wipes.
Place glass slides in the UV/ozone cleaner.
Run the UV/ozone cleaner for 30 min.
Caution: The UV/ozone cleaner must be placed under a fume hood.
Turn off the UV/ozone cleaner and wait at least 15 min before opening the chamber.
Preparation of GUVs
Glue the O-ring using vacuum grease onto the cleaned side of one of the glass slides to have a tight, closed chamber. Apply 35–40 drops of 1 μL of lipid mix inside the O-ring under the fume hood (see Figure 2C).
Evaporate the solvent under vacuum for 30–60 min at 250 mbar in a desiccator.
Fill the O-ring with swelling buffer (see Recipe 6) and place the other glass slide on top with the cleaned side facing downwards.
Place the chamber in a dark room for 2–4 h at room temperature (see Figure 2D).
Carefully tap on each side of the chamber.
Transfer the GUVs to a 2 mL tube by removing the glass slide and O-ring.
Store the GUVs covered in aluminum foil at room temperature.
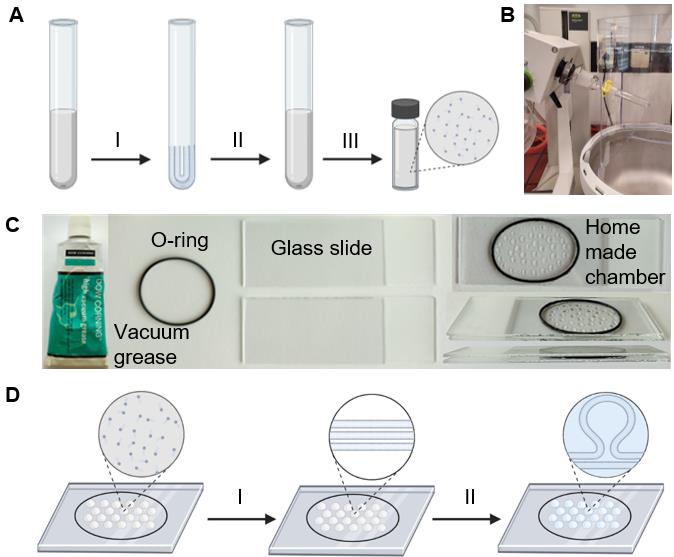
Figure 2. Generation of giant unilamellar vesicles (GUVs) from lipid mixtures. (A, B) Preparation of the lipid mixture. The desired volume and type of lipid is mixed in chloroform:methanol (1:1; v:v) in a glass tube and (I) the solvent is evaporated in rotary evaporator under the reduced pressure of 250 mbar for 2–4 h; (II) the resulting thin lipid film on the glass tube is dissolved in chloroform:methanol (1:1; v:v) and (III) stored in a glass vial with screw caps sealed with parafilm. (B) The glass tube containing the lipids in chloroform is connected to the rotary evaporator. (C) Equipment for a GUV formation of the home-made chamber. (D) Schematic workflow of GUV formation by the swelling method. The lipid mixture is applied to the cleaned glass slides and (I) dehydrated in a desiccator at 250 mbar for 30–60 min. The dried lipid film is then (II) rehydrated in a swelling buffer for 2–4 h, resulting in the formation of giant vesicles.Annexin V staining of GUVs
Place 25 μL of GUVs (with a cut tip) in 25 μL of binding buffer (see Recipe 7) on a cover glass slide.
Note: As additional control, a GUV sample in buffer without Ca2+ can be prepared.
Place the cover glass slide under the microscope.
Let the GUVs settle for approximately 5 min before imaging in a white light channel and an annexin V channel.
Data analysis
Data acquisition
Images are acquired at a Leica TCS SP8 confocal laser scanning microscope (Leitz, Wetzlar, Germany) equipped with a 63×/1.20 water objective. For detailed imaging settings, see Table 1. All images are acquired at the same resolution, magnification, and orientation. This allows direct comparison of images and saves time when arranging figures.
Table 1. Confocal microscope settings
| Channel | Laser | Detector | Scan speed | Excitation, nm | Intensity, % | Emission, nm | Gain |
|---|---|---|---|---|---|---|---|
| Annexin V | White light laser, intensity at 85% | Hybrid Detector (HyD) | 400 Hz | 577 | 5 | 587–757 | 100 |
Bright light | White light laser, intensity at 85% | Photomultiplier tube (PMT) | 400 Hz | trans channel | - | - | 300 |
For analysis of the adherent cells
Export the raw image data in a format compatible with ImageJ (e.g., .tif) from the imaging system.
Open the ImageJ software and import the images of the blue fluorescence (DAPI) and the red fluorescence (Annexin V conjugated to Alexa Fluor 568).
Click on Image in the upper operation row of the interface and select in the color menu Merge Channels.
For C1 (red), the image showing the red fluorescence needs to be selected; for C3 (blue), the DAPI picture needs to be chosen. Press Ok to merge the two images.
Click on Image in the upper operation row of the interface and change the image type to RGB Color.
Save the images as a .tif or .jpg file by selecting the File menu in the upper operation row of the interface and press Save As. Representative images are shown in Figure 3.

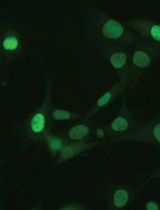
Figure 3. Representative confocal images of proliferating C2C12 wild-type and CDC50A knockout cells. Cells are stained with Alexa Fluor 568 conjugated annexin V (red) for 10 min in ice-cold TBSS with and without calcium. DAPI staining is used for visualization of nuclei. In contrast to C2C12 wild-type cells, CDC50A-deficient cells stained positive for annexin V, indicating increased surface exposure of aminophospholipids. Images are representative of three independent experiments. Scale bar: 30 μm.
For analysis of GUVs
ImageJ is used to analyze the membrane fluorescence intensity of individual GUVs before and after annexin V treatment. Only unilamellar giant vesicles are used for analysis.
Open the images with ImageJ by importing the LIF-file.
Split the channels to have bright light and annexin channel separately and save as Tiff.
Tiff images can be assembled (see Figure 4).
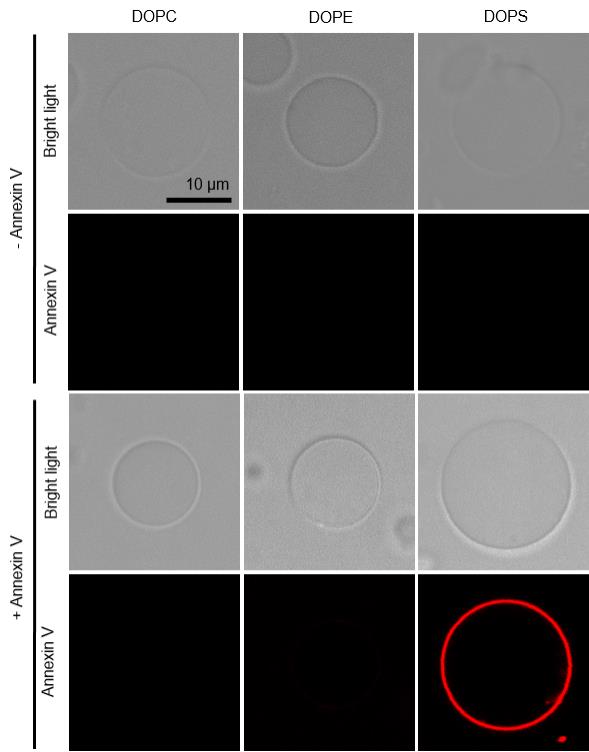
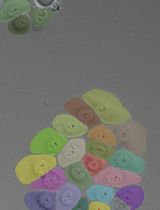
Figure 4. Imaging the binding of fluorescent annexin V on giant unilamellar vesicles (GUVs). Giant unilamellar vesicles are prepared from different lipids and incubated without (-) and with (+) annexin V in the presence of Ca2+. Vesicles are observed in bright light and annexin channel. DOPC, PC (18:1/18:1) only; DOPE, PC (18:1/18:1)/PE (18:1/18:1), (9/1, mol/mol); DOPS, PC (18:1/18:1)/PS (18:1/18:1), (9/1, mol/mol). Data shown are from one experiment representative of two independent vesicle preparations. Scale bar: 10 μm.
Extract signal intensities with ImageJ software
Continue with the annexin channel.
A region of interest (ROI) is placed around the GUV (ROIouter) of interest to measure the annexin V fluorescence intensity of the membrane, by measuring the integrated density value per pixel.
The second ROI is placed within the GUV lumen (ROIinner) (see Figure 5A).
The inner ROI is subtracted from the outer ROI to have the membrane density value per pixel of the annexin V fluorescent intensity (ΔI):
ΔI = I(ROIouter) - I(ROIinner)
Repeat the procedure for each GUV and save the data as an Excel (.xls) file.
The annexin V fluorescence intensities are plotted in form of a bar diagram using the OriginPro (see Figure 5B and Table 2).
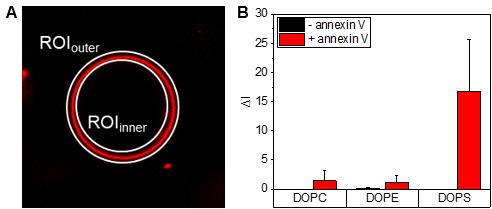
Figure 5. Fluorescence intensity analysis on giant unilamellar vesicles (GUVs). (A) A first region of interest (ROI) is placed around the GUV (ROIouter), and a second ROI is placed within the GUV lumen (ROIinner) of interest to measure the annexin V fluorescence intensity of the membrane, by measuring the integrated density value per pixel using the software ImageJ. (B) The mean annexin V fluorescence intensities for GUVs with the indicated lipid compositions are presented as averages, based on individual measurements of n ≤ 10 GUVs. Error bars indicate standard deviations. Data are from one experiment representative of two independent vesicle preparations.Table 2. The mean annexin V fluorescence intensities (ΔI) for giant unilamellar vesicles (GUVs) with the indicated lipid compositions. Data are from one experiment representative of two independent vesicle preparations. Data are plotted in Figure 5.
Lipids of GUVs -Annexin V +Annexin V ΔI, average (n = 10) s.d. ΔI, average (n = 13–15) s.d. DOPC 0.001 0.001 1.430 1.814 DOPE 0.086 0.114 1.107 1.229 DOPS 0.001 0.002 16.732 8.934
Recipes
Buffers were prepared using double-distilled water (ddH2O), which was obtained using an in-house water distillation system. Alternatively, all buffers are prepared using ultrapure water with purification sensitivity of 18 MΩ·cm-1 at 25 °C.
Growth medium
Open a 500 mL flask of high-glucose DMEM medium
Add 100 mL of FBS (heat-inactivated)
Optional: add 5 mL of 100× penicillin-streptomycin solution
Prepare in sterile cabinet; store at 4 °C
TBSS buffer + Ca2+ (0.5 L)
136 mM NaCl (3.97 g)
2.6 mM KCl (96.9 mg)
1.8 mM CaCl2 (132.3 mg)
1 mM MgCl2·6H2O (101.6 mg)
0.36 mM NaH2PO4·2H2O (24.8 mg)
5.56 mM D-glucose (500.8 g)
5 mM HEPES (600 mg)
Adjust pH to 7.4 with 1 M NaOH. Complete volume to 0.5 L. Sterilize by filtering using a 0.22 μm filter. Store at 4 °C up to several months.
TBSS buffer - Ca2+ (0.5 L)
136 mM NaCl (3.97 g)
2.6 mM KCl (96.9 mg)
1 mM MgCl2·6H2O (101.6 mg)
0.36 mM NaH2PO4·2H2O (24.8 mg)
5.56 mM D-glucose (500.8 g)
5 mM HEPES (600 mg)
100 μM EGTA (19 mg)
Adjust pH to 7.4 with 1 M NaOH. Complete volume to 0.5 L. Sterilize by filtering using a 0.22 μm filter. Store at 4 °C up to several months.
DAPI stock solution (1 mg/mL)
Dissolve DAPI in ultrapure water to 1 mg/mL. Stock solution is stable for several months and repeated use, if stored protected from light at -20 °C.
Lipid stocks in chloroform
Lipids are ordered in chloroform at a concentration of 25 mg/mL and stored at -20 °C until further use. For longer storage, aliquot 10 mg of lipids in glass vials with screw caps, evaporate the chloroform, and store the dried lipid at -20 °C. Before using it, dissolve the 10 mg of lipid in 1 mL of chloroform:methanol (1:1; v:v).
Critical: Some lipids may have limited or very poor solubility in chloroform:methanol (1:1; v:v) and require a mixture of chloroform:methanol:water.
Swelling buffer (320 mM)
Dissolve 5.48 g of sucrose to a final volume of 50 mL in deionized water. The buffer is filter-sterilized over a 0.2 μm Acrodisc® syringe filter and stored at 5 °C.
Binding buffer (100 mL)
10 mM HEPES-KOH pH 7.4 (238.31 mg)
150 mM NaCl (876.6 mg)
5 mM KCl (37.275 mg)
1 mM MgCl2·6H2O (20.33 mg)
1 mM CaCl2 (11.098 mg)
Adjust pH to 7.4 with 1 M NaOH. Complete volume to 100 mL. Store at 4 °C up to several months.
Acknowledgments
We gratefully acknowledge Michelle Werner for technical assistance. This protocol was adapted from our previous work (Weingärtner et al., 2012; Grifell-Junyent et al., 2022; Herrera et al., 2022). The work was supported by the Lundbeckfonden (R221-2016-1005 to T.G.P.) and an instrument grant from the Deutsche Forschungsgemeinschaft (INST 213/886-1 FUGG to T.G.P.). HDU is a scholar of the Friedrich Ebert Foundation.
Competing interests
The authors declare that no competing interests exist.
References
- Angelova, M. I. and Dimitrov, D. S. (1986). Liposome electroformation. Faraday Discuss. Chem. Soc 81: 303.
- Bhatia, T., Husen, P., Brewer, J., Bagatolli, L. A., Hansen, P. L., Ipsen, J. H. and Mouritsen, O. G. (2015). Preparing giant unilamellar vesicles (GUVs) of complex lipid mixtures on demand: Mixing small unilamellar vesicles of compositionally heterogeneous mixtures. Biochim Biophys Acta Biomembr 1848(12): 3175-3180.
- Bevers, E. M. and Williamson, P. L. (2016). Getting to the Outer Leaflet: Physiology of Phosphatidylserine Exposure at the Plasma Membrane. Physiol. Rev. 96(2): 605-645.
- Chandra, A. and Datta, A. (2022). A Peptide-Based Fluorescent Sensor for Anionic Phospholipids. ACS Omega 7(12): 10347-10354.
- DiVittorio, K. M., Johnson, J. R., Johansson, E., Reynolds, A. J., Jolliffe, K. A. and Smith, B. D. (2006). Synthetic peptides with selective affinity for apoptotic cells. Org. Biomol. Chem. 4(10): 1966.
- Ewers, H. and Helenius, A. (2011). Lipid-Mediated Endocytosis. Cold Spring Harbor Perspect. Biol. 3(8): a004721-a004721.
- Grifell-Junyent, M., Baum, J. F., Välimets, S., Herrmann, A., Paulusma, C. C., López-Marqués, R. L. and Günther Pomorski, T. (2022). CDC50A is required for aminophospholipid transport and cell fusion in mouse C2C12 myoblasts. J. Cell Sci 135(5): e258649.
- Hankins, H. M., Baldridge, R. D., Xu, P. and Graham, T. R. (2015). Role of Flippases, Scramblases and Transfer Proteins in Phosphatidylserine Subcellular Distribution. Traffic 16(1): 35-47.
- Hanshaw, R. G., Lakshmi, C., Lambert, T. N., Johnson, J. R. and Smith, B. D. (2005). Fluorescent Detection of Apoptotic Cells by Using Zinc Coordination Complexes with a Selective Affinity for Membrane Surfaces Enriched with Phosphatidylserine. ChemBioChem 6(12): 2214-2220.
- Herrera, S., Grifell-Junyent, M. and Pomorski, T. (2022). NBD-lipid Uptake Assay for Mammalian Cell Lines. Bio Protoc 12(4): e4330.
- Jackson, S. P. (2011). Arterial thrombosis—insidious, unpredictable and deadly. Nat. Med 17(11): 1423-1436.
- Koopman, G., Reutelingsperger, C. P., Kuijten, G. A., Keehnen, R. M., Pals, S. T. and van Oers, M. H. (1994). Annexin V for flow cytometric detection of phosphatidylserine expression on B cells undergoing apoptosis. Blood 84(5): 1415-1420.
- Krahling, S., Callahan, M. K., Williamson, P. and Schlegel, R. A. (1999). Exposure of phosphatidylserine is a general feature in the phagocytosis of apoptotic lymphocytes by macrophages. Cell Death Differ. 6(2): 183-189.
- Lentz, B. R. (2003). Exposure of platelet membrane phosphatidylserine regulates blood coagulation. Prog Lipid Res 42(5): 423-438.
- Malhotra, R., Taylor, N. R. and Bird, M. I. (1996). Anionic phospholipids bind to L-selectin (but not E-selectin) at a site distinct from the carbohydrate-binding site.Biochem. J 314(1): 297-303.
- Marinetti, G. and Love, R. (1976). Differential reaction of cell membrane phospholipids and proteins with chemical probes. Chem. Phys. Lipids 16(4): 239-254.
- Mathiassen, P. P. M. and Pomorski, T. G. (2022). A Fluorescence-based Assay for Measuring Phospholipid Scramblase Activity in Giant Unilamellar Vesicles. Bio Protoc 12(6): e4366.
- Parigoris, E., Dunkelmann, D. L. and Silvan, U. (2020). Generation of Giant Unilamellar Vesicles (GUVs) Using Polyacrylamide Gels. Bio Protoc 10(21): e3807.
- Pomorski, T., Lombardi, R., Riezman, H., Devaux, P. F., van Meer, G. and Holthuis, J. C. (2003). Drs2p-related P-type ATPases Dnf1p and Dnf2p are required for phospholipid translocation across the yeast plasma membrane and serve a role in endocytosis. Mol Biol Cell 14(3): 1240-1254.
- Ristovski, M., Farhat, D., Bancud, S. E. M. and Lee, J. Y. (2021). Lipid Transporters Beam Signals from Cell Membranes. Membranes (Basel) 11(8): 562.
- Schlegel, R. A., McEvoy, L. and Williamson, P. (1985). Membrane phospholipid asymmetry and the adherence of loaded red blood cells. Bibl Haematol (51): 150-156.
- Sebastian, T. T., Baldridge, R. D., Xu, P. and Graham, T. R. (2012). Phospholipid flippases: Building asymmetric membranes and transport vesicles. Biochim. Biophys. Acta Mol. Cell Biol. Lipids 1821(8): 1068-1077.
- Shimane, Y. and Kuruma, Y. (2022). Rapid and Facile Preparation of Giant Vesicles by the Droplet Transfer Method for Artificial Cell Construction. Front Bioeng Biotechnol 10: 873854.
- Sprong, H., van der Sluijs, P. and van Meer, G. (2001). How proteins move lipids and lipids move proteins. Nat. Rev. Mol. Cell Biol. 2(7): 504-513.
- Tait, J. F., Gibson, D. F. and Smith, C. (2004) Measurement of the affinity and cooperativity of annexin V-membrane binding under conditions of low membrane occupancy. Anal Biochem. 329(1):112-119.
- van den Eijnde, S. M., van den Hoff, M. J., Reutelingsperger, C. P., van Heerde, W. L., Henfling, M. E., Vermeij-Keers, C., Schutte, B., Borgers, M. and Ramaekers, F. C. (2001) Transient expression of phosphatidylserine at cell-cell contact areas is required for myotube formation. J Cell Sci. 114(Pt 20):3631-3642.
- van Meer, G., Voelker, D. R. and Feigenson, G. W. (2008). Membrane lipids: where they are and how they behave. Nat. Rev. Mol. Cell Biol. 9(2): 112-124.
- van Meer, G. (2011). Dynamic Transbilayer Lipid Asymmetry. Cold Spring Harbor Perspect. Biol. 3(5): a004671-a004671.
- Vermes, I., Haanen, C., Steffens-Nakken, H. and Reutelingsperger, C. (1995). A novel assay for apoptosis. Flow cytometric detection of phosphatidylserine expression on early apoptotic cells using fluorescein labelled Annexin V. J Immunol Methods 184(1): 39-51.
- Waehrens, L. N., Heegaard, C. W., Gilbert, G. E. and Rasmussen, J. T. (2009) Bovine lactadherin as a calcium-independent imaging agent of phosphatidylserine expressed on the surface of apoptotic HeLa cells. J Histochem Cytochem. 57(10):907-914.
- Wautier, M. P., Héron, E., Picot, J., Colin, Y., Hermine, O. and Wautier, J. L. (2011) Red blood cell phosphatidylserine exposure is responsible for increased erythrocyte adhesion to endothelium in central retinal vein occlusion. J Thromb Haemost. 9(5):1049-1055.
- Weinberger, A., Tsai, F. C., Koenderink, G. H., Schmidt, T. F., Itri, R., Meier, W., Schmatko, T., Schroder, A. and Marques, C. (2013). Gel-assisted formation of giant unilamellar vesicles. Biophys J 105(1): 154-164.
- Weingärtner, A., Kemmer, G., Müller, F. D., Zampieri, R. A., Gonzaga dos Santos, M., Schiller, J. and Pomorski, T. G. (2012). Leishmania Promastigotes Lack Phosphatidylserine but Bind Annexin V upon Permeabilization or Miltefosine Treatment. PLoS One 7(8): e42070.
- Zheng, H., Wang, F., Wang, Q. and Gao, J. (2011). Cofactor-free detection of phosphatidylserine with cyclic peptides mimicking lactadherin. J Am Chem Soc 133(39): 15280-15283.
Article Information
Copyright
© 2023 The Author(s); This is an open access article under the CC BY-NC license (https://creativecommons.org/licenses/by-nc/4.0/).
How to cite
Baum, J. F., Uzun, H. D. and Pomorski, T. G. (2023). Visualizing Loss of Plasma Membrane Lipid Asymmetry Using Annexin V Staining. Bio-protocol 13(14): e4754. DOI: 10.21769/BioProtoc.4754.
Category
Biochemistry > Lipid > Membrane lipid
Cell Biology > Cell imaging > Live-cell imaging
Do you have any questions about this protocol?
Post your question to gather feedback from the community. We will also invite the authors of this article to respond.