- Protocols

- Articles and Issues
- For Authors
- About
- Become a Reviewer

Quantification of Botrytis cinerea Growth in Arabidopsis thaliana
Published: Vol 13, Iss 16, Aug 20, 2023 DOI: 10.21769/BioProtoc.4740 Views: 2886
Reviewed by: Shweta PanchalAntony ChettoorAnonymous reviewer(s)
Original research article
The authors used this protocol in:

Jul 2022
Advertisement


Protocol Collections
Comprehensive collections of detailed, peer-reviewed protocols focusing on specific topics


Abstract
Yield losses attributed to plant pathogens pose a serious threat to plant productivity and food security. Botrytis cinerea is one of the most devastating plant pathogens, infecting a wide array of plant species; it has also been established as a model organism to study plant–pathogen interactions. In this context, development of different assays to follow the relative success of B. cinerea infections is required. Here, we describe two methods to quantify B. cinerea development in Arabidopsis thaliana genotypes through measurements of lesion development and quantification of fungal genomic DNA in infected tissues. This provides two independent techniques that are useful in assessing the susceptibility or tolerance of different Arabidopsis genotypes to B. cinerea.
Key features
• Protocol for the propagation of the necrotrophic plant pathogen fungus Botrytis cinerea and spore production.
• Two methods of Arabidopsis thaliana infection with the pathogen using droplet and spray inoculation.
• Two readouts, either by measuring lesion size or by the quantification of fungal DNA using quantitative PCR.
• The two methods are applicable across plant species susceptible the B. cinerea.
Graphical overview

A simplified overview of the droplet and spray infection methods used for the determination of B. cinerea growth in different Arabidopsis genotypes
Background
Agricultural productivity is constantly under threat from plant pathogens including bacteria, fungi, oomycetes, and viruses, contributing to global losses of 10%–28% in crop production to pests (Savary et al., 2019; IPPC Secretariat, 2021). Among the pathogens, Botrytis cinerea is a necrotrophic fungal phytopathogen distributed worldwide that causes great damage to a large diversity of plants, including various crops, leading to its classification among the top 10 worst fungal pathogens (Dean et al., 2012; Caseys et al., 2021). B. cinerea is considered a generalist necrotroph that kills the host tissues and takes up nutrients from the dead tissue. Unlike other plant pathogens, it has a very broad host range, affecting more than 1,000 plant species (Elad et al., 2016; Caseys et al., 2021; Bi et al., 2022).
The strong economic impact with regard to yield loss and the broad range of plant hosts make B. cinerea an interesting model organism for plant pathogen research, especially as it also infects the model plant species Arabidopsis thaliana. This allowed, for example, extensive transcriptomic analysis of the necrotroph infection (Windram et al., 2012) or studies on how the genetic variation of Arabidopsis or B. cinerea influences disease outcomes (Kliebenstein et al., 2005; Rowe and Kliebenstein, 2008; Soltis et al., 2020). Furthermore, B. cinerea infection assays can be used to observe different aspects of the plant immune responses in Arabidopsis (Genenncher et al., 2016; Guzha et al., 2022). Here, we show two straightforward methods that can be used in parallel to assess the disease tolerance of different Arabidopsis genotypes. One method involves drop inoculation of B. cinerea spores and measuring the average lesion development on the infected leaves (Genenncher et al., 2016; Guzha et al., 2022). The other approach involves the quantification of B. cinerea genomic DNA (gDNA) in infected Arabidopsis tissues (Ettenauer et al., 2014; Guzha et al., 2022). These two methods provided are versatile and can be applied to different plant species susceptible to the pathogen with minimal modifications.
Materials and reagents
Biological materials
Arabidopsis seeds
B. cinerea strain B05-10
Reagents
Vogel buffer
Potato dextrose agar (PDA) (Merck, catalog number: 70139)
Potato dextrose broth (PDB) (Merck, catalog number: P6685)
Glycerol (Thermo Scientific, catalog number: 17904)
Plant/Fungi DNA Isolation kit (Norgen Biotek Corporation, catalog number: 26200)
Takyon No Rox SYBR master mix dTTP Blue (Eurogentec UF-NSMT-B0701)
B. cinerea ACTIN forward primer 5′-TGGAGATGAAGCGCAATCCA-3′ (GenewizTM)
B. cinerea ACTIN reverse primer 5′-AAGCGTAAAGGGAGAGGACG-3′ (GenewizTM)
B. cinerea TUBULIN forward primer 5′-CCGTCATGTCCGGTGTTAC-3′ (GenewizTM)
B. cinerea TUBULIN reverse primer 5′-CGACCGTTACGGAAATCGG-3′ (GenewizTM)
Solutions
Potato dextrose agar (PDA) and potato dextrose broth (PDB) (see Recipes)
Sterile Vogel buffer (see Recipes)
70% ethanol (see Recipes)
15% glycerol (see Recipes)
Recipes
Potato dextrose agar (PDA) and potato dextrose broth (PDB)
Potato dextrose agar (PDA)
For 1 L of PDA, weigh 39 g of commercial PDA powder (contains 20 g of dextrose, 15 g of agar, and 4 g of potato extract), and suspend in 1 L of deionised water. Autoclave the solution at 121 °C for 20 min.
Potato dextrose broth (PDB)
For 1 L of PDB, weigh 24 g of commercial PDB powder (contains 20 g of dextrose, 4 g of potato extract) and dissolve in 1 L of deionised water. Autoclave at 121 °C for 20 min.
Sterile Vogel buffer
For 1 L of Vogel buffer, weigh the compounds as shown in Table 1 and fill up to 900 mL with distilled water. Mix until all compounds are dissolved.
Table 1. Preparation of Vogel buffer
Constituent Amount Sucrose 15 g Trisodium citrate·2H2O 2.5 g K2HPO4 5 g MgSO4·7H2O 0.2 g CaCl2·2H2O 0.1 g NH4NO3 2 g Adjust to pH 6.0 and fill up the volume to 1 L. Sterilise the buffer by autoclaving.
70% ethanol
Reagent Final concentration Amount Ethanol (absolute) 70% 700 mL H2O n/a 300 mL Total n/a 1,000 mL 15% glycerol
Reagent Final concentration Amount Glycerol 15% 150 mL H2O n/a 850 mL Total n/a 1,000 mL Sterilize by autoclaving.
Laboratory supplies
10 cm plant pots
25 cm × 51 cm × 6 cm propagation trays
25 cm × 51 cm × 18 cm high standard dome
Arabidopsis soil: Fruhstofer Erde
Chemical-resistant gloves
Miracloth (Merck, catalog number: 475855)
Kimwipes® (Kimtech Science, catalog number: 34120)
2 mL microcentrifuge tube (Sarstedt, catalog number: 72.695.500)
1.5 mL microcentrifuge tube (Sarstedt, catalog number: 72.690.001)
Flat cap PCR tubes (Sarstedt 72.985.002 (tubes) and 65.989.002 (lids))
60 mL glass spray bottle (Uline, catalog number: S24562A)
Equipment
Growth chamber with light and temperature controls (Percival Scientific Inc.)
Oven for sterilisation of soil
Microcentrifuge
Micropipettes
Scalpel
Mortar and pestle
MarCal 16ER digital caliper (Mahr, Göttingen, Germany)
Bio-Rad iQ5 Multicolor Real-Time PCR Detection System
NanoDrop 2000 spectrophotometer (Thermo Fisher Scientific)
Fuchs-Rosenthal counting chamber (Paul Marienfeld, Lauda-Königshofen, Germany)
Software and datasets
MarCom Standard Software for MarCal digital caliper
iQ5 Optical System Software (Bio-Rad Laboratories GmbH-Munich, Germany)
Microsoft Excel
Procedure
Preparation of fungal spores
When working with spores of B. cinerea, take care to avoid any infection of Arabidopsis plants. Keep working areas for B. cinerea and Arabidopsis plants distant from each other and avoid working with plants after you prepared B. cinerea spores (see Notes).
Inoculate 5 μL of spore suspension onto the centre of PDA plates at room temperature under sterile conditions. Incubate the closed plate with spores at room temperature. Do not seal plates until mycelium on the agar is covered with grey spores (4–5 days).
Propagate the spores by transferring clean mycelium grown on the PDA plate to new PDA plates. To that end, cut out a small piece of mycelium-covered agar (1 cm × 1 cm) using a sterile scalpel and transfer it upside down on the new plate. Take care to transfer only areas with a clean layer of B. cinerea mycelium that does not contain any contaminations. An example of a clean B. cinerea culture can be found in Vasquez-Montaño et al. (2020). For long-term storage of spores, harvest the spores from B. cinerea growing for 10 days on PDB plates without contaminations. In case of contaminations, cut out a section in the media with clean hyphae and grow on fresh PDA plates until a clean culture is obtained as described in step A2. Scrape spores from plates using a sterile scalpel before resuspending them with 20 mL of 15% sterile glycerol and filter through Miracloth.
Estimate the harvested spore counts using a Fuchs-Rosenthal counting chamber.
Clean the counting chamber and the coverslip with 70% ethanol. Put the glass cover on the counting chamber. Vortex the spore suspensions and pipette at least 10 μL aliquot slowly against the edge of the coverslip so that the counting chamber is filled by capillary force.
The Fuchs-Rosenthal counting chamber has a grid pattern of 16 squares of 1 mm × 1 mm that are subdivided further into 16 squares of 0.25 mm × 0.25 mm (see Figure 1) and a depth of 0.2 mm. Count the spore numbers in the 1 mm × 1 mm square areas. For one aliquot, count 16 square millimetre areas and calculate the average spore number.
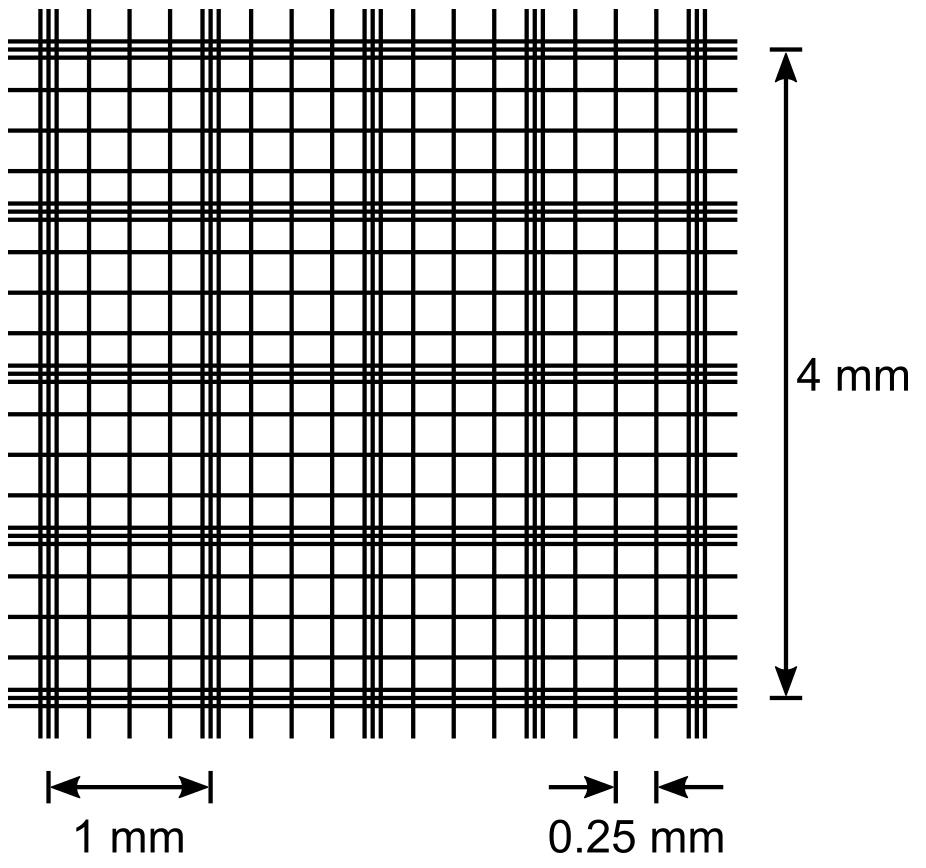
Figure 1. Grid of a Fuchs-Rosenthal counting chamber. Sixteen areas of 1 mm are delimited by triple lines and further subdivided into 0.25 mm × 0.25 mm squares by single lines. The counting chambers depth is 0.2 mm, so a 1 mm area corresponds to 0.2 μL or 0.0002 mL.Count three independent aliquots of 10 μL from the spore suspension in 15% glycerol and calculate the average spore number per square millimetre area. Vortex the spore suspension before each aliquot to obtain a homogeneous suspension. Calculate the spore concentration as follows:

Adjust the concentration to 2 × 10⁶ spores/mL in 15% glycerol. If the spore concentration is too low, centrifuge the spore suspension and remove some of the supernatant liquid. Determine the spore concentration again (as described in step A3) and then adjust to a final concentration of 2 × 10⁶ spores/mL.
Prepare 1 mL aliquots from this spore suspension for storage. While preparing the aliquots, take care to keep the spores homogeneously suspended by regularly vortexing. Flash-freeze the aliquots in liquid nitrogen and store at -80 °C.
Plant growth
To facilitate the accurate comparison of Arabidopsis genotypes, the plants must be grown under identical conditions and preferably in the same trays, which are rotated at least once every week. As an example, the procedure used in Guzha et al. (2022) and Jacobs et al. (2017) that allow comparisons of Arabidopsis genotypes' susceptibility to plant pathogens is outlined below. In addition, check the Notes section for comments on biological replicates.
Prepare semi-sterile soil sufficient for the desired number of pots by heating it in an oven at 80 °C for 8 h.
Transfer enough soil to fill square 10 cm pots and water the pots by placing water in the trays until the soil reaches saturation, before draining excess water. Place 6–10 Arabidopsis seeds in the four corners and the centre of the pots, which will be thinned out later to leave one plant per station (Figure 2A). Cover with plastic dome.
After stratification at 4 °C, transfer to growth cabinet with short day conditions (8 h light and 16 h darkness) at 22 °C, a relative humidity of 65%, and a light intensity of 120–140 μmol m-2·s-1. Remove the plastic dome after germination of the seeds.
Grow plants for 7–10 days; then, thin out excess seedlings to leave one plant per position (Figure 2A).
Grow until desired stage.
Droplet infection and measurements of lesion diameters
Take care not to infect other plants that are not part of the infection experiment. Keep infected plants separate from the normal plant growth chambers and avoid working with other plants after carrying out infection assays.
Prepare spores by gently thawing the frozen spores on ice. Dilute the thawed spore suspension to a final concentration of 5 × 10⁴ spores/mL in sterile Vogel buffer.
Let the spores germinate (40 mL in a Falcon tube) for at least 4 h at 25 °C (shaking is not necessary). B. cinerea spores germinate readily in Vogel buffer. Germination of spores can be checked under a light microscope.
Use 6-week-old plants grown under short day conditions as described above (section B). For each leaf, place a single 6 μL droplet of the germinated spore suspension onto the adaxial side of the leaf, in the centre next to the middle vein (Figure 2B). Inoculate at least 30 fully expanded leaves of each plant genotype (at least six leaves from each plant in a pot, as shown in Figure 2A). Between application of spore suspension droplets, regularly vortex the spore suspensions to keep a homogeneous spore distribution (every 2–3 droplets). Spore suspension droplets will stay on the leaves due to surface tension; however, take care not to shake the pots to ensure that droplets do not fall off the leaf.
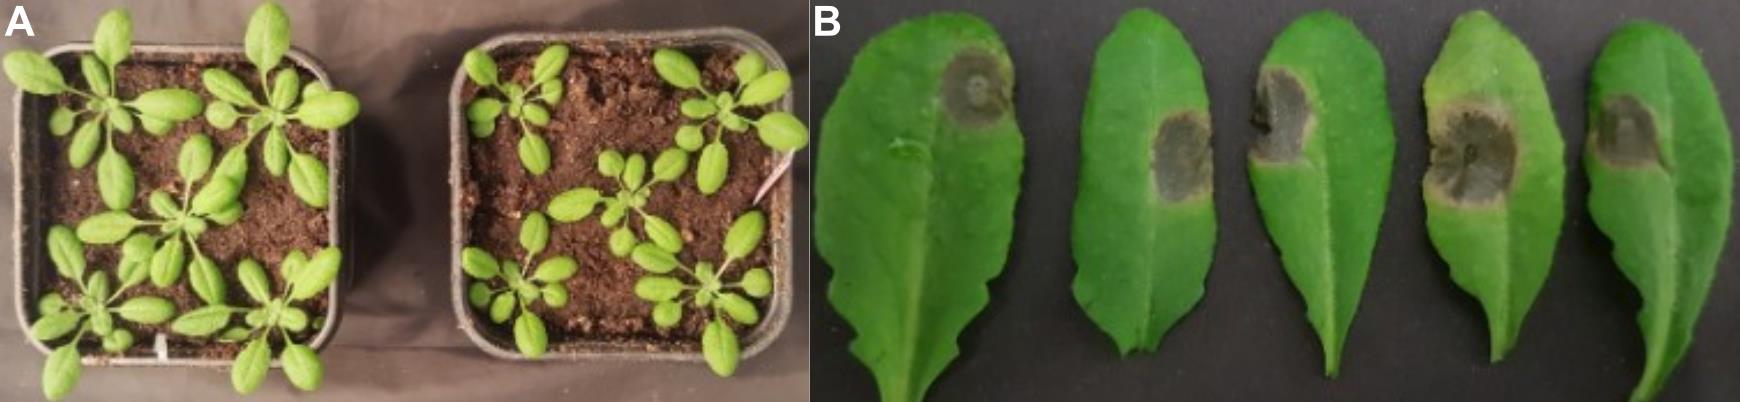
Figure 2. Arabidopsis plants for infection with Botrytis cinerea. A. For each genotype, five plants are grown per pot for use in the infection assays. B. At least 30 leaves per pot are inoculated with 6 μL droplets of a B. cinerea spore suspension. Three days post infection, lesions develop at the infected area.Add 0.5 L of water to the tray containing the plants and cover them with a lid to maintain high humidity conditions. Return plants to short-day growth conditions (distinct from normal growth chambers) until determination of lesion size.
Analyse lesion size 3 days post infection. To that end, use the MarCal 16ER digital calliper to measure lesion diameters.
Before first use: install the MarCom Standard Software according to manufacturer’s instructions on the notebook you will subsequently use for measurements. Connect your digital calliper to the notebook and install the required software drivers. Use a notebook with Windows operating system that has MS Excel installed (see Notes).
For measurements, connect the digital calliper to the notebook with the installed MarCom software, open the software, and verify that the calliper has been recognised. Detach infected leaves from Arabidopsis plants and measure the diameter of the developed lesion with the calliper. Press the measurement button to transfer the data point to an Excel file, which will open after the first measurement.
Measure leaves from one plant genotype at a time and mark different genotypes in the Excel file with the measured data.
Spray infection and isolation of fungal gDNA
Another way to assess susceptibility of Arabidopsis genotypes to B. cinerea infection is by spray-infection and subsequent quantification of fungal gDNA in plant tissues. When using the spray infection protocol, take care not to infect other plants that are not part of the infection experiment through aerosols generated. Keep infected plants separate from the normal plant growth chambers and avoid working with other plants after carrying out infection assays.
Prepare spores by gently thawing the required number of aliquots on ice. Dilute the thawed spore suspension to a final concentration of 2 × 10⁵ spores/mL in sterile Vogel buffer.
Let the spores germinate (50 mL in a Falcon tube) for at least 4 h at 25 °C. B. cinerea spores germinate readily in Vogel buffer.
Use 6-week-old plants grown under short day conditions as described above (section B). For spray infection, transfer the germinated spores to a spray bottle and spray evenly on the plants until liquid runs off the leaves.
Add 0.5 L water to the tray with the plants and cover them with a lid to keep humid conditions. Return plants to short-day growth conditions (distinct from the normal growth chambers) until harvest for gDNA isolation.
After three or four days, flash-freeze the rosettes in liquid nitrogen and store at -80 °C or proceed to isolation of plant and fungal gDNA.
For isolation of gDNA, the commercially available Plant/Fungi DNA Isolation kit was used according to manufacturer’s instructions. The isolation of gDNA included the following steps:
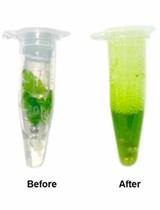
Keep the harvested plant material cooled with liquid nitrogen and grind into a powder using a mortar and pestle. Transfer ≤ 100 mg of the powder to a 1.5 mL microcentrifuge tube, add 500 μL of Lysis buffer and 1 μL of RNase A, and vortex for 20 s.
Note down the exact mass of powdered plant material for sample normalisation.
Lyse for 10 min at 65 °C, add 100 μL of binding buffer I, mix by inverting the tube, and incubate on ice for 5 min.
Transfer the lysate to a filter column, centrifuge at 20,000× g for 2 min, and transfer the supernatant to a clean 1.5 mL microcentrifugation tube. Add an equal volume of 70% ethanol and vortex.
Transfer 650 μL of the sample to a spin column and centrifuge for 1 min at 10,000× g. Discard the flowthrough and repeat if necessary.
Wash once with 500 μL of Solution WN, centrifuge at 20,000× g for 1 min, and discard the flowthrough.
In a similar manner, wash twice with 500 μL of Wash Solution A. After the final washing step, centrifuge the column for 2 min at 20,000× g.
Transfer the spin column to a fresh elution tube, add 100 μL of Elution Buffer B, and incubate for 1 min at room temperature. Centrifuge for 1 min at 10,000× g. If not all buffer has been eluted, centrifuge again for an additional 1 min at 20,000× g.
Store isolated gDNA at -20 °C. The gDNA isolated in this step will be a combination of both plant and fungal gDNA. Quantification of fungal gDNA is made possible by the use of primers specific for fungal gDNA during quantitative PCR (section F).
Fungal gDNA isolation for calibration
To generate a calibration curve for quantification of fungal gDNA, harvest spores from B. cinerea mycelium that has been growing on PDB plates for 10 days and collect them in a sterile Falcon tube. Harvest the spores by scraping them off with a sterile spatula.
Extract the gDNA using the Plant/Fungi DNA Isolation kit as described above.
Measure the concentration of the genomic DNA using the NanoDrop 2000 spectrophotometer.
Perform a serial dilution (1/2 dilution steps) of the gDNA and measure the concentrations on the NanoDrop 2000 spectrophotometer.
Perform qPCR analysis as described below.
Quantitative PCR for fungal gDNA fungal genomic DNA
For quantification of fungal gDNA, primers for B. cinerea ACTIN or TUBULIN that are specific for fungal gDNA are used. Prepare three technical replicates per sample, including the calibration samples described in section E.
Prepare the reagents for the qPCR in the following proportions:
10 μL of 2× Takyon master mix
2.5 μL of DNA
2 μL of 4 μM forward primer
2 μL of 4 μM reverse primer
3.5 μL of H2O
Final volume: 20 μL
Prepare a master mix with 2× Takyon master mix, primers, and H2O in an autoclaved 1.5 mL tube (all reactions should be performed on ice). Perform each reaction in triplicate.
Load 17.5 μL of the master mix to PCR tubes with flat caps. When loading samples, take note of the arrangement of the samples.
Load 2.5 μL of the genomic DNA to the PCR tubes and carefully seal the flat caps.
Briefly vortex the samples before spinning them down. Ensure that there are no bubbles in the samples as they may interfere with signal detection.
Load samples into the Bio-Rad iQ5 qPCR cycler and wipe the tops of the PCR tubes with a Kimwipe to remove any dust or debris that may interfere with signal detection.
Reaction cycle: 95 °C for 1 min 20 s; (95 °C 20 s, 62 °C 20 s, 72 °C 40 s) × 40; 72 °C 4 min.
Melt curve analysis: 95 °C for 1 min; 60 °C for 1 min; increase to 95 °C in 0.5° increments, hold each temperature for 10 s.
After completion of the qPCR run, export the data to an Excel file to compute the quantifications.
Data analysis
Analysis of drop infections
With the digital calliper, data has already been transferred to an Excel spreadsheet. For calculation of mean, standard deviation, and standard error as well as graphical representation, Excel functions can be used. For statistical analysis beyond Student’s t-test, export the data into software for statistical analysis of your choice. Figure 3 shows exemplary results derived from the drop infection method.
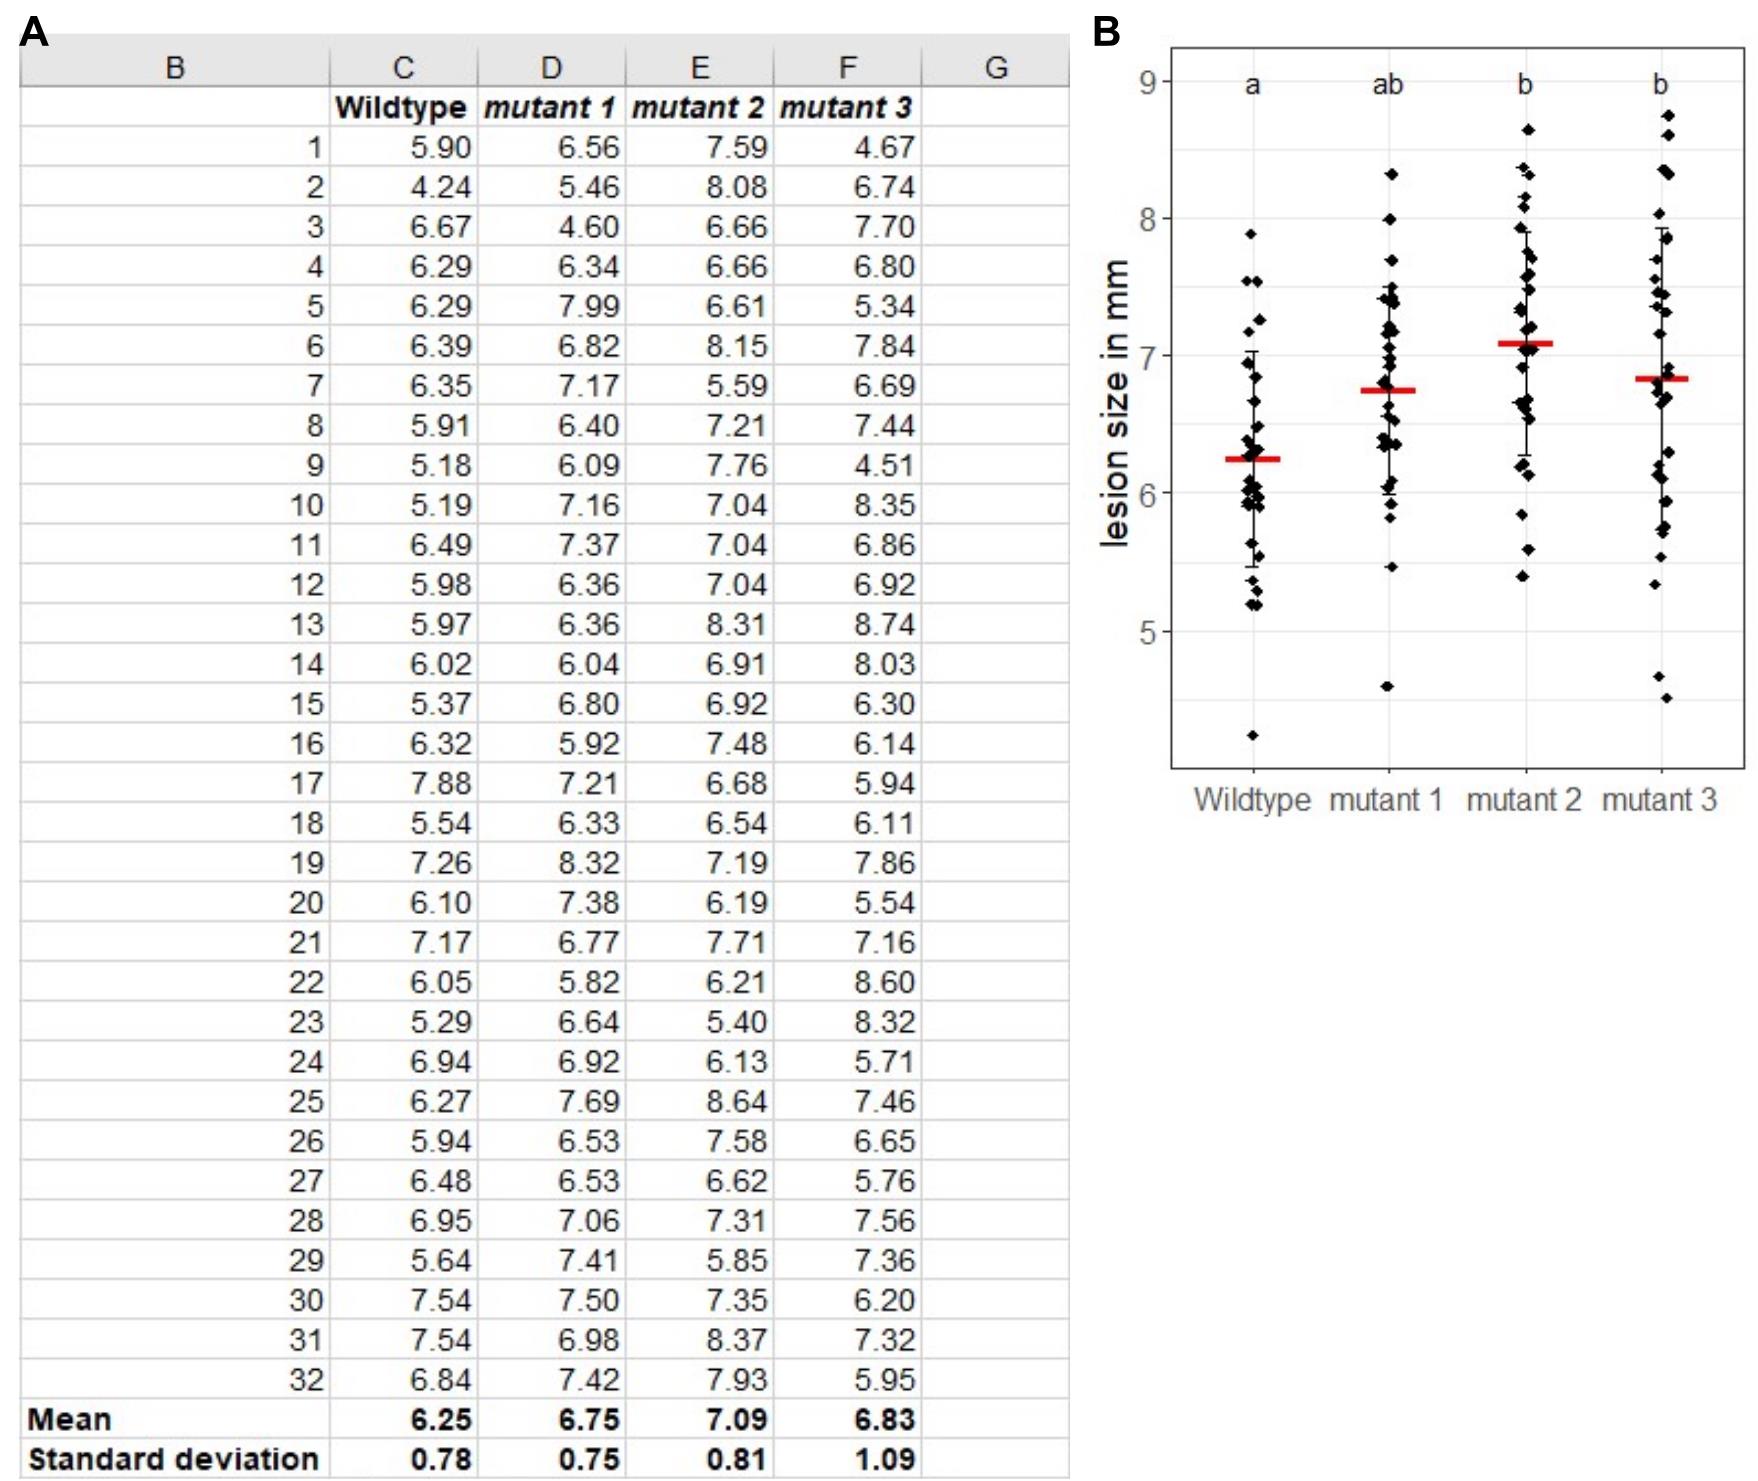
Figure 3. Exemplary results of B. cinerea droplet infection assay. At least 30 leaves were measured per genotype. The respective mean lesion diameter and the standard deviation were calculated in Microsoft Excel and are shown in the bottom two lines. (A) For visualisation and statistical analysis, R-Studio was used in this example. (B) Individual data points are shown as black dots in addition to the mean value (red crossbar) and the standard deviation. Different letters indicate significant differences with p < 0.05 as calculated by ANOVA with post-hoc Tukey-test.Analysis of spray infections
Calibration of fungal gDNA
Calculate the used volumes of fungal gDNA in nanograms from the concentrations of your different samples from the serial dilution and the used volume per qPCR reaction. Determine the natural logarithm of the gDNA volume and plot the log10 values of gDNA volume vs. respective mean Ct-values. Perform a linear regression analysis on the plot. R2 must be as close as possible to 1.
Determine the parameters m and b of the linear correlation between log-values of gDNA volume and mean Ct-values, for example with the “LINEST” function in Excel.

Note down m and b for subsequent calculation of fungal gDNA in infected plant samples.
Calculation of fungal gDNA in infected plant samples
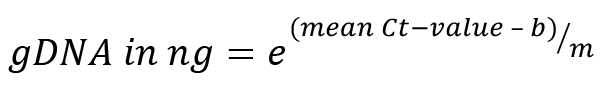
With the parameters m and b determined above, calculate the volume of gDNA in the infected plant samples.
As only a part of the isolated gDNA was used for the qPCR reaction, multiply the determined mass with a correction factor:
correction factor=(elution volume of gDNA isolation)/(gDNA volume used in qPCR reaction)
Normalise the gDNA volume to the mass of the plant material used for gDNA extraction.
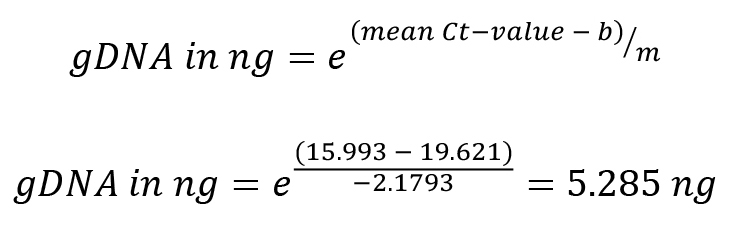
Exemplarily, quantification of fungal gDNA from a spray-infected Arabidopsis leaf sample is shown below.
Sample mass: 190 mg ground Arabidopsis leaf material
Threshold cycle (Ct) value as determined by qPCR: 15.993
Based on the calibration curve obtained, m and b values are determined:
m = -2.179, b = 19.621
Calculate the gDNA in each reaction cycle:
Calculate the correction factor:

Calculate total volume of gDNA:

Normalise amount of fungal gDNA to plant material:

Validation of protocol
This protocol or its parts have been used in the following research articles:
Genenncher et al. (2016). Nucleoporin-Regulated MAP Kinase Signaling in Immunity to a Necrotrophic Fungal Pathogen. Plant Physiol (Figure 1).
Guzha et al. (2022). Cell wall-localized BETA-XYLOSIDASE4 contributes to immunity of Arabidopsis against. Botrytis cinerea (Figure 2C, 2D, 2E, 3C, 3D, and 3E).
General notes and troubleshooting
It is important to carry out independent infection experiments on plants grown at different times to account for variances caused by slight variations in infection or growth conditions. We recommend performing at least three independent experiments with at least 30 infected plant leaves per genotype in case of lesion size measurements, or with at least three biological replicates and at least three technical replicates in case of quantification of fungal gDNA.
In the described protocol, B. cinerea does not contain any resistance or selection markers that would allow growth on selective plates. Work under sterile conditions when preparing B. cinerea spores. When transferring mycelium to fresh PDA plates, make sure that you select regions of the previous PDA plate that contain only B. cinerea mycelium and no contaminations.
As B. cinerea infects plants via air-borne spores, it is important to separate the working area for B. cinerea assays from the area where you work with non-infected plants.
Keep infected plants separate from normal plants in a dedicated growth chamber.
Avoid all normal plant areas after you prepared B. cinerea spores or carried out an infection assay.
After infection assays, clean all tools used for infection by incubation with anti-fungal disinfectant and 70% ethanol. Similarly, clean the working area for infection after use.
During the configuration of your digital calliper, edit the parameters of the measuring instrument so that data will be transferred to Excel. Individual measurements will then be transferred into successive rows of an Excel sheet. Adjust the end row number so that all measurements from a single experiment will fit into the same Excel sheet.
Lesion size is usually not perfectly circular (Figure 2B); so, measuring the diameter becomes more difficult. Measure lesion size diameter for all leaves in a similar angle to the middle vein (e.g., always parallel to the middle vein); all leaves should be measured by the same experimenter. For generation of the standard curve for gDNA quantification, it is important to accurately measure the gDNA concentrations on a NanoDrop after the serial dilutions.
Troubleshooting
Poor fungal growth after infection: maintain the plants under high humidity by placing a dome over the plants after infection.
Acknowledgments
This protocol was derived from Guzha et al. (2022). We are grateful to Prof. Dr. Marcel Wiermer and Dr. Denise Hartken for useful discussions on B. cinerea infection and Dr. Sven Haroth for qPCR advice. This work was supported by German Research Foundation (DFG, IS 273/10-1, IRTG 2172 PRoTECT to T.I), the Studienstiftung des Deutschen Volkes (stipend to P.S.) and a grant from the U.S. Department of Energy, Office of Science, BER program DE-SC0020325 to K.D.C.
Competing interests
The authors have no financial or non-financial competing interests.
References
- Bi, K., Liang, Y., Mengiste, T. and Sharon, A. (2022). Killing softly: a roadmap of Botrytis cinerea pathogenicity. Trends Plant Sci: 28(2):211-222.
- Caseys, C., Shi, G., Soltis, N., Gwinner, R., Corwin, J., Atwell, S. and Kliebenstein, D. J. (2021). Quantitative interactions: the disease outcome of Botrytis cinerea across the plant kingdom. G3 (Bethesda) 11(8): jkab175.
- Dean, R., Van Kan, J. A., Pretorius, Z. A., Hammond-Kosack, K. E., Di Pietro, A., Spanu, P. D., Rudd, J. J., Dickman, M., Kahmann, R., Ellis, J., et al. (2012). The Top 10 fungal pathogens in molecular plant pathology. Mol Plant Pathol 13(4): 414-430.
- Elad, Y., Pertot, I., Cotes Prado, A. M. and Stewart, A. (2016). Plant Hosts of Botrytis spp. In: Fillinger, S. and Elad, Y. (Eds.). Botrytis – the Fungus, the Pathogen and its Management in Agricultural Systems (pp. 413-486). Springer International Publishing: Cham.
- Ettenauer, J., Piñar, G., Tafer, H., and Sterflinger, K. (2014). Quantification of fungal abundance on cultural heritage using real time PCR targeting the β-actin gene.Front Microbiol 5: 262
- Genenncher, B., Wirthmueller, L., Roth, C., Klenke, M., Ma, L., Sharon, A. and Wiermer, M. (2016). Nucleoporin-Regulated MAP Kinase Signaling in Immunity to a Necrotrophic Fungal Pathogen.Plant Physiol 172(2): 1293-1305.
- Guzha, A. McGee, R., Scholz, P., Hartken, D., Lüdke, D., Bauer, K., Wenig, M., Zienkiewicz, K., Herrfurth, C., Feussner, I. et al.(2022). Cell wall-localized BETA-XYLOSIDASE4 contributes to immunity of Arabidopsis against Botrytis cinerea. Plant Physiol 189(3): 1794-1813.
- IPPC Secretariat. (2021). Scientific review of the impact of climate change on plant pests – A global challenge to prevent and mitigate plant pest risks in agriculture, forestry and ecosystems. Rome. FAO on behalf of the IPPC Secretariat.
- Jacob, C., Panchal, S. and Melotto, M., (2017). Surface inoculation and quantification of Pseudomonas syringae population in the Arabidopsis leaf apoplast. Bio Protoc 7(5): e2167.
- Kliebenstein, D. J., Rowe, H. C. and Denby, K. J. (2005). Secondary metabolites influence Arabidopsis/Botrytis interactions: variation in host production and pathogen sensitivity.Plant J 44(1): 25-36.
- Rowe, H. C. and Kliebenstein, D. J. (2008). Complex genetics control natural variation in Arabidopsis thaliana resistance to Botrytis cinerea. Genetics180(4): 2237-2250.
- Savary, S., Willocquet, L., Pethybridge, S. J., Esker, P., McRoberts, N. and Nelson, A. (2019). The global burden of pathogens and pests on major food crops. Nat Ecol Evol 3(3): 430-439.
- Soltis, N. E., Caseys, C., Zhang, W., Corwin, J. A., Atwell, S. and Kliebenstein, D. J. (2020). Pathogen Genetic Control of Transcriptome Variation in the Arabidopsis thaliana - Botrytis cinerea Pathosystem.Genetics 215(1): 253-266.
- Vasquez-Montaño, E., Hoppe, G., Vega, A., Olivares-Yañez, C. and Canessa, P. (2020). Defects in the ferroxidase that participates in the reductive iron assimilation system results in hypervirulence in Botrytis cinerea. mBio 11(4): e01379-20.
- Windram, O., Madhou, P., McHattie, S., Hill, C., Hickman, R., Cooke, E., Jenkins, D. J., Penfold, C. A., Baxter, L., Breeze, E. et al. (2012). Arabidopsis Defense against Botrytis cinerea: Chronology and Regulation Deciphered by High-Resolution Temporal Transcriptomic Analysis.Plant Cell 24(9): 3530-3557.
Article Information
Copyright
© 2023 The Author(s); This is an open access article under the CC BY license (https://creativecommons.org/licenses/by/4.0/).
How to cite
Scholz, P., Chapman, K. D., Ischebeck, T. and Guzha, A. (2023). Quantification of Botrytis cinerea Growth in Arabidopsis thaliana. Bio-protocol 13(16): e4740. DOI: 10.21769/BioProtoc.4740.
Category
Plant Science > Plant physiology > Biotic stress
Plant Science > Plant molecular biology > DNA > DNA extraction
Biological Sciences > Biological techniques > Microbiology techniques
Do you have any questions about this protocol?
Post your question to gather feedback from the community. We will also invite the authors of this article to respond.