- Protocols

- Articles and Issues
- For Authors
- About
- Become a Reviewer

Ex vivo Drug Sensitivity Imaging-based Platform for Primary Acute Lymphoblastic Leukemia Cells
(§ Technical contact) Published: Vol 13, Iss 15, Aug 5, 2023 DOI: 10.21769/BioProtoc.4731 Views: 3554
Reviewed by: Rajesh RanjanSalah BoudjadiDipak Kumar Poria
Original research article
The authors used this protocol in:
Jan 2021
Advertisement


Protocol Collections
Comprehensive collections of detailed, peer-reviewed protocols focusing on specific topics


Abstract
Resistance of acute lymphoblastic leukemia (ALL) cells to chemotherapy, whether present at diagnosis or acquired during treatment, is a major cause of treatment failure. Primary ALL cells are accessible for drug sensitivity testing at the time of new diagnosis or at relapse, but there are major limitations with current methods for determining drug sensitivity ex vivo. Here, we describe a functional precision medicine method using a fluorescence imaging platform to test drug sensitivity profiles of primary ALL cells. Leukemia cells are co-cultured with mesenchymal stromal cells and tested with a panel of 40 anti-leukemia drugs to determine individual patterns of drug resistance and sensitivity (“pharmacotype”). This imaging-based pharmacotyping assay addresses the limitations of prior ex vivo drug sensitivity methods by automating data analysis to produce high-throughput data while requiring fewer cells and significantly decreasing the labor-intensive time required to conduct the assay. The integration of drug sensitivity data with genomic profiling provides a basis for rational genomics-guided precision medicine.
Key features
• Analysis of primary acute lymphoblastic leukemia (ALL) blasts obtained at diagnosis from bone marrow aspirate or peripheral blood.
• Experiments are performed ex vivo with mesenchymal stromal cell co-culture and require four days to complete.
• This fluorescence imaging–based protocol enhances previous ex vivo drug sensitivity assays and improves efficiency by requiring fewer primary cells while increasing the number of drugs tested to 40.
• It takes approximately 2–3 h for sample preparation and processing and a 1.5-hour imaging time.
Graphical overview

BM: bone marrow; PB: peripheral blood; ALL: acute lymphoblastic leukemia; MNCs: mononuclear cells, which include leukemia cells when present; MSCs: mesenchymal stromal cells; LC50: drug concentration that kills 50% of the leukemia cells
Background
Acute lymphoblastic leukemia (ALL) is a heterogenous disease that can be grouped into multiple B- and T-lineage genomic subtypes (Inaba and Mullighan, 2020; Inaba and Pui, 2021; Brady et al., 2022). While five-year survival rates for many pediatric B-cell ALL (B-ALL) subtypes can exceed 90%, survival rates are lower for adults who have more treatment-resistant B-cell ALL, particularly those with Ph-like ALL (Foà et al., 2011). Similarly, survival for certain subtypes of T-cell ALL (T-ALL) remains below 80% (Karrman and Johansson, 2017) and outcomes following relapse for both pediatric and adult patients with ALL remain dismal (Pocock et al., 2021; Laukkanen et al., 2022; Wudhikarn et al., 2022). Because of its high incidence, ALL remains the most common cause of death from childhood cancer. Treatment efficacy in ALL varies by molecular subtype and secondary genomic alterations (Pui et al., 2012; Brady et al., 2022). Progress in understanding the heterogeneity of the genomics of ALL has provided insight into actionable drug targets (Meyer et al., 2013; Irving et al., 2014; Khaw et al., 2016; Gocho et al., 2021; Brady et al., 2022). Molecularly targeted agents have shown efficacy in some subtypes of high-risk B-ALL disease. There is a need for further development of molecularly targeted therapy optimized based on characteristics of an individual patient’s cancer cells (Carroll et al., 2003; Brady et al., 2022; Lee et al., 2023).
Functional precision medicine approaches combine direct drug sensitivity profiling (i.e., pharmacotyping) with genomic testing to elucidate the biological basis of variability in treatment response (Frismantas et al., 2017; Kornauth et al., 2022; Lee et al., 2023). Defining inter-patient variability in leukemia cell drug sensitivity is a starting point for observing patterns of sensitivity to antileukemia agents. Drug sensitivity profile groups have been associated with treatment outcome, including event-free survival and cumulative risk of relapse (Holleman et al., 2004; Pieters et al., 2007; Lee et al., 2023). ALL drug sensitivity phenotype has likewise been associated with clinical characteristics and somatic genomic features (Pieters et al., 1993; Ramakers-van Woerden et al., 2002; Holleman et al., 2004; Ramakers-van Woerden et al., 2004; Lugthart et al., 2005; Pui et al., 2019). Pharmacotyping profiles have the potential to drive research to uncover new subtype-specific therapeutic opportunities for ALL.
Both flow cytometry–based and the 3-(4,5-dimethylthiazol-2-yl)-2,5-diphenyl-tetrazoliumbromide (MTT)–based drug-resistance assays have served as reliable methods in our laboratory for quantification of B- and T-ALL leukemia cell viability upon exposure to antineoplastic agents (Holleman et al., 2004; Paugh et al., 2015; Autry et al., 2020; Gocho et al., 2021; Lee et al., 2023). We have used flow cytometry–based methods and MTT-based methods for sensitivity testing of leukemia cell lines, patient-derived xenografts (PDX), and primary patient samples; however, in our experience, these assays are markedly limited by requirements for high cell count at plating, prolonged time requirements to complete the assay and data analyses, and lack of high-throughput potential for screening of antineoplastic drugs against samples (Gocho et al., 2021). Ex vivo models have used human bone marrow mesenchymal stromal cells (MSC) to support leukemia cells in culture for functional experiments (Boutter et al., 2014). Other groups have published functional precision medicine methods using automated microscopic imaging to test drug sensitivity of PDX cells from clinically relevant ALL subgroups (Frismantas et al., 2017). Here, our group has established an ex vivo pharmacotyping platform to directly profile leukemia cells from individual patients for drug sensitivity using high-content imaging. Coupling data derived from this platform with patient genomic profiles has the potential to catapult the development of new ALL therapy using actionable target and biomarker discovery.
Here, we present our methodology for a high-throughput imaging-based assay for leukemia cell viability to identify effective cytotoxic and targeted anti-leukemia agents. Using a biologically realistic leukemia cell and MSC co-culture as described by other groups (Frismantas et al., 2017), our imaging system has produced high-throughput viability data with potential for further image analyses. This method is used to assess inter-patient differences in drug sensitivity related to patient age, sex, molecular subtypes of leukemia, and genomics, and to discover mechanisms of drug resistance in patients with ALL (Autry et al., 2020; Gocho et al., 2021; Lee et al., 2023). This knowledge may in turn be used to build more robust precision medicine approaches to improve cure rates, and to create future avenues to facilitate the rational use of molecularly targeted therapy. This protocol includes methods for this imaging-based functional precision medicine assay.
Materials and reagents
Biological materials
hTERT immortalized human bone marrow mesenchymal stromal cells (MSCs) (Applied Biological Materials, Inc., catalog number: T0523)
Reagents
AIM-V medium, 1,000 mL (Gibco, catalog number: 12055-083)
Hydrocortisone-water soluble (Sigma, catalog number: H0396)
RPMI 1640 medium, 500 mL (Gibco, catalog number: 11875-093)
Fetal bovine serum, certified, heat inactivated (Gibco, catalog number: 10082-147)
DMSO (Sigma, catalog number: D2660-100ML)
PBS, pH 7.4, 500 mL (Gibco, catalog number: 10010-023)
CyQUANTTM Direct Cell Proliferation Assay Green (Invitrogen, catalog number: C35012)
ViaStain AOPI staining solution (Nexcelom, catalog number: CS2-0106-25mL)
Trypsin-EDTA 0.25% (Gibco, catalog number: 25200-056)
Antibiotic antimycotic 100× (Gibco, catalog number: 15240-062)
RPMI 1640 without phenol red & L-glutamine (Lonza, catalog number: 12-918F)
0.5 M EDTA pH 8.0 (Gibco, catalog number: 15575-038)
0.9% sodium chloride (Baxter, catalog number: 2F7123)
Insulin-transferrin-selenium 100× (Gibco, catalog number: 41400045)
L-Glutamine 200 mM (Gibco, catalog number: A2916801)
0.1 N sodium hydroxide (Fisher Scientific, catalog number: AC124190010)
AmbionTM nuclease-free water (Invitrogen, catalog number: AM9937)
Ultrapure (Type 1) water
Drug stock solutions (Table 1)
Table 1. Drug stock solutions
# Name Vendor Catalog number Stock concentration Storage Diluent Concentration range Dilution factor 1 Trametinib MedChemExpress HY-10999 10 mM -80 °C DMSO 0.01–1,000 nM 10 2 Gilteritinib MedChemExpress HY-12432 10 mM -80 °C DMSO 0.1–10,000 nM 10 3 Venetoclax MedChemExpress HY-15531 10 mM -80 °C DMSO 0.001–100 nM 10 4 Inotuzumab Pfizer NA 0.25 mg/mL -80 °C Nuclease-free water 0.0025–250 ng/mL 10 5 Palbociclib MedChemExpress HY-50767A 10 mM -80 °C DMSO 0.1–10,000 nM 10 6 CHZ868 MedChemExpress HY-18960 10 mM -80 °C DMSO 0.1–10,000 nM 10 7 Dasatinib Selleckchem S1021 10 mM -80 °C DMSO 0.1–10,000 nM 10 8 Ibrutinib MedChemExpress HY-10997 50 mM -80 °C DMSO 1.5625–50 mM 2 9 6-mercaptopurine Acros Organics 226520050 5 mg/mL -20 °C 0.1 N NaOH 91.8–2,938 mM 2 10 Prednisolone Pfizer 00009004722 12.5 mg/mL -20 °C 0.9% NaCl 0.015–503.5 mM 8 11 L-asparaginase BioVendor RP1792872500 500 IU/mL -80 °C Type 1 water 0.0032–10 IU/mL 5 12 Vincristine Hospira 61703030906 0.25 mg/mL -20 °C Type 1 water 0.0017–54.169 mM 8 13 Nelarabine Sigma-Aldrich SML1736 200 mM -20 °C DMSO 1.03–250 mM 3 14 Bortezomib St. Jude Compound Management SJ000518968 10 mM -80 °C DMSO 0.98–1,000 nM 4 15 Vorinostat Sellekchem S1047 100 mM -80 °C DMSO 102.88–25,000 nM 3 16 Daunorubicin Teva 00703523313 0.1 mg/mL -20 °C Type 1 water 0.004–3.55 mM 4 17 Luminespib MedChemExpress HY-10215 10 mM -80 °C DMSO 0.01–1,000 nM 10 18 Clofarabine MedChemExpress HY-A0005 10 mM -80 °C DMSO 0.1–10,000 nM 10 19 Olaparib MedChemExpress HY-10162 10 mM -80 °C DMSO 0.1–10,000 nM 10 20 Selinexor Selleckchem S7252 10 mM -80 °C DMSO 0.1–10,000 nM 10 21 Ponatinib MedChemExpress HY-12047 10 mM -80 °C DMSO 0.1–10,000 nM 10 22 Saracatinib MedChemExpress HY-10234 10 mM -80 °C DMSO 0.1–10,000 nM 10 23 Acalabrutinib MedChemExpress HY-17600 10 mM -80 °C DMSO 0.1–10,000 nM 10 24 Momelotinib MedChemExpress HY-10961 10 mM -80 °C DMSO 0.1–10,000 nM 10 25 Midostaurin MedChemExpress HY-10230 10 mM -80 °C DMSO 0.1–10,000 nM 10 26 Fostamatinib MedChemExpress HY-13038A 10 mM -80 °C DMSO 0.1–10,000 nM 10 27 Larotrectinib MedChemExpress HY-12866 10 mM -80 °C DMSO 0.1–10,000 nM 10 28 Repotrectinib MedChemExpress HY-103022 10 mM -80 °C DMSO 0.1–10,000 nM 10 29 Sorafenib MedChemExpress HY-10201 10 mM -80 °C DMSO 0.1–10,000 nM 10 30 Everolimus MedChemExpress HY-10218 10 mM -80 °C DMSO 0.1–10,000 nM 10 31 Sotorasib (AMG-510) MedChemExpress HY-114277 10 mM -80 °C DMSO 0.1–10,000 nM 10 32 Birinapant MedChemExpress HY-16591 10 mM -80 °C DMSO 0.1–10,000 nM 10 33 SNDX-5613 MedChemExpress HY-136175 10 mM -80 °C DMSO 0.1–10,000 nM 10 34 Iadademstat MedChemExpress HY-12782T 10 mM -80 °C DMSO 0.1–10,000 nM 10 35 EPZ4777 (EPZ004777) MedChemExpress HY-15227 10 mM -80 °C DMSO 0.1–10,000 nM 10 36 JQ1 MedChemExpress HY-13030 10 mM -80 °C DMSO 0.1–10,000 nM 10 37 Eprenetapopt (APR-246) MedChemExpress HY-19980 10 mM -80 °C DMSO 0.1–10,000 nM 10 38 S63845 MedChemExpress HY-100741 10 mM -80 °C DMSO 0.001–100 nM 10 39 Navitoclax MedChemExpress HY-10087 10 mM -80 °C DMSO 0.01–1,000 nM 10 40 Carfilzomib MedChemExpress HY-10455 10 mM -80 °C DMSO 0.0001–10 nM 10
Solutions
1 mM hydrocortisone stock solution (see Recipes)
Cell medium (see Recipes)
MSC medium (see Recipes)
Recipes
1 mM hydrocortisone stock solution
Reagent Final concentration Amount Hydrocortisone-water soluble 1 mM 100 mg Type 1 water n/a 23.45 mL Total n/a 23.45 mL Cell medium
Reagent Final concentration Amount RPMI w/o phenol red & L-glutamine n/a 500 mL Antibiotic antimycotic 1× 6.25 mL L-Glutamine 2 mM 6.25 mL Insulin-transferrin-selenium 1× 6.25 mL Heat-inactivated fetal bovine serum 20% 125 mL Total n/a 643.75 mL MSC medium
Reagent Final concentration Amount 1 mM hydrocortisone-water soluble 1 μM 0.625 mL RPMI-1640 n/a 500 mL Heat-inactivated fetal bovine serum 20% 125 mL Total n/a 625.625 mL
Laboratory supplies
384-well plates (PerkinElmer, Phenoplate, catalog number: 6057302)
10 mL pipettes (Corning, catalog number: 4101)
25 mL pipettes (Corning, catalog number: 4237)
15 mL conical tubes (Falcon, catalog number: 352097)
50 mL conical tubes (Falcon, catalog number: 352098)
Microtubes 1.5 mL (Axygen, catalog number: MCT-150-L-C)
Microtubes 0.6 mL (Axygen, catalog number: MCT-060-L-C)
Stericup quick release Millipore express 0.22 μM PES 500 mL (Millipore, catalog number: 6346)
10 cm dishes (Corning, catalog number: 353003)
20 μL filter tips (Rainin, catalog number: 30389225)
200 μL filter tips (Rainin, catalog number: 30389239)
1,000 μL filter tips (Rainin, catalog number: 30389212)
125 μL tips XYZ rack of 384 griptips (Integra, catalog number: 6465)
125 μL tips ECO rack of 384 griptips (Integra, catalog number: 3425)
150 mL reagent reservoirs (Integra, catalog number: 6318)
Equipment
Operetta CLSTM high-content analysis system (PerkinElmer, HH1600000)
STR4 plus series centrifuge (Thermo Scientific, catalog number: 75016037)
BX41 microscope (Olympus, catalog number: BX41-PH-B)
Tuberoller (Benchmark, catalog number: R3010)
Nikon Eclipse TS100 microscope (Nikon, catalog number: NI-TS100)
IsoTemp digital controlled water bath (Fisher Scientific, model: 2320)
TC10 automated cell counter (Bio-Rad, catalog number: 145-0010)
Sorvall Legend X1R centrifuge (Thermo Scientific, catalog number: 75004260)
Heracell 150i CO2 incubator (Thermo Scientific, catalog number: 51032719)
VIAFLO 384 automated pipette (Integra, catalog number: 6031)
VIAFLO 384-well 5–125 μL pipette head (Integra, catalog number: 6132)
VOYAGER 12-channel 5–125 μL pipette (Integra, catalog number: 4732)
1300 Series Class II A2 biological safety cabinet (Thermo Scientific, catalog number: 1323TS)
Software
Harmony software (4.9, 2019)
Prism v9.3 (GraphPad, 11/15/2021)
Microsoft office suite
Procedure
Procedure overview
Note: AOPI staining in the drug treatment wells as well as in the quality control wells would allow direct determination of cell death; however, the method described herein uses the more cost-efficient CyQUANT stain in the drug treatment wells to keep the assay costs down.
Drug response of primary human leukemia cells is evaluated using a co-culture system and a fluorescence imaging–based assay, building on a previously published assay (Boutter et al., 2014) with adaptations as described herein. hTERT immortalized MSCs are first seeded in a 384-well plate. After 24 h, leukemia cells are added to the stromal cell layer in AIM-V medium at a ratio of 1:10 MSCs to leukemia cells, along with a drug solution prepared in the same medium at six drug concentrations in duplicate. After a 96-hour incubation, images are acquired with a 20× objective, and the total number of live leukemia cells is evaluated. The leukemia cells and MSCs are analyzed in the same fluorescence channel based on the size and intensity of the nuclei. Drug-induced inhibition at each concentration is estimated by comparing to leukemia cells treated with the vehicle alone. The drug concentration that kills 50% of the leukemia cells (LC50) is determined using a dose-response model and is used as a measurement of drug sensitivity. Quality control is performed to remove cases with low viability (defined as less than 500 viable blast cells in each well in the absence of drugs on day 4).
Study approval
This study was approved by the respective institutional review boards at St. Jude Children’s Research Hospital, MD Anderson Cancer Center, and University of Chicago, and written informed consent was obtained from parents, guardians, and/or patients, as appropriate, before enrollment, in accordance with the Declaration of Helsinki.
Items to prepare in advance
To help with the following procedure, it is advised to prepare MSC medium and cell medium before starting. It is also recommended to prepare drug stocks to the concentrations stated in Table 1 or other concentrations desired.
MSC cell culture procedure
Grow and expand the MSC cells. MSC cells are cultured in MSC medium as described in Recipes.
Store MSC cells in incubator at 37 °C.
Twenty-four hours before receipt of a fresh primary sample, prepare MSC plate as below.
Remove a 10 cm dish of MSC from the incubator. Aspirate old medium.
Add 5 mL of PBS to the MSC dish. Rinse the monolayer by gently rocking the dish.
Aspirate all PBS from dish.
Slowly add 1 mL of trypsin-EDTA to the dish. Spread evenly by gently rocking the dish.
Incubate dish for 3 min in incubator (37 °C) until cells release from plate.
Microscopically verify that cells have released from the plate. Cells should be rounded and move when the dish is gently tapped.
Add 9 mL of MSC medium to the dish. Resuspend cells and medium 3–5 times, then transfer the suspension to a 15 mL (or 50 mL) Falcon tube.
Centrifuge at 300× g for 5 min at 4 °C.
While cells are spinning, prepare a 384-well plate by adding 50 μL of PBS per well to outside border wells.
Remove cells from centrifuge and aspirate the supernatant.
Resuspend cells in 5–10 mL of MSC medium.
Aliquot 10 μL of cells and count cells using an automated cell counter.
Calculate volume of MSC medium needed to dilute to a 1 × 10⁵ cells/mL cell density.
Add appropriate volume of MSC medium to the Falcon tube containing cells.
Transfer 25 μL of the MSC suspension per well (= 2.5 × 10³ cells/well) using a multichannel pipette.
Place plate in incubator and incubate overnight (37 °C, 5% CO2).
Notes before starting
AIM-V media that will be used for MSC plate washing and sample preparation should be warmed to 37 °C prior to use.
Primary sample procedure
Note: This method is for fresh cells processed within 24 h of collection. If the sample will not be plated on day of collection, keep cells rotating at 4 °C until ready to do so.
Leukemia blasts are obtained from either bone marrow or peripheral blood samples after undergoing Ficoll gradient centrifugation. The readers are referred to the Methods of the following references: Gocho et al. (2021), Lee et al. (2023).
To proceed to testing with the pharmacotyping assay, the sample must meet the following parameters: viability above 80%, red blood cell (RBC) contamination below 30%, and a blast percentage above 85%.
If the sample has more than 30% RBC contamination but above 85% blasts, the RBCs are removed from the sample through RBC depletion using an institutional procedure (see Supplemental Methods).
If the sample has a blast percentage of less than 85%, the sample is enriched for leukemia by using magnetic cell separation (Miltenyi Biotec) with a negative selection for leukemia cells using an institutional procedure (see Supplemental Methods).
Keep primary sample suspended in cell medium and rotating at 4 °C until ready to proceed.
Day 0 cell culture procedure
Note: While this protocol is designed for primary patient samples, it can be adapted for experiments with cell lines.
Prepare drug dilutions in AIM-V medium to achieve the final concentration ranges listed in Table 1.
Note: AIM-V media does not need to be warmed to 37 °C for drug plate preparation.
Remove the 384-well imaging plate containing MSCs from the incubator.
Aspirate the 25 μL of MSC medium from each well using the VIAFLO 384 automated pipette with a 384-channel head on a speed setting of 4 or lower to prevent MSC detachment.
Note: Automated pipettes are not required for aspiration steps described in this procedure; however, if done manually, make sure to remove media slowly and without touching the bottom of the well to prevent MSC removal.
Wash each well by adding 40 μL of AIM-V medium.
Centrifuge primary sample at 300× g for 5 min at 4 °C.
Aspirate cell medium of primary cells and flick pellet to resuspend cells.
Resuspend primary patient samples at 6.25 × 10⁵ cells/mL in AIM-V medium for plating in the 384-well MSC plate.
Aspirate the AIM-V medium from each well using the VIAFLO 384 automated pipette on a speed setting of 4 or lower.
Add 40 μL of AIM-V medium to the MSC-only control wells.
Add 40 μL of the cell suspension to every well except the MSC-only control wells.
Add 10 μL of the drug dilutions to the designated drug wells (Figure 1).
Figure 1. Example plate layoutAdd 10 μL of AIM-V medium to wells in Columns 2 and 3 in Figure 1.
Incubate the plate at 37 °C (5% CO2) for 96 h for primary patient samples.
Day 4 procedure
Note: Stain each plate individually so that incubation times are ~15 min, to reduce the chance of MSCs detaching from the plate; longer (> 1 h) incubation times are associated with detachment of MSCs, which may cause an experiment to fail.
Dilute CyQUANT Direct nucleic acid stain 1:26 and the CyQUANT Direct background suppressor 1:5.2 in PBS.
Note: Add the suppressor to the PBS first, because the nucleic acid stain will separate out of solution if added to PBS without the suppressor.
Add 5 μL of the CyQUANT staining solution to each well except AOPI control well.
Note: Verify visually that CyQuant was added to every well before moving to the next step. This can be done by checking the color of the well.
Add 50 μL of AOPI staining solution to the AOPI control well for viability analysis.
If desired, measure blast percentage of samples in Blast QC wells using Cytospin or institutional procedure.
Incubate the plate at 37 °C (5% CO2) for 15 min.
Critical step: Prolonged incubation with CyQuant can lead to cell apoptosis, which can influence the results of the assay.
The CyQUANT imaging procedure
Note: The imaging procedure described here applies specifically to the Operetta CLS; however, imaging can be performed with any imager that can acquire images in the green channel from a 384-well plate.
Remove imaging plate from incubator.
Spray a Kimwipe with 70% alcohol and wipe the bottom of the plate, as dust particles on the bottom of the plate may cause autofocusing errors during imaging.
Click the Eject button in Harmony software.
Properly position the plate in the plate holder of the imager.
Click the Load Plate button in the Harmony software.
Click the Setup tab in the Harmony software.
Click New in Experiment window to create a new experiment.
Use the following settings for the experiment:
Plate Type: 384 PerkinElmer CellCarrier Ultra
Autofocus: Two Peak (Default)
Objective: 20× Air, NA 0.4
Opt. Mode: Confocal
Binning: 2
In the Channel Selection window, add the Brightfield and CyQuant Green channels with the following settings:
Note: CyQuant Green may not be a pre-provided channel. To create the CyQuant Green channel, use wavelengths 460–490 for excitation and 500–550 for emission. Green Fluorescent Protein (eGFP) has similar excitation and emission wavelengths.
Brightfield:
i. Time = 20 ms
ii. Power = 60%
iii. Height = 8.0 μM
CyQuant Green:
i. Time = 60 ms
ii. Power = 100%
iii. Height = 8.0 μM
In the Navigation window, under the define layout tab, highlight all the wells that will be imaged and click Select. Within the Well window, highlight the nine inner squares, which correspond to the number and position of images being taken per well, and click Select. If the well/field of view has only been highlighted, it will be orange, but if it has been selected, it will be grey.
To take a snapshot: highlight one of the control wells and a single field of view. Then, within the Channel Selection window, click Snapshot in any of the channels to take one image to check if the leukemia cells are in focus. If cells are not in focus, change the heights for CyQuant Green and Brightfield channels until the cells are in focus (Figure 2).
Figure 2. Fluorescence imaging using a 20× objective of a primary patient leukemia sample overlaid with mesenchymal stromal cells (MSCs) stained with CyQUANT Green. White arrows indicate MSCs, and red arrows indicate leukemia cells.Save the experiment.
Note: Once experiments have been saved, they can be reused by clicking the “…” icon to the right of the experiment name.
Click the Run Experiment tab in the Harmony software.
Fill out Plate Name with desired file name as this is what the measurement will be titled.
Click Start to run measurement.
AOPI imaging procedure
Click the Setup tab in the Harmony software.
Click New in experiment window to create a new experiment.
Use the following settings for the experiment:
Plate type: 384 PerkinElmer CellCarrier Ultra
Autofocus: Two Peak (Default)
Objective: 20× Air, NA 0.4
Opt. Mode: Confocal
Binning: 2
In the Channel Selection window, add the Acridine Orange, Propidium iodide, and Brightfield channels with the following settings:
AO:
i. Time = 40 ms
ii. Power = 80%
iii. Height = 8.0 μM
PI:
i. Time = 20 ms
ii. Power = 60%
iii. Height = 8.0 μM
Brightfield
i. Time = 20 ms
ii. Power = 60%
iii. Height = 8.0 μM
In the Navigation window, under the Define Layout tab, highlight all the wells that will be imaged and click Select. Within the Well window, highlight the nine inner squares, which correspond to the number and position of images being taken per well, and click Select. If the well/field of view has only been highlighted, it will be orange, but if it has been selected, it will be grey.
To take a snapshot: highlight one of the control wells and a single field of view. Then, within the Channel Selection window, click Snapshot in any of the channels to take one image to check if the leukemia cells are in focus. If cells are not in focus, change the heights for AO, PI, and Brightfield channels until the cells are in focus (Figure 3).
Figure 3. Overlay of primary patient leukemia cells and mesenchymal stromal cells (MSCs) stained with acridine orange/propidium iodide (AO/PI) for calculating percent cell viability. White arrows indicate MSCs, red arrows indicate dying leukemia cells, and yellow arrows indicate live leukemia cells.Save the experiment.
Click the Run Experiment tab in the Harmony software.
Fill out Plate Name with desired file name as this is what the measurement will be titled.
Click Start to run measurement.
Data analysis
Data evaluation
The Harmony software for the PerkinElmer Operetta CLSTM high-content analysis system is used for the data analysis of the primary samples. The analysis pipeline distinguishes viable leukemia nuclei from MSC nuclei by setting nuclei area and CyQUANT fluorescence intensity cutoffs. The pipeline identifies and draws an outline of the nuclei in an image. Any nuclei that touch the border of the image are removed. Next, the CyQUANT intensity and area of the nuclei are measured. Manually select the viable leukemia nuclei with intensity values above 2,000 and an area less than 70 μm2 (Figure 4) (Note: Intensity cutoff values and/or area cutoff values may be adjusted for individual samples). Nine fields of view per well at a 20× magnification are evaluated for both the control and drug treatment wells. The data output is the number of viable leukemia cells per well. This output is copied into a Microsoft Excel analysis template, in which calculations are made for the relative viabilities of each drug treatment in comparison to the average of the untreated control wells.
Figure 4. Representative scatter plot of an analysis pipeline. Perpendicular lines represent cutoffs for nuclei size and nuclei intensity. Green dots indicate cells gated as leukemia cells and red dots indicate cells gated as mesenchymal stromal cells (MSCs).
Data analysis procedure for CyQUANT
Note: Attach an assay layout to the measurement you are analyzing before starting data analysis.
Create an assay layout by clicking the Settings button in the Harmony software and then select the Assay Layout Editor.
Complete the Compound, Concentration, Cell Type, and Cell Count entries that match your experiment plate layout.
Save the assay layout.
Attach assay layout to desired experiment.
Click the Image Analysis tab in the Harmony software.
Click the button to the right of Analysis and load the analysis pipeline you would like to use or, if setting up a new pipeline, press the New button under Measurement.
For setting a new pipeline:
Press the “+” button at the bottom of the tab to add a building block to your pipeline.
Click Find Nuclei.
Under Find Nuclei, select the channel you would like to use and the method that best labels the cells in your image.
Label the output population as Nuclei.
Press the “+” button again and click Select Population.
Select the Remove Border Object box and use these settings:
i. Population = Nuclei
ii. Method = Common Filters
iii. Output Population = Nuclei NB
Press the “+” button again and click calculate intensity properties.
Use these settings:
i. Channel = CyQuant Green
ii. Population = Nuclei NB
iii. Region = Nucleus
iv. Method = Standard
v. Property Prefix = Intensity Nucleus NB
Press the “+” button again and click calculate morphology properties, select all boxes, and use these settings:
i. Population = Nuclei NB
ii. Region = Nucleus
iii. Method = Standard
iv. Property Prefix = Nucleus NB
Press the “+” button again, click select population, and use these settings:
i. Population = Nuclei NB
ii. Method = Filter by Property
iii. Intensity Nucleus NB Mean > 2,000
iv. Nucleus NB Area [μm2] < 70
v. Output Population = Nuclei NB Leukemia Viable
Press the “+” button again, click select population, and use these settings:
i. Population = Nuclei NB
ii. Method = Filter by Property
iii. Nucleus NB ≥ 75
iv. Output population = Nuclei NB MSC
Press the “+” button again, click define results, and use these settings:
i. Under Population: Nuclei NB Leukemia Viable select the number of objects box
ii. Apply to All = Individual selection
iii. Intensity Nucleus = Mean
iv. Intensity Area [μm2] = Mean
v. Under Population: Nuclei NB MSC select the number of objects box
vi. Apply to all = Individual selection
vii. Intensity Nucleus = Mean
Click the save button and name the pipeline accordingly.
Click the Evaluation tab in the Harmony software.
Check that you have the correct analysis pipeline and measurement files.
Select all the wells and fields of view that you want to analyze.
Click the Start button to analyze the plate.
Data analysis procedure for AOPI
Verify that the correct assay layout is attached to your plate.
Click the Image Analysis tab in the Harmony software.
Click the button to the right of Analysis and load the analysis pipeline you would like to use or, if setting up a new pipeline, press the new button under measurement.
For setting a new pipeline:
Press the “+” button at the bottom of the tab to add a building block to your pipeline.
Click Find Nuclei.
Under Find Nuclei, select the channel you would like to use and the method that best labels the cells in your image.
Label the output population as AO Nuclei.
Press the “+” button again and click select population.
Select the remove border object box and use these settings:
i. Population = AO Nuclei
ii. Method = Common Filters
iii. Output Population = AO Nuclei NB
Press the “+” button again and click calculate intensity properties.
Use these settings:
i. Channel = Brightfield
ii. Population = AO Nuclei NB
iii. Region = Nucleus
iv. Method = Standard
v. Property Prefix = AO Intensity
Press the “+” button again and click calculate morphology properties, select area box, and use these settings:
i. Population = AO Nuclei NB
ii. Region = Nucleus
iii. Method = Standard
iv. Property Prefix = AO Nucleus
Press the “+” button again, click select population, and use these settings:
i. Population = AO Nuclei NB
ii. Method = Filter by Property
iii. AO Intensity Mean > 200
iv. AO Intensity Mean < 100
v. Output Population = AO Viable Nuclei
Press the “+” button again, click find nuclei, and use these settings:
i. Channel = Brightfield
ii. ROI = None
iii. Method = C
iv. Output population – PI Nuclei
Press the “+” button again, click select population, and use these settings:
i. Population = PI Nuclei
ii. Method = Common Filters
iii. Click the remove border object box
iv. Output population = PI Nuclei NB
Press the “+” button again and click calculate intensity properties.
Use these settings:
i. Channel = Propidium Iodide
ii. Population = PI Nuclei NB
iii. Region = Nucleus
iv. Method = Standard
v. Property Prefix = PI Intensity
Press the “+” button again and click calculate morphology properties, select the area box, and use these settings:
i. Population = PI Nuclei NB
ii. Region = Nucleus
iii. Method = Standard
iv. Property Prefix = PI Nucleus
Press the “+” button again, click select population, and use these settings:
i. Population = PI Nuclei NB
ii. Method = Filter by Property
iii. PI Intensity Mean > 1,000
iv. PI Nucleus Area [μm2] < 100
v. Output Population = PI Dead Nuclei
Press the “+” button again, click define results, and use these settings:
i. Under Population: AO Viable Nuclei select the number of objects box
ii. Apply to All = Individual selection
iii. AO Intensity = Mean
iv. AO Nucleus Area [μm2] = Mean
v. Under Population: PI Dead Nuclei select the number of objects box
vi. Apply to all = Individual selection
vii. PI Intensity = Mean
viii. Method = Formula Output
ix. Formula = [a/(a+b)]*100
x. Variable a = AO Viable Nuclei – Number of Objects
xi. Variable b = PI Dead Nuclei – Number of Objects
xii. Output name = Viability %
Click the save button and name the pipeline accordingly.
Click the Evaluation tab in the Harmony software.
Check that you have the correct analysis pipeline and measurement files.
Select all the wells and fields of view that you want to analyze.
Click the Start button to analyze the plate.
Data evaluation
Click the Evaluation tab in the Harmony software.
Load the correct evaluation using the button next to the Evaluation line.
The evaluation results will populate in the middle of the screen.
Data from the CyQuant Green wells will populate as number of viable leukemia cells per well.
Data from the AOPI well will populate as Viability % per well and can be used as an internal control for the sample.
Copy data into a Microsoft Excel analysis template to calculate the relative viabilities of each drug treatment compared to the average of the untreated control wells. Dose response curves are generated from the raw data using software of choice.
Validation of protocol
Our group has measured and reported ex vivo drug sensitivity of eight drugs used in the current method (i.e., L-asparaginase, daunorubicin, bortezomib, mercaptopurine, nelarabine, prednisolone, vincristine, and vorinostat) via an MTT-based method as previously described (Holleman et al., 2004; Lugthart et al., 2005; Autry et al., 2020). Likewise, our group has measured and reported ex vivo drug sensitivity of eight drugs used in the current method (i.e., CHZ868, dasatinib, gilteritinib, ibrutinib, inotuzumab ozogamicin, palbociclib, trametinib, and venetoclax) via a flow cytometry–based method as previously described (Gocho et al., 2021; Lee et al., 2023). To validate the current imaging-based method for these 16 drugs, a minimum of 15 patient samples (either primary or obtained from patient-derived xenograft models) were studied in parallel by the current imaging assay and either the MTT-based or flow cytometry–based method (Figure 5). Cell viability was calculated using each method. For each individual concentration data point, percent cell viability was charted and R2 values were generated. Correlation of the cell viability results was reproducibly achieved, with all R2 values above 0.5 (except for two drugs: 6-mercaptopurine, which has historically been tested via an MTT-based method, for which the observed R2 value was 0.4780, and CHZ868, which has historically been tested via a flow cytometry–based method, for which the observed R2 value was 0.4412).
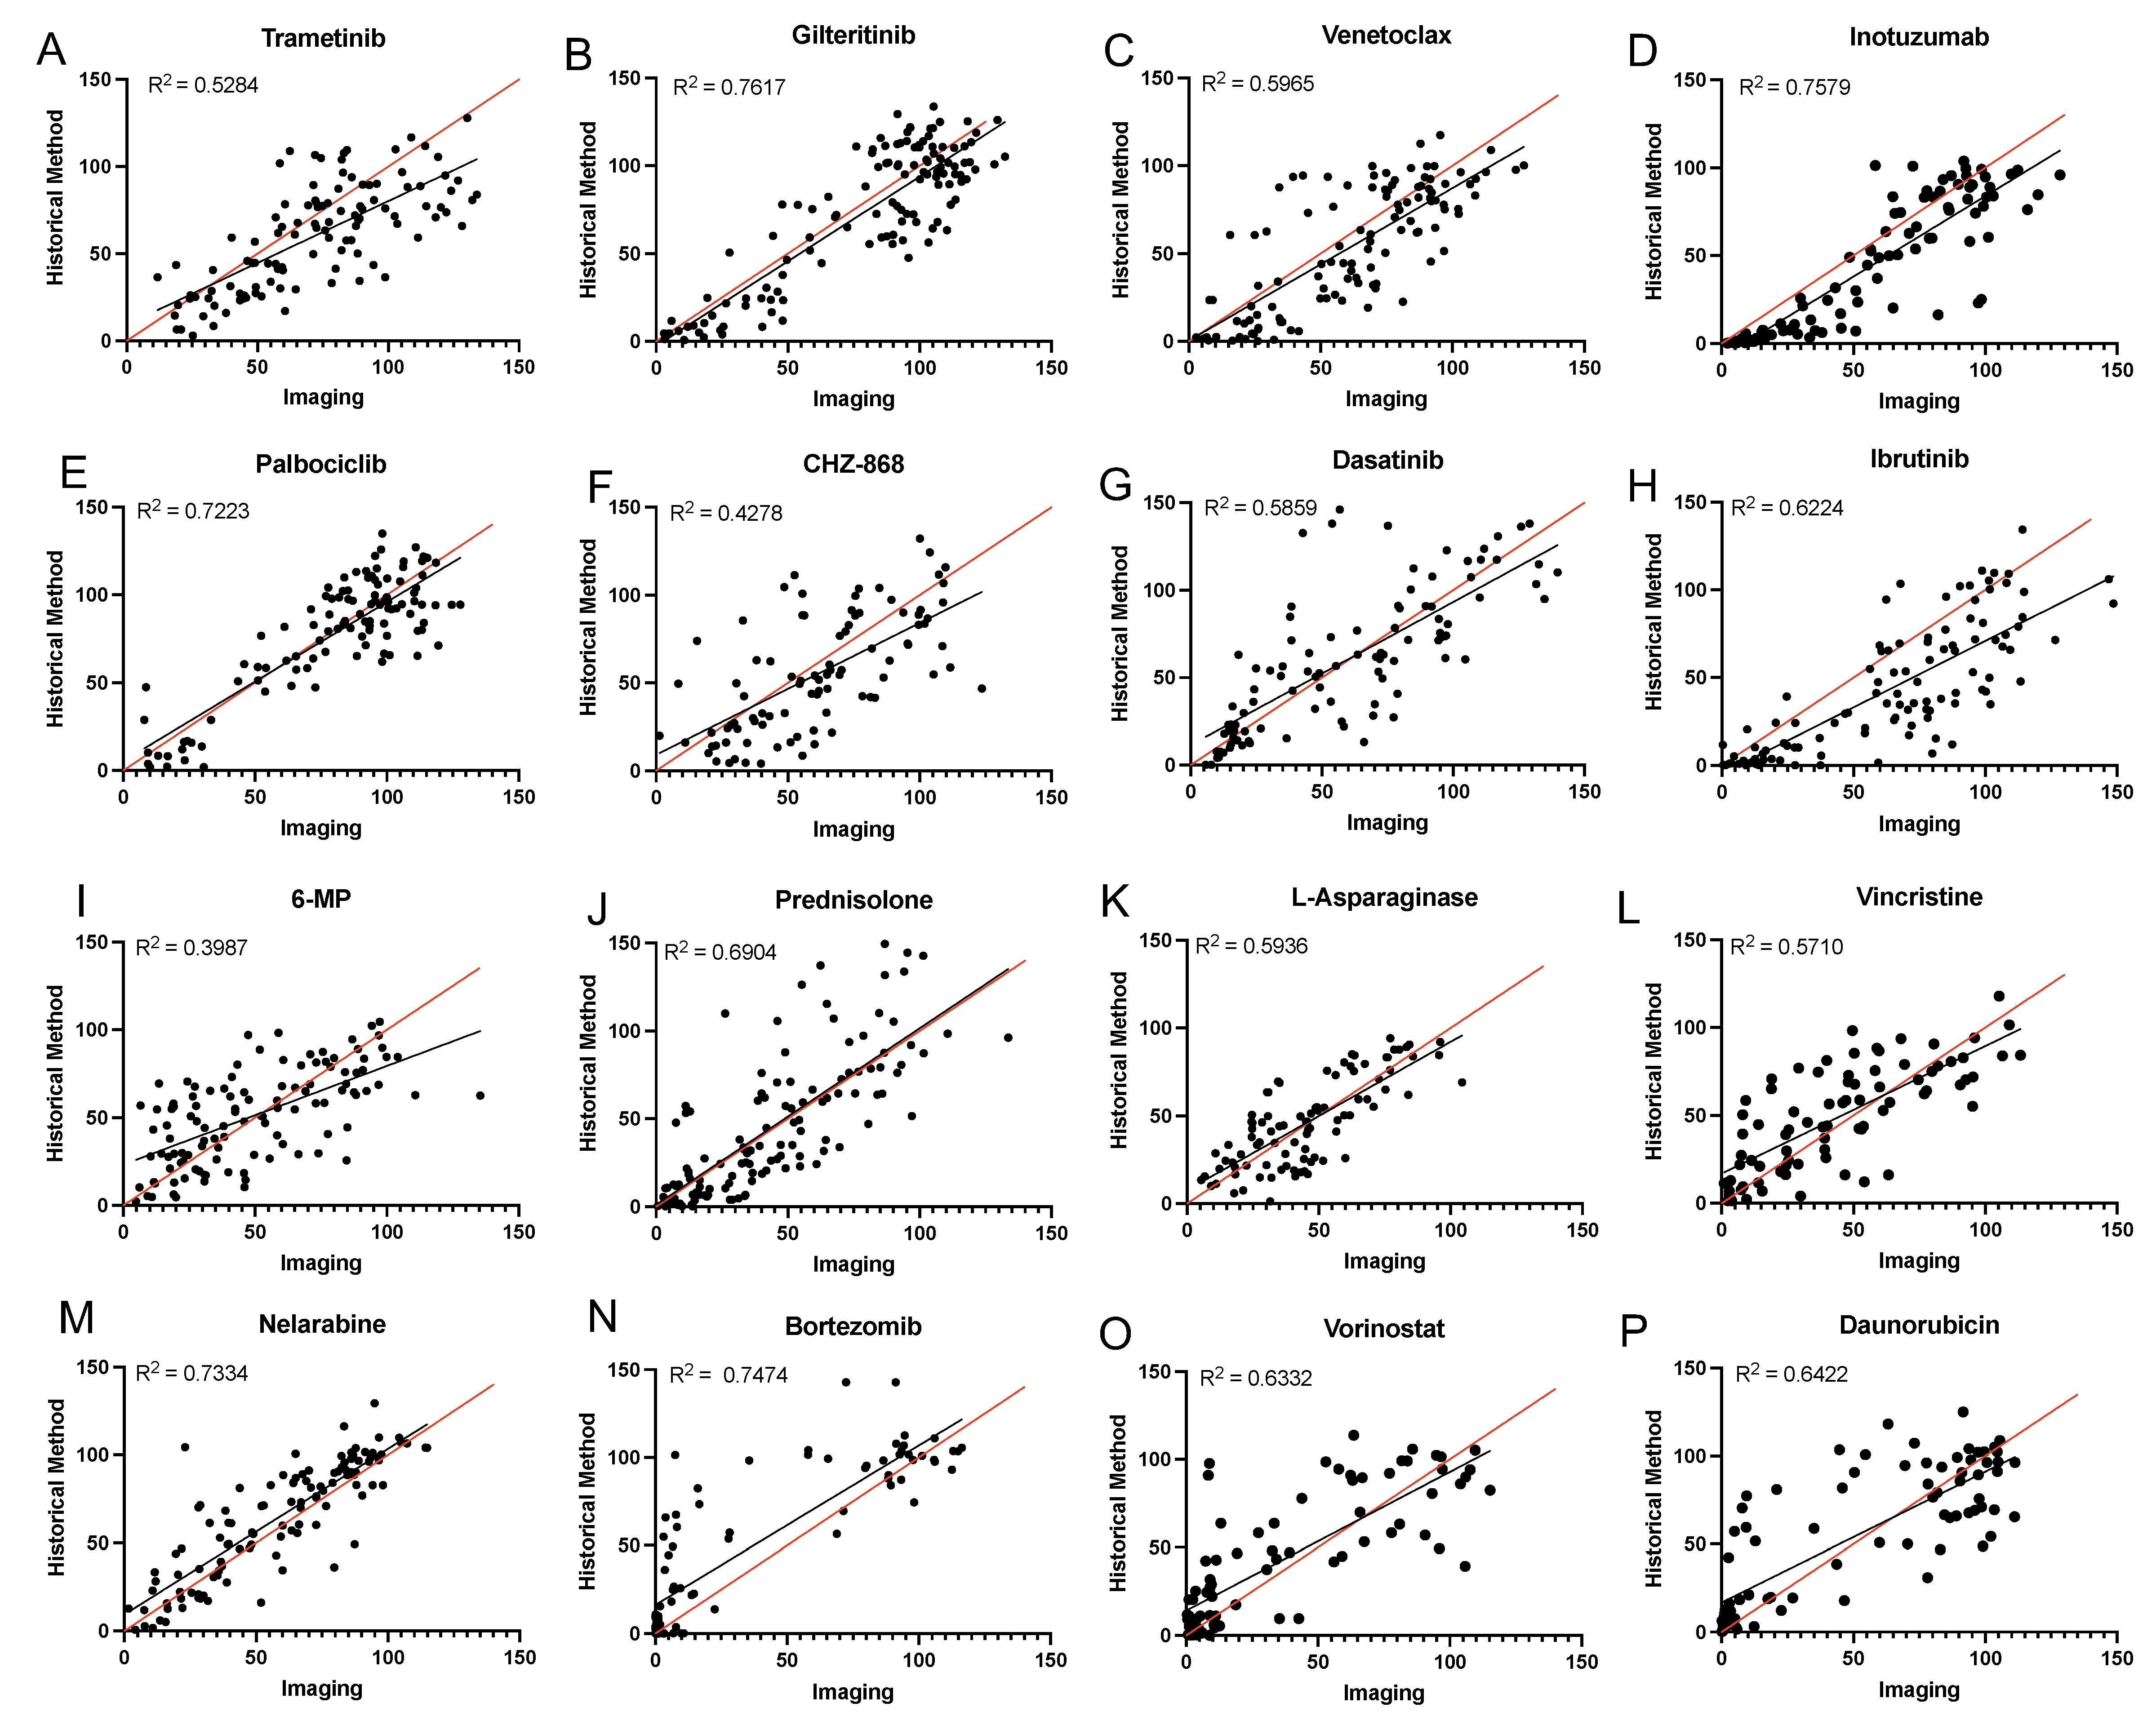
Figure 5. Comparison of imaging assay with previous methods. (A–H) Correlation plots showing the correlation between the imaging method and the gold standard flow cytometry–based mesenchymal stromal cell (MSC) co-culture method. (I–P) Correlation plots showing the correlation between the imaging method and the gold standard MTT-based metabolic activity method. Leukemia cells were treated for 96 h in the presence of increasing concentrations of each agent and cell viability was determined. For each individual plot, viability determined by the current imaging assay is shown on the x-axis, and viability determined by the gold-standard assay method is shown on the y-axis.
In addition to the 16 drugs for which we already had a validated method established, we introduced ex vivo sensitivity testing of an additional 24 drugs with the current imaging-based method. We determined drug sensitivity of MSCs alone to each single agent after a 96-hour incubation for all 40 drugs used with the proposed assay (Figure S1). Optimal concentration ranges were chosen based on clinically achievable concentrations in vivo and on the frequency distribution of LC50 values for each drug.
We measured ex vivo drug sensitivity to our drug panel of 40 antineoplastic agents with the current imaging-based method in 30 primary adult and pediatric ALL samples. Samples were assayed as received and reflect the variability of the population to be studied with this method. We observed varying patterns of drug sensitivity across patients (Figure 6). Leukemia cells with certain molecular markers had a high probability of showing a predictable sensitivity pattern (e.g., samples positive for the ETV6::RUNX1 fusion are usually sensitive to asparaginase; samples positive for the TCF3::PBX1 fusion are usually sensitive to dasatinib) (Frismantas et al., 2017; Lee et al., 2023). In this pilot dataset, we observed a lower median asparaginase LC50 value in cases with the ETV6::RUNX1 fusion (n = 4) vs. other cases (p = 0.02; Figure 6B), and a lower median dasatinib LC50 value in cases with the TCF3::PBX1 fusion (n = 3) vs. other cases (p = 0.009; Figure 6C).
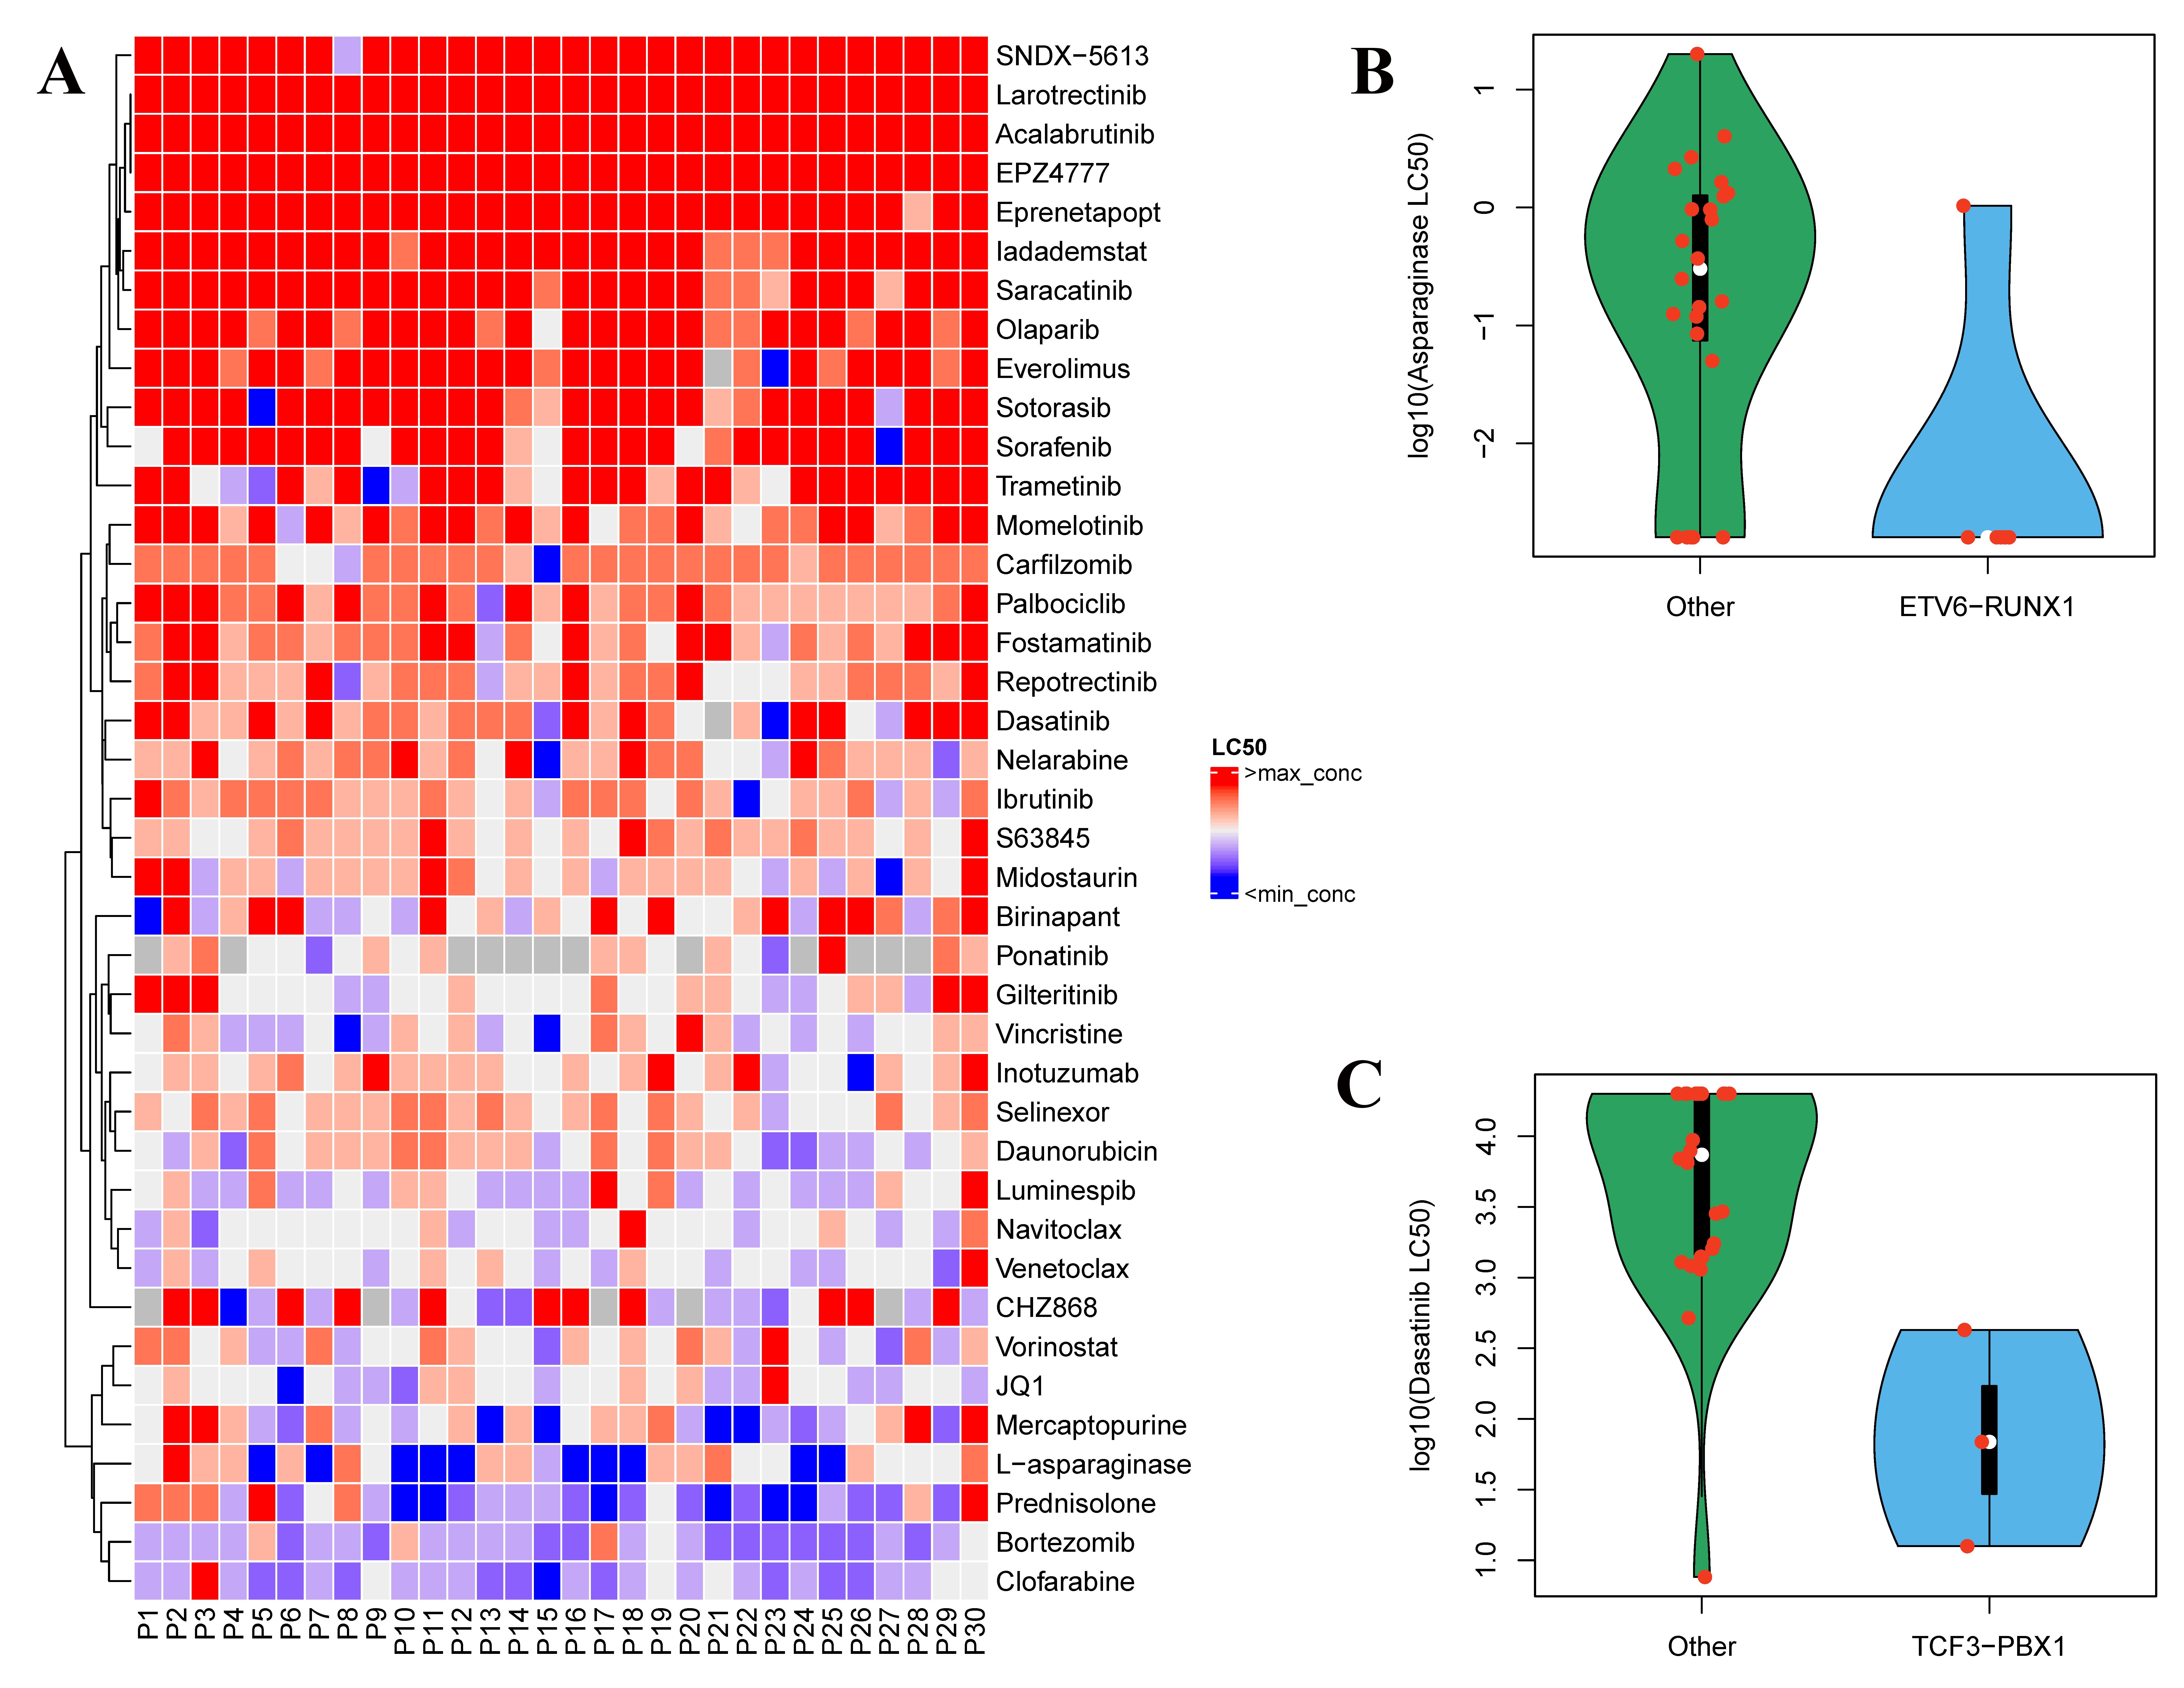
Figure 6. Validation of imaging assay with primary patient samples. (A) Heatmap indicates the sensitivity of 30 primary leukemia samples to 40 anti-leukemia agents. LC50 values for each drug were ranked, with red indicating most resistant cases and violet indicating most sensitive cases. Grey squares indicate no data. (B) LC50 values of asparaginase in 30 primary ALL cases displayed as cases with the ETV6::RUNX1 fusion (n = 4) vs. other cases (n = 26). Median LC50 value for each group is shown as a white circle (p = 0.02 by Wilcoxon rank-sum test). (C) LC50 values of dasatinib in 30 primary ALL cases displayed as cases with the TCF3::PBX1 fusion (n = 3) vs. other cases (n = 27). Median LC50 value for each group is shown as a white circle (p = 0.009 by Wilcoxon rank-sum test). LC50, the concentration required to kill 50% of cells.
General limitations and potential problems
This protocol has potential limitations. This method is designed for analyzing fresh primary samples, one at a time. If a laboratory adopting this protocol cannot receive fresh primary samples, adjustments would potentially need to be made to the method. The imager used in this protocol may not be easily acquired by every institute. While this protocol may be adapted for other high-throughput imaging platforms, this adaptation would need to be validated beforehand. The ability to separate two cell populations is essential and is not exclusive to the imaging platform. There are options for free open-source image analysis software that could be used to analyze images taken from other platforms, which have the ability to perform batch analysis.
Due to the heterogeneity of primary samples, occasionally, samples may contain visible clumps upon receipt. If this occurs, samples can be strained using a 40 μm cell strainer to remove cell clumps before processing. Finally, due to the amount of manual pipetting, either with a single-channel or multichannel pipette, there is potential for variability among samples, and great care needs to be taken to minimize error.
Acknowledgments
This work was supported by the American Lebanese Syrian Associated Charities; NIH grants P30 CA021765 (SJCRH Cancer Center Support Grant) and P50 GM115279 (to MVR, CGM, WEE, and JJY); and Hyundai Hope on Wheels (to SEK). The content is solely the responsibility of the authors and does not necessarily represent the official views of the National Institutes of Health. CGM is the William E. Evans Endowed Chair and JJY is the Endowed Chair of Pharmacogenomics at SJCRH.
Competing interests
All authors declare no competing interests.
References
- Autry, R. J., Paugh, S. W., Carter, R., Shi, L., Liu, J., Ferguson, D. C., Lau, C. E., Bonten, E. J., Yang, W., McCorkle, J. R., et al. (2020). Integrative genomic analyses reveal mechanisms of glucocorticoid resistance in acute lymphoblastic leukemia. Nat Cancer 1(3): 329-344.
- Boutter, J., Huang, Y., Marovca, B., Vonderheit, A., Grotzer, M. A., Eckert, C., Cario, G., Wollscheid, B., Horvath, P., Bornhauser, B. C., et al. (2014). Image-based RNA interference screening reveals an individual dependence of acute lymphoblastic leukemia on stromal cysteine support. Oncotarget 5(22): 11501-11512.
- Brady, S. W., Roberts, K. G., Gu, Z., Shi, L., Pounds, S., Pei, D., Cheng, C., Dai, Y., Devidas, M., Qu, C., et al. (2022). The genomic landscape of pediatric acute lymphoblastic leukemia. Nat Genet 54(9): 1376-1389.
- Carroll, W. L., Bhojwani, D., Min, D. J., Raetz, E., Relling, M., Davies, S., Downing, J. R., Willman, C. L. and Reed, J. C. (2003). Pediatric acute lymphoblastic leukemia. Hematology Am Soc Hematol Educ Program: 102-131.
- Foà, R., Vitale, A., Vignetti, M., Meloni, G., Guarini, A., De Propris, M. S., Elia, L., Paoloni, F., Fazi, P., Cimino, G., et al. (2011). Dasatinib as first-line treatment for adult patients with Philadelphia chromosome–positive acute lymphoblastic leukemia. Blood 118(25): 6521-6528.
- Frismantas, V., Dobay, M. P., Rinaldi, A., Tchinda, J., Dunn, S. H., Kunz, J., Richter-Pechanska, P., Marovca, B., Pail, O., Jenni, S., et al. (2017). Ex vivo drug response profiling detects recurrent sensitivity patterns in drug-resistant acute lymphoblastic leukemia. Blood 129(11): e26-e37.
- Gocho, Y., Liu, J., Hu, J., Yang, W., Dharia, N. V., Zhang, J., Shi, H., Du, G., John, A., Lin, T. N., et al. (2021). Network-based systems pharmacology reveals heterogeneity in LCK and BCL2 signaling and therapeutic sensitivity of T-cell acute lymphoblastic leukemia. Nat Cancer 2(3): 284-299.
- Holleman, A., Cheok, M. H., Den Boer, M. L., Yang, W., Veerman, A. J., Kazemier, K. M., Pei, D., Cheng, C., Pui, C. H., Relling, M. V., et al. (2004). Gene-expression patterns in drug-resistant acute lymphoblastic leukemia cells and response to treatment. N Engl J Med 351(6): 533-542.
- Inaba, H. and Mullighan, C. G. (2020). Pediatric acute lymphoblastic leukemia. Haematologica 105(11): 2524-2539.
- Inaba, H. and Pui, C. H. (2021). Advances in the Diagnosis and Treatment of Pediatric Acute Lymphoblastic Leukemia. J Clin Med 10(9): 1926.
- Irving, J., Matheson, E., Minto, L., Blair, H., Case, M., Halsey, C., Swidenbank, I., Ponthan, F., Kirschner-Schwabe, R., Groeneveld-Krentz, S., et al. (2014). Ras pathway mutations are prevalent in relapsed childhood acute lymphoblastic leukemia and confer sensitivity to MEK inhibition. Blood 124:(23): 3420-3430.
- Karrman, K. and Johansson, B. (2017). Pediatric T-cell acute lymphoblastic leukemia. Genes Chromosomes Cancer 56(2): 89-116.
- Khaw, S. L., Suryani, S., Evans, K., Richmond, J., Robbins, A., Kurmasheva, R. T., Billups, C. A., Erickson, S. W., Guo, Y., Houghton, P. J., et al. (2016). Venetoclax responses of pediatric ALL xenografts reveal sensitivity of MLL-rearranged leukemia. Blood 128(10): 1382-95.
- Kornauth, C., Pemovska, T., Vladimer, G. I., Bayer, G., Bergmann, M., Eder, S., Eichner, R., Erl, M., Esterbauer, H., Exner, R., et al. (2022). Functional Precision Medicine Provides Clinical Benefit in Advanced Aggressive Hematologic Cancers and Identifies Exceptional Responders. Cancer Discov 12(2): 372-387.
- Laukkanen, S., Veloso, A., Yan, C., Oksa, L., Alpert, E. J., Do, D., Hyvärinen, N., Mccarthy, K., Adhikari, A., Yang, Q., et al. (2022). Therapeutic targeting of LCK tyrosine kinase and mTOR signaling in T-cell acute lymphoblastic leukemia. Blood 140(17): 1891-1906.
- Lee, S. H. R., Yang, W., Gocho, Y., John, A., Rowland, L., Smart, B., Williams, H., Maxwell, D., Hunt, J., Yang, W., et al. (2023). Pharmacotypes across the genomic landscape of pediatric acute lymphoblastic leukemia and impact on treatment response. Nat Med 29(1): 170-179.
- Lugthart, S., Cheok, M. H., Den Boer, M. L., Yang, W., Holleman, A., Cheng, C., Pui, C. H., Relling, M. V., Janka-Schaub, G. E., Pieters, R., et al. (2005). Identification of genes associated with chemotherapy crossresistance and treatment response in childhood acute lymphoblastic leukemia. Cancer Cell 7(4): 375-386.
- Meyer, J. A., Wang, J., Hogan, L. E., Yang, J. J., Dandekar, S., Patel, J. P., Tang, Z., Zumbo, P., Li, S., Zavadil, J., et al. (2013). Relapse-specific mutations in NT5C2 in childhood acute lymphoblastic leukemia. Nat Genet 45(3): 290-294.
- Paugh, S. W., Bonten, E. J., Savic, D., Ramsey, L. B., Thierfelder, W. E., Gurung, P., Malireddi, R. K., Actis, M., Mayasundari, A., Min, J., et al. (2015). NALP3 inflammasome upregulation and CASP1 cleavage of the glucocorticoid receptor cause glucocorticoid resistance in leukemia cells. Nat Genet 47(6): 607-614.
- Pieters, R., Kaspers, G. J., Van Wering, E. R., Huismans, D. R., Loonen, A. H., Hahlen, K. and Veerman, A. J. (1993). Cellular drug resistance profiles that might explain the prognostic value of immunophenotype and age in childhood acute lymphoblastic leukemia. Leukemia 7(3): 392-397.
- Pieters, R., Schrappe, M., De Lorenzo, P., Hann, I., De Rossi, G., Felice, M., Hovi, L., Leblanc, T., Szczepanski, T., Ferster, A., et al. (2007). A treatment protocol for infants younger than 1 year with acute lymphoblastic leukaemia (Interfant-99): an observational study and a multicentre randomised trial. Lancet 370(9583): 240-250.
- Pocock, R., Farah, N., Richardson, S. E. and Mansour, M. R. (2021). Current and emerging therapeutic approaches for T-cell acute lymphoblastic leukaemia. Br J Haematol 194(1): 28-43.
- Pui, C. H., Mullighan, C. G., Evans, W. E. and Relling, M. V. (2012). Pediatric acute lymphoblastic leukemia: where are we going and how do we get there? Blood 120(6): 1165-1174.
- Pui, C. H., Nichols, K. E. and Yang, J. J. (2019). Somatic and germline genomics in paediatric acute lymphoblastic leukaemia. Nat Rev Clin Oncol 16(4): 227-240.
- Ramakers-Van Woerden, N. L., Beverloo, H. B., Veerman, A. J., Camitta, B. M., Loonen, A. H., Van Wering, E. R., Slater, R. M., Harbott, J., Den Boer, M. L., Ludwig, W. D., et al. (2004). In vitro drug-resistance profile in infant acute lymphoblastic leukemia in relation to age, MLL rearrangements and immunophenotype. Leukemia 18(3): 521-529.
- Ramakers-Van Woerden, N. L., Pieters, R., Hoelzer, D., Slater, R. M., Den Boer, M. L., Loonen, A. H., Harbott, J., Janka-Schaub, G. E., Ludwig, W. D., Ossenkoppele, G. J., et al. (2002). In vitro drug resistance profile of Philadelphia positive acute lymphoblastic leukemia is heterogeneous and related to age: a report of the Dutch and German Leukemia Study Groups. Med Pediatr Oncol 38(6): 379-386.
- Wudhikarn, K., King, A. C., Geyer, M. B., Roshal, M., Bernal, Y., Gyurkocza, B., Perales, M.-A. and Park, J. H. (2022). Outcomes of relapsed B-cell acute lymphoblastic leukemia after sequential treatment with blinatumomab and inotuzumab. Blood Adv 6(5): 1432-1443.
Supplementary information
The following supporting information can be downloaded here:
- Supplemental Methods
- Figure S1. MSC Drug Sensitivity Curves for the 40 Therapeutic Agents Tested
Article Information
Copyright
© 2023 The Author(s); This is an open access article under the CC BY-NC license (https://creativecommons.org/licenses/by-nc/4.0/).
How to cite
Rowland, L., Smart, B., Brown, A., Dettorre, G. M., Gocho, Y., Hunt, J., Yang, W., Yoshimura, S., Reyes, N., Du, G., John, A., Maxwell, D., Stock, W., Kornblau, S., Relling, M. V., Inaba, H., Pui, C. H., Bourquin, J. P., Karol, S. E., Mullighan, C. G., Evans, W. E., Yang, J. J. and Crews, K. R. (2023). Ex vivo Drug Sensitivity Imaging-based Platform for Primary Acute Lymphoblastic Leukemia Cells. Bio-protocol 13(15): e4731. DOI: 10.21769/BioProtoc.4731.
Category
Cancer Biology > General technique > Cancer therapy
Medicine > Leukemia > Drug sensitivity testing
Do you have any questions about this protocol?
Post your question to gather feedback from the community. We will also invite the authors of this article to respond.