- Protocols

- Articles and Issues
- For Authors
- About
- Become a Reviewer

Triplet-primed PCR and Melting Curve Analysis for Rapid Molecular Screening of Spinocerebellar Ataxia Types 1, 2, and 3
Published: Vol 13, Iss 12, Jun 20, 2023 DOI: 10.21769/BioProtoc.4704 Views: 1283
Reviewed by: Alessandro DidonnaEsteban Paredes-OssesNeha NandwaniAnonymous reviewer(s)
Original research article
The authors used this protocol in:

May 2021
Advertisement


Protocol Collections
Comprehensive collections of detailed, peer-reviewed protocols focusing on specific topics


Abstract
There are more than 40 types of spinocerebellar ataxia (SCA), most of which are caused by abnormal expansion of short tandem repeats at various gene loci. These phenotypically similar disorders require molecular testing at multiple loci by fluorescent PCR and capillary electrophoresis to identify the causative repeat expansion. We describe a simple strategy to screen for the more common SCA1, SCA2, and SCA3 by rapidly detecting the abnormal CAG repeat expansion at the ATXN1, ATXN2, and ATXN3 loci using melting curve analysis of triplet-primed PCR products. Each of the three separate assays employs a plasmid DNA carrying a known repeat size to generate a threshold melt peak temperature, which effectively distinguishes expansion-positive samples from those without a repeat expansion. Samples that are screened positive based on their melt peak profiles are subjected to capillary electrophoresis for repeat sizing and genotype confirmation. These screening assays are robust and provide accurate detection of the repeat expansion while eliminating the need for fluorescent PCR and capillary electrophoresis for every sample.
Keywords: Spinocerebellar ataxiaBackground
The autosomal dominantly inherited spinocerebellar ataxias (SCAs) are neurodegenerative diseases that mainly cause progressive degeneration of the cerebellum and, sometimes, the spinal cord (Klockgether et al., 2019). There are more than 40 types of SCA, which can be caused by deletions, missense variants, and repeat expansion in different genes (Klockgether et al., 2019). The SCAs have an average prevalence of 2.7/100,000 globally, with SCA3 being the most common, followed by SCA2, SCA6, and SCA1 (Hersheson et al., 2012; Ruano et al., 2014). SCA1, SCA2, and SCA3 are caused by large abnormal CAG trinucleotide repeat expansions in ATXN1, ATXN2, and ATXN3 genes, respectively (Chung et al., 1993; Orr et al., 1993; Kawaguchi et al., 1994; Pulst et al., 1996).
Molecular genetic testing is necessary to identify the causative gene underlying the SCA. Detection of repeat expansions in SCA1, SCA2, and SCA3 has been accomplished using standard PCR or triplet-primed PCR (TP-PCR), followed by capillary electrophoresis (Dorschner et al., 2002; Cagnoli et al., 2006; Melo et al., 2016; Cagnoli et al., 2018). However, considering the genetic heterogeneity of the SCAs and low prevalence of each SCA type, fluorescent PCR followed by capillary electrophoresis sizing at various SCA loci for every sample is a relatively costly screening method, due to high costs of the labeled primers and equipment used.
Melting curve analysis (MCA) has been shown to be robust in identifying samples carrying repeat expansion in fragile X syndrome, myotonic dystrophy type 1, and Huntington disease (Lian et al., 2015; Rajan-Babu et al., 2015; Zhao et al., 2017). Used as an intermediate step between TP-PCR and capillary electrophoresis, MCA filters out the majority of samples that are expansion-negative while identifying only potential expansion-positive samples for further capillary electrophoresis sizing at a certain SCA locus. Using a similar approach, TP-PCR MCA assays can be easily adapted to identify repeat expansion at other loci by employing primers that are specific to the loci of interest.
Materials and reagents
Axygen® 10 μL microvolume, Gilson-style P2/P10 filter tips (Axygen®, catalog number: TF-300)
Axygen® 20 μL universal fit filter tips (Axygen®, catalog number: TF-20)
Axygen® 200 μL universal fit filter tips (Axygen®, catalog number: TF-200)
Axygen® 1,000 μL universal fit filter tips (Axygen®, catalog number: TF-1000)
MicroAmpTM Fast 8-tube strip (Applied Biosystems, catalog number: 4358293)
MicroAmpTM Optical 8-cap strip (Applied Biosystems, catalog number: 4323032)
0.2 mL 8-strip PCR UltraFlux® i Tubes, flat cap (SSIbio, catalog number: 3247-00)
MicroAmpTM Optical 96-well reaction plate (Applied Biosystems, catalog number: N8010560)
Plate septa, 96 well (Applied Biosystems, catalog number: 4315933)
0.2 mL PCR tubes (Fisher Scientific, catalog number: MBP#3412-PK)
1.5 mL MaxyClear Snaplock microcentrifuge tube (Axygen®, catalog number: MCT-150-C)
0.6 mL MaxyClear Snaplock microcentrifuge tube (Axygen®, catalog number: MCT-060-C)
15 mL high clarity PP centrifuge tube (Falcon®, catalog number: 352097)
Water (HPLC) (Sigma-Aldrich, catalog number: 270733-1L)
SYBRTM Green I nucleic acid gel stain, 10,000× concentrate in DMSO (InvitrogenTM, catalog number: S7563)
Primers:
ATXN1-specific forward primer, SCA1-F (5′-AGCCAGACGCCGGGACAC-3′)
Ned-labeled SCA1-F
ATXN1-specific TP primer, SCA1-TP (5′-GTTTCGGCGTTACGAGTGGAGTG(CTG)5-3′)
ATXN1-specific reverse primer, SCA1-R (5′-CTGCGGAGAACTGGAAATGTGG-3′)
ATXN2-specific forward primer, SCA2-F (5′-GTGCGAGCCGGTGTATGG-3′)
Hex-labeled SCA2-F
ATXN2-specific TP primer, SCA2-TP (5′-GTTTCGGCGTTACGAGTGGACGG(CTG)5-3′)
ATXN2-specific reverse primer, SCA2-R (5′-CTTGCGGACATTGGCAGCC-3′)
ATXN3-specific forward primer, SCA3-F (5′-CTGCTCTTGCATTCTTTTAATACCAGTGAC-3′)
Fam-labeled SCA3-F
ATXN3-specific TP primer, SCA3-TP (5′-GTTTCGGCGTTACGAGTGGAGTC(CTG)5-3′)
ATXN3-specific reverse primer, SCA3-R (5′-CACATGGATGTGAACTCTGTCCTG-3′)
Tail primer (5′-GTTTCGGCGTTACGAGTGGA-3′)
Deoxynucleoside triphosphate set (dNTPs), PCR grade (Roche Applied Science, catalog number: 11969064001)
HotStarTaq DNA Polymerase (Qiagen, catalog number: 203205)
Q-solution (Qiagen, catalog number: 203205)
PCR Buffer (Qiagen, catalog number: 203205)
10 ng/μL genomic DNA
1 pg/μL pATXN1(CAG)35(14+1+18) and pATXN2(CAG)25(15+9), 10 pg/μL pATXN3(CAG)41, and 50 ng/μL pATXN1(CAG)35(14+1+18), pATXN2(CAG)25(15+9), and pATXN3(CAG)41 plasmid DNA (see sections A and E)
Hi-DiTM formamide (Applied BiosystemsTM, catalog number: 4311320)
GeneScanTM 500 ROXTM dye size standard (Applied Biosystems, catalog number: 401734)
Agarose (1st BASE, catalog number: BIO-1000-500g)
Ethidium bromide solution (Sigma-Aldrich, catalog number: E1510-10ML)
1 kb DNA ladder (New England Biolabs Ltd., catalog number: N3232S)
ZymocleanTM Gel DNA Recovery kit (Zymo Research, catalog number: D4007)
illustraTM GFXTM PCR DNA and Gel Band Purification kit (GE Healthcare Life Sciences, catalog number: G13/28-9034-70)
TOPOTM TA CloningTM kit, Dual Promoter, without competent cells (InvitrogenTM, catalog number: 450640)
Max efficiency DH5a competent cells (InvitrogenTM, catalog number: 18258012)
S.O.C medium (InvitrogenTM, catalog number: 15544034)
Ampicillin ready-made solution (Sigma-Aldrich, catalog number: A5354-10ML)
LB broth (InvitrogenTM, catalog number: 10855001)
10× Tris-EDTA (TE) buffer, pH 8.0, ultra-pure grade, 1 L (1st BASE, catalog number: BUF-3020-10X1L)
ZyppyTM Plasmid Miniprep kit (Zymo Research, catalog number: D4019)
BigDye® Terminator v3.1 Cycle Sequencing kit (Applied BiosystemsTM, catalog number: 4337455)
Absolute ethanol (Fisher Chemical, catalog number: E/0650DF/17)
Sodium acetate solution (3 M), pH 5.2 (Thermo ScientificTM, catalog number: R1181)
Glycerol (Sigma-Aldrich, catalog number: G5516)
DNA AWAYTM surface decontaminant (Thermo ScientificTM, catalog number: 7010)
Equipment
Pipetman P2, 0.2–2 μL (Gilson, model number: F144054M)
Pipetman P10, 1–10 μL (Gilson, model number: F144055M)
Pipetman P20, 2–20 μL (Gilson, model number: F144056M)
Pipetman P200, 20–200 μL (Gilson, model number: F144058M)
Pipetman P1000, 100–1,000 μL (Gilson, model number: F144059M)
microONE Mini Personal Centrifuge (TOMY, model number: Capsulefuge PMC-880)
Genie 2 Vortex Mixers (Scientific Industries, Inc., model number: G-560E)
StepOnePlusTM Real-Time PCR System (Applied Biosystems, catalog number: 4376600)
GeneAmp® PCR System 9700 Fast Thermal Cycler (Applied Biosystems, catalog number: 4339386)
Eppendorf tabletop centrifuge (Eppendorf, model number: 5810)
Genetic Analyzer (Applied BiosystemsTM, model number: 3130xl)
SUBCELL GT Horizontal Electrophoresis System (Bio-Rad, catalog number: A2-OK)
NanoDropTM 1000 spectrophotometer (Thermo ScientificTM, model: ND-1000)
Water bath (Memmert, model number: MEM-EW-WB14L4)
Innova 4330 refrigerated incubator shaker (New Brunswick Scientific, model: Innova 4330)
Biofuge Fresco microcentrifuge (Heraeus, catalog number: 75005521)
Shake ‘n’ Stack (Hybaid Limited, catalog number: 50125590)
Scalpel
Software
StepOneTM Real-Time PCR Software (Applied Biosystems)
GeneMapper® Software (Applied Biosystems)
Sequencing Analysis Software (Applied Biosystems)
Microsoft Excel (Microsoft)
Procedure
TP-PCR master mix preparation for amplification and melting curve analysis of the ATXN1, ATXN2, and ATXN3 CAG repeat loci
This protocol outlines the steps to perform TP-PCR amplification of the ATXN1, ATXN2, and ATXN3 CAG repeats and melting curve analysis (MCA) of the generated TP-PCR products. Each TP-PCR assay utilizes a plasmid control DNA [pATXN1(CAG)35(14+1+18), pATXN2(CAG)25(15+9), and pATXN3(CAG)41 in SCA1, SCA2, and SCA3 TP-PCR MCAs, respectively], to generate threshold melt peak temperature (Tm), which is used to classify test samples as expansion-negative (if Tm is lower than the plasmid control’s Tm) or potentially expansion-positive (if Tm is higher than the plasmid control’s Tm).
Prepare the TP-PCR master mix by dispensing the following reagents into a microcentrifuge tube (volumes stated are for a single reaction):
9.60 μL of HPLC water
7.50 μL of 5× Q-solution
2.50 μL of 10× HotStarTaq PCR buffer
0.25 μL of 10× SYBRTM Green I Nucleic Acid Gel Stain
1.25 μL of 10 μM ATXN1-specific forward primer (SCA1-F), ATXN2-specific forward primer (SCA2-F), or ATXN3-specific forward primer (SCA3-F)
1.25 μL of 10 μM Tail primer
1.25 μL of 1 μM ATXN1-specific TP primer (SCA1-TP), ATXN2-specific TP primer (SCA2-TP), or ATXN3-specific TP primer (SCA3-TP)
0.20 μL of 25 mM dNTPs
0.20 μL of HotStarTaq DNA polymerase
Vortex to mix and spin the tube briefly.
Aliquot 24 μL of the master mix into the MicroAmpTM Fast 8-tube strip tubes.
Add 1 μL of test sample genomic DNA (10 ng/μL) or relevant plasmid DNA [1 pg/μL pATXN1(CAG)35(14+1+18) and pATXN2(CAG)25(15+9) for SCA1 and SCA2 TP-PCR MCAs, respectively, and 10 pg/μL pATXN3(CAG)41 for SCA3 TP-PCR MCA] into the appropriate tubes. To the non-template control tube, add 1 μL of HPLC water.
Apply the MicroAmpTM Optical 8-cap strip. Sample labeling can be done on the edge instead of in the middle of the cap to avoid blocking of light to the reaction tubes.
Spin the tubes briefly.
Set the following program on the StepOnePlusTM system, transfer the tubes into the instrument, and start the amplification and melt curve analysis (melt peaks are automatically generated upon completion of the run by the on-board StepOneTM software).
Stage Step Temperature and duration Amplification Hold 95 °C, 15 min Cycling (35 cycles) 98 °C, 45 s 60 °C, 1 min 72 °C, 2 min Hold 72 °C, 5 min Melt curve Hold 95 °C, 1 min Hold 60 °C, 1 min Temperature ramp (at a rate of 0.8% in continuous mode) 60 °C to 95 °C Hold 40 °C, 1 min
Generation of TP-PCR melting curve analysis profiles
This protocol outlines the steps to create melt peak plots to identify samples with potential expansion.
Open the results in Microsoft Excel.
For each sample and plasmid control, plot “Melt Region Derivative Data” (i.e., the -dF/dT values) against “Melt Region Temperature Data” by choosing “X Y (Scatter)” from the Charts option under the Insert Tab, followed by selecting “Scatter with Smooth Lines” to create the melt peak plots.
Look for the temperature that gives the highest derivative data to determine the Tm.
Observe the melt peak profiles to identify samples that display a higher Tm relative to the plasmid control used.
Identify samples with potential expansion for further repeat size verification by capillary electrophoresis.
Extension labeling of TP-PCR products for capillary electrophoresis
This protocol outlines the steps to perform extension fluorescent labeling using an aliquot of the TP-PCR products, followed by capillary electrophoresis for determination of the ATXN1, ATXN2, and ATXN3 CAG repeat sizes in samples with potential expansion.
Prepare the extension labeling master mix by dispensing the following reagents into a microcentrifuge tube (volumes stated are for a single reaction):
8.84 μL of HPLC water
6.00 μL of 5× Q-solution
2.00 μL of 10× HotStarTaq PCR buffer
0.80 μL of 10 μM Ned-labeled SCA1-F, Hex-labeled SCA2-F, or Fam-labeled SCA3-F
0.16 μL of 25 mM dNTPs
0.20 μL of HotStarTaq DNA polymerase
Vortex to mix and spin the tube briefly.
Aliquot 18 μL of the master mix into the PCR strip tubes.
Add 2 μL of TP-PCR products into the appropriate tubes.
Spin the strip tubes briefly.
Set the following program on the thermal cycler, transfer the tubes into the instrument, and start the amplification.
Stage Step Temperature and duration Amplification Hold 95 °C, 15 min Cycling (5 cycles) 98 °C, 45 s 60 °C, 1 min 72 °C, 2 min Hold 72 °C, 5 min Hold 4 °C Remove the tubes and spin them briefly.
Prepare the capillary electrophoresis master mix by dispensing the following reagents into a microcentrifuge tube (volumes stated are for a single reaction):
9.00 μL of Hi-DiTM formamide
0.50 μL of GeneScan 500 ROX dye size standard
Vortex to mix and spin the tube briefly.
Aliquot 9.5 μL of the master mix into the MicroAmpTM Optical 96-well reaction plate.
Aliquot 4 μL of the labeled TP-PCR products into the appropriate wells.
Seal the plate with a rubber septum and spin the plate briefly.
Denature the content at 95 °C for 5 min.
Place the plate on ice.
Set the injection time and voltage in the Genetic Analyzer to be 15 s and 1 kV, respectively, and the run time to 40 min (the rest of the parameters set at default values) and start the capillary electrophoresis.
Analyze the results using the GeneMapper® software.
Examine the electropherograms to assess the ATXN1, ATXN2, and ATXN3 genotypes, repeat counts, and the number and placement of any CGG interruptions.
Flanking PCR master mix preparation and generation of control ATXN1, ATXN2, or ATXN3 plasmids for TP-PCR melting curve analysis
This protocol outlines the steps to prepare ATXN1, ATXN2, or ATXN3 plasmid controls for use in TP-PCR MCA. Briefly, it covers how to set up flanking PCR to amplify across the ATXN1, ATXN2, and ATXN3 CAG repeat sequence, followed by isolation, purification, and cloning of fragments of interest, transformation, colony PCR, and isolation of plasmid DNA.
Prepare the flanking PCR master mix by dispensing the following reagents into a microcentrifuge tube (volumes stated are for a single reaction; for each sample, set up 2–3 reactions):
11.60 μL of HPLC water
7.50 μL of 5× Q-solution
2.50 μL of 10× HotStarTaq PCR buffer
1.00 μL of 10 μM SCA1-F, SCA2-F, or SCA3-F
1.00 μL of 10 μM SCA1-R, SCA2-R, or SCA3-R
0.20 μL of 25 mM dNTPs
0.20 μL of HotStarTaq DNA polymerase
Vortex to mix and spin the tube briefly.
Aliquot 24 μL of the master mix into the PCR tubes.
Add 1 μL of genomic DNA (10 ng/μL) into the appropriate tubes. To the non-template control tube, add 1 μL of HPLC water.
Spin the tubes briefly.
Set the following program on the thermal cycler, transfer the tubes into the instrument, and start the amplification.
Stage Step Temperature and duration Amplification Hold 95 °C, 15 min Cycling (5 cycles) 98 °C, 45 s 60 °C, 1 min 72 °C, 2 min Hold 72 °C, 5 min Hold 4 °C Remove the tubes and spin them briefly.
Pool the PCR products of each sample and load them into a 2% agarose gel prepared with ethidium bromide (0.5 μg/mL) alongside with 4 μL of the 1 kb DNA ladder.
Electrophorese the gel and visualize the results in an imaging system.
Locate and excise the band of interest from the gel using a razor blade, scalpel, or other device.
Isolate and purify the fragments of interest using a gel band purification kit such as the ZymocleanTM Gel DNA Recovery kit or illustraTM GFXTM PCR DNA and Gel Band Purification kit, following the manufacturer’s instructions.
Quantitate the purified PCR products using NanoDrop.
Store the purified PCR products at -20 °C until further use.
Thaw the DH5αTM competent cells on ice, set the water bath to 42 °C, and thaw the S.O.C medium at room temperature.
Prepare the ligation reaction by adding 1 μL of salt solution and 1 μL of pCR®II-TOPO® TA vector to 4 μL of purified PCR product.
Add the ligation reaction to the thawed DH5αTM competent cells (50 μL per tube).
Gently tap the tubes to mix.
Incubate the cells on ice for 30 min.
Immerse two-thirds of the tubes into the water bath pre-set to 42 °C for 20 s to heat-shock the cells.
Place the tubes on ice for 2 min.
Add 0.95 mL of the S.O.C medium to each tube.
Shake the tubes at 250 rpm for 1 h at 37 °C.
Centrifuge the tubes at 16,060× g for 5 min.
Remove 800 μL of the supernatant and discard.
Resuspend the pellet with the remaining supernatant.
Spread the content from each tube on an LB agar plate containing 100 μg/mL ampicillin using a sterilized spreader.
To prepare LB agar plates containing ampicillin, dissolve agar powder in LB medium following manufacturer’s instructions and autoclave to sterilize. Cool the agar to approximately 50 °C and add 1 mL of 100 mg/mL ampicillin before pouring them into Petri dishes and allowing them to cool and set. Store the prepared LB agar plates at 4 °C.
Incubate the plates overnight at 37 °C.
Randomly pick 10–20 colonies from each plate using micropipette tips.
Suspend each colony into a PCR tube containing 10 μL of 1× TE buffer and mark the colony numbers on the LB plates and the PCR tubes.
Perform colony PCR by setting up TP-PCR (see section A; use fluorescently labeled SCA1-F, SCA2-F, or SCA3-F and omit SYBRTM Green I Nucleic Acid Gel Stain) using 1 μL of the picked colony as the template, followed by capillary electrophoresis (see section C).
Examine the electropherograms to identify colonies that have the DNA inserts with expected ATXN1, ATXN2, or ATXN3 CAG repeat size and structure.
Create starter culture by inoculating the remaining 9 μL of the colonies of interest into 3–5 mL of LB broth containing 100 μg/mL ampicillin.
Shake the tubes at 250 rpm overnight at 37 °C.
Expand the culture by transferring the starter culture to 50–100 mL of LB broth containing 100 μg/mL ampicillin.
Shake the tubes at 250 rpm overnight at 37 °C.
Prepare bacterial glycerol stocks for future use by adding 400 μL of the culture into 400 μL of glycerol and gently pipetting them up and down to mix. Store the bacterial glycerol stocks at -80 °C.
Isolate plasmid DNA using kits such as the ZyppyTM Plasmid Miniprep kit, following the manufacturer’s instructions.
Quantitate the extracted plasmid DNAs using NanoDrop and store them at -20 °C.
Use 1–10 pg of plasmid DNA as the template for TP-PCR MCA assay.
The CAG repeat size and structure of the plasmid DNA can also be verified by Sanger sequencing (see section E).
Sanger sequencing for verification of ATXN1, ATXN2, or ATXN3 CAG repeat size and structure of plasmid DNA controls
This protocol outlines the steps to perform Sanger sequencing of the plasmid DNA for verification of the ATXN1, ATXN2, and ATXN3 CAG repeat sizes.
Prepare the sequencing reaction master mix by dispensing the following reagents into a microcentrifuge tube (volumes stated are for a single reaction):
HPLC water (top up to 20 μL per reaction)
8 μL of 2.5× BigDye® Terminator Mix v3.1
3.2 pmol M13 or T7 primers
Vortex to mix and spin the tube briefly.
Aliquot 16 μL of the master mix into the PCR tubes.
Add 4 μL of plasmid DNA (50 ng/μL) into the appropriate tubes.
Spin the tubes briefly.
Set up the following program on the thermal cycle, transfer the tubes into the instrument, and start the amplification.
Stage Step Temperature and duration Amplification Hold 96 °C, 1 min Cycling (25 cycles) 96 °C, 10 s 60 °C, 5 s 60 °C, 4 min Hold 4 °C Remove the tubes and spin them briefly.
Prepare the precipitation reaction master mix by dispensing the following reagents into a microcentrifuge tube (volumes stated are for a single reaction):
14.50 μL of HPLC water
3.00 μL of 3M sodium acetate
62.50 μL of 100% ethanol
Vortex to mix and spin the tube briefly.
Aliquot 80 μL of the master mix into the 1.5 mL microcentrifuge tube.
Transfer all 20 μL of the sequencing products into the appropriate tubes.
Vortex to mix and spin the tubes briefly.
Leave the tubes at room temperature away from light for 15 min.
Spin the tubes at 13,000 rpm for 20 min.
Aspirate and discard the supernatant.
Add 250 μL of 70% ethanol into each tube.
Spin the tubes at 13,000 rpm for 5 min.
Aspirate and discard the supernatant.
Repeat steps E16–E18.
Air dry the tubes.
Add 12 μL of Hi-DiTM formamide into each tube.
Vortex the tubes to dislodge and suspend the pellets.
Load all 12 μL of the content into the MicroAmpTM Optical 96-well reaction plate.
Seal the plate with a rubber septum and spin the plate briefly.
Denature the content at 95 °C for 5 min.
Place the plate on ice.
Start the capillary electrophoresis run in the Genetic Analyzer using sequencing module and all parameters set at default values.
Analyze the results using the Sequencing Analysis software.
Data analysis
The SCA1, SCA2, and SCA3 TP-PCR employs locus-specific flanking and TP primers and a common Tail primer, which together generate multiple products, each differing by one CAG repeat (Lian et al., 2021). The shorter TP-PCR products generated from an allele with smaller CAG repeat size produce melt peaks with lower Tm, whereas the longer TP-PCR products generated from an allele with larger CAG repeat size yield melt peaks with higher Tm. Plasmid control DNA carries repeat size that is sufficiently lower than the upper boundary of the normal repeat size range and is included in each TP-PCR MCA run for generation of threshold Tm to classify samples based on their Tm. The melt peak plots of non-SCA samples, SCA-positive samples, and plasmid DNA controls after SCA1, SCA2, and SCA3 TP-PCR MCAs are shown in Figure 1 (left panel). Non-SCA samples carrying non-expanded (normal) alleles are left-shifted with lower Tm compared with that of the plasmid DNA control and will not be further subjected to capillary electrophoresis sizing. On the other hand, SCA-positive samples are right-shifted relative to the control, due to their higher Tm. Any sample whose Tm is higher than the relevant plasmid’s Tm is potentially expansion-positive and will be further subjected to capillary electrophoresis for repeat size confirmation (Figure 1, right panel). Due to the unique design of the primers, the first peak in the SCA1 and SCA2 TP-PCR electropherogram represents TP-PCR product containing five repeats, while the first peak in the SCA3 TP-PCR electropherogram represents product containing 11 repeats. Each successive peak represents product containing an additional repeat, and the last peak represents the largest TP-PCR product generated. The repeat number in a sample can be determined by counting the number of peaks. In situations where CGG interruptions are present in ATXN1 and ATXN2 alleles, inefficient annealing of the TP primer to the interrupted sequences results in little to no amplification, resulting in a gap between two discrete clusters of peaks.
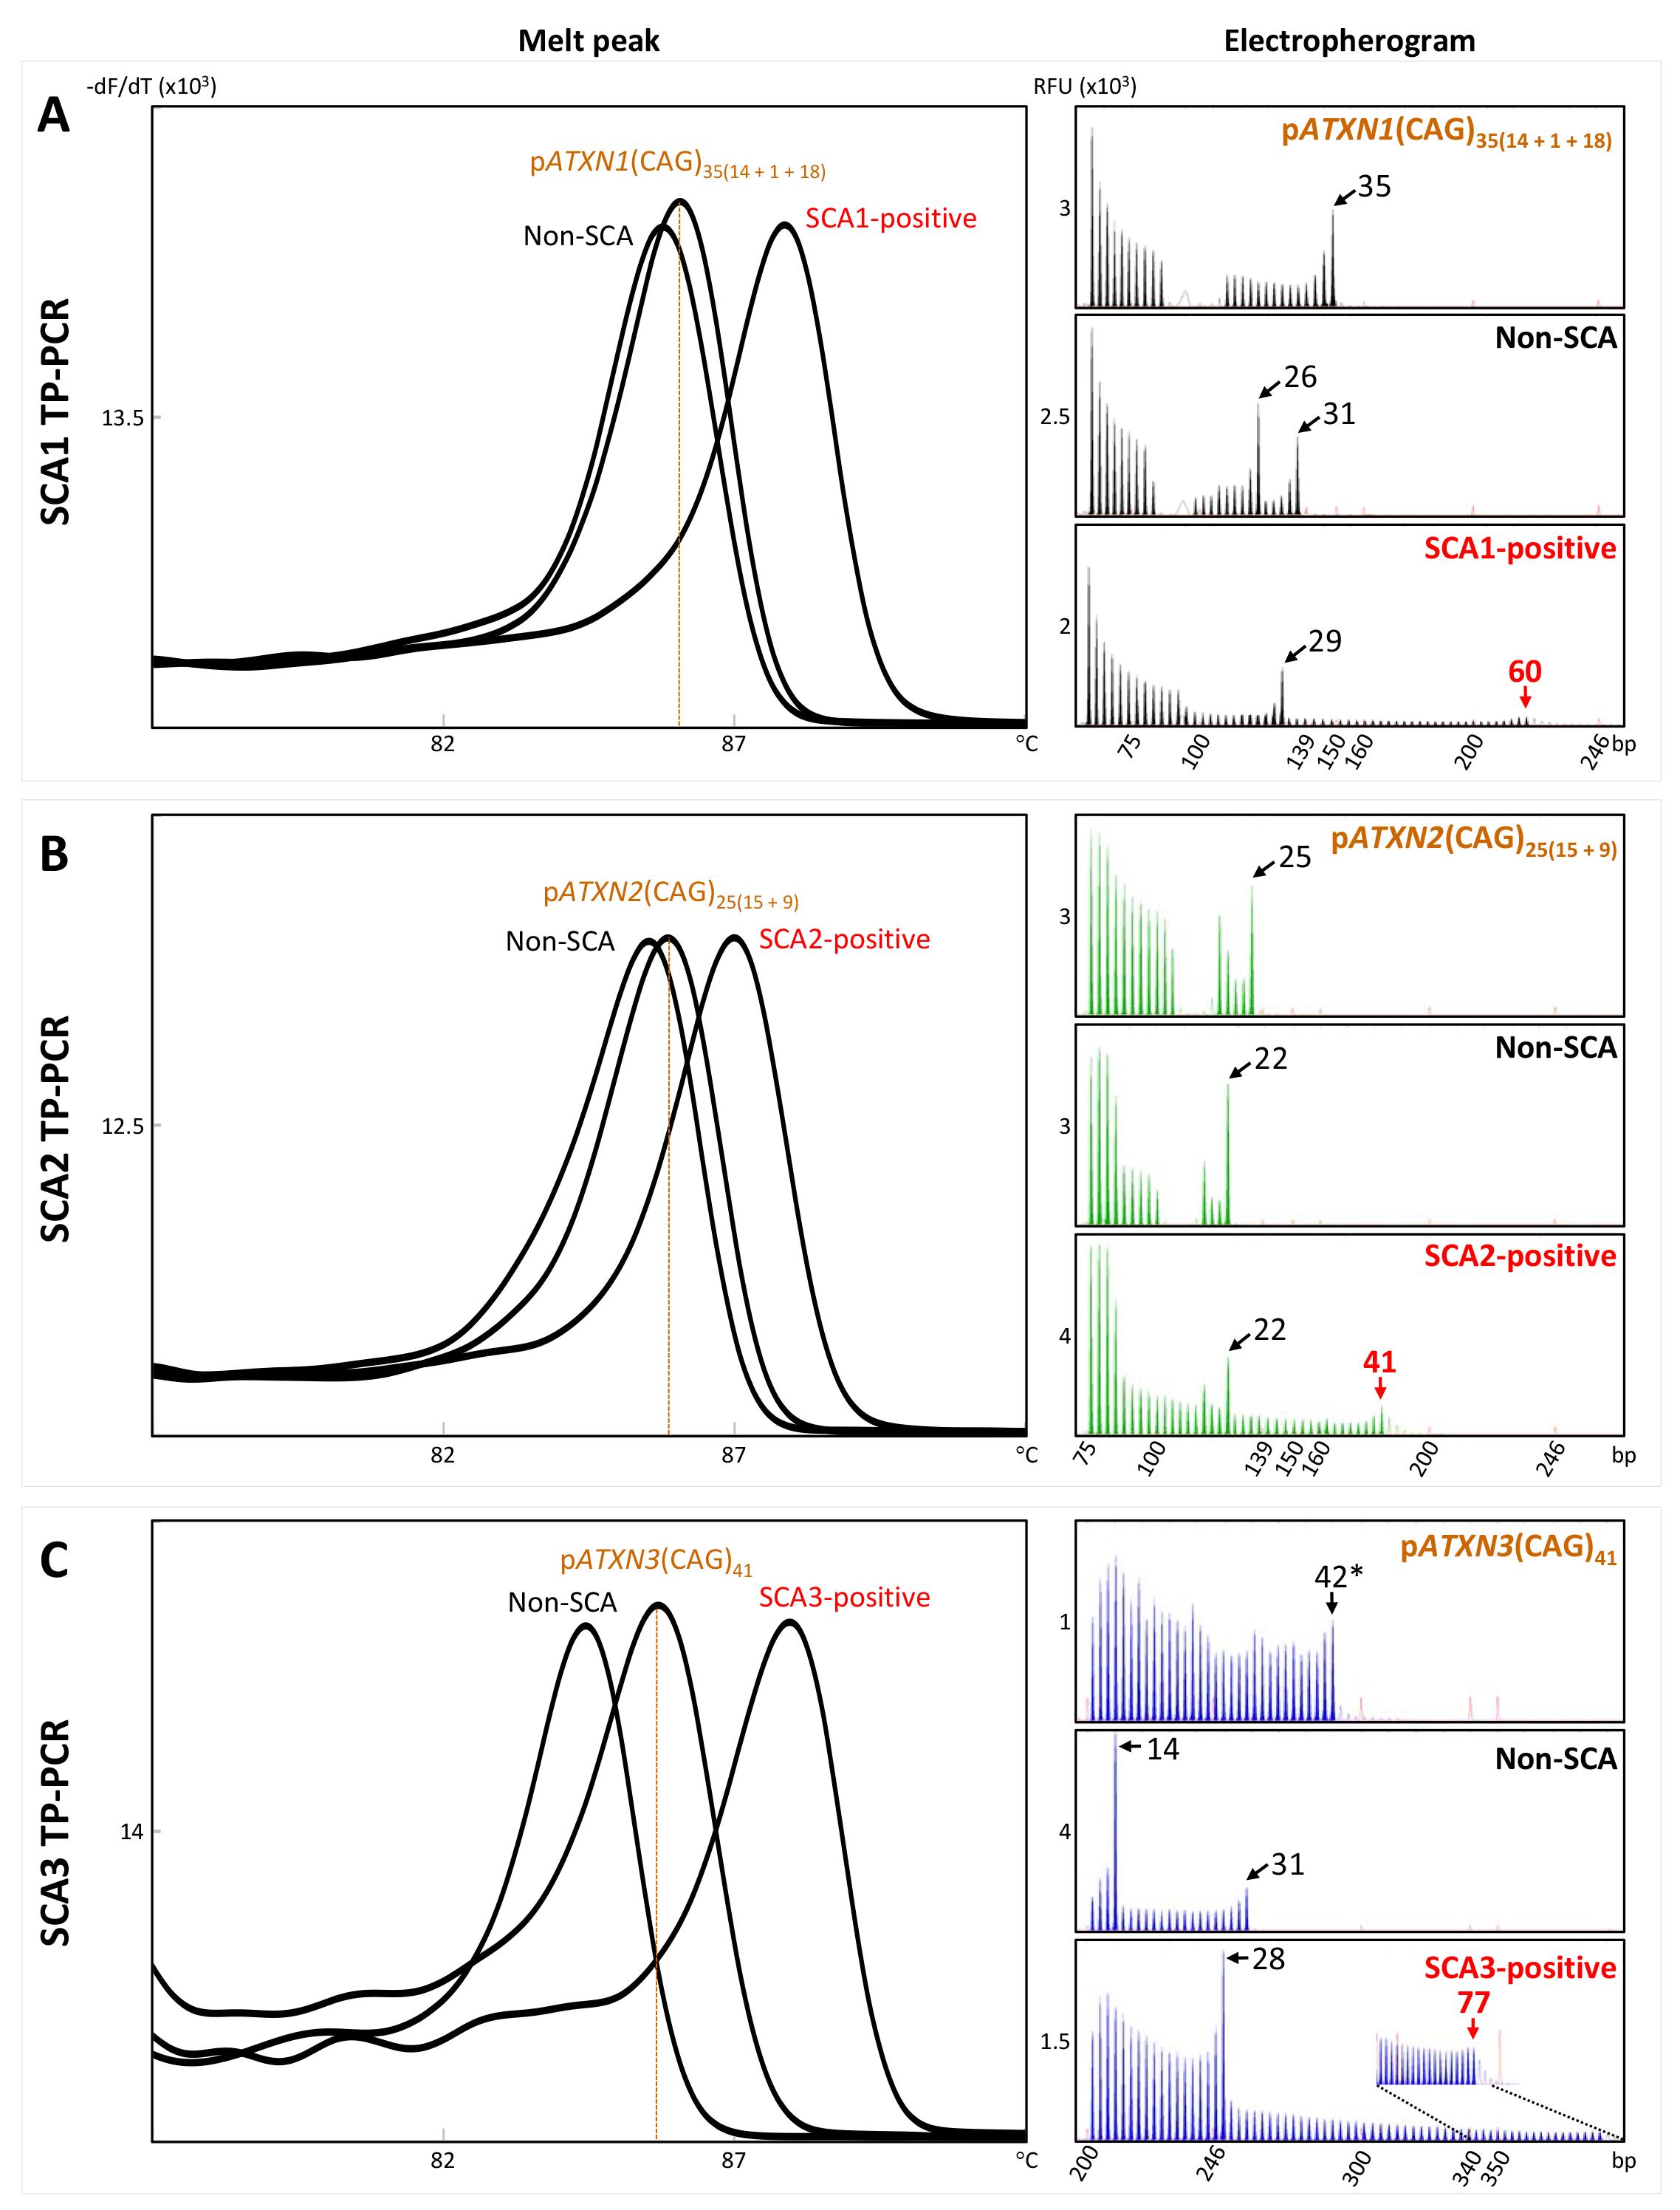
Figure 1. Example of melt peak profiles (left) and electropherograms (right) of non-spinocerebellar ataxia (SCA) and SCA-positive samples, together with the plasmid control DNA, after SCA1, SCA2, and SCA3 TP-PCR MCAs. In the left panel, non-SCA samples are left-shifted with lower melt peak temperatures compared with that of the relevant plasmid DNA control, while SCA-positive samples are right-shifted relative to the control. -dF/dT is shown on the x-axis and temperature is shown on the y-axis. In the right panel, numbered black arrows indicate the number of CAG repeats in non-expanded (normal) alleles, and numbered red arrows indicate the number of CAG repeats in expanded alleles. Relative fluorescence unit (RFU) is shown on the x-axis and size is shown on the y-axis.
Notes
Clean lab bench before start of experiments with 70% ethanol and DNA AWAYTM.
Mix reagents before use to ensure that they are uniform and spin them briefly to collect the content at the bottom of the tube.
Use the HotStarTaq PCR buffer and Q-solution provided with the HotStarTaq DNA polymerase.
Use aerosol barrier pipette tips. Change tips after each use.
Open and close all sample tubes carefully. Avoid splashing PCR products.
Note that SYBR Green is light sensitive. Wrap tubes containing SYBR Green with aluminum foil or use amber tubes to avoid direct light exposure.
We recommend that plasmid DNA controls are included in each TP-PCR MCA run to differentiate the melt peaks of samples with repeat expansion from those of expansion-negative samples. The result of the plasmid DNA generated from one run should not be used to differentiate samples used in other runs.
Include at least one positive control (e.g., sample with a known expansion) as well as a negative or non-template control in each assay, to ensure reliable amplification/repeat sizing and absence of amplicon or DNA contaminants in the reagents used, respectively.
We recommend using POP-7TM polymer.
The genomic DNA and plasmid DNA should be diluted with 1× TE buffer to prevent DNA degradation.
Acknowledgments
This work was supported by internal departmental funds. This protocol was derived from the original research paper (Lian et al., 2021).
Competing interests
A patent application was submitted on June 2, 2021, directed to a method of detecting a repeat expansion sequence. The authors declare that they have no other competing interests.
References
- Cagnoli, C., Brussino, A., Mancini, C., Ferrone, M., Orsi, L., Salmin, P., Pappi, P., Giorgio, E., Pozzi, E., Cavalieri, S., et al. (2018). Spinocerebellar Ataxia Tethering PCR: A Rapid Genetic Test for the Diagnosis of Spinocerebellar Ataxia Types 1, 2, 3, 6, and 7 by PCR and Capillary Electrophoresis. J Mol Diagn 20(3): 289-297.
- Cagnoli, C., Stevanin, G., Michielotto, C., Gerbino Promis, G., Brussino, A., Pappi, P., Durr, A., Dragone, E., Viemont, M., Gellera, C., et al. (2006). Large pathogenic expansions in the SCA2 and SCA7 genes can be detected by fluorescent repeat-primed polymerase chain reaction assay. J Mol Diagn 8(1): 128-132.
- Chung, M. Y., Ranum, L. P., Duvick, L. A., Servadio, A., Zoghbi, H. Y. and Orr, H. T. (1993). Evidence for a mechanism predisposing to intergenerational CAG repeat instability in spinocerebellar ataxia type I. Nat Genet 5(3): 254-258.
- Dorschner, M. O., Barden, D. and Stephens, K. (2002). Diagnosis of five spinocerebellar ataxia disorders by multiplex amplification and capillary electrophoresis. J Mol Diagn 4(2): 108-113.
- Hersheson, J., Haworth, A. and Houlden, H. (2012). The inherited ataxias: genetic heterogeneity, mutation databases, and future directions in research and clinical diagnostics. Hum Mutat 33(9): 1324-1332.
- Kawaguchi, Y., Okamoto, T., Taniwaki, M., Aizawa, M., Inoue, M., Katayama, S., Kawakami, H., Nakamura, S., Nishimura, M., Akiguchi, I., et al. (1994). CAG expansions in a novel gene for Machado-Joseph disease at chromosome 14q32.1. Nat Genet 8(3): 221-228.
- Klockgether, T., Mariotti, C. and Paulson, H. L. (2019). Spinocerebellar ataxia. Nat Rev Dis Primers 5(1): 24.
- Lian, M., Rajan-Babu, I. S., Singh, K., Lee, C. G., Law, H. Y. and Chong, S. S. (2015). Efficient and highly sensitive screen for myotonic dystrophy type 1 using a one-step triplet-primed PCR and melting curve assay. J Mol Diagn 17(2): 128-135.
- Lian, M., Zhao, M., Phang, G. P., Soong, Y. T., Yoon, C. S., Lee, C. G., Law, H. Y. and Chong, S. S. (2021). Rapid Molecular Screen of Spinocerebellar Ataxia Types 1, 2, and 3 by Triplet-Primed PCR and Melting Curve Analysis. J Mol Diagn 23(5): 565-576.
- Melo, A. R., Ramos, A., Kazachkova, N., Raposo, M., Bettencourt, B. F., Rendeiro, A. R., Kay, T., Vasconcelos, J., Bruges-Armas, J. and Lima, M. (2016). Triplet Repeat Primed PCR (TP-PCR) in Molecular Diagnostic Testing for Spinocerebellar Ataxia Type 3 (SCA3). Mol Diagn Ther 20(6): 617-622.
- Orr, H. T., Chung, M. Y., Banfi, S., Kwiatkowski, T. J., Jr., Servadio, A., Beaudet, A. L., McCall, A. E., Duvick, L. A., Ranum, L. P. and Zoghbi, H. Y. (1993). Expansion of an unstable trinucleotide CAG repeat in spinocerebellar ataxia type 1. Nat Genet 4(3): 221-226.
- Pulst, S. M., Nechiporuk, A., Nechiporuk, T., Gispert, S., Chen, X. N., Lopes-Cendes, I., Pearlman, S., Starkman, S., Orozco-Diaz, G., Lunkes, A., et al. (1996). Moderate expansion of a normally biallelic trinucleotide repeat in spinocerebellar ataxia type 2. Nat Genet 14(3): 269-276.
- Rajan-Babu, I. S., Law, H. Y., Yoon, C. S., Lee, C. G. and Chong, S. S. (2015). Simplified strategy for rapid first-line screening of fragile X syndrome: closed-tube triplet-primed PCR and amplicon melt peak analysis. Expert Rev Mol Med 17: e7.
- Ruano, L., Melo, C., Silva, M. C. and Coutinho, P. (2014). The global epidemiology of hereditary ataxia and spastic paraplegia: a systematic review of prevalence studies. Neuroepidemiology 42(3): 174-183.
- Zhao, M., Cheah, F. S. H., Chen, M., Lee, C. G., Law, H. Y. and Chong, S. S. (2017). Improved high sensitivity screen for Huntington disease using a one-step triplet-primed PCR and melting curve assay. PloS One 12(7): e0180984.
Article Information
Copyright
© 2023 The Author(s); This is an open access article under the CC BY-NC license (https://creativecommons.org/licenses/by-nc/4.0/).
How to cite
Lian, M., Zhao, M., Phang, G. P., Rajan-Babu, I. S. and Chong, S. S. (2023). Triplet-primed PCR and Melting Curve Analysis for Rapid Molecular Screening of Spinocerebellar Ataxia Types 1, 2, and 3. Bio-protocol 13(12): e4704. DOI: 10.21769/BioProtoc.4704.
Category
Neuroscience > Nervous system disorders > Neurodegeneration
Molecular Biology > DNA > PCR
Do you have any questions about this protocol?
Post your question to gather feedback from the community. We will also invite the authors of this article to respond.