- Protocols

- Articles and Issues
- For Authors
- About
- Become a Reviewer

Automated 384-well SYBR Green Expression Array for Optimization of Human Induced Pluripotent Stem Cell Differentiation
Published: Vol 13, Iss 11, Jun 5, 2023 DOI: 10.21769/BioProtoc.4689 Views: 2274
Reviewed by: Xi FengSubhra Prakash HuiLei GaoAnonymous reviewer(s)
Original research article
The authors used this protocol in:
Dec 2022
Advertisement


Protocol Collections
Comprehensive collections of detailed, peer-reviewed protocols focusing on specific topics


Related protocols
Abstract
Cell populations and tissues exhibit unique gene expression profiles, which allow for characterizing and distinguishing cellular subtypes. Monitoring gene expression of cell type–specific markers can indicate cell status such as proliferation, stress, quiescence, or maturation. Quantitative reverse transcriptase PCR (qRT-PCR) allows quantifying RNA expression of cell type–specific markers and distinguishing one cell type from another. However, qRT-PCR methods such as TaqMan technology require fluorescent reporters to characterize target genes and are challenging to scale up as they need different probes for each reaction. Bulk or single-cell RNA transcriptomics is time-consuming and expensive. Processing RNA sequencing data can take several weeks, which is not optimal for quality control and monitoring gene expression, e.g., during a differentiation paradigm of induced pluripotent stem cells (iPSCs) into a specialized cell type.
A more cost-effective assay is based on SYBR Green technology. SYBR Green is a nucleic acid dye that binds to double-stranded DNA, absorbs blue light at 497 nm, and emits green light at 520 nm up to 1,000-fold upon intercalation with double-stranded DNA. Amplification of a region of interest can be quantified based on the level of fluorescence intensity when normalized to a housekeeping gene and compared to control conditions. Previously, we established a SYBR Green qRT-PCR protocol to characterize samples using a limited set of markers plated on a 96-well plate.
Here, we optimize the process and increase throughput to a 384-well format and compare mRNA expression to distinguish iPSC-derived neuronal subtypes from each other by increasing the number of genes, cell types, and differentiation time points. In this protocol, we develop the following: i) using the command-line version of Primer3 software, we design primers more easily and quickly for the gene of interest; ii) using a 384-well plate format, electronic multichannel pipettes, and pipetting robots, we analyze four times more genes on a single plate while using the same volume of reagents as in a 96-well plate. The advantages of this protocol are the increased throughput of this SYBR Green assay while limiting pipetting errors/inconsistencies, reagent use, cost, and time.
Graphical overview

Figure 1. Overall optimized SYBR Green qRT-PCR workflow. (A) Primers are designed through the command-line version of Primer3. The program takes a couple of files as arguments: 1) an input file containing a sequence of the region of interest and a target, and 2) settings file with custom settings and primer picking conditions. The results are saved to a text file, checked for secondary and tertiary structures, then synthesized. (B) Primers are then plated using either multichannel pipettes with a pipetting aid or an automated pipetting robot. Plates are left to dry at room temperature and can be stored for an indefinite time. (C) Meanwhile, RNA is extracted from cell samples, reverse-transcribed into cDNA, then plated onto pre-coated 384-well plates. SYBR Green qRT-PCR is run and analyzed with QuantStudio software and Microsoft Excel.
Background
Quantitative reverse transcriptase PCR (qRT-PCR) is a fundamental laboratory technique to quantify the RNA gene expression of a biological sample. Previously, we developed a protocol that quantifies PCR products using an SYBR Green array in a 96-well format. SYBR Green is a dye that fluoresces when intercalated into double-stranded DNA (Srinivasaraghavan et al., 2022). As a region of interest is PCR-amplified, the amount of fluorescence is directly proportional to the amount of DNA content in the sample. This assay provides an accurate, cost-effective, and fast way to quantify the mRNA gene expression of a cell or tissue sample. Here, we optimized the throughput with a 384-well format, increasing the number of markers, simplifying and standardizing primer design, and automating pipetting of the plate to reduce manual pipetting errors and ensure volume accuracy. Each well uses 5 μL of reaction mix instead of the 20 μL in a 96-well plate, but the whole plate contains four times the number of wells. Thus, for the same volume of reagents used, one plate can output four times the data.
Scaling up the assay from 96- to 384-well plates requires optimization
However, qRT-PCR methods such as TaqMan technology require fluorescent reporters to characterize target genes and are challenging to scale up as they need different probes for each reaction. Bulk or single-cell RNA transcriptomics is time-consuming and expensive (Table 1). Processing RNA sequencing data can take several weeks, which is not optimal for monitoring gene expression, e.g., during a differentiation paradigm of induced pluripotent stem cells (iPSCs) into a specialized cell type. We improved primer design by using the command line version of Primer3 software. This avoids using the web interface, where user input errors can occur. Instead, the program uses 1) a text file containing all settings and primer conditions; 2) an input file containing the gene name, full gene sequence, and target region to amplify; and 3) an output file/folder containing compatible primers. Coating 384-well plates with primers is labor-intensive and yields potential user error. To mitigate this, we use one of three methods for plating primers: 1) use of a PlatR pipetting aid, which uses a tablet that lights up wells from underneath, 2) an E1-ClipTip adjustable tip-spacing electronic pipette, or 3) Integra ASSIST PLUS pipetting robot to pipette larger arrays with more plates. All three methods increase the throughput of generating coated plates and the consistency of volumes across all assays.
With the optimized format we describe in this protocol, we can assess 31 markers in triplicates on four samples on a single 384-well plate. Alternatively, 40 markers can be plated in triplicates on a plate with three samples. The number of wells needed for each will vary depending on the number of genes, replicates, and samples.
Human iPSC modeling
Patient-specific iPSC lines can be generated and differentiated to study cell processes, developmental defects, or disease mechanisms on a human genomic background. However, since differentiating these cells requires careful design of differentiation protocols, a method is needed to validate and confirm that this differentiation resembles that of in vivo tissue.
The use of many markers allows SYBR Green to be used to characterize many cell types. In contrast, the customizable plate allows flexible comparison of samples at different differentiation time points or between different cell types. Because most of the workflow for this SYBR Green protocol can be done within 1–2 days, the low turnaround time is ideal for characterizing cells at various time points during the differentiation process.
Optimization and validation of differentiation protocols using cell type–specific markers
The data analysis for RNA-seq methods can take some time and requires advanced bioinformatics tools. Our SYBR Green qRT-PCR gene expression can be completed in ~2 days, in which cells are harvested, cDNA synthesis is performed, and cDNA samples are quantified (Figure 1).
To show that the optimized primer design process can generate more markers and establish markers for optimizing current and future differentiation protocols, we have developed a library of markers to characterize multiple neuronal types at different developmental time points (Supplemental Table 1). This primer inventory includes cortical, striatal, and dopaminergic neurons and progenitors, pluripotency genes, astrocytes, hematopoietic precursors, microglia, retinal genes, synaptic markers, and germ layer markers.
Please note that we have saved Supplemental Table 1 and Supplemental Table 2 as individual files.
Table 1. Comparison between different RNA analysis tools
| Assay type | # of genes | Multiplexing | Approx. time | Cost |
|---|---|---|---|---|
| TaqMan | ~96 (4 samples) | 1–6 | ~1 day | $498/"scorecard" |
| Bulk RNA-seq | 300,000 | 1 | Weeks | $200–300 |
| scRNA-Seq | ~7–8,000 | Up to 8 | Weeks | ~$1,000 |
| SYBR Green | ~30 (4 samples) | 1–8 | ~1 day | ~$85/384-well plate |
Materials and reagents
MicroAmpTM Optical 384-well reaction plate (Applied Biosystems, catalog number: 4309849)
8-channel VOYAGER adjustable tip electronic pipette (Integra Biosciences, catalog number: 4721)
1.5 and 0.6 mL RNase-free microcentrifuge tubes
RNase-free filter pipette tips (P1000, P200, P20, and P2)
PowerUpTM SYBRTM Green Master Mix (Thermo Fisher, catalog number: A25742)
High-Capacity cDNA rev Transcription kit (Thermo Fisher, catalog number: 4368814)
DNase I, amplification grade (Invitrogen, Thermo Fisher Scientific, catalog number: 18068015)
PurelinkTM RNA Mini kit (Invitrogen, catalog number: 12183018A)
Homogenizer (Invitrogen, catalog number: 12183026)
2-mercaptoethanol (Aldrich Chemistry, Sigma-Aldrich, catalog number: M2650)
Nuclease-free water
Phosphate buffered saline without calcium and magnesium (PBS) (Thermo Fisher, catalog number: 70-011-044)
Custom-designed forward and reverse primers diluted to 100 μM in nuclease-free water
Integra GRIPTIP 6000 for ASSIST PLUS (Integra Biosystems, catalog number: 6403)
Bucket with wet ice
Personal protective equipment (gloves, lab coat, goggles)
10% bleach for decontamination
Equipment
Microcentrifuge 5415C (Eppendorf, catalog number: M7282)
Refrigerated centrifuge (Beckman Coulter, catalog number: GS6 Allegra)
Mini centrifuge (Fisher Scientific, catalog number: 05-090-100)
MiniAmpTM thermal cycler (Applied Biosystems, Thermo Fisher, catalog number: A37834)
NanoDrop spectrophotometer (Thermo Fisher, catalog number: 13-400-525)
PlateR visual pipetting aid tablet (Biosistemika, catalog number: P-10)
QuantStudio 6 Flex Real-Time PCR system (Applied Biosystems, catalog number: 4485691)
Integra ASSIST PLUS pipetting robot (Integra Biosciences, catalog number: 4505)
E1-ClipTip 200 Bluetooth electronic single channel pipette (Thermo Fisher, catalog number: 4670020BT
E1-ClipTip 384 12.5 electronic adjustable tip-spacing multichannel pipette (Thermo Fisher, catalog number: 4672010BT)
Software
QuantStudio 6 and 7 Flex Real-Time PCR software v1.7.2 (Thermo Fisher, https://www.thermofisher.com/us/en/home/global/forms/life-science/quantstudio-6-7-flex-software.html)
Primer3 (Steve Rozen, Helen Skaletsky, Triinu Koressaar, Maido Remm, and Andreas Untergasser, https://github.com/primer3-org/primer3)
Beacon Designer (Premier Biosoft, http://www.premierbiosoft.com/qOligo/Oligo.jsp?PID=1)
In silico PCR prediction (UCSC Genome Browser, https://genome.ucsc.edu/cgi-bin/hgPcr)
UNAFold (Integrated DNA Technology, https://www.idtdna.com/UNAFold). Create an account to use the software.
Integra VIALAB automation software (Integra, https://www.integra-biosciences.com/united-states/en/pipetting-robots/assist-plus/download-vialab)
RStudio Desktop (RStudio, https://www.rstudio.com/products/rstudio/download/)
Procedure
RNA extraction with PureLink RNA Mini kit
We optimized RNA extraction for neuronal cultures. Previously, cells were dissociated from the culture well and then pelleted before lysis for RNA extraction (Srinivasaraghavan et al., 2022). However, RNA in axons and dendrites is lost as cells detach and round up during dissociation, resulting in only capturing RNA from the cell soma. Alternatively, TRIzol can be used to extract RNA but risks phenol contamination due to its manual pipetting of the separated supernatant layer. Use the protocol according to the manufacturer's instructions [section titled "Purifying RNA from Animal and Plant Cells" (LifeTechnologies, 2012)] with the following modifications:
Instead of performing “Lysis and Homogenization” steps, perform the following:
Aspirate culture media from adherent cells.
Wash twice with PBS. Bring culture plate to RNA extraction lab bench.
Note: RNA extraction should be performed on a separate bench from cell culture and other assays to avoid RNAse contamination from surfaces. Clean and wipe down all surfaces, have a dedicated set of pipettes for RNA work, and use RNAse/DNAse-free plastic consumables, especially if working close to DNA extraction kits with RNAse.
Aspirate PBS and add 300 μL of lysis buffer (containing 2-mercaptoethanol) for each 6-well plate (9.6 cm2). Discard PBS into the liquid waste container containing 10% bleach.
Ensure lysis buffer has lysed all cells on the plate (liquid is slimy/viscous and has no precipitate or cell pellet) and then transfer to homogenization tubes.
Note: Do not wait more than ~5 min to process the sample through the homogenization tubes, as this might reduce RNA yield.
Spin homogenization tubes in the centrifuge at 12,000× g for 2 min.
Proceed with "Binding, Washing, and Elution steps" with the cell lysate.
Elution of RNA and aliquoting
Add 30 μL of nuclease-free water to the cartridge.
Incubate at room temperature for 1 min.
Centrifuge at 12,000× g for 2 min.
Repeat steps 1–3 with eluted RNA.
Measure RNA content
Measure RNA concentration with a Nanodrop or comparable spectrophotometer.
Clean Nanodrop surface with nuclease-free water.
Add 1 μL of a blank (nuclease-free water).
Wipe off the water drop.
Add 1 μL of purified RNA to the Nanodrop surface. Close the lid and press Analyze.
Repeat steps c–d for each sample. High-quality RNA has an A260/A280 absorbance ratio of ~2.0 and an A260/A230 ratio of ~2.2.
Note: Low-yield RNA samples can be eluted a second time through the spin column, if samples were not incubated for 1 min prior to centrifugation. Low-quality RNA is usually a result of either RNA degradation or other compounds contaminating the sample from previous steps. For more troubleshooting, see the Troubleshooting section of the PureLink manual (LifeTechnologies, 2012).
Important: Aliquot RNA into 1 μg aliquots to avoid freeze-thaw cycles.
Eliminate gDNA contamination with DNase I treatment
Use protocol as outlined in the previous protocol (Srinivasaraghavan et al., 2022). Perform on each 1 μg aliquot.
Generate cDNA with a High-Capacity cDNA rev Transcription kit
Use protocol as outlined in the previous protocol (Srinivasaraghavan et al., 2022).
It is recommended to dilute cDNA to a 10 ng/μL working concentration.
Primer design and automated primer plating
Primer design
All primer design conditions are the same as previously described (Srinivasaraghavan et al., 2022), except for using the command-line version of the Primer3 software. Once set up, the command-line interface of Primer3 eliminates user error, generates primer pairs for different genes much more quickly, and automates the primer selection process. The use of the command-line interface is beyond this protocol's scope, but a few commands are needed to get started (Table 2).
Table 2. Basic command line functions to help with installing/using Primer3
Action Command Show current working directory pwd Enter a folder/directory cd *name of folder* Move up a folder/directory (exit a folder) cd .. List folder contents ls Make a new folder mkdir *name of folder Delete file rm *name of file* Tab Autocomplete file/folder name if it exists Use the command-line version of Primer3 software to design primer pairs.
Install the Primer3 software:
Method 1 (manual install)
i. Navigate to the Primer3 GitHub page (https://github.com/primer3-org/primer3).
ii. Under "Code," select "Download ZIP."
iii. Extract the folder to the local drive, not a cloud drive.
iv. Navigate to the extracted folder in the command line and run the following commands:
make
make test
Method 2 (MacOS command-line install)
i. Open Terminal.
ii. Install XCode command line tools (if not already installed) by entering the following command:
xcode-select –install
iii. Enter the following commands line by line into Terminal:
git clone https://github.com/primer3-org/primer3.git primer3
cd primer3/src
make
make test
iv. Primer3 is now installed.
Method 3 (Linux command-line install)
i. Follow Method 2, but instead of xcode-select --install, run the following command:
sudo apt-get install -y build-essential g++ cmake git-all
ii. Proceed with the rest of the steps from Method 3.
Navigate to the primer3 folder and create an "input.txt" file and "settings.txt" file by entering the following commands into Terminal:
touch input.txt
touch settings.txt
Run ./primer3_core ../example to ensure the program runs correctly.
Edit the settings.txt file by following the format listed under "20. Primer3 settings file format" on the Primer3 website and with the settings values listed in SupplementalTable 2.
Edit the input.txt file described under "13. Input and output conventions" on the Primer3 website. This will serve as the template sequence for which Primer3 will pick primers (Table 3).
Table 3. Sample input file containing gene name, template sequence to pick primers from, and the target region
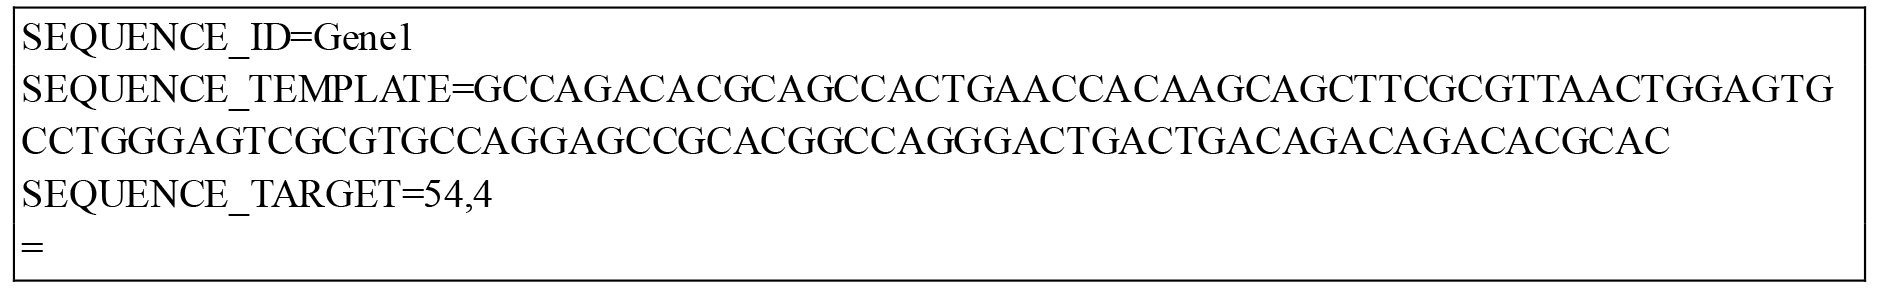
Note: Setting the sequence target around an exon-exon junction at position 54 of the sequence will require the program to design the primers surrounding this location for the listed number of nucleotides. In the above case, the program will be required to design primers that surround the four base pairs around sequence number 54 (highlighted in yellow).
Go to the NCBI website and choose the gene of interest, taking note of the exon junction locations and coding sequence locations. For additional detail, see Section E. Primer Design (Srinivasaraghavan et al., 2022).
Copy and paste the sequence into the "SEQUENCE_TEMPLATE" section of the input.txt file and choose a target location.
Note: The sequence must be formatted in a continuous string without newline characters. To remove newline characters from the sequence:
i. Download the FASTA file.
ii Navigate to the file in the terminal and run the following command, where sequence.txt is the FASTA file:
tr -d ‘\n’ < sequence.txt
In the terminal or command line interface, navigate to the primer3 folder (if not already in there) and run the following command:
./src/primer3_core --p3_settings_file settings.txt input.txt --output output.txt
i. This runs "primer3_core" in the /src/ folder, using the input file "input.txt," the settings file "settings.txt," and output file in the /output/ folder called "output.txt".
Note: More arguments are described in the section "Command line arguments" on the Primer3 website. The input file does not need a flag.
ii. Resulting primer results are printed onto the output.txt file that is designated above.
Run quality control on primer results to find optimal primer pairs as stated in the original protocol (Srinivasaraghavan et al., 2022):
Beacon designer
Checks for primer dimers and self-dimers. Ensure ΔG values are >-3.5 (more positive).
In-silico PCRChecks if primers amplify the correct regions in the genome.
IDT UNAfold
Checks if the amplified product produces any secondary structures, such as stem loops. Ensure ΔG >3.5.
Order primers at 40 nmol without purifying.Reconstitute primers in nuclease-free water to 100 μM.
Make separate working concentrations of mixed forward/reverse primers at 1.5 μM for 384-well plating.
For each gene, combine the forward and reverse primers and nuclease-free water (Table 4). For a 5 μL SYBR Green reaction mix, 2 μL of 1.5 μM primer solution will be needed to make a 300 nM primer concentration. Adjust volumes.
Table 4. Diluting forward and reverse primer solutions
Reagent Volume (μL) Fwd primer (100 μM) 22.5 Rev primer (100 μM) 22.5 Nuclease-free water 1,455 Total volume 1,500 - Store stock 100 μM primer solutions at -20 °C.
Primer plating
We developed three different approaches to plating primers:
1. Manual pipetting
2. Multichannel pipetting
3. Automated
While primers can be plated in any position and order, we find it most efficient and straightforward to plate them in an order consistent across all samples (Figure 2). It also helps in reducing pipetting errors.
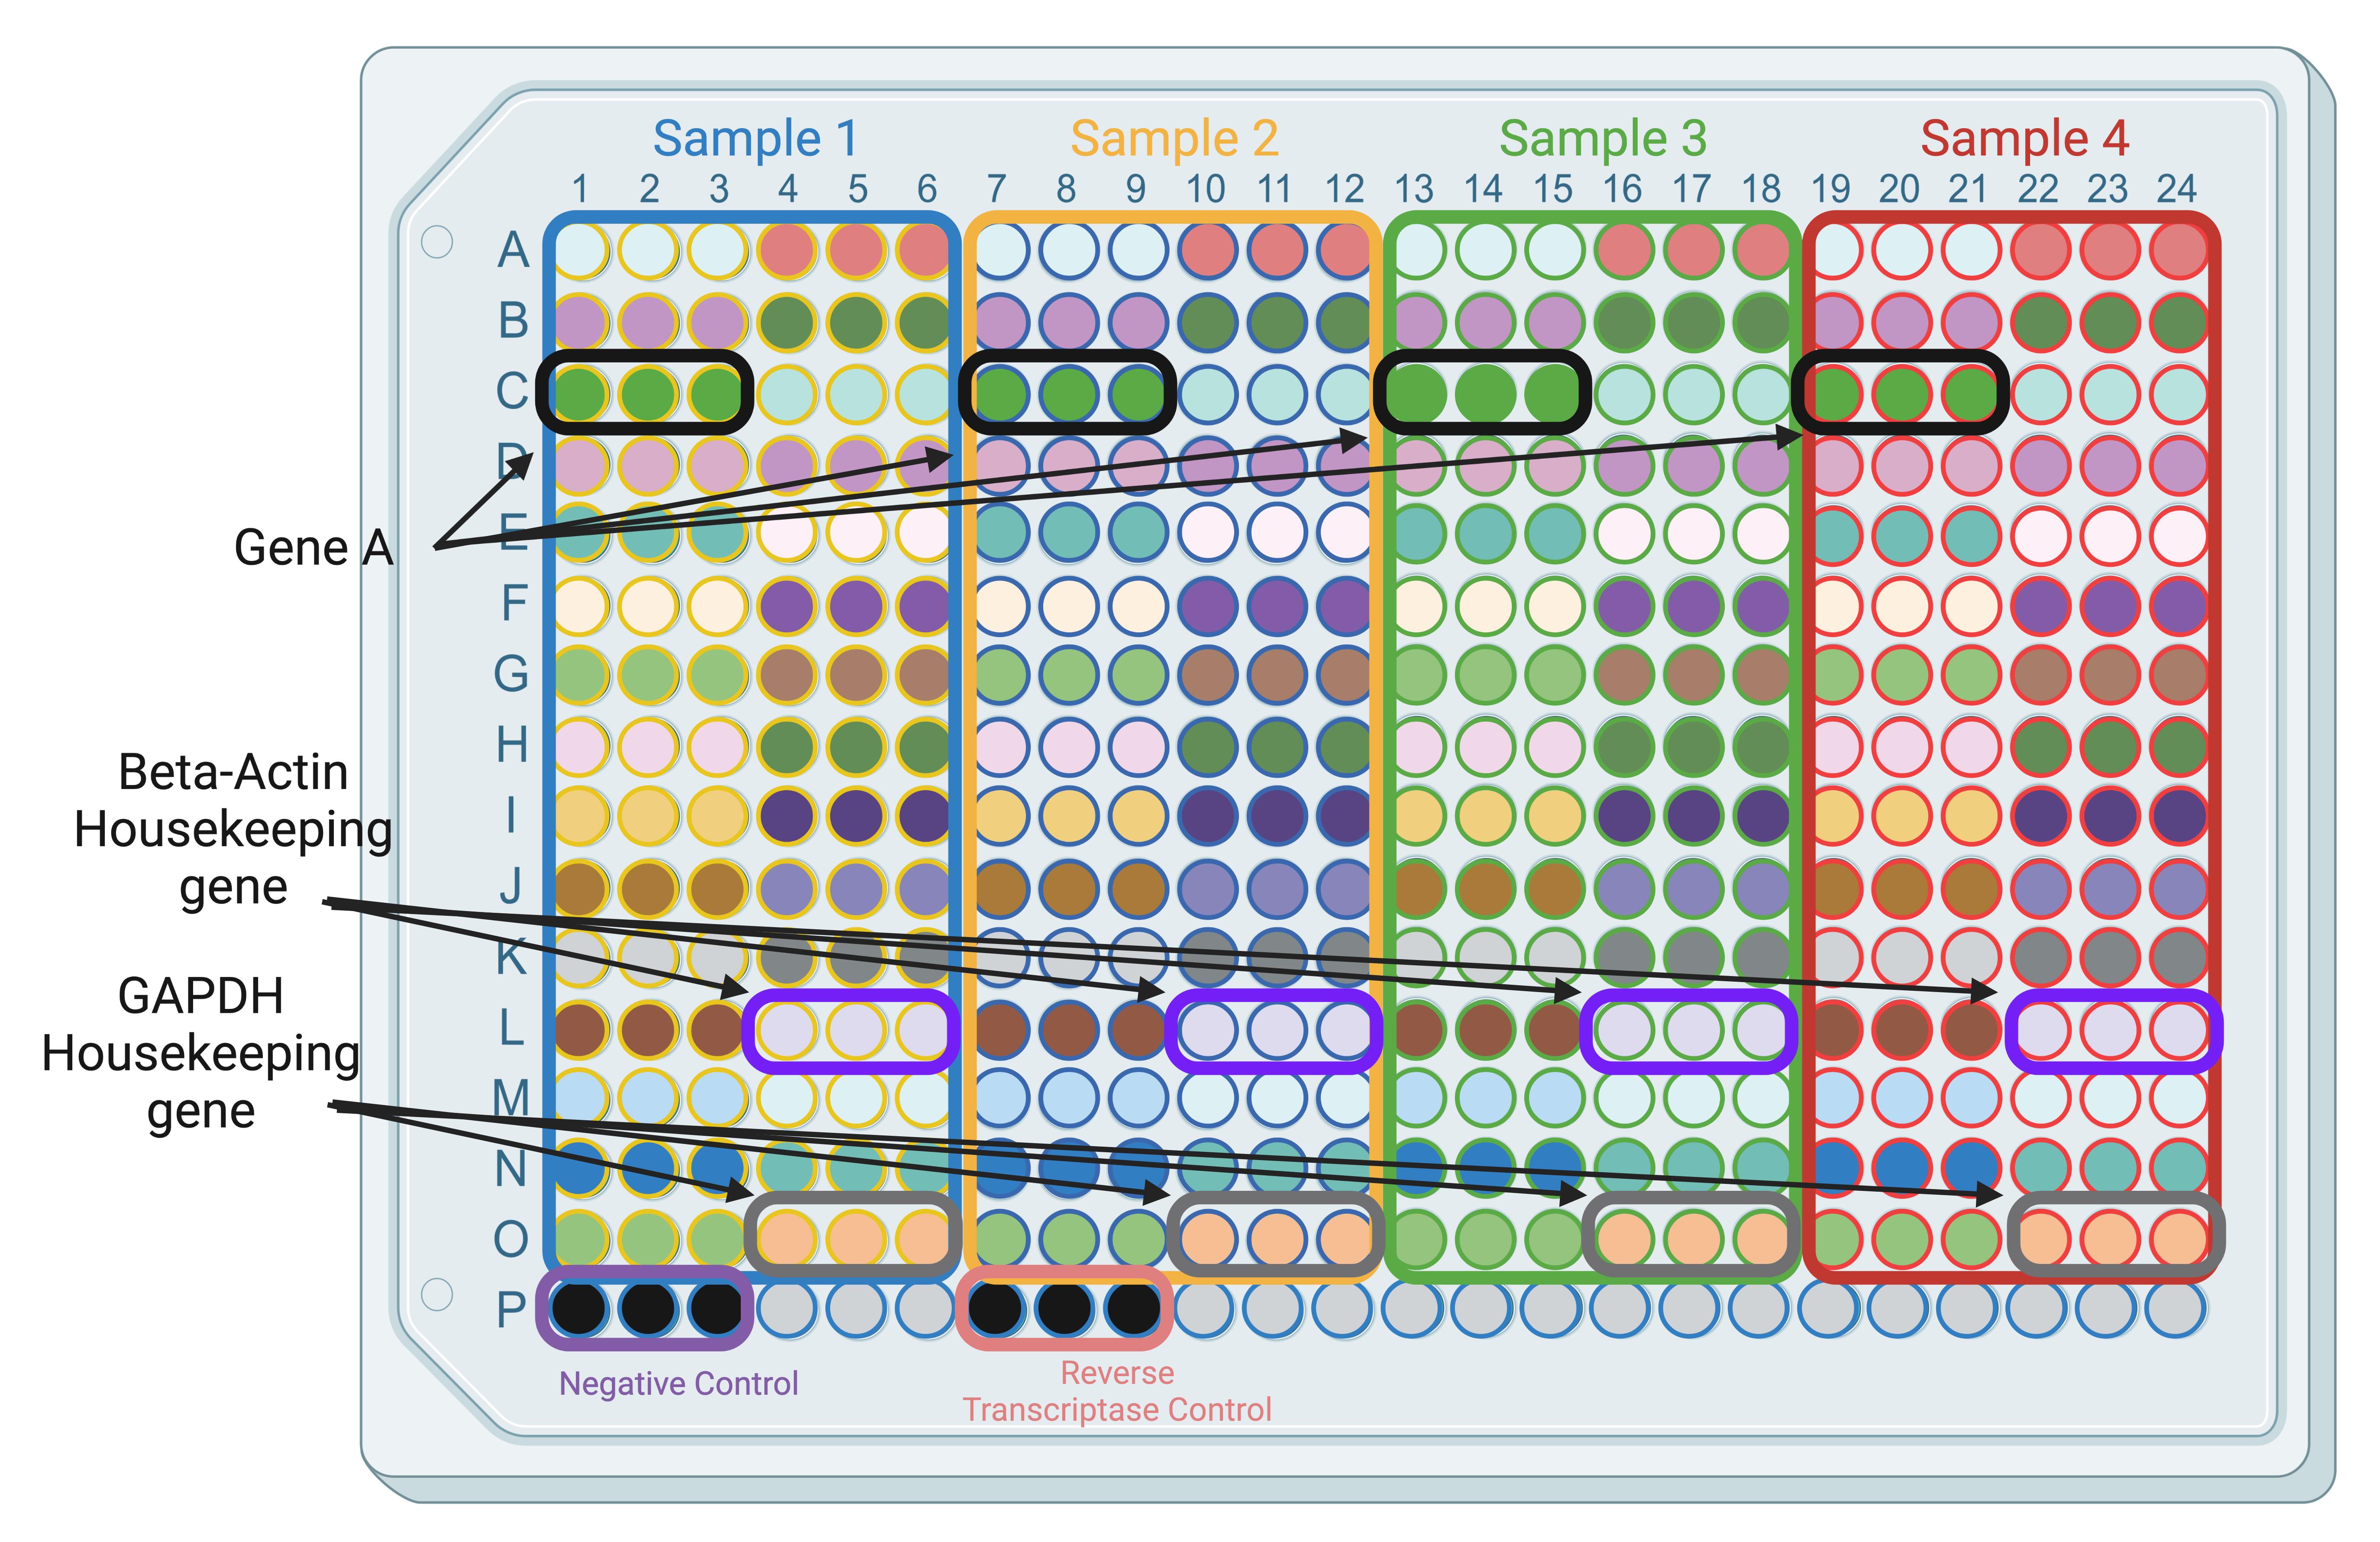
Figure 2. Example plate template for SYBR Green. Each filled colored circle is a unique gene; colored squares represent a different cDNA sample. Leave the bottom row for controls.
Manual pipetting with PlatR pipetting aid
This system is ideal for small-scale pipetting with single-channel pipettes on 384-well plates. It consists of three components (Figure 3):
i. Tablet and tablet stand.
ii. Plate holder.
iii. Foot pedal.
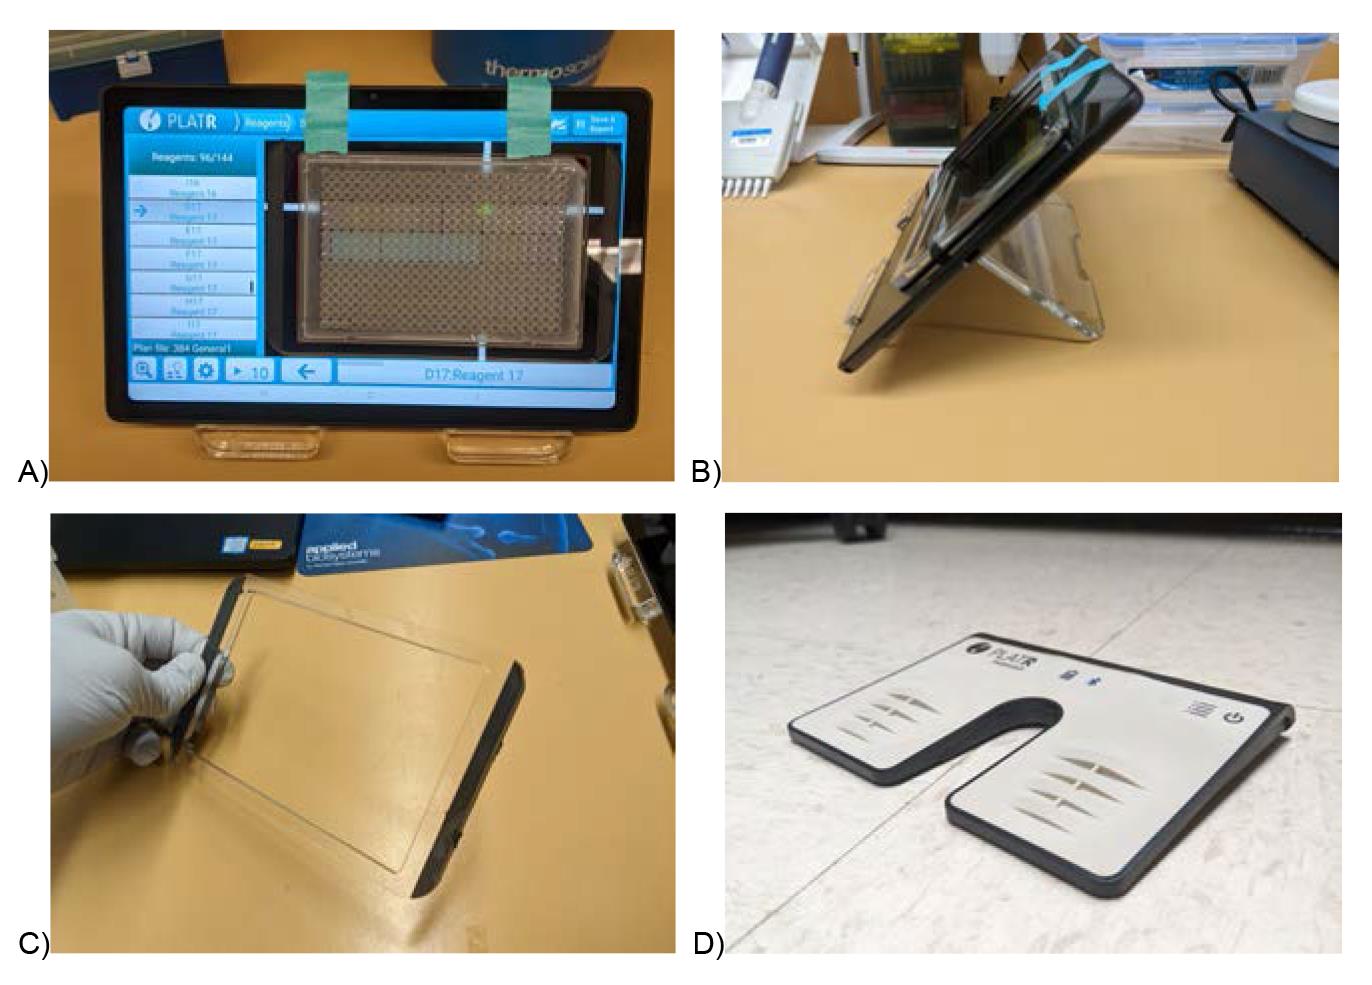
Figure 3. PlatR pipetting aid setup to reduce manual pipetting errors in 96 and 384-well plates. Front (A) and side (B) setup of the PlatR pipetting aid. Plates are held in place by the adhesive-backed and removable plate holder (C). A foot pedal (D) is used to advance to the next well, which frees up hands. All these together increase ergonomics, pipetting consistency, and reduce user error.Place tablet on tablet stand.
Open the app and create a new 384-well plate.
Select the Reagents tab and create/assign primers to each well (Figure 4); then, select the Samples tab to assign cDNA/SYBR Green samples to each well (Figure 5) (How to set up your pipetting protocol | Pipetting Aid PlatR, 2021).
Attach the plate holder to the tablet and place the plate in the holder.
Connect the foot switch via Bluetooth and place it on the ground.
Proceed with pipetting primers or master mix.
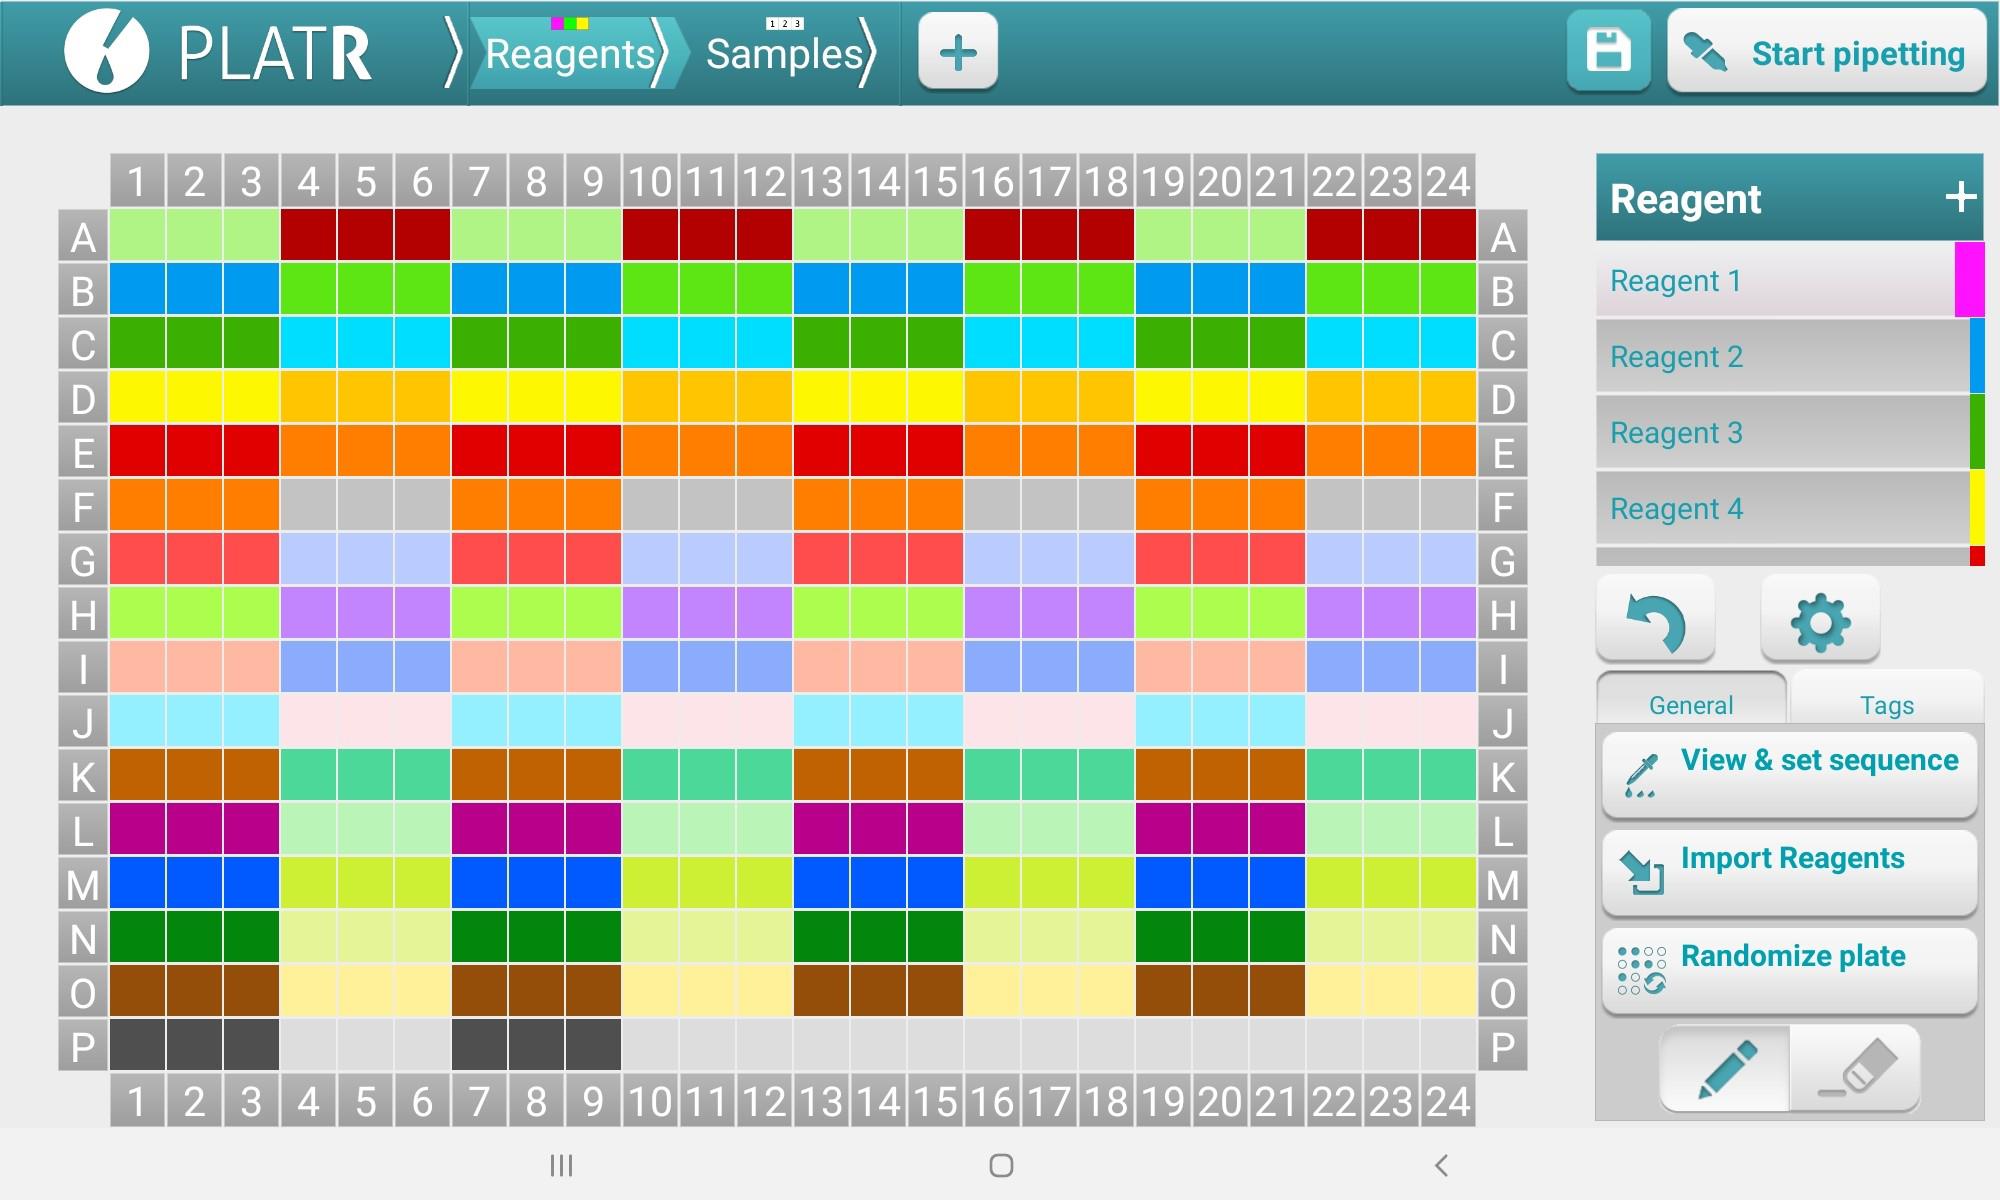
Figure 4. PlatR Reagents setup screen for designating primers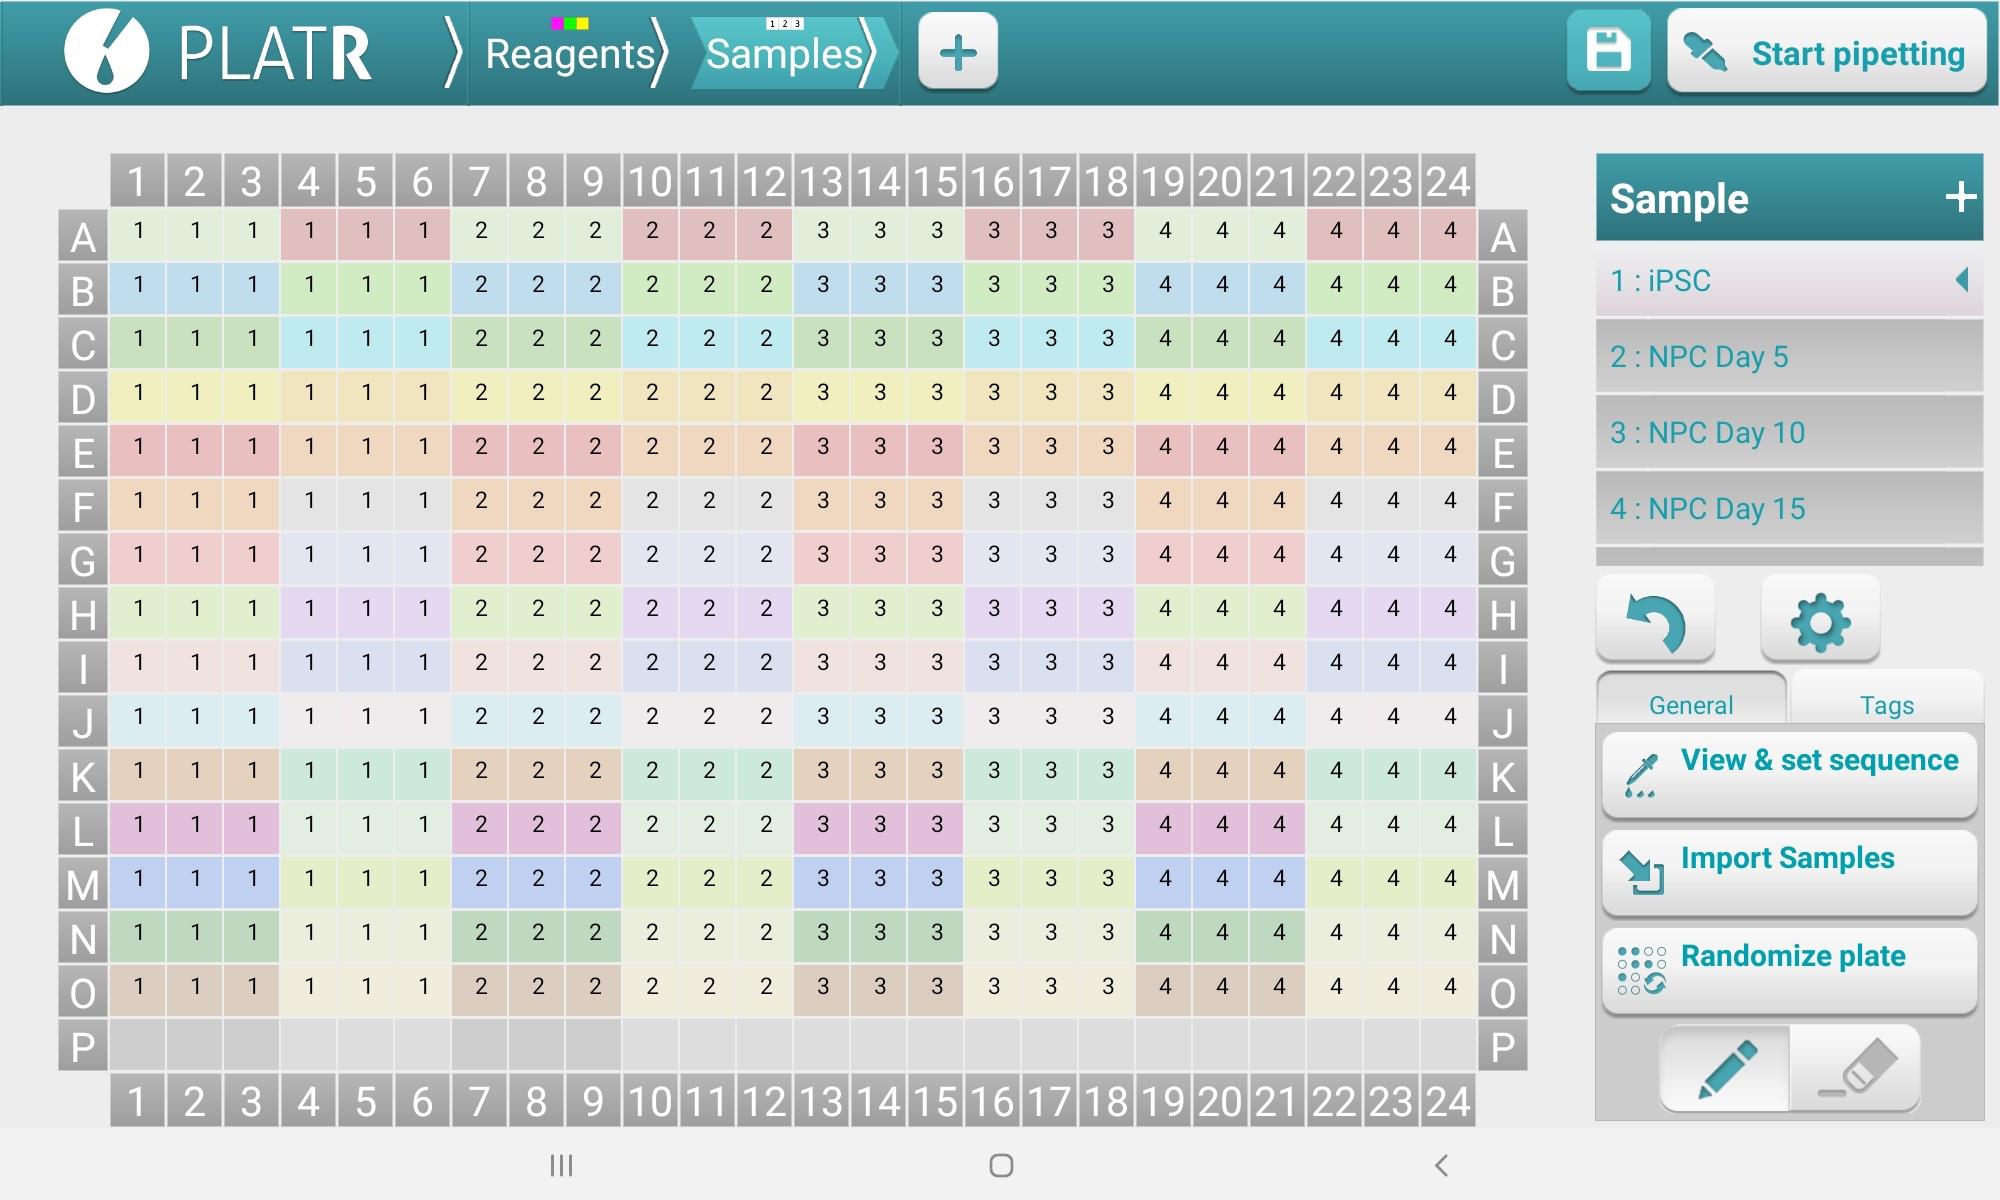
Figure 5. PlatR Samples setup screen for designating cDNA/SYBR Green master mixElectronic multichannel pipetting with E1-ClipTip adjustable tip-spacing multichannel
This system can be supplemented with the PlatR pipetting aid.
On the pipette, choose "Presets" -> "Stepper" and adjust the volume per step to 2 μL.
Proceed with pipetting as usual.
Note: Ensure tips touch the bottom of the well when pipetting, especially for such low volumes.
Integra ASSIST PLUS pipetting robot
Plate design: the pipetting robot picks up/pipettes eight wells at once and cannot rotate, so choose a plate design/pipetting scheme that allows pipetting 8 wells in one direction. The 384-well plates in slots B and C can be rotated, but not the working solution of primers in slot A (Figure 6). See an example plate design below. For a 4-sample plate, columns 1–6 contain one sample, 7–12 contain another sample, etc. Eight different primers will be plated in rows A–H or I–P in triplicates.
Download, install, and open Integra VIALAB to design automated pipetting instructions for the ASSIST PLUS (“Download VIALAB | INTEGRA,” 2018).
i. Create a new plate and select "3 Position Universal Deck."
ii. “Choose Pipette” -> Voyager 8-channel 12.5 μL, part number 4721.
iii. “Choose Tips” -> 12.5 μL GripTip LONG, part number 6403.
iv. Under the gray square labeled "A", select "Choose labware." This will be used as a reservoir containing primers. Choose a 96-well plate from the list, as dimensions will be different between different 96-well plates.
v. In the gray boxes labeled "B" and "C," select "Choose labware” -> "384-microampTM Optical plate." Click the two circular arrows button to rotate the plate as needed (Figure 6).
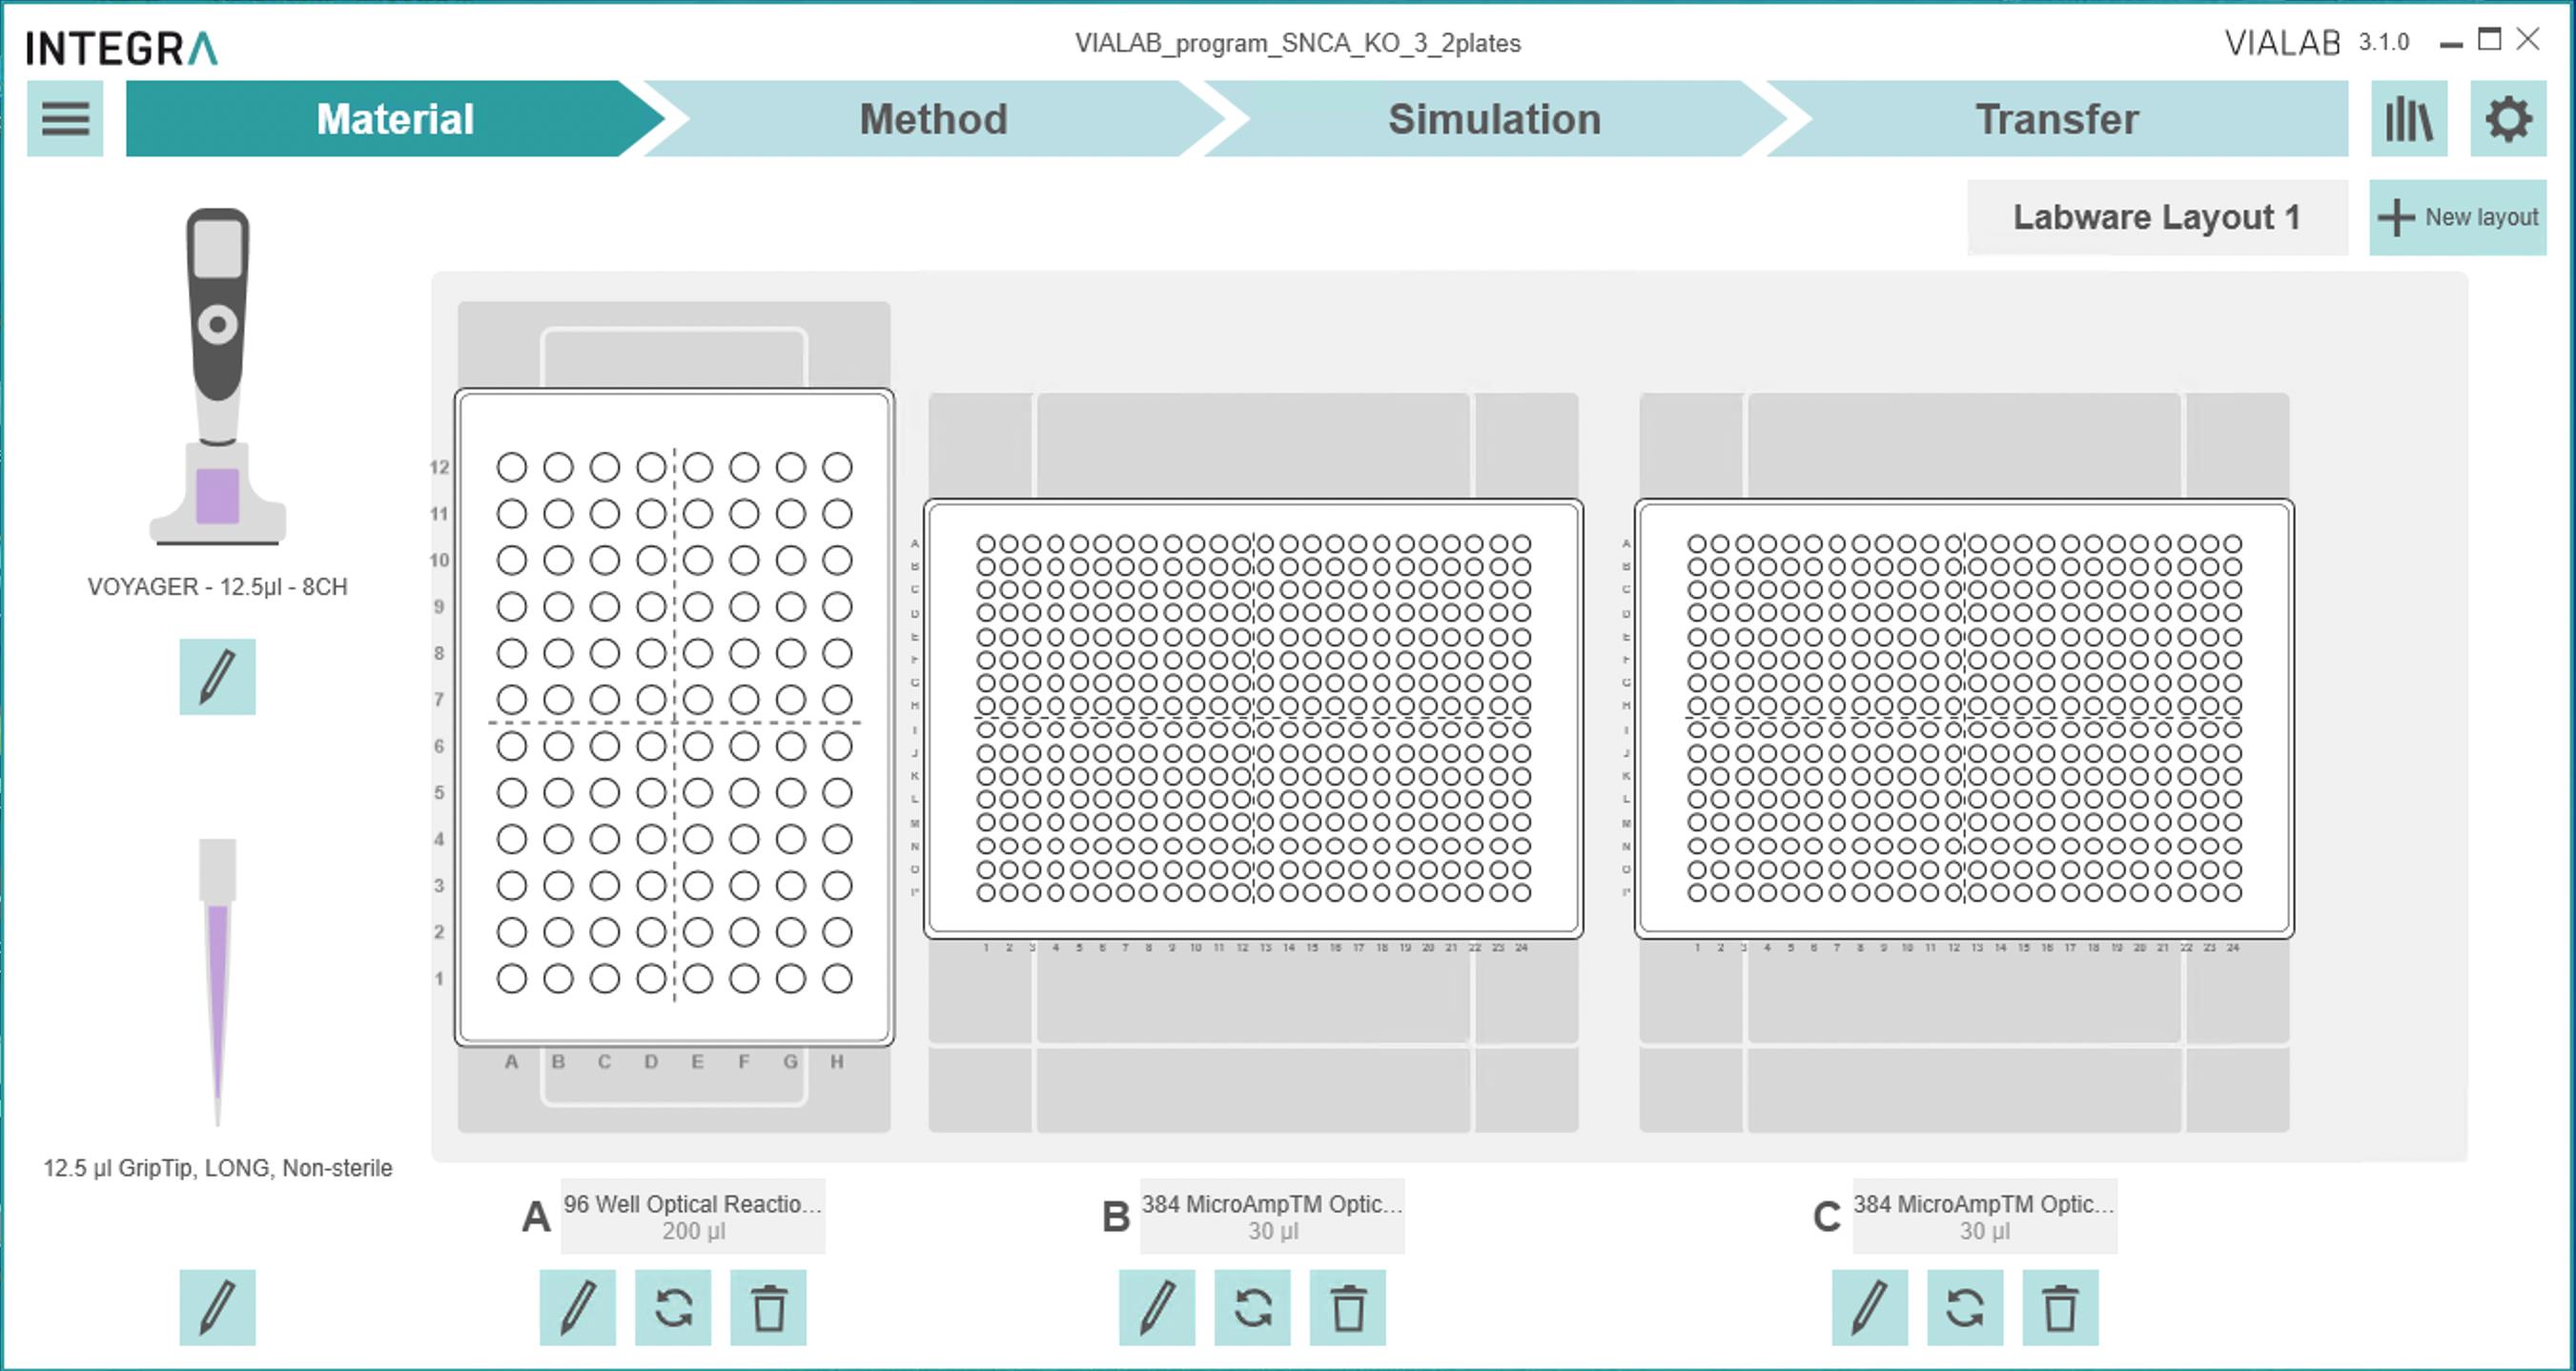
Figure 6. Materials tab on VIALAB to specify materials (pipette, tips, plates, etc.)vi. Choose the Method tab at the top.
vii. With the "Initial Volumes" block selected, select all wells of the stock primer solutions to be used. Enter the initial volume.
viii. Click the "+" button and select the "Repeat Dispense" step.
1) In the Pipetting location tab (Figure 7):
(a) "Edit Source" -> select the first eight wells of the 96-well plate from which to choose primers.
(b) "Edit Target" -> click or drag the wells on the right to pipette to the 384-well plate. Select tip spacing and pipetting direction.
(c) Select the "close" tip spacing option. Select "Pipetting direction" to the right.
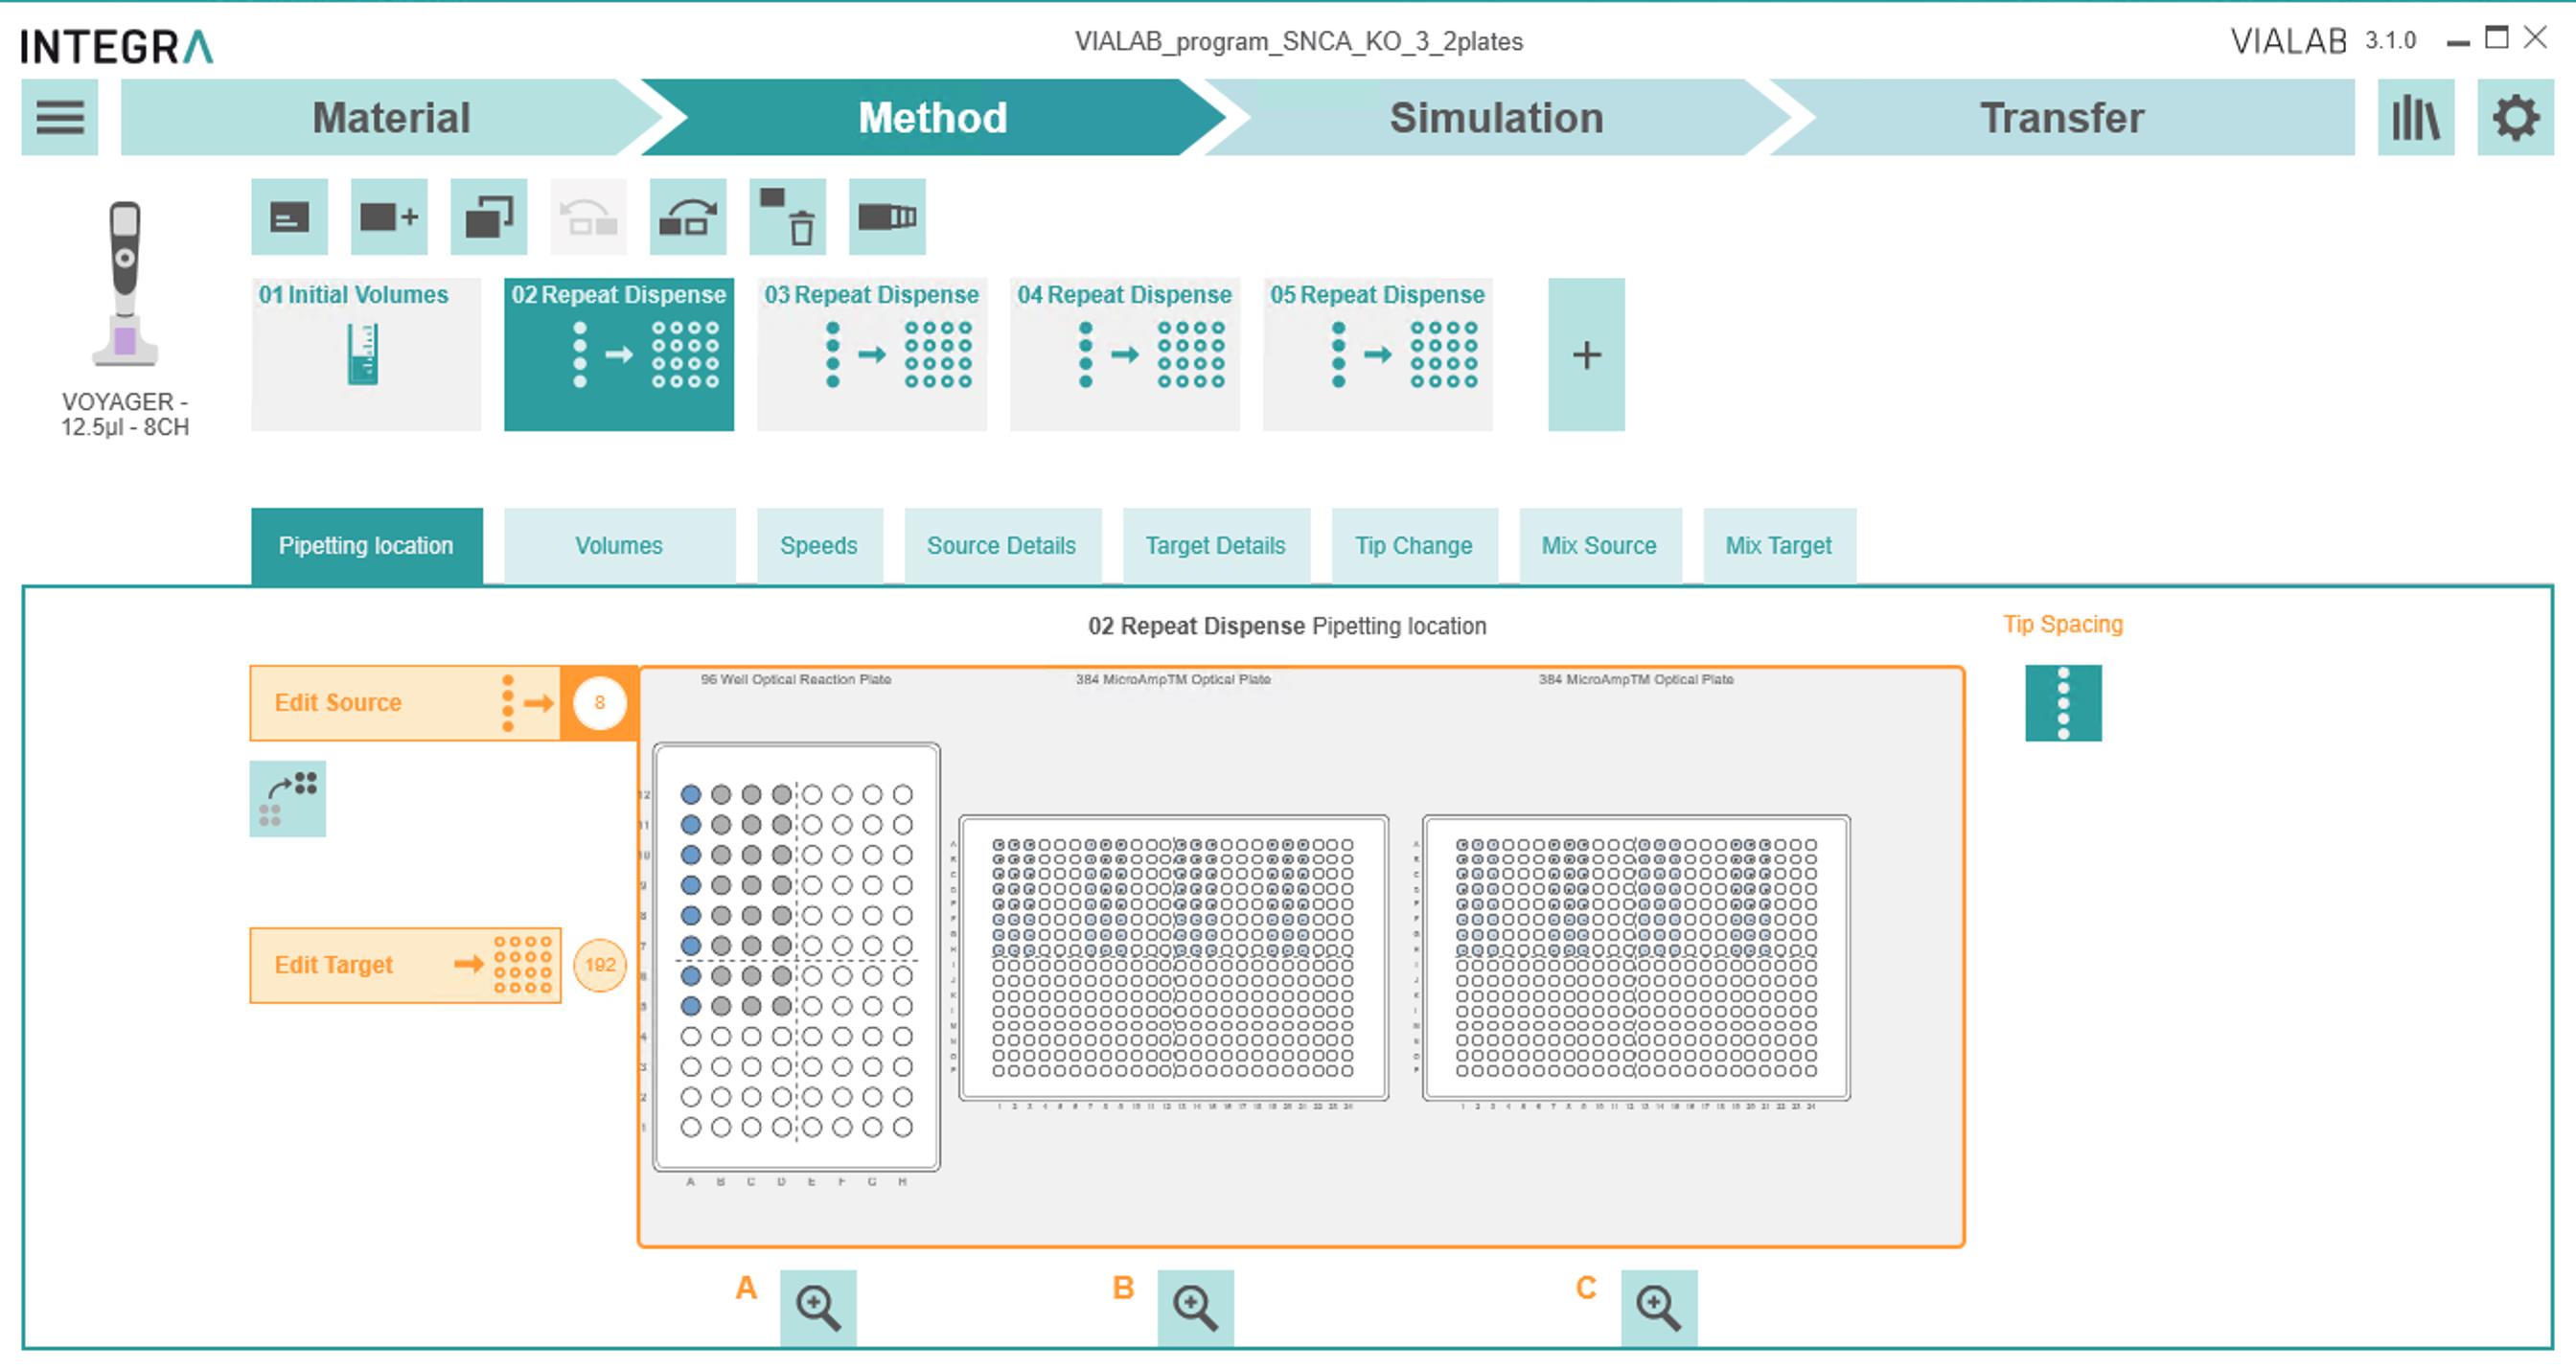
Figure 7. Initial Volumes block under the Methods tab2) In the Volumes tab (Figure 8):
(a) If the stock primers are 1.5 μM forward/reverse mixed primers, select "Volume" -> 2.00 μL.
(b) Select all "Post Dispense," "Volume," and "Pre-dispense" settings as in Figure 8:
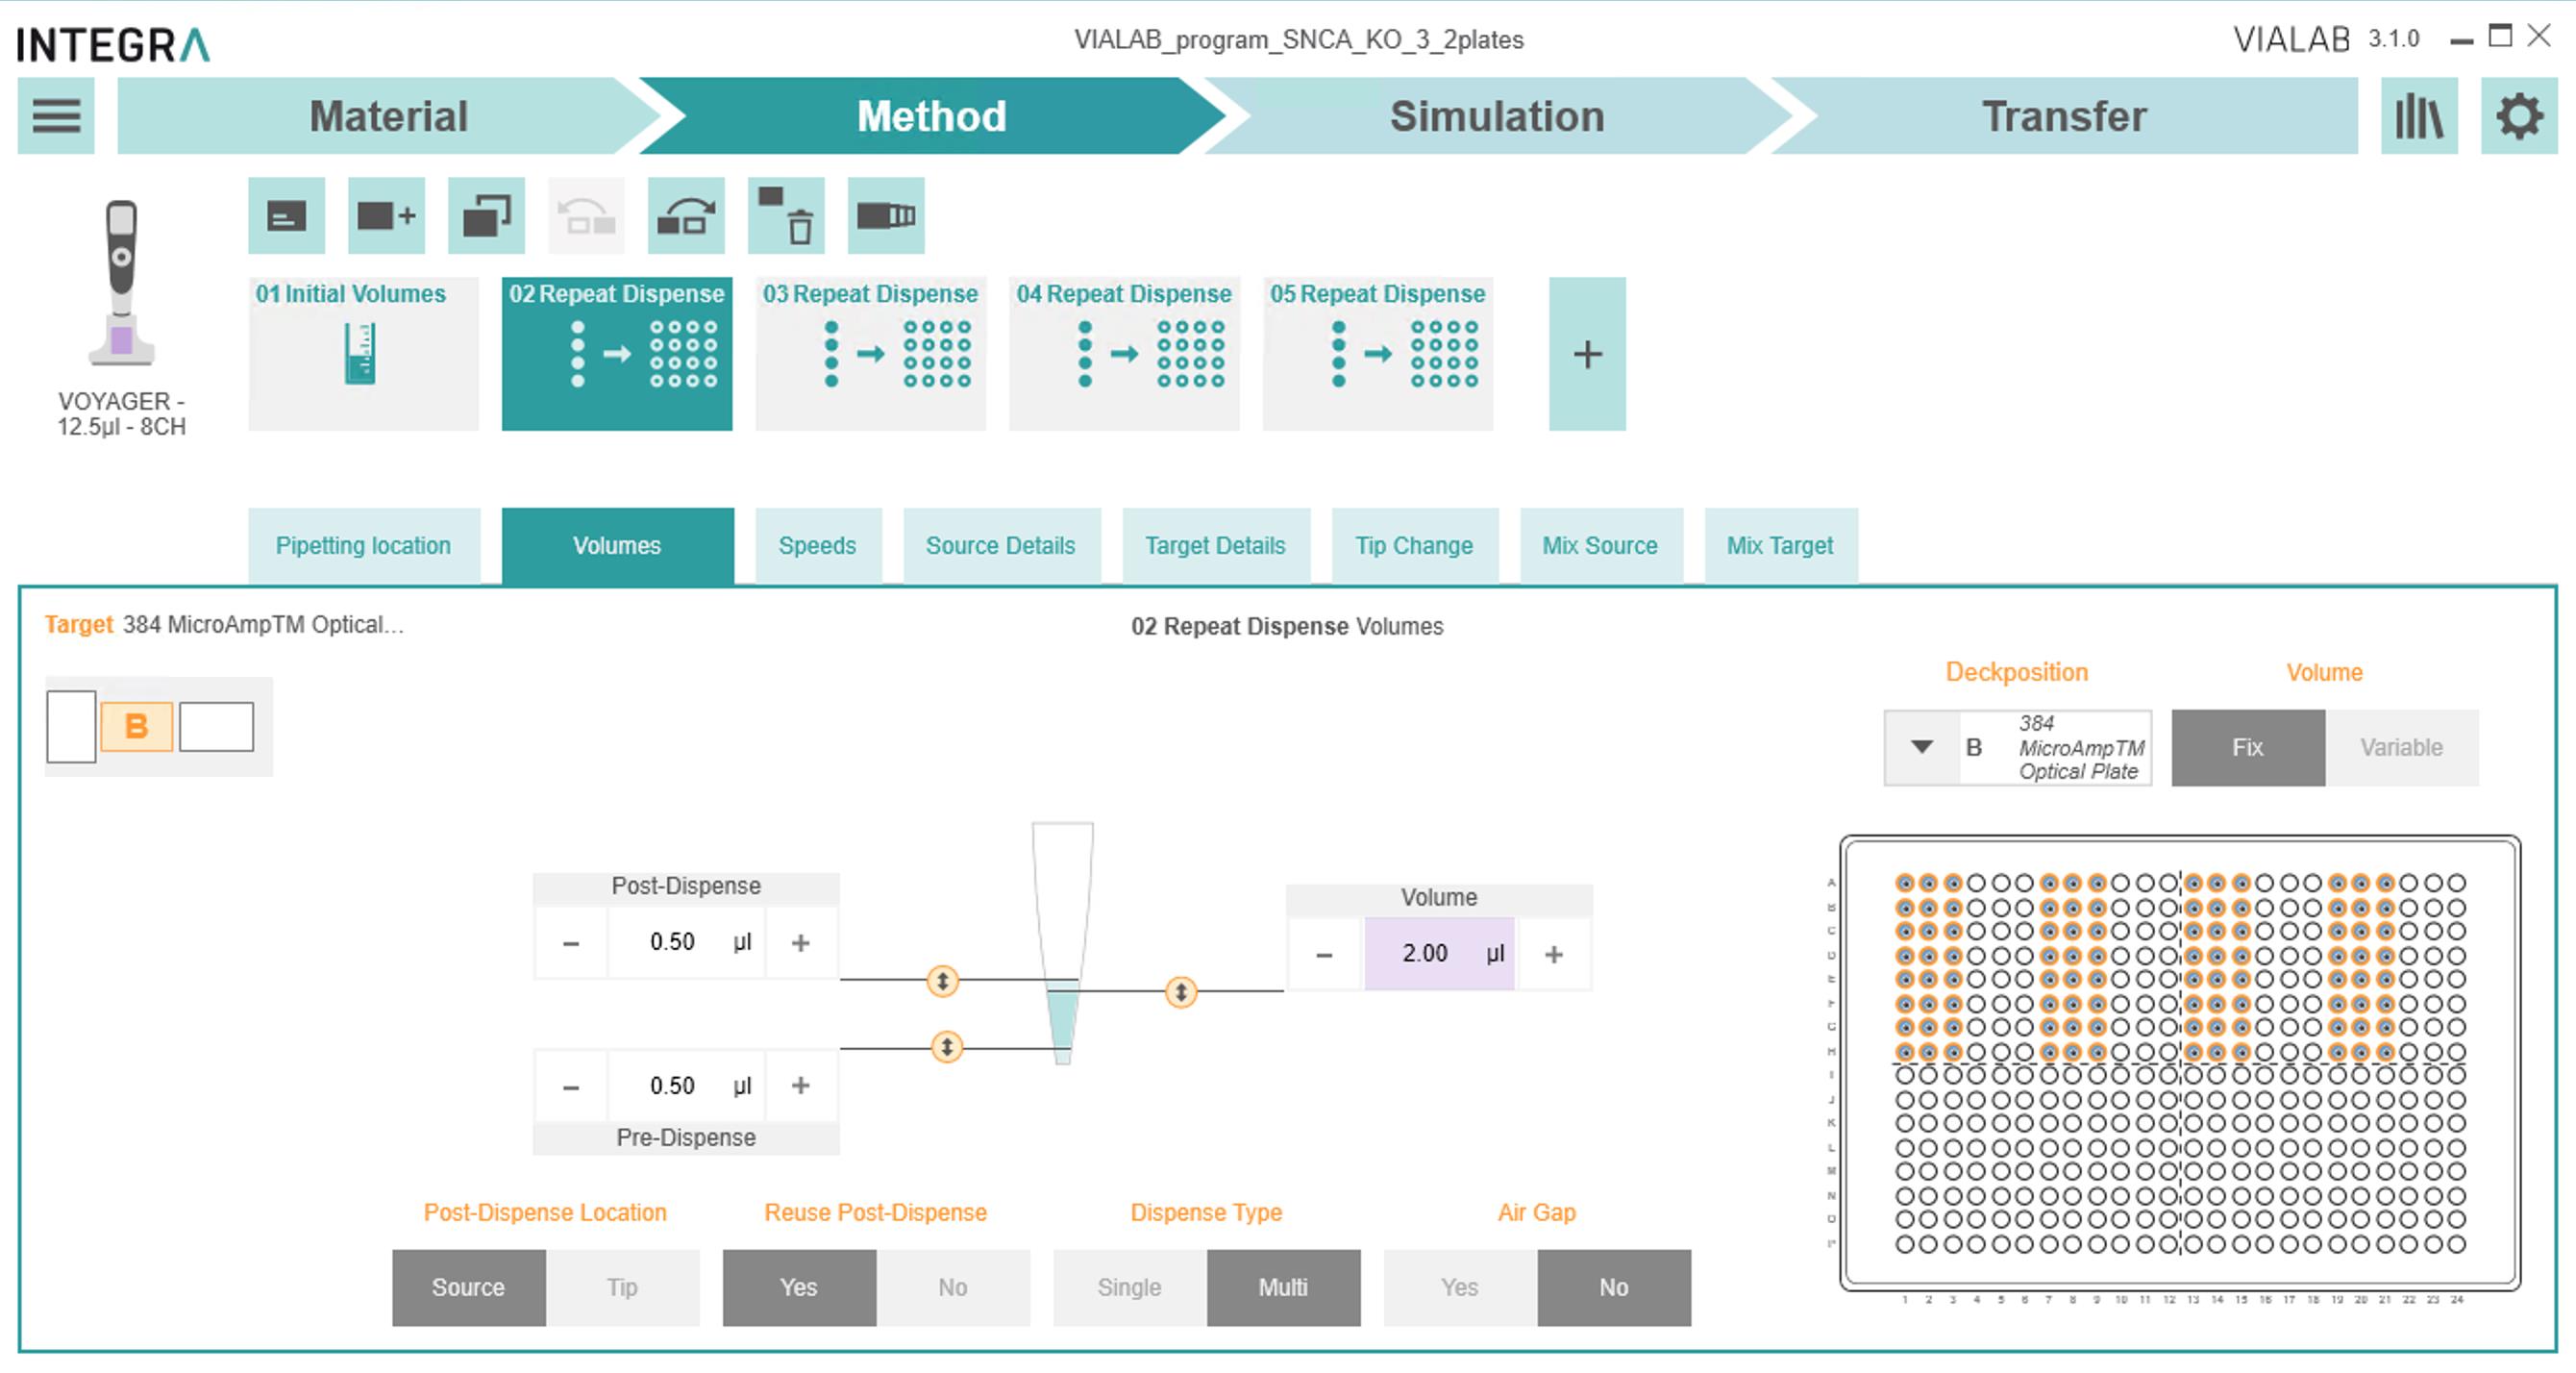
Figure 8. Volumes tab to designate the volume to dispense, as well as pre- and post-dispense to ensure accurate pipetting3) In the Source Details tab:
(a) Pipetting Height -> 3.0 mm
(b) Safety Bottom Offset -> 2.0 mm
4) In the Target Details tab:
(a) “Pipetting Height” -> 1.8 mm
(b) “Safety Bottom Offset” -> 0.7 mm
(c) "Tip Touch" tab:
“Tip Touch Height” -> 1.6 mm
5) Keep all other settings as default.
6) Copy and repeat these settings for every set of eight primers to pipette.
ix. Select the "Simulation" tab to check if the pipette moves as intended.
x. Connect the pipette to the ASSIST PLUS.
xi. On the pipette: Toolbox -> Communications.
xii. In the "Transfer" tab, select the connected device.
xiii. Begin the pipetting program.
After plating primers, centrifuge plates at 200× g for ~2 min. Then, dry and store covered at room temperature.
Run qRT-PCR
Use qRT-PCR settings and protocol as indicated in Srinivasaraghavan et al. (2022), except for the following:
Change the plate type to 384-well.
Combine nuclease-free water, cDNA, and SYBR Green master mix into a 5 μL reaction mix for each well (Table 5).
Table 5. SYBR Green master mix reaction volumes per well
Reagent Volume (μL) PowerUp SYBR Green Master Mix 2.5 cDNA (10 ng/μL) 1.0 Nuclease-free water 1.5 Total per reaction 5.0 After adding the Master Mix and cDNA combination to each well, spin down the plate at ~2,000 rpm for ~3 min to eliminate air bubbles in the reaction mix.
Important: Air bubbles at the bottom of the well will result in inaccurate results.
Cover the plate with an optical adhesive cover and place it in the QuantStudio instrument.
Data analysis
We use the QuantStudio software to analyze the data, such as calculating mean Ct, Ct SE, ΔΔCt, and fold-change if target and housekeeping genes for both treated and untreated samples are present on the same plate. We run each gene and sample combination in triplicate wells. The fold change of each gene of each sample is calculated with the following equation:

where each Ct is the mean Ct. In other words,

Since fold change is calculated using mean Ct values from differentiated neurons (treated) and iPSC samples (untreated), some genes such as Neurofilament or MAP2 are not expressed in iPSCs. This results in Ct values of "undefined," since undetected mRNA might take more than 40 cycles to amplify, and thus make it difficult to calculate the fold change. To circumvent this, Ct values for undefined results are arbitrarily set to 35 or higher, since Ct values above 35 likely represent low or undetectable mRNA expression levels in the sample.
Alternatively, the data can be analyzed using R. By using R packages such as gdata, tidyr, and dplyr, .xls files can be imported into RStudio and analyzed. This method has not been implemented here yet.
To demonstrate the high throughput capabilities of this assay, iPSCs from the KOLF2.1J cell line were differentiated into three neuronal subtypes: developing cortical, developing striatal, and developing mesencephalic floorplate progenitors for 20 days in vitro (Calatayud et al., 2022). Developing mesencephalic floorplate progenitors were differentiated with two different concentrations of Sonic Hedgehog (SHH), as well as an SHH alternative, Smoothened agonist (SAG) (Figure 9). All five samples were differentiated simultaneously. Each gene for each sample type was amplified as technical triplicates. The advantage of using electronic pipettes and pipetting aids is reducing pipetting volume variability, which is crucial to ensuring consistency among low-volume technical replicates.
Each plate can be customized to contain unique layouts with different genes. The number of genes included on a given plate varies depending on the number of samples. As shown in Figure 3, a consistent plate design helps to reduce pipetting errors and maintain consistent results. For example, the plate in Figure 2 can fit four samples, each with 30 genes in triplicates.
Results
While throughput has increased, reagent use has not. Whereas the SYBR Green assay on 96-well plates previously used 20 μL per reaction, this assay only used 5 μL of cDNA/SYBR Green master mix, thus increasing the maximum number of reactions per plate from 96 to 384.
Previously, forward and reverse primers were designed using the graphical user interface version of the Primer3 website. The command-line interface of the Primer3 software is identical in parameters and results to the website, while being more suitable for designing multiple primers concurrently. Several files are uploaded into the program to simplify the primer design process: a settings file, an input file, and an output file. Since primer conditions and settings are not changing for SYBR Green, a settings file containing all those primer conditions is created and fed into the program, as opposed to manually entering conditions (max/min melting temperature, ion concentrations, etc.). An input file is also provided to the system, containing the gene name, the RNA sequence or template to choose primers from, and a target region. The gene sequence can be imported as a FASTA file from the NCBI website, and the target is preferably chosen based on exon-spanning regions. Finally, an output file can be specified to save results for later review. This serves to view past results and is an easy way to update results if the selected target region does not have suitable primer pairs. This program creates a digital trail that can be easily referenced if the primer conditions (e.g., secondary/tertiary structures form) are not optimal.
The use of various electronic pipetting aids increases pipetting ease, throughput, and ergonomics. Using a single-channel pipette on such small 384-size wells introduces high variability of volumes, user error, and inefficient use of time, and places strain on hand/arm ergonomics. The PlatR was introduced initially as a quick, cheap, and easy alternative to easily keep track of which well is being pipetted, since all reagents are a similar color and wells are extremely small and tight. The use of adjustable tip-spacing electronic multichannel pipettes further improves ergonomics and pipetting consistency by decreasing the variability of pipetted volumes across multiple wells. Adjustable tip spacing allows versatile pipetting from Eppendorf tubes or 96-well plates into 384-well plates.
This assay was also designed to emphasize rigor and reproducibility. We aimed to eliminate as many opportunities for human error and variability as possible, including implementing the command line interface for the primer design and using multichannel electronic pipetting for primer plating. Differences in manual pipetting, especially at low volumes in a 384-well plate, can contribute to variability between technical replicates. While other commercial arrays include more genes per plate, our plate design contains fewer markers to maintain multiple replicates. Every gene and sample combination is always performed in triplicate. In addition, both differentiated and undifferentiated samples and housekeeping genes are included on each plate to reduce plate-to-plate variability and normalize target gene expression.
Application to iPSC-derived neuronal subtypes
KOLF2.1J iPSCs were differentiated into three neuronal subtypes: developing cortical, striatal, and developing floorplate progenitors for 20 days. As shown in Figure 9, there seems to be an upregulation of cortical developmental markers among cortical and striatum progenitors. We also detect the upregulation of ganglionic eminence developmental markers among cortical and striatal progenitors. These results allow us to quickly modify the differentiation protocols or terminate the experiment when used as a quality control measure of an existing protocol.
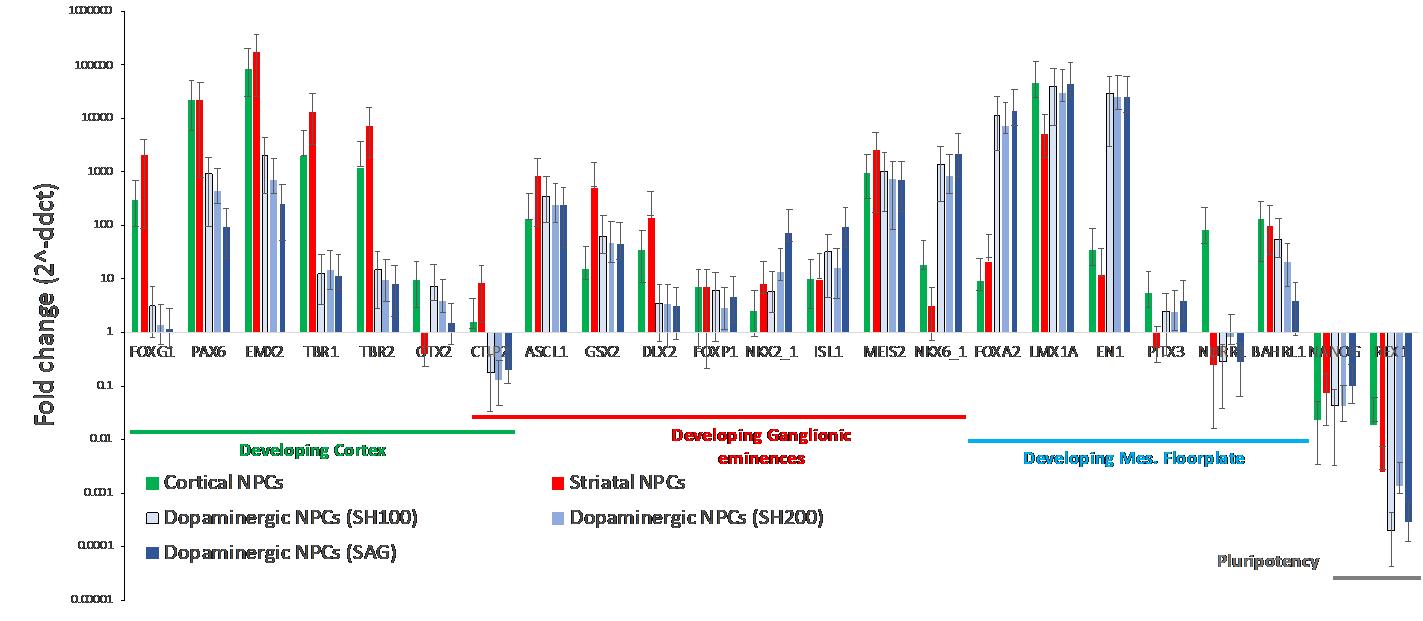
Figure 9. Fold-change mRNA gene expression of cortical, striatal, and floorplate neuronal progenitors normalized to KOLF2.1J iPSCs (Pantazis et al., 2022)
Pitfalls and future directions
As with any non-specific dsDNA binding molecules, a disadvantage of SYBR Green is the potential for SYBR Green to bind to primer dimers or other non-specific dsDNA products. However, this is mainly prevented by the several in silico quality control steps, Beacon Designer, In-Silico PCR, and IDT's UNAFold, which limit primer dimer formation, ensure the correct region is amplified, and reduce amplicon nucleic acid folding (Srinivasaraghavan et al., 2022). Using SYBR Green without these quality control methods can result in overestimating the target or even a false positive, as more fluorescence is detected from the non-specific binding than that bound to the target of interest. In addition, there can be a reduction in dynamic range as non-specific binding increases the noise, which leads to a more minor perceived difference between the controls and sample/genes of interest.
As throughput increases, so will the amount of data to analyze. While the QuantStudio software and Microsoft Excel are sufficient for analyzing data with one reference sample or data from one or two plates, increasing the number of samples, genes, and plates makes data analysis more sophisticated beyond what an Excel spreadsheet can handle. Thus, as mentioned before, utilizing R, a programming language commonly used by bioinformaticians, will be the subsequent development to make data easier to organize and analyze. Passing the Excel spreadsheet through an R script that manages exported QuantStudio data would make analyzing statistical data, generating graphs, and pooling multiple runs together more effortless.
In the case of low conversion or differentiation rate, the small percentage of differentiated cells would still result in elevated lineage-specific marker expression compared to iPSCs, especially when iPSCs do not express those markers. Therefore, the qPCR array needs to be combined with additional quality control steps, such as visual check and/or FACS analysis for differentiation efficiency.
Optimizing the SYBR Green assay to 384-well plates increases throughput considerably by increasing the number of genes and samples that can be analyzed in a single experimental run, while using the same quantity of reagents as a standard 96-well SYBR Green array. In addition, because this can be performed in a relatively short time, this assay is ideal for time-sensitive scenarios, such as analyzing gene expression during a differentiation protocol.
Acknowledgments
This was supported by the California Institute for Regenerative Medicine Bridges program grant #EDUC2-08394.
Figure 1 was created with BioRender.com.
This protocol is an advancement for automation and throughput from Srinivasaraghavan et al. (2022).
Competing interests
Nothing to disclose.
Ethics
The human KOLF2.1 iPSC line was used in accordance with the Stem Cell Research Oversight protocol 754 (Stanford University).
References
- Calatayud, C., Muñoz-Pedrazo, E., Fernández-Gallego, S. and Verstreken, P. (2022). Modular generation of cortical, striatal and ventral midbrain progenitor cells [WWW Document]. protocols.io. URL https://www.protocols.io/view/modular-generation-of-cortical-striatal-and-ventra-b54cq8sw (accessed 8.19.22).
- Download VIALAB | INTEGRA [WWW Document], 2018. URL https://www.integra-biosciences.com/united-states/en/pipetting-robots/assist-plus/download-vialab (accessed 8.30.22).
- How to setup your pipetting protocol | Pipetting Aid PlatR, 2021.
- Life Technologies (2012). PureLink® RNA Mini Kit. Life Technologies, Carlsbad.
- Srinivasaraghavan, V., Zafar, F. and Schüle, B. (2022). Gene Expression Analysis in Stem Cell-derived Cortical Neuronal Cultures Using Multi-well SYBR Green Quantitative PCR Arrays.Bio-protocol 12(14): e4283.
Article Information
Copyright
© 2023 The Author(s); This is an open access article under the CC BY-NC license (https://creativecommons.org/licenses/by-nc/4.0/).
How to cite
Chen, M. Y., Heinrich, L., Zafar, F., Sedov, K. and Schuele, B. (2023). Automated 384-well SYBR Green Expression Array for Optimization of Human Induced Pluripotent Stem Cell Differentiation. Bio-protocol 13(11): e4689. DOI: 10.21769/BioProtoc.4689.
Category
Stem Cell > Pluripotent stem cell > Cell differentiation
Molecular Biology > RNA > RNA detection
Do you have any questions about this protocol?
Post your question to gather feedback from the community. We will also invite the authors of this article to respond.