- Protocols

- Articles and Issues
- For Authors
- About
- Become a Reviewer

Synthetic Promoter Screening Using Poplar Mesophyll Protoplast Transformation
Published: Vol 13, Iss 8, Apr 20, 2023 DOI: 10.21769/BioProtoc.4660 Views: 1932
Reviewed by: Pooja VermaAnonymous reviewer(s)
Original research article
The authors used this protocol in:
Jul 2021

Protocol Collections
Comprehensive collections of detailed, peer-reviewed protocols focusing on specific topics


Abstract
Plant protoplasts are useful to study both transcriptional regulation and protein subcellular localization in rapid screens. Protoplast transformation can be used in automated platforms for design-build-test cycles of plant promoters, including synthetic promoters. A notable application of protoplasts comes from recent successes in dissecting synthetic promoter activity with poplar mesophyll protoplasts. For this purpose, we constructed plasmids with TurboGFP driven by a synthetic promoter together with TurboRFP constitutively controlled by a 35S promoter, to monitor transformation efficiency, allowing versatile screening of high numbers of cells by monitoring green fluorescent protein expression in transformed protoplasts. Herein, we introduce a protocol for poplar mesophyll protoplast isolation followed by protoplast transformation and image analysis for the selection of valuable synthetic promoters.
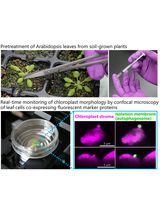
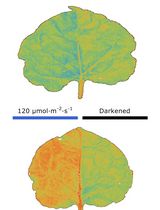
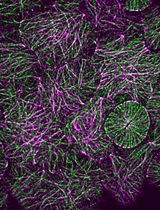
Graphical overview

Background
Transient transformation assays using plant protoplasts are effectively used for rapid evaluation of the subcellular localization of interesting proteins and how promoters regulate transcription, a lengthy process in stably engineered plants. In many cases, protoplasts are suitable proxies for the plant tissues used to isolate protoplasts—from physiological and molecular events to those in a whole organism. Therefore, protoplasts may be useful to investigate hormone responses, metabolomic processes, and cell responses against abiotic or biotic cues with minimal effort. Protoplasts provide a versatile plant cell system for screening many DNA fragments, which can be broadly applied in synthetic biology techniques. Especially, protoplast transformation can be effectively applied to determine synthetic promoter function using assays of induced marker genes (Cai et al., 2020; Jores et al., 2021; Yang et al., 2021). Furthermore, recent successes in rapid screening CRISPR/Cas9 constructs for gene edition after protoplast transformation show another application for protoplasts in synthetic biology (Lin et al., 2018; Toda et al., 2019; Rather et al., 2022). Additionally, with the recent appearance of practical methods for single cell–based -omics research using protoplasts (Chen et al., 2021; Farmer et al., 2021; Liu et al., 2021; Seyfferth et al., 2021; Liu et al., 2022; Mo and Jiao, 2022), the potential applications are continuing to grow in advanced research fields.
To date, plant protoplast transformation has been achieved in various herbaceous species as well as woody plants, since the initial methods were devised using Arabidopsis leaves (Yoo et al., 2007). Among them, poplar has been an attractive application for accelerating research in biofuel and bioproducts. Poplar protoplast isolation has been established using leaf mesophyll and stem tissues (Guo et al., 2012; Lin et al., 2014; Chen et al., 2021). A practical application for determining valuable stress-responsive synthetic promoters was successfully applied with poplar mesophyll protoplast transformation followed by fluorescence image analysis (Yang et al., 2021). The present protocol introduces the isolation of poplar mesophyll protoplasts to be applied for synthetic promoter assays by image analysis through fluorescence detection. This protocol uses less cell wall digestion enzyme and yields higher protoplast recovery compared to a regular poplar mesophyll protoplast preparation. Furthermore, a simpler and more convenient method using fluorescence measurement is utilized for the synthetic promoter screening.
Materials and Reagents
INRA 717-1B4 (Populus tremula × Populus alba) hybrid poplar
Glass plate
Single edge blades (Personna, catalog number: 94-120-71)
100 mm diameter and 20 mm deep Petri dishes (Fisher Scientific, catalog number: FB087511Z)
Magenta GA-7 plant culture box (Fisher Scientific, catalog number: 50-255-176)
BasixTM polystyrene serological pipette 10 mL (Thermo Scientific, catalog number: 14-955-234)
50 mL tube (Thermo Scientific, catalog number: 339650)
0.45 µm filter (Millipore, catalog number: SLHV004SL)
Round bottom disposable glass culture tube (10 mL) (Fisher Scientific, catalog number: 14-961-27)
96-well black/clear bottom plate (Thermo Scientific, catalog number: 165305)
40 µm sterile cell strainers (Fisher Scientific, catalog number: 08-771-1)
Murashige and Skoog (MS) basal salts with macronutrients and micronutrients (Caisson Labs, catalog number: MSP01)
MS vitamin solution (Caisson Labs, catalog number: MLV01)
MES hydrate (Thermo Scientific, catalog number: H5672.36)
KOH (Fisher Scientific, catalog number: M1064621000)
Sucrose (Fisher Scientific, catalog number: AA36508A1)
Activated charcoal (Sigma-Aldrich, catalog number: C9157)
GelzanTM CM (Gelrite®, Sigma-Aldrich, catalog number: G1910)
Indole-3-butyric acid (IBA) (PhytoTech Labs, catalog number: 1358)
Cellulase OnozukaTM R-10 (Yakurut Co., Cellulase OnozukaTM R-10)
MacerozymeTM R-10 (Yakurut Co., MacerozymeTM R-10)
D-mannitol (Sigma-Aldrich, catalog number: M4125)
KCl (Sigma-Aldrich, catalog number: P3911)
CaCl2 (Sigma-Aldrich, catalog number: C4901)
NaCl (Fisher Scientific, catalog number: BP358)
MgCl2 (Fisher Scientific, catalog number: AC223211000)
Bovine serum albumin (BSA) (Sigma-Aldrich, catalog number: A2153)
Polyethylene glycol M.W. 6000 (PEG) (Sigma-Aldrich, catalog number: 81260)
Deionized-distilled water (ddH2O)
Rooting media (see Recipes)
Cell wall degradation enzyme mixture (see Recipes)
W5 solution (see Recipes)
MMg solution (see Recipes)
40% PEG solution (see Recipes)
WI solution (see Recipes)
Equipment
Growth chamber (Percival, model: CU-36L4)
Hausser ScientificTM 3200 hemacytometer (Fisher Scientific, catalog number: 02-671-54)
Micropipette sets 0.5–10 µL, 10–100 μL, and 100–1,000 µL (Corning, catalog numbers: 4071, 4073, 4075)
Micropipette tips 0.1–10 µL, 5–300 µL, and 100–1,000 µL (Fisher Scientific, catalog numbers: 02-707-454, 02-707-447, 02-707-408)
Water bath (Fisher Scientific, model: IsoTEMP 105)
Vacuum chamber (BVV, model: GV3G)
Orbital shaker (Lab-Line, model: 3520)
Centrifuge (Thermo Scientific, model: SorvallTM RC 6+) with swinging buckets (SH3000)
EVOS M7000 imaging system (Invitrogen, model: AMF7000)
Software
ImageJ (National Institutes of Health, imagej.nih.gov)
Procedure
Plant growth
Propagate a mini plant of 717-1B4 hybrid poplar in solidified rooting media (see Recipes) in a Magenta GA-7 plant culture box.
Grow the plant for approximately 1–2 months in a growth chamber controlled with 16:8 h light/dark conditions at 23 °C with 150 µmol/m2 s irradiance.
Preparation of cell wall degradation enzyme mixture
Prepare the cell wall degradation enzyme mixture as described (see Recipes).
Heat the solution at 55 °C for 10 min to degrade possible protease activity in buffer. Store the solution on ice.
Isolation of mesophyll protoplast from healthy leaves of propagated poplar
Collect the fully expanded leaves (>1 cm in width and >2 cm in length of leaf blade) from rooted poplar clones growing in Magenta boxes (Figure 2a).
Slice ten fully expanded leaves (expected recovery of ~7 × 10⁶ cells) into 2 mm wide cut strips with a sharp single-edge blade on a glass plate.
Submerge leaf strips into 10 mL of cell wall degradation enzyme mixture in a deep 100 mm Petri dish.
Infiltrate the enzyme solution into the leave strips by vacuuming the solution in a vacuum chamber under ~40 mmHg pressure for 30 min. Turn off the vacuum but keep pressure for another 2.5 h.
Release the vacuum slowly. Lightly shake the mixture using orbital shaker (~80 rpm) for 10 min. Meanwhile, precool a 50 mL tube on ice.
Add 10 mL of precooled W5 solution (see Recipes) to the cell wall degradation enzyme–leaf strips mixture. Mix well by gentle hand shaking.
Put the 40 µm cell strainer on the precooled 50 mL tube on ice. Pass the mixture through the cell strainer to filter out cell debris from protoplast mixture. The green flowthrough contains the mesophyll protoplasts.
Remove the cell strainer and close the lid of the 50 mL tube. Spin down the cell by centrifugation at 100 × g for 3 min at 4 °C. Remove supernatant (~19.8 mL) by pipetting and then leave the green pellet with remaining solution (~0.2 mL).
Add 1 mL of W5 solution and resuspend the pellet. Place the tube on ice for 30 min for cell recovery.
Meanwhile, count the protoplasts using a hemacytometer under a microscope. Drop 10 µL of cell solution on hemacytometer and then cover the slide glass. Estimate cell count using EVOS imaging system.
Spin down the cell resuspension by centrifugation at 100 × g for 3 min. After completely removing W5 solution, add enough MMg solution (see Recipes) based on estimated cell count to bring the final concentration to 1 × 10³ cells/µL.
PEG-mediated protoplast transformation
Dilute the plasmid with ddH2O to a final concentration of 1 µg/µL of pure plasmid DNA.
Add 100 µL of protoplast solution (1 × 10⁵ cells) to a glass culture tube at room temperature. Add 20 µL of plasmid (20 µg) directly to protoplast without any loss in pipetting. Lightly tap the plasmid–protoplast mixture several times to mix.
Add 120 µL of 40% PEG solution (see Recipes) into 120 µL of plasmid–protoplast mixture. Slowly pour PEG solution at the surface of the protoplast solution to prevent pre-mixing of PEG with the plasmid–protoplast. The PEG will submerge smoothly below the plasmid–protoplast mixture, and clear separation between PEG and the plasmid–protoplast mixture will be observed. As soon as PEG is added to all mixtures, tap lightly several times until the mixture is green throughout. The final concentration of PEG is 20% in the mixture.
Incubate the mixture for 15 min at room temperature. Stop incubation by adding 500 µL of W5 solution to the transformed protoplast mixture. Note that adding at least two volumes of W5 solution (480 µL) is required for enough dilution of PEG.
Spin down the transformed protoplast by centrifugation at 100 × g for 3 min at 4 °C. Completely remove supernatant without any contact to the protoplast pellet.
Resuspend the protoplast pellet with 150 µL of WI solution (see Recipes) and gentle tapping.
Transfer protoplast–WI suspension into a 96-well optical microplate. Cover the lid and then incubate the plate at room temperature in the dark.
Fluorescence induction and image analysis
Note that fluorescence can be detected in the protoplast cells after 12 h up to one week depending on fluorescence species and experimental purpose. For the synthetic promoter screening, 48 h incubation is recommended.
To observe synthetic promoter activity in transformed protoplast, we measure fluorescence by scanning the 96-well plate using the EVOS 7000 image system. Put the incubated 96-well plate on plate holder of Evo image analyzer.
Set the reading mode to 96-well plate. Select the filter set for green fluorescence protein (GFP), red fluorescence protein (RFP), and brightfield images.
Take pictures under a 10× objective lens setting with optimal parameters. Calculate the transformation efficiency and promoter activity with these images.
To count fluorescent-expressed protoplast from images, use automatic options integrated in ImageJ software. Convert a color image to black/white format by going to Edit/Options/Conversions to scale when converting in menu bar. Then, turn image type to 16 bit grey scale by selecting Image option.
Click the Image/Adjust/Threshold for cells with the desired threshold parameter. Use this threshold setting for all images. Then, analyze particle by Analyze/Analyze particles option in the menu. Collect the count and particle information for further analysis. Three repeated transformations per plasmid were performed for statistical analysis.
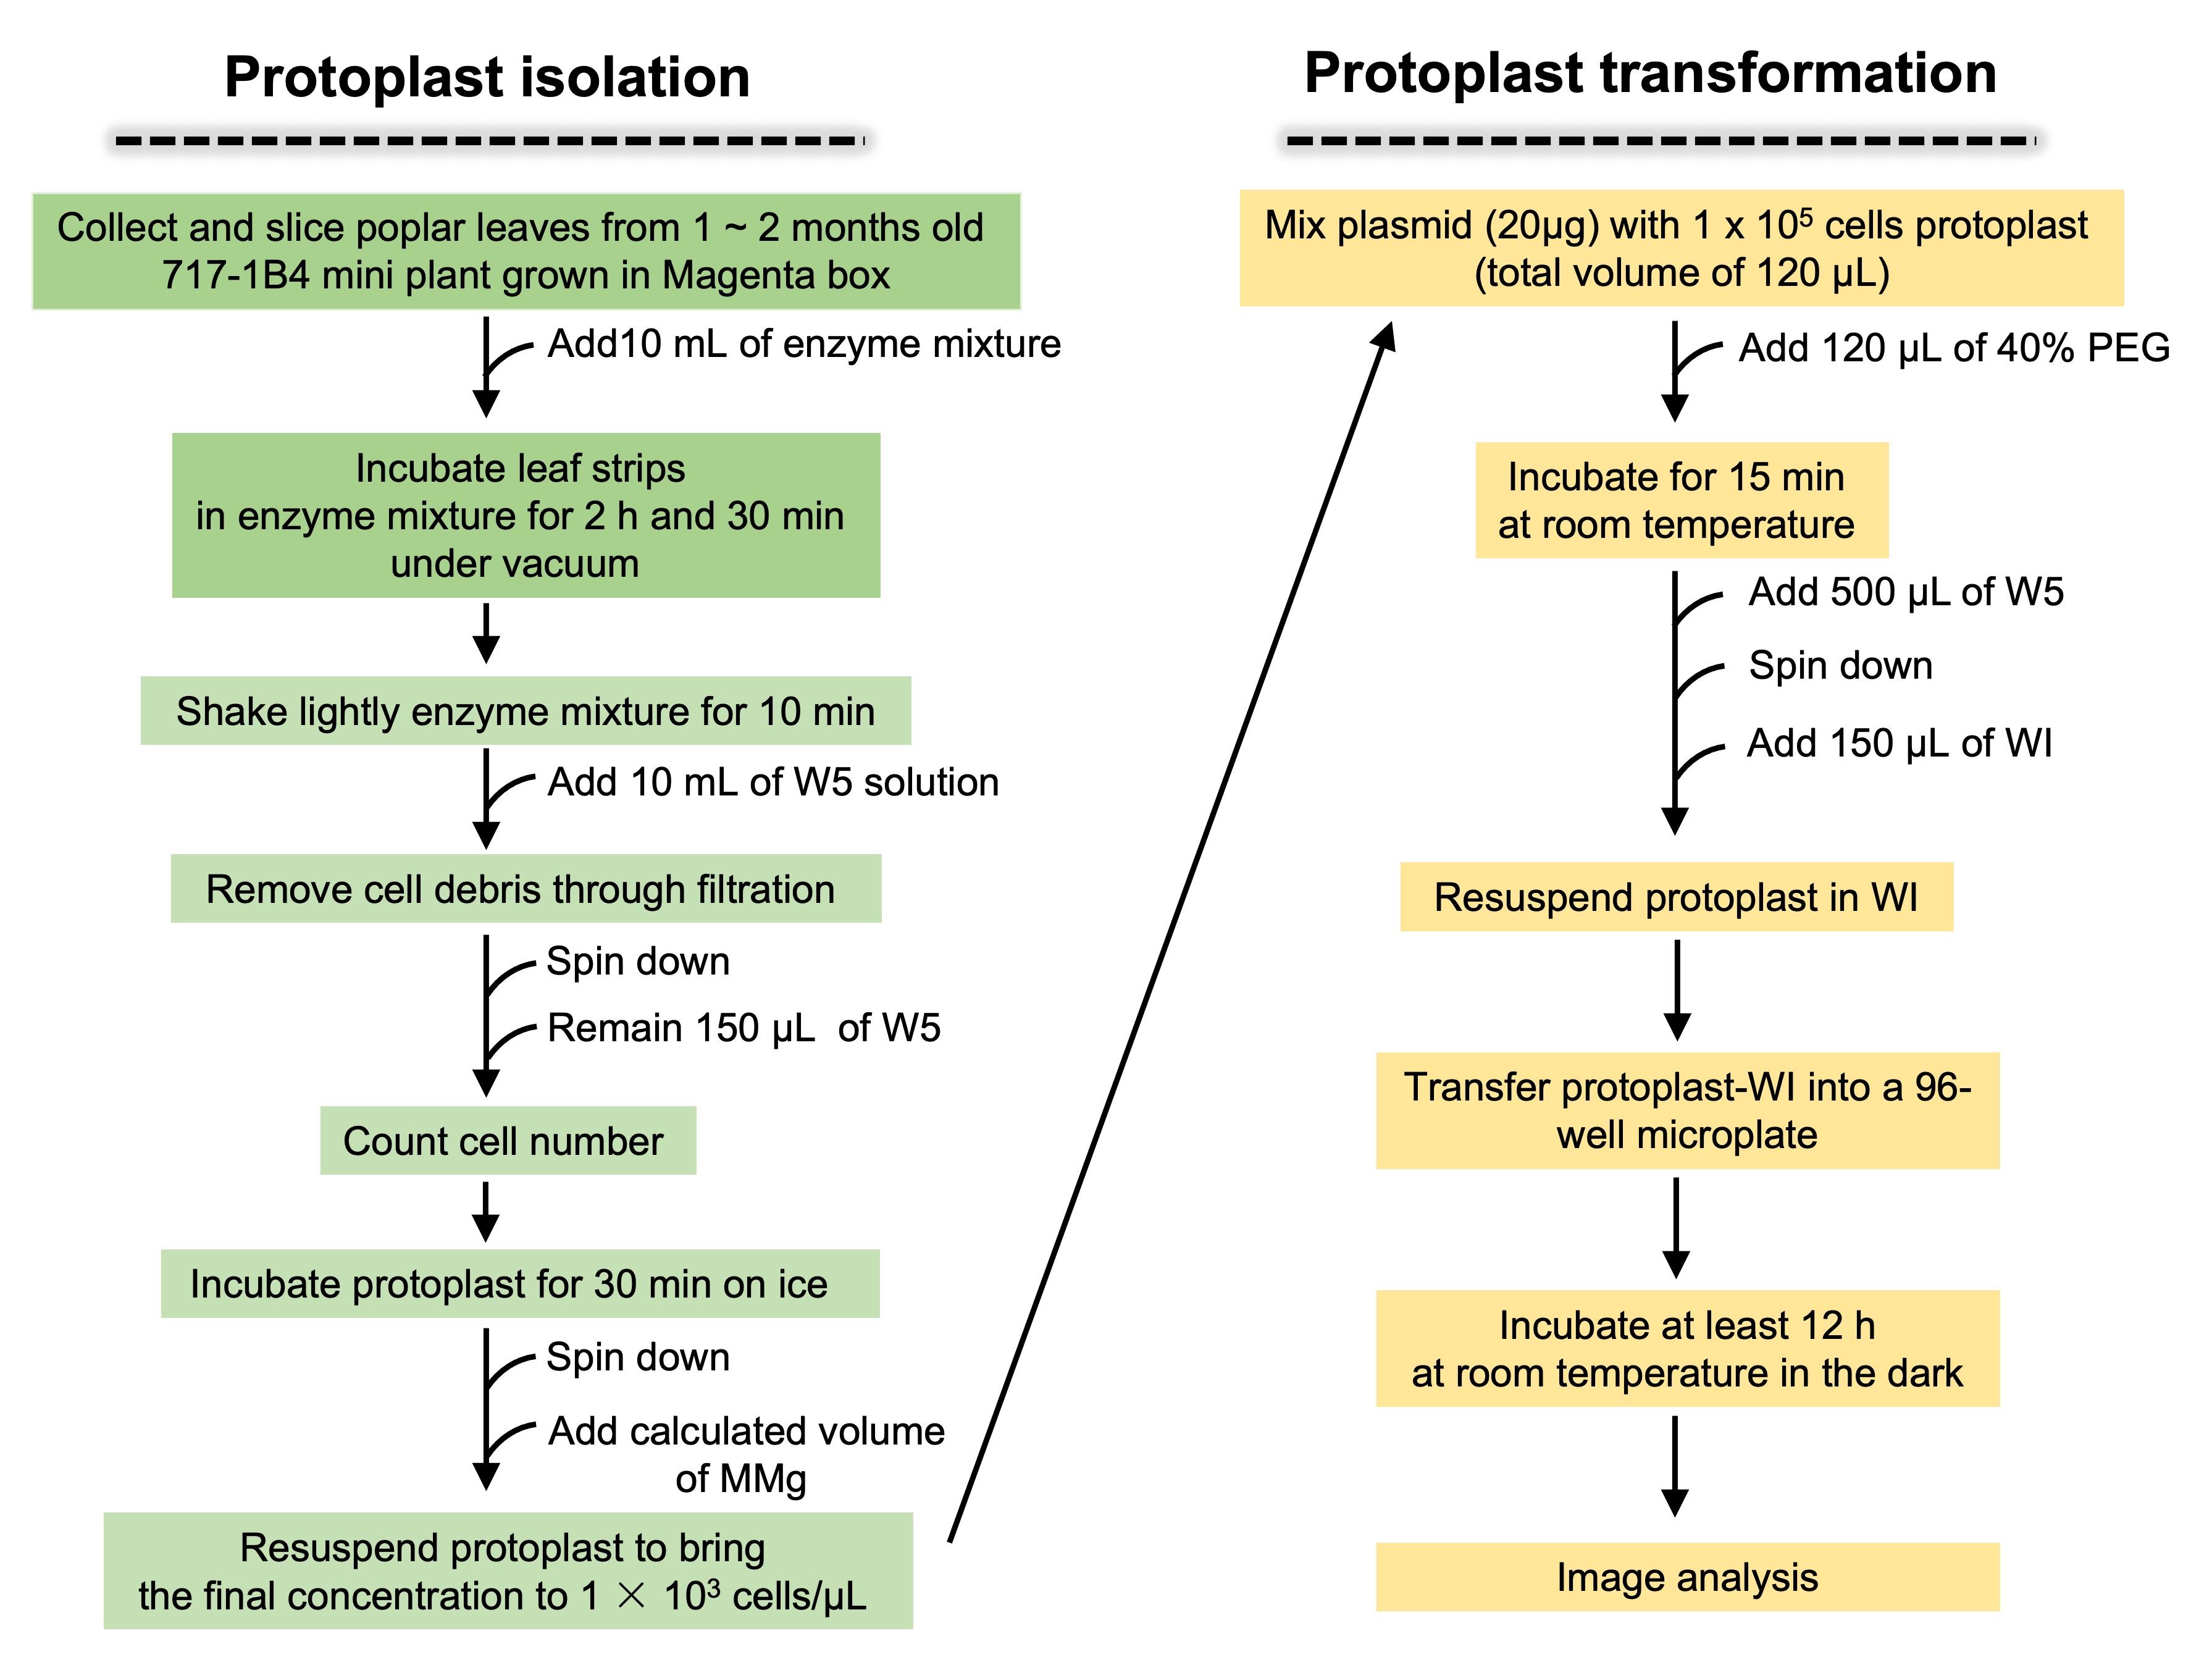
Figure 1. Protocol for poplar protoplast isolation followed by synthetic promoter gene construct transformation into prepared protoplast
Data analysis
Poplar mesophyll protoplast transformation
The cell wall–digested poplar mesophyll protoplast is relatively smaller than those from Arabidopsis leaf and somatic cell–cultured soybean and potato (Figure 2b). Estimated protoplast cell counts were in a range of 6 × 10⁶–7 × 10⁶ cells in three diverse extractions (data not shown). Figure 2c shows a representative summary of different fluorescence images in protoplast transformed with a plasmid containing RFP driven by the 2× short 35S Cauliflower mosaic virus (CaMV) promoter, and GFP expressed by a designed synthetic promoter after 48 h incubation at room temperature (Figure 2c). The RFP and GFP fluorescence can be clearly distinguished overlaying the individual protoplasts. Transformation efficiency generally reaches up to 70%, which is determined by RFP-expressed cell counts over total protoplast cell counts with 20 µg of plasmid.
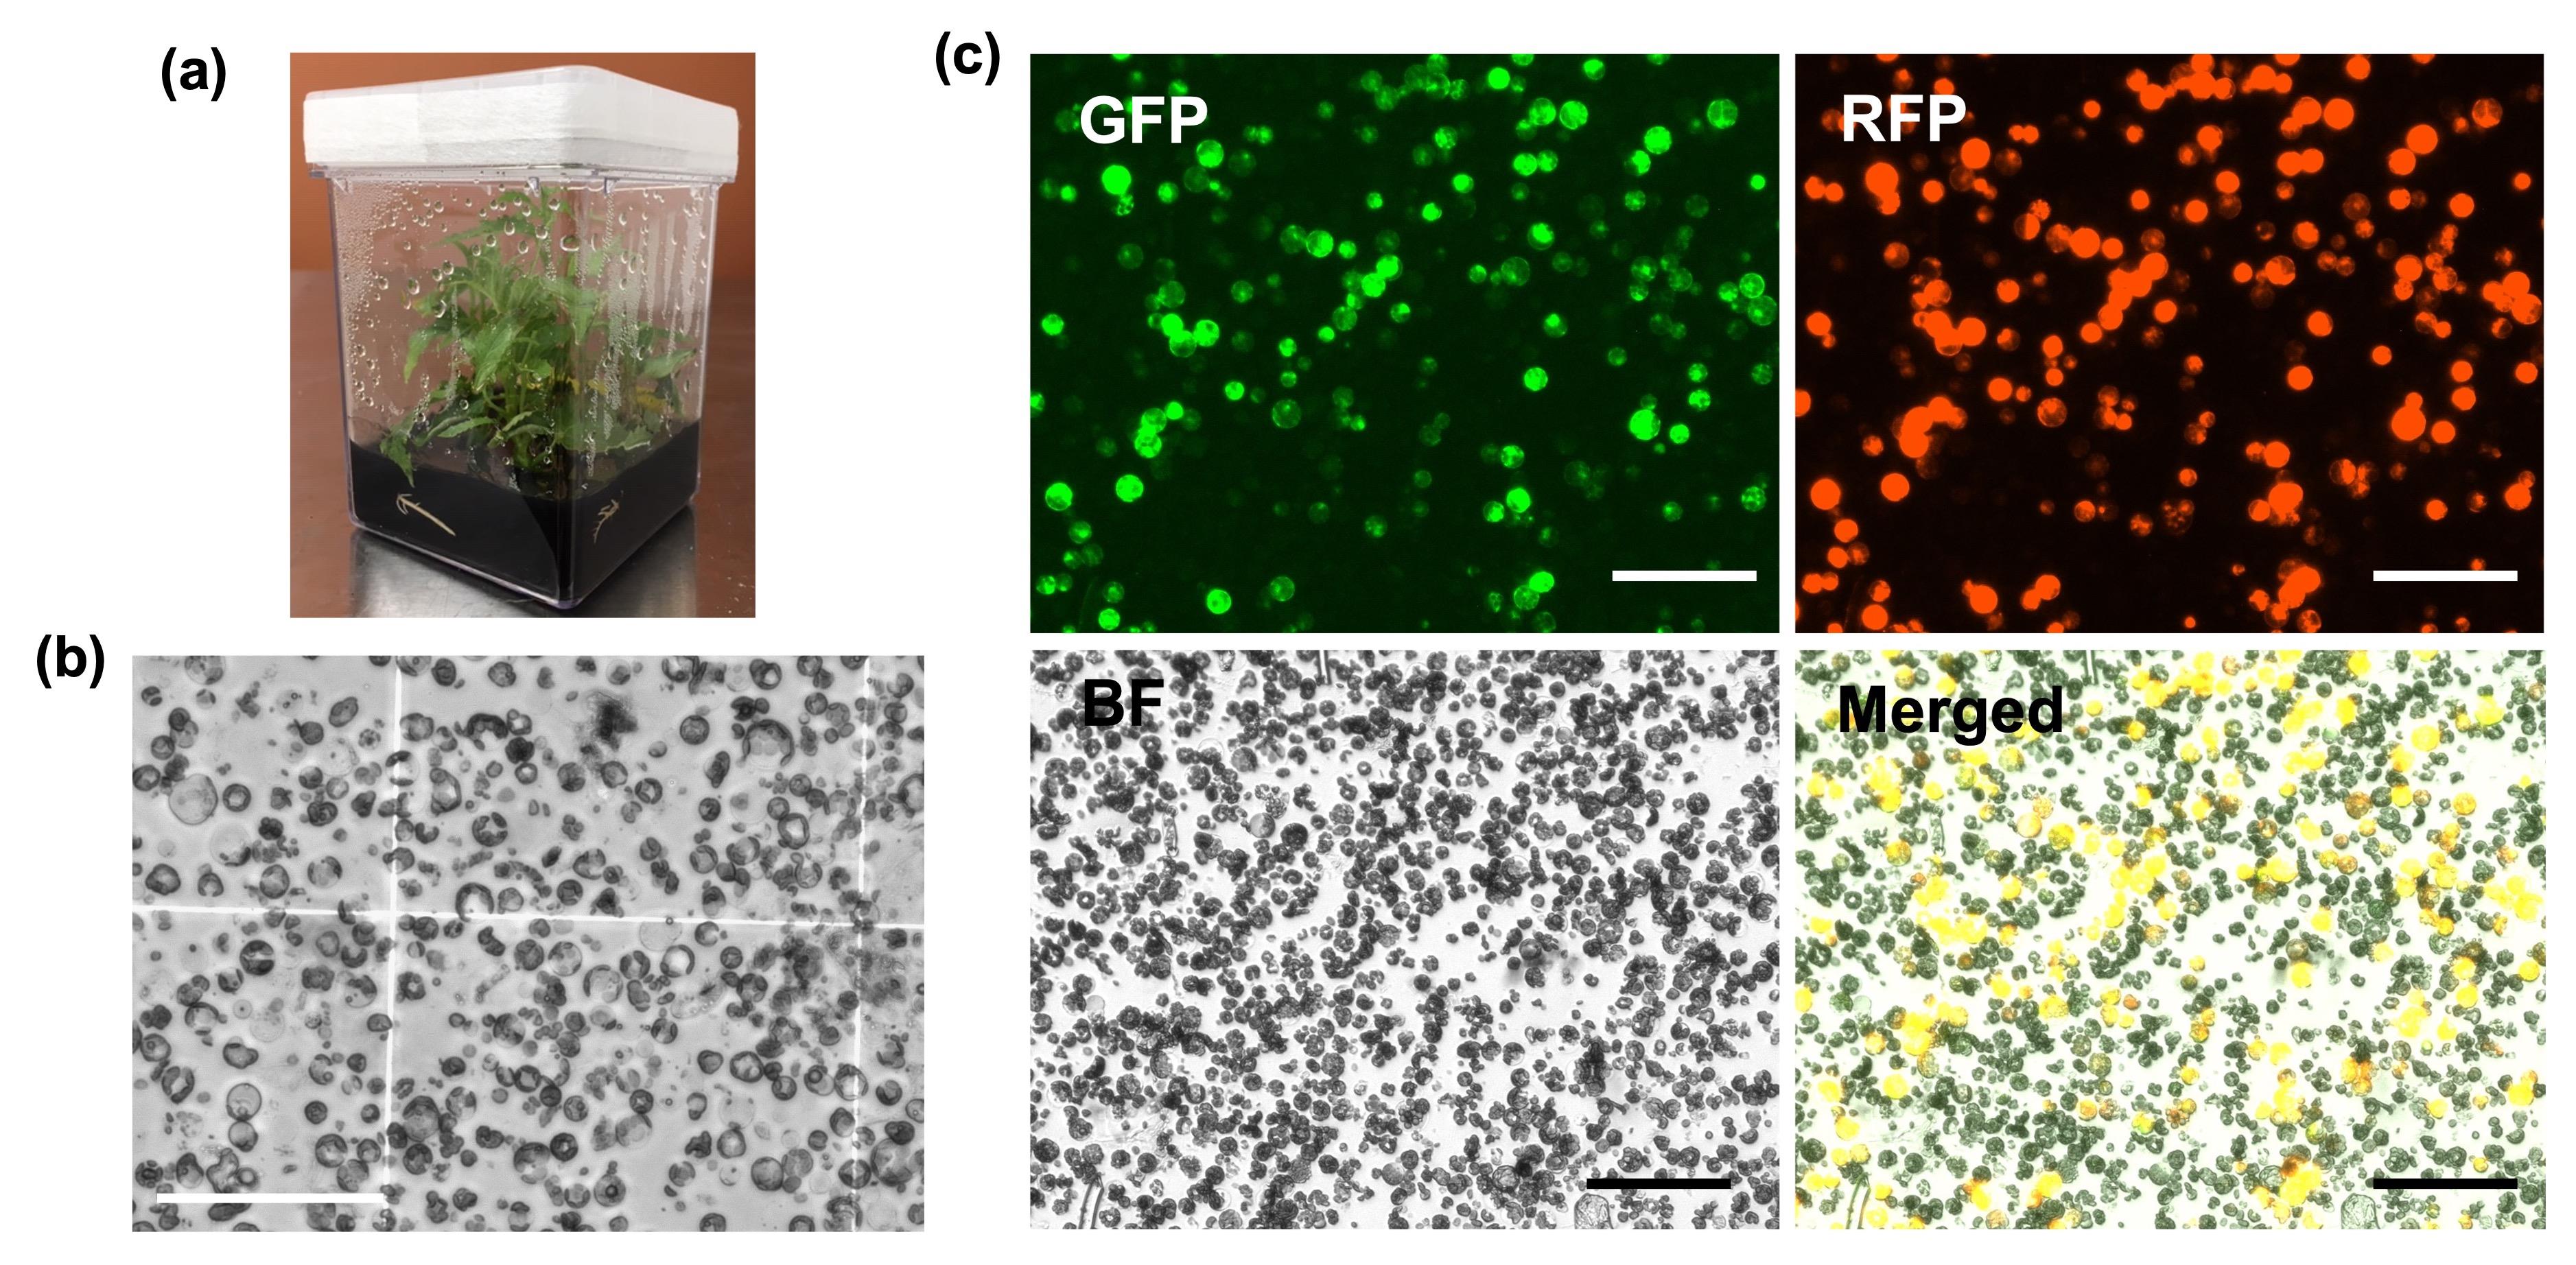
Figure 2. Representative images of isolated poplar mesophyll protoplast and fluorescent expression after transient plasmid transformation. a) Poplar clone in rooting media used for leaf section to isolate mesophyll protoplasts. The plants were grown up to two months to collect leaf blades suitable for protoplast isolation. b) Image of protoplasts isolated by 3 h after vacuum infiltration in cellulase enzyme solution. c) Images of GFP, RFP, and brightfield were taken separately after 48 h incubation following PEG-mediated transformation of 20 µg of plasmid containing 35S-driven RFP and synthetic promoter-driven GFP. Merged image was generated by EVOS M7000 imaging system based on both fluorescence and brightfield images overlayed on a single frame. Bars display 100 µm.
Synthetic promoter analysis by fluorescence detection using image analyzer
A total of 19 different plasmids were generated by replacing the promoter region with individual synthetic promoters (Figure 3a; the exact synthetic promoters’ sequences are not listed due to conflict of interest). The green GFP represents stress inducibility of each synthetic promoter against osmotic stress caused by incubation in 0.5 M mannitol (Yang et al., 2021). A 30% lower amount of cellulase and 2 h longer duration of vacuum infiltration were used here to isolate protoplasts, compared to the original established procedure for poplar mesophyll protoplast isolation (Guo et al., 2014). The fluorescent proteins were screened after 48 h incubation at room temperature. The images were collected as pairs of RFP and GFP expression from the same transformed protoplasts (Figure 3b). We observed RFP expression in whole-transformed protoplasts, confirming that transformation of current plasmid sets into protoplast were performed successfully following the present protocol (Figure 3b). In screening synthetic promoter activity, various ranges of the protoplasts expressing GFP were observed, meaning that we can distinguish different synthetic promoter-activated GFP expression by osmotic stress treatment. The ratio of GFP-expressed protoplast count over RFP-expressed protoplast count determined synthetic promoter activity for 19 synthetic promoters (Figure 3c).
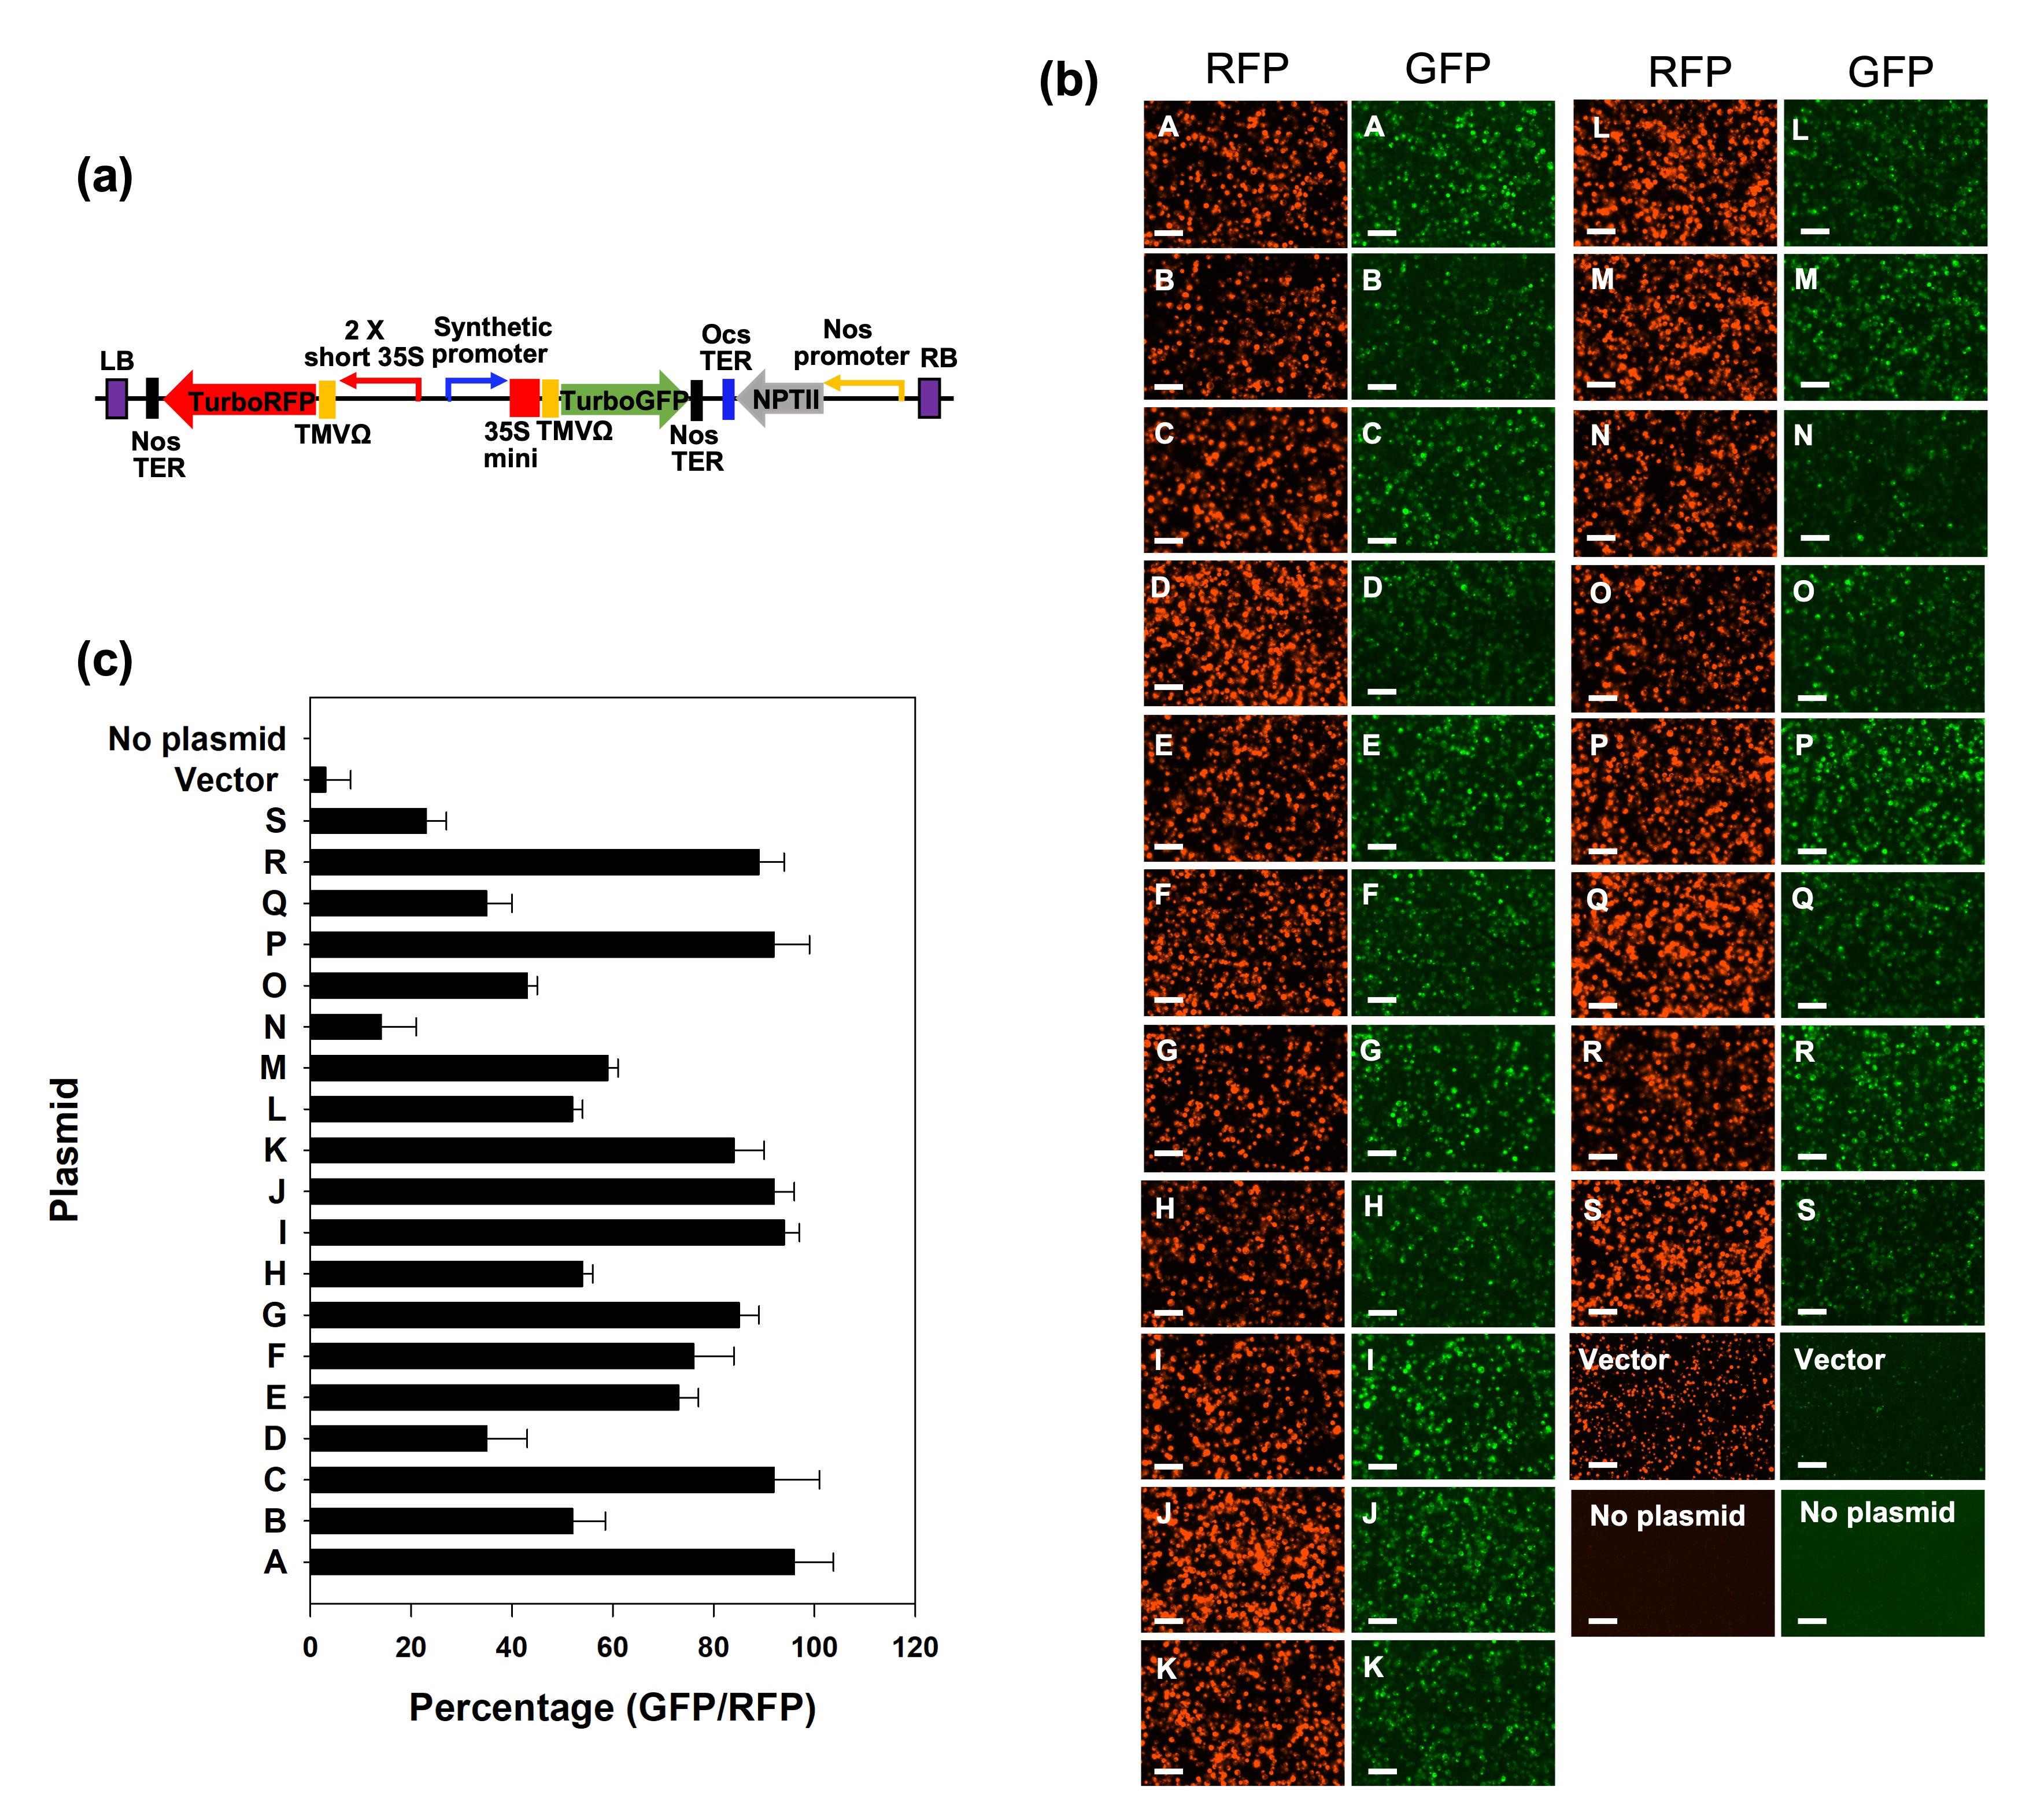
Figure 3. Comparison images for screening synthetic promoters by fluorescent protein induction driven by osmotic stress–inducible synthetic promoters. a) Plasmid construct layout used for protoplast transformation. Promoter area was replaced with a synthetic promoter from each of 19 promoters. These were adopted from our lab and randomly labeled from A to S. b) Fluorescence images to screen poplar mesophyll protoplasts containing plasmid construct of different synthetic promoters driving GFP and 35S driving RFP. The RFP was used as an internal control to determine transformation yield. GFP inducibility was determined by 48 h incubation in 0.5 M mannitol solution. Bars display 100 µm. c) Plot of fluorescent expression ratio based on cell counts of protoplast of GFP-expression driven by synthetic promoter over RFP–control expression, showing reliable plasmid transformation into protoplasts. Protoplasts expressing both fluorescent proteins were counted by ImageJ as described in part E of the procedure section. Bars display the average of cell count ratio of GFP-expressed protoplast over RFP-expressed. Error bars show the standard deviation of ratio percentage from three replicates of protoplast transformation with each plasmid.
Recipes
Rooting media
Dissolve 4.43 g of MS basal salts with macronutrients and micronutrients, 1× MS vitamin solution, 0.5 g of MES hydrate, 30 g of sucrose, 5 g of activated charcoal, and 1.5 g of GelzanTM CM in 1 L ddH2O.
Adjust pH to 5.7 with 1 M KOH.
Autoclave the solution.
After the media temperature drops, add 100 µL of IBA (1 mg/mL of stock solution) to the media.
Pour 50 mL of media to each Magenta GA-7 box and let solidify completely.
Cell wall degradation enzyme mixture
Dissolve 0.2 g of cellulase OnozukaTM R-10 and 0.08 g of MacerozymeTM R-10 in the buffer solution including 1 mL of 0.2 M MES hydrate (pH 5.7), 5 mL of 0.8 M D-mannitol, and 100 µL of 2 M KCl.
Incubate the dissolved solution at 55 °C for 10 min. Then, cool on ice for at least 5 min.
Add 100 µL of 1 M CaCl2 and 100 µL of 10% BSA.
Sterilize the enzyme solution through a 0.45 µm filter, optionally.
W5 solution
Mix 2 mL of 0.2 M MES (pH 5.7), 6.16 mL of 5 M NaCl, 25 mL of 1 M CaCl2, and 500 µL of 2 M KCl with 166.34 mL of ddH2O.
MMg solution
Mix 5 mL of 0.8 M D-mannitol, 150 µL of MgCl2, and 200 µL of 0.2 M MES hydrate (pH 5.7) with 4.65 mL of ddH2O.
40% PEG solution
Prepare 40% PEG solution just before transformation.
Dissolve 4 g of PEG in the mixture including 2.5 mL of 0.8 M D-mannitol, 1 mL of 1 M of CaCl2, and 3 mL of ddH2O. If PEG is dissolved completely, the solution volume will have a total volume of 10 mL.
WI solution
Mix 6.25 mL of 0.8 M D-mannitol, 200 µL of 0.2 M MES (pH 7.5), 100 µL of 2 M KCl, and 3.45 mL of ddH2O.
Acknowledgments
This work was supported by funding from the Biological and Environmental Research in the U.S. Department of Energy Office of Science (DE-SC0018347). The protoplast isolation method in this protocol was modified from Guo et al. (2012). The plasmid constructs were adopted from unpublished work performed by the authors. The authors thank the technical staff and students in our laboratories for their support and contribution to the work.
Competing interests
C. Neal Stewart Jr. is an inventor on synthetic promoter and biotechnology intellectual property that is assigned to the University of Tennessee Research Foundation.
References
Cai, Y. M., Kallam, K., Tidd, H., Gendarini, G., Salzman, A. and Patron, N. J. (2020). Rational design of minimal synthetic promoters for plants. Nucleic Acids Res 48(21): 11845-11856.
- Chen, Y., Tong, S., Jiang, Y., Ai, F., Feng, Y., Zhang, J., Gong, J., Qin, J., Zhang, Y., Zhu, Y., Liu, J. and Ma, T. (2021). Transcriptional landscape of highly lignified poplar stems at single-cell resolution. Genome Biol 22(1): 319.
- Farmer, A., Thibivilliers, S., Ryu, K. H., Schiefelbein, J. and Libault, M. (2021). Single-nucleus RNA and ATAC sequencing reveals the impact of chromatin accessibility on gene expression in Arabidopsis roots at the single-cell level. Mol Plant 14(3): 372-383.
- Guo, J., Morrell-Falvey, J. L., Labbe, J. L., Muchero, W., Kalluri, U. C., Tuskan, G. A. and Chen, J. G. (2012). Highly efficient isolation of Populus mesophyll protoplasts and its application in transient expression assays. PLoS One 7(9): e44908.
- Jores, T., Tonnies, J., Wrightsman, T., Buckler, E. S., Cuperus, J. T., Fields, S. and Queitsch, C. (2021). Synthetic promoter designs enabled by a comprehensive analysis of plant core promoters. Nat Plants 7(6): 842-855.
- Lin, C. S., Hsu, C. T., Yang, L. H., Lee, L. Y., Fu, J. Y., Cheng, Q. W., Wu, F. H., Hsiao, H. C., Zhang, Y., Zhang, R., et al. (2018). Application of protoplast technology to CRISPR/Cas9 mutagenesis: from single-cell mutation detection to mutant plant regeneration. Plant Biotechnol J 16(7): 1295-1310.
- Lin, Y. C., Li, W., Chen, H., Li, Q., Sun, Y. H., Shi, R., Lin, C. Y., Wang, J. P., Chen, H. C., Chuang, L., et al. (2014). A simple improved-throughput xylem protoplast system for studying wood formation. Nat Protoc 9(9): 2194-2205.
- Liu, H., Hu, D., Du, P., Wang, L., Liang, X., Li, H., Lu, Q., Li, S., Liu, H., Chen, X., et al. (2021). Single-cell RNA-seq describes the transcriptome landscape and identifies critical transcription factors in the leaf blade of the allotetraploid peanut (Arachis hypogaea L.). Plant Biotechnol J 19(11): 2261-2276.
- Liu, Q., Li, P., Cheng, S., Zhao, Z., Liu, Y., Wei, Y., Lu, Q., Han, J., Cai, X., Zhou, Z., et al. (2022). Protoplast Dissociation and Transcriptome Analysis Provides Insights to Salt Stress Response in Cotton. Int J Mol Sci 23(5): 2845.
- Mo, Y. and Jiao, Y. (2022). Advances and applications of single-cell omics technologies in plant research. Plant J 110(6): 1551-1563.
- Rather, G. A., Ayzenshtat, D., Teper-Bamnolker, P., Kumar, M., Forotan, Z., Eshel, D. and Bocobza, S. (2022). Advances in protoplast transfection promote efficient CRISPR/Cas9-mediated genome editing in tetraploid potato. Planta 256(1): 14.
- Seyfferth, C., Renema, J., Wendrich, J. R., Eekhout, T., Seurinck, R., Vandamme, N., Blob, B., Saeys, Y., Helariutta, Y., Birnbaum, K. D. et al. (2021). Advances and Opportunities in Single-Cell Transcriptomics for Plant Research. Annu Rev Plant Biol 72: 847-866.
- Toda, E., Koiso, N., Takebayashi, A., Ichikawa, M., Kiba, T., Osakabe, K., Osakabe, Y., Sakakibara, H., Kato, N. and Okamoto, T. (2019). An efficient DNA- and selectable-marker-free genome-editing system using zygotes in rice. Nat Plants 5(4): 363-368.
- Yang, Y., Lee, J. H., Poindexter, M. R., Shao, Y., Liu, W., Lenaghan, S. C., Ahkami, A. H., Blumwald, E. and Stewart, C. N., Jr. (2021). Rational design and testing of abiotic stress-inducible synthetic promoters from poplar cis-regulatory elements. Plant Biotechnol J 19(7): 1354-1369.
- Yoo, S. D., Cho, Y. H. and Sheen, J. (2007). Arabidopsis mesophyll protoplasts: a versatile cell system for transient gene expression analysis. Nat Protoc 2(7): 1565-1572.
Article Information
Copyright
© 2023 The Author(s); This is an open access article under the CC BY-NC license (https://creativecommons.org/licenses/by-nc/4.0/).
How to cite
Yang, Y., Shao, Y., Chaffin, T. A., Ahkami, A. H., Blumwald, E. and Stewart Jr., C. N. (2023). Synthetic Promoter Screening Using Poplar Mesophyll Protoplast Transformation. Bio-protocol 13(8): e4660. DOI: 10.21769/BioProtoc.4660.
Category
Biological Engineering > Synthetic biology
Plant Science > Plant cell biology > Cell imaging
Biological Sciences > Biological techniques
Do you have any questions about this protocol?
Post your question to gather feedback from the community. We will also invite the authors of this article to respond.