- Protocols

- Articles and Issues
- For Authors
- About
- Become a Reviewer

Analysis of RNA Polymerase II Chromatin Binding by Flow Cytometry


Published: Vol 13, Iss 8, Apr 20, 2023 DOI: 10.21769/BioProtoc.4659 Views: 2321
Reviewed by: Gal HaimovichJosé M. Dias
Original research article
The authors used this protocol in:

Aug 2022
Advertisement


Protocol Collections
Comprehensive collections of detailed, peer-reviewed protocols focusing on specific topics


Related protocols

Abstract
RNA polymerase II (RNAPII) transcribes DNA into mRNA and thereby plays a critical role in cellular protein production. In addition, RNAPII plays a central role in DNA damage responses. Measurements of RNAPII on chromatin may thus give insight into several essential processes in eukaryotic cells. During transcription, the C-terminal domain of RNAPII becomes post-translationally modified, and phosphorylation on serine 5 and serine 2 can be used as markers for the promoter proximal and productively elongating forms of RNAPII, respectively. Here, we provide a detailed protocol for the detection of chromatin-bound RNAPII and its serine 5– and serine 2–phosphorylated forms in individual human cells through the cell cycle. We have recently shown that this method can be used to study the effects of ultraviolet DNA damage on RNAPII chromatin binding and that it can even be used to reveal new knowledge about the transcription cycle itself. Other commonly used methods to study RNAPII chromatin binding include chromatin immunoprecipitation followed by sequencing or chromatin fractionation followed by western blotting. However, such methods are frequently based on lysates made from a large number of cells, which may mask population heterogeneity, e.g., due to cell cycle phase. With strengths such as single-cell analysis, speed of use, and accurate quantitative readouts, we envision that our flow cytometry method can be widely used as a complementary approach to sequencing-based methods to study effects of different stimuli and inhibitors on RNAPII-mediated transcription.
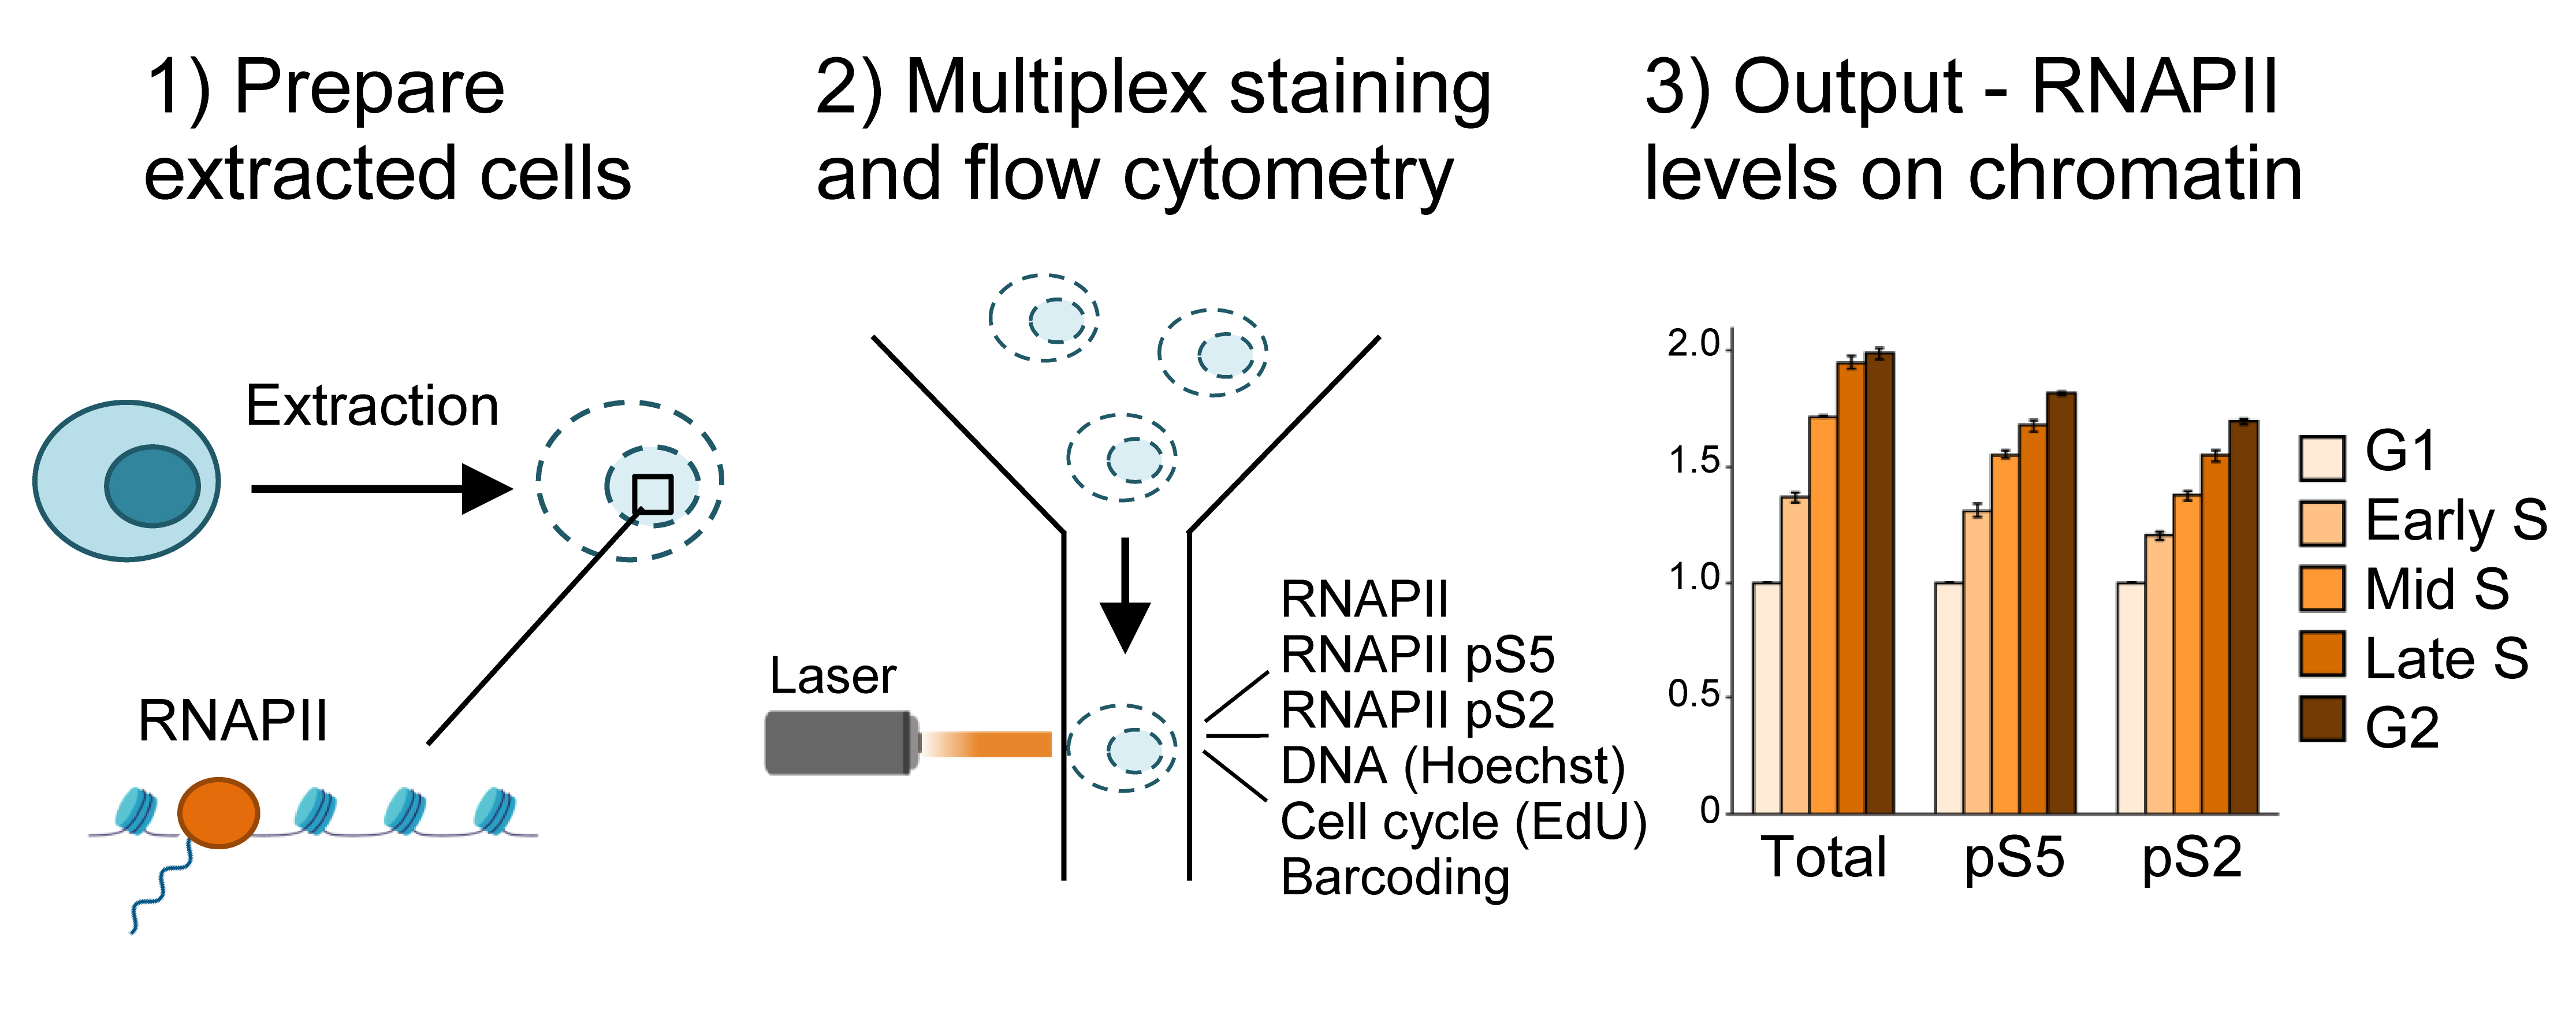
Graphical overview
Background
RNA polymerase II (RNAPII) plays an essential role in protein production by transcribing DNA into mRNA. In addition, it participates in the detection, signaling, and repair after DNA damage (Ljungman and Lane, 2004; Lagerwerf et al., 2011; Lans et al., 2019; Landsverk et al., 2021), and thus also plays a key role in the DNA damage response. Furthermore, RNAPII is essential for cell cycle progression, and is itself regulated by the cell cycle (Enserink and Chymkowitch, 2022). As DNA damage greatly affects the cell cycle by activation of cell cycle checkpoints (Hauge et al., 2021), measuring RNAPII levels on chromatin in individual cell cycle phases is highly relevant both in the absence and presence of DNA damage. Previously, cell cycle effects on RNAPII have been studied, for instance by microscopy (Chan et al., 2012; Teves et al., 2018) and/or chromatin immunoprecipitation/fractionation followed by sequencing (Liang et al., 2015, Wang et al., 2021) or western blotting (Akoulitchev and Reinberg, 1998; Palozola et al., 2017). However, although sequencing or chromatin fractionation techniques can give high resolution sequence information and/or quantitative data, they have so far been based on cell lysates made from a large number of pooled cells. In order to investigate cell cycle effects, these techniques require cell synchronization, which can induce replication stress or changes to transcription. Microscopy offers single-cell resolution and does not require synchronization but is limited in the number of cells analyzed. To overcome these obstacles, we recently described a new method to study RNAPII chromatin binding in single cells through the cell cycle (Bay et al., 2022). This flow cytometry method allows for the determination of cell cycle phases without the need to synchronize cells. Also, thousands of cells are measured per sample per experiment, ensuring accurate quantitative readouts. Using this method on cells treated with the transcriptional inhibitor 5,6-Dichloro-1-beta-Ribo-furanosyl Benzimidazole (DRB), which arrests RNAPII in promoter proximal regions, and the proteasome inhibitor MG132, we showed that promoter proximal RNAPII is degraded under unperturbed conditions, and that this is further enhanced after UV treatment (Bay et al., 2022). In line with our results, degradation of promoter proximal RNAPII after UV treatment was also observed in an independent study by live-cell imaging, chromatin immunoprecipitation followed by sequencing, and western blotting of chromatin fractions (Steurer et al., 2022). Furthermore, using our method, we could observe cell cycle differences in the chromatin loading of RNAPII after UV treatment (Bay et al., 2022). Here, we present the detailed protocol for this method.
A first critical step in the protocol is the cell extraction step, where non-chromatin-bound factors are removed by treatment with mild detergent Triton X-100 (0.5%) prior to fixation (Figure 1). This allows measurements of only chromatin-bound RNAPII. The use of flow cytometry to measure chromatin-bound factors after detergent treatment was first described in the early 90s for the study of chromatin-bound DNA polymerase α (Stokke et al., 1991). Similar assays using extraction prior to fixation have also been used to measure chromatin-binding of other proteins involved in transcription, replication, and repair by flow cytometry (Stokke et al., 1993; Forment et al., 2012; Forment and Jackson, 2015) or immunofluorescence microscopy (Syljuåsen et al., 2005; Britton et al., 2013). Notably, this is the first time such a protocol has been described for RNAPII by flow cytometry. Triton X-100 treatment is performed in a sucrose-containing buffer, similar to pre-extraction/cytoskeletal buffers commonly used in immunofluorescence microscopy (Britton et al., 2013; Kilgas et al., 2021). However, as RNAPII is known to be released from chromatin in mitosis (Parsons and Spencer, 1997), NaCl concentrations were optimized based on the expected low chromatin binding of RNAPII in mitotic cells (Bay et al., 2022). Moreover, as RNAPII is a target for proteasome-mediated degradation (Wilson et al., 2013), particular care should be taken to avoid degradation during cell processing. In this protocol, degradation is prevented by the addition of proteasome inhibitors during extraction, by performing the extraction on ice, and by fixing the cells rapidly after extraction.
Another key feature of the method is multiplexing, i.e., measurement of several different parameters simultaneously in single cells. One advantage of multiplexing is that it allows the incorporation of barcoding into the assay. In this protocol, barcoding is performed by labeling non-treated control cells with an amine-reactive Alexa 647, which binds to intracellular proteins (Krutzik and Nolan, 2006). The resulting Alexa 647–labeled cells are added to all the individual samples prior to staining with antibodies or the EdU Click-iT reaction and can be separated from the sample cells during analysis. The barcoded cells thus provide an internal standard for normalization of the RNAPII signals in the individual samples. This greatly facilitates quantification and accuracy of the assay and enables all the samples to be compared with each other. Multiplexing further permits analysis of RNAPII chromatin levels in specific phases of the cell cycle, by analyzing RNAPII chromatin levels only in cells with a certain DNA and EdU content (Bay et al., 2022).
Choice of antibodies is also critical in this method, as every new antibody used requires validation. The antibodies described here have been validated by us and others (Heidemann et al., 2013; Steurer et al., 2018; Bay et al., 2022), and recognize the N-terminal domain of RNAPII and the serine 5– (pRNAPII S5) and serine 2–phosphorylated (pRNAPII S2) forms of RNAPII. pRNAPII S5 is mostly associated with promoter-proximal regions, and global levels can therefore indicate degree of promoter-proximal paused RNAPII (Bay et al., 2022). pRNAPII S2 can be used as a marker for productive elongation (Bay et al., 2022). Finally, the use of EdU to label replicating cells is an important step to distinguish between G1 and early S phase, as well as between late S and G2. EdU is a nucleotide analogue, which is incorporated into the DNA molecule upon DNA replication. As their DNA content is highly similar, G1 vs. early S phase and G2 vs. late S-phase cells are not distinguishable by measurements of DNA content alone. By including EdU labeling, cells with similar DNA content can be separated in G1 vs. early S or G2 vs. late S based on the presence or absence of EdU incorporation, which marks the replicating (S phase) cells. However, this step may be omitted if such finely separated cell cycle determination is not required. If EdU is omitted, determination of cell cycle phase can be done by DNA content alone to obtain G1, S, and G2 fractions [Figure 2 and Dale Rein et al. (2015)].
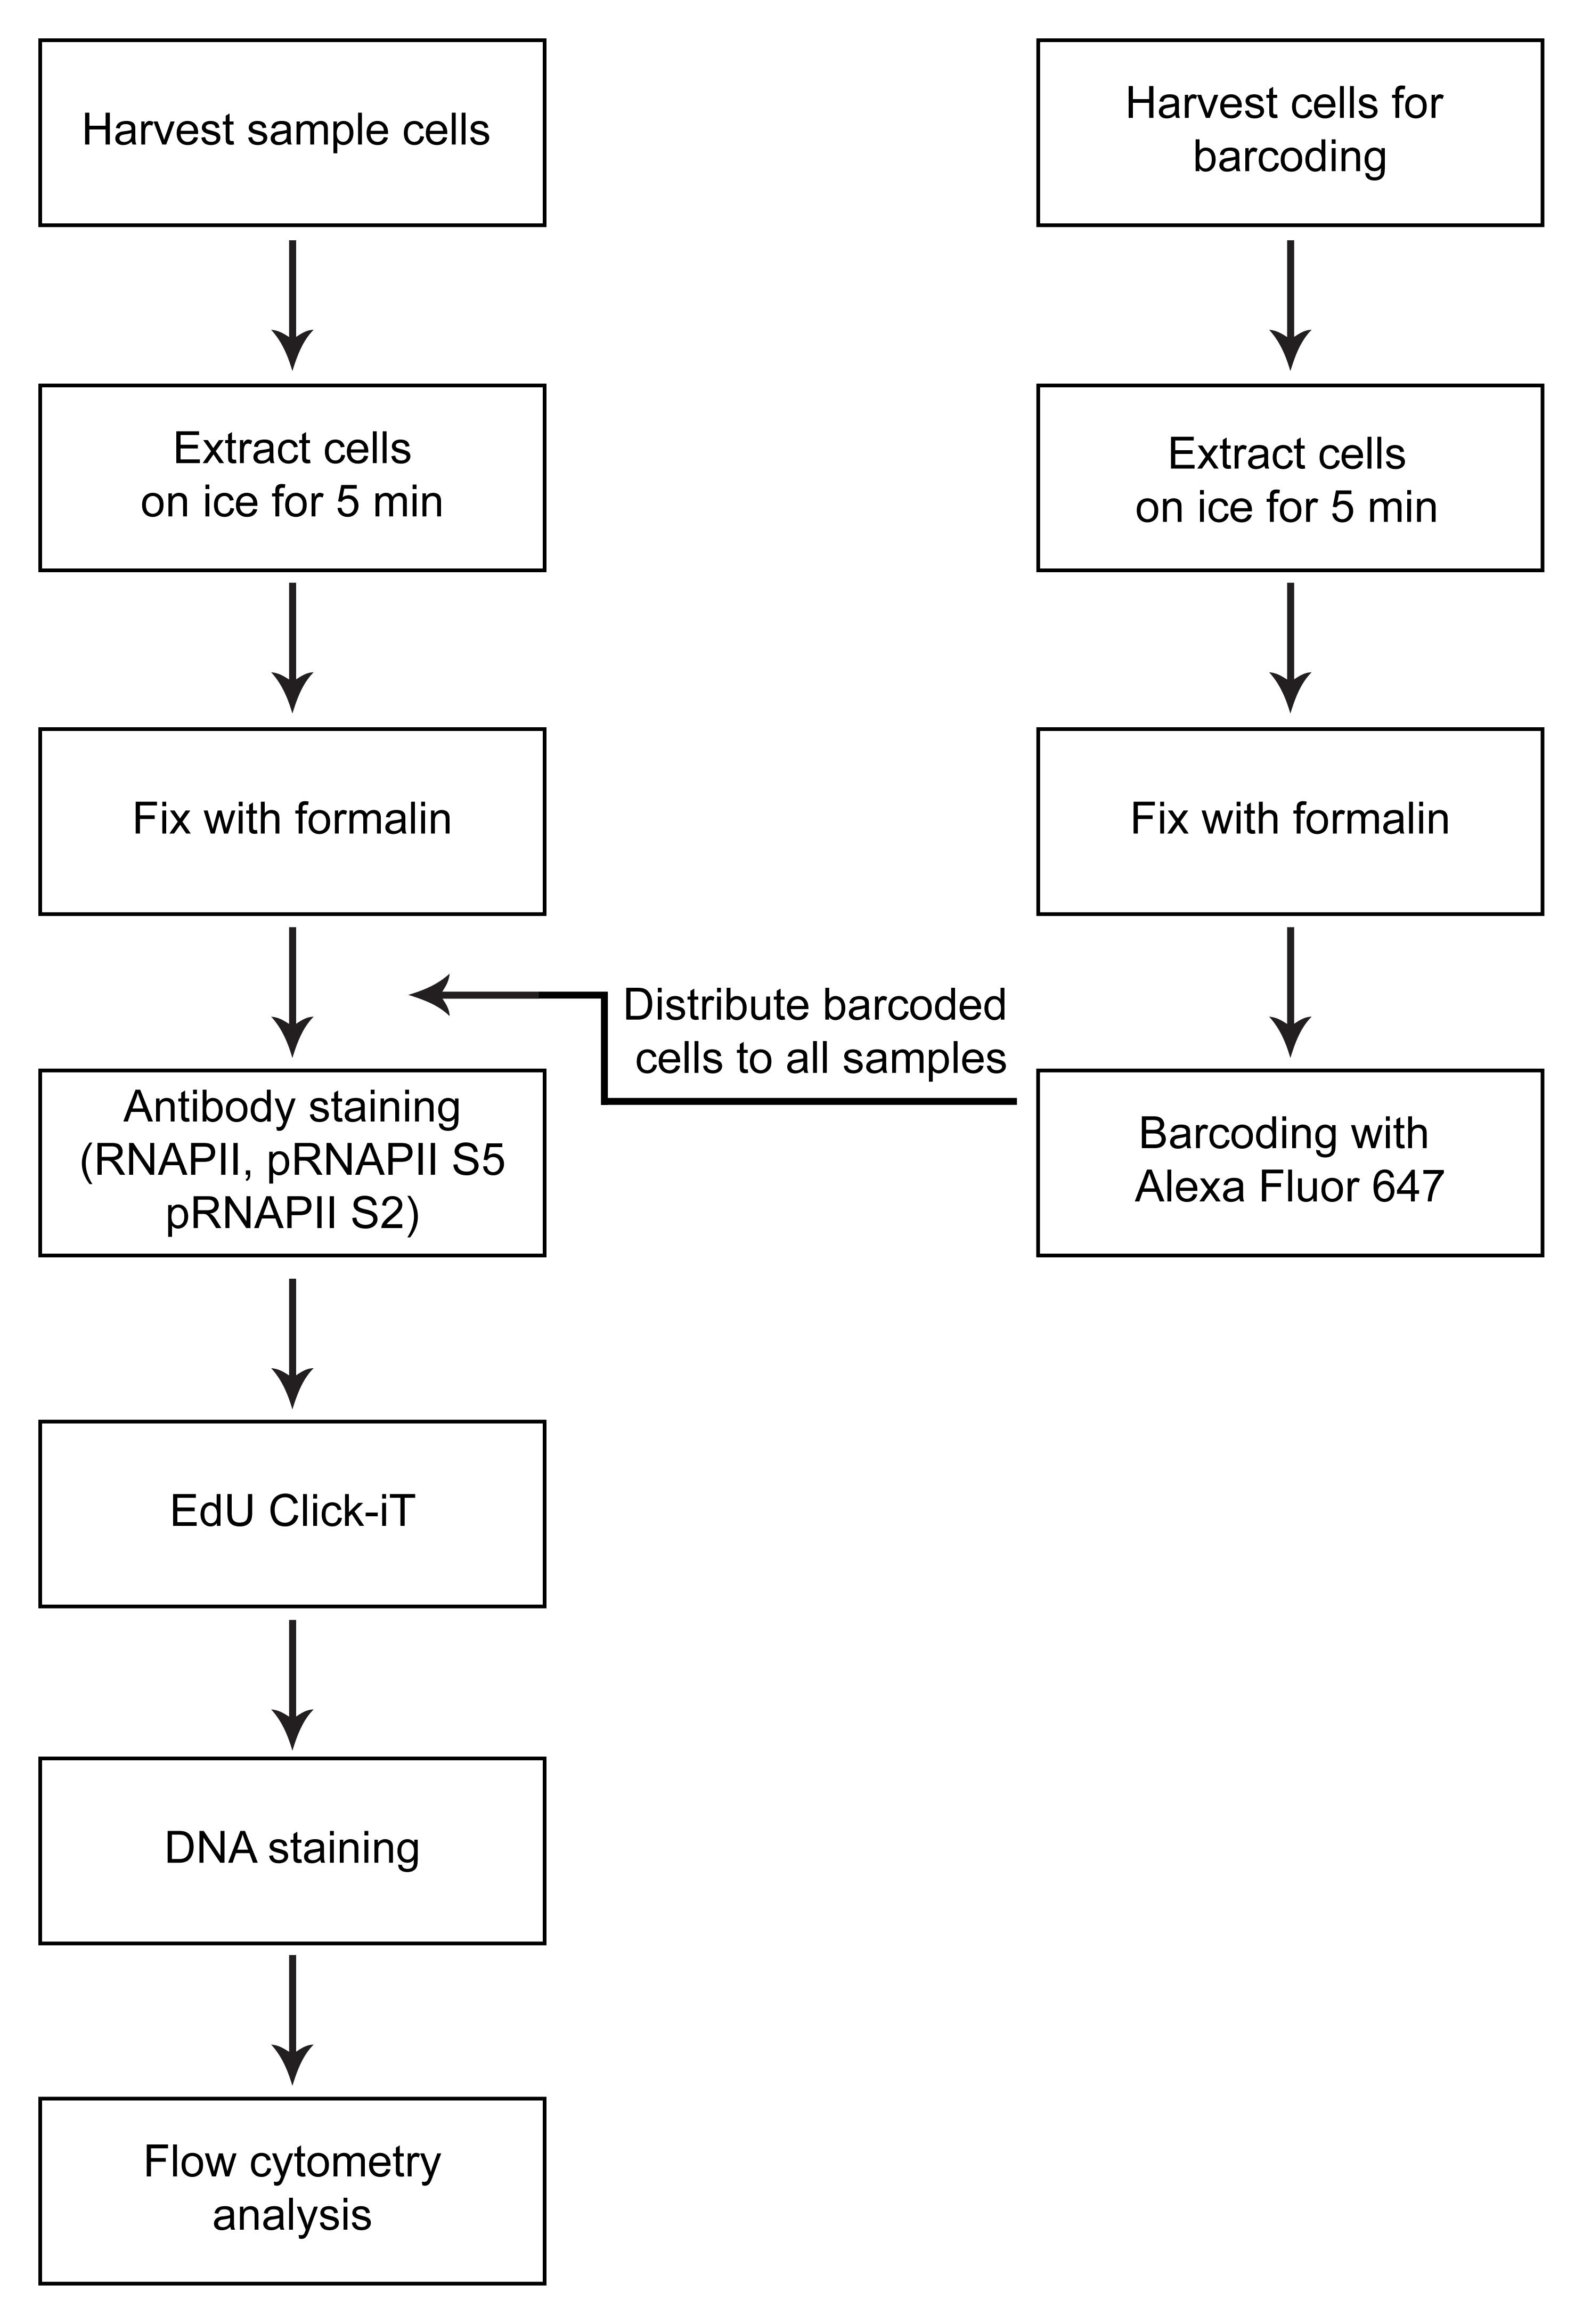
Figure 1. Overview of method
Materials and Reagents
Cell culture and harvest
Serological pipettes, polystyrene
Sterile conical-bottom tubes, 15 mL
Human cervical cancer HeLa Kyoto cells (but other cell types may be used)
Penicillin-Streptomycin (P/S) (Thermo Fisher, catalog number: 15140122)
Fetal bovine serum (FBS) (Biowest, catalog number: S181B-050)
Dulbecco’s modified Eagle medium (DMEM), high glucose, GlutaMAX supplement, pyruvate (Thermo Fisher, catalog number: 31966047)
Culture dishes, 6 cm (VWR, catalog number: 353004)
EdU (1 μM) (Thermo Fisher, catalog number: A10044)
Trypsin 0.25% with EDTA, 100 mL (Life Technologies, catalog number: 25200-056)
Phosphate-buffered saline (10× PBS) (Thermo Fisher, catalog number: 70011-051)
10% formalin solution, neutral-buffered ready-made solution (Sigma-Aldrich, catalog number: HT5011)
Extraction
HEPES (pH 7.9) (Sigma-Aldrich, catalog number: H3784)
MgCl2 (Sigma-Aldrich, catalog number: 208337)
NaCl (Sigma-Aldrich, catalog number: S9888)
Sucrose (Sigma-Aldrich, catalog number: S0389)
Triton X-100 (Sigma-Aldrich, catalog number: T9284-100ML)
PhosSTOP phosphatase inhibitors (Merck, catalog number: 4906837001)
cOmplete protease inhibitor cocktail EDTA-free (Merck, catalog number: 5892791001)
MG132 (Sigma-Aldrich, catalog number: M7449)
ddH2O Milli-Q water
Chromatin extraction buffer (10 mL) (see Recipes)
Staining and preparation of cells for flow cytometry analysis
BD Falcon 5 mL polystyrene with cell strainer cap (VWR, catalog number: 734-0001)
Aluminum foil
Alexa Fluor 647 NHS Ester (Succinimidyl Ester) (Thermo Fisher, catalog number: A20006)
Dimethyl sulfoxide (DMSO) (Sigma-Aldrich, catalog number: D4540)
Phosphate-buffered saline (10× PBS) (Thermo Fisher, catalog number: 70011-051)
Fetal bovine serum (FBS) (Biowest, catalog number: S181B-050)
Anti-RNAPII (D8L4Y) (Cell Signaling Technology, catalog number: 14958S)
Anti-pRNAPII S5 (3E8) (Sigma-Aldrich, catalog number: 04-1572)
Anti-pRNAPII S2 (3E10) (Sigma-Aldrich, catalog number: 04-1571)
Donkey anti-rabbit IgG (H+L) highly cross-adsorbed secondary antibody Alexa Fluor 488 (Thermo Fisher, catalog number: A-21206)
Donkey anti-rat IgG H+L Alexa Fluor 488 pre-adsorbed (Abcam, catalog number: ab150153)
Click-iT Plus EdU Alexa Fluor 594 Flow Cytometry Assay kit (Thermo Fisher, catalog number: C10646)
Bovine serum albumin (BSA) heat-shock fraction, protease free, essentially globulin free, pH 7, ≥98% (Sigma-Aldrich, catalog number: A3059-100G)
Na2HPO4 (Sigma-Aldrich, catalog number: S3264)
KH2PO4 (Sigma-Aldrich, catalog number: P5655)
KCl (Sigma-Aldrich, catalog number: P3911)
NaCl (Sigma-Aldrich, catalog number: S9888)
Ethylenediaminetetraacetic acid (EDTA, pH 7.5)
Igepal CA-630 (Sigma-Aldrich, catalog number: I8896-50ML)
Skim milk powder (Millipore, catalog number: 70166-500G)
DNA-stain Hoechst 33258 (624 μg/mL) (Sigma-Aldrich, catalog number: B1155-25MG)
LX Alexa Fluor 647 NHS Ester (barcoding) (see Recipes)
Flow buffer (1 L) (see Recipes)
Detergent buffer (see Recipes)
Click-iT permeabilization and wash reagent (see Recipes)
Click-iT reaction cocktail (see Recipes)
Equipment
Sterile cell culture hood
37 °C cell culture incubator with CO2 control
Centrifuge (Hettich Rotina 380R Centrifuge, rotor 1754, radius 167 mm)
LSRII flow cytometer (BD Biosciences), Quartz cuvette flow cell, instrument settings can be found in Table 1.
Table 1. LSRII flow cytometer instrument settings
Parameter Laser Band-Pass (nm) Longpass Dichroic filter (nm) Detector Alexa Fluor 488 488 nm–100 mW 525/30 505 PMT B SSC 488 nm–100 mW 488/10 - PMT C FSC 488 nm–100 mW 488/10 - FSC Diode–Silicon photodiode Hoechst 405 nm–100 mW 450/50 - PMT G Alexa Fluor 647 640 nm–40 mW 670/14 - PMT C Alexa Fluor 594 561 nm–45 mW 610/20 600 PMT D
Software
DiVa software is used when obtaining flow cytometry data
FlowJo V10_5 software is used for analyzing the flow cytometry data
Procedure
Preparations: Prepare the chromatin extraction buffer (see Recipes below); 100 μL is required per sample. As one tablet of cOmplete EDTA-free protease inhibitor cocktail and one tablet of PhosSTOP phosphatase inhibitors are needed per 10 mL solution, adjust with +10 mL if more than 10 mL solution is required. Add MG132 to a final concentration of 20 µM (add 2 µL per milliliter of 10 mM stock). Mix thoroughly by vortexing and place on rotator at 4 °C until use. The chromatin extraction buffer should be prepared fresh before each experiment.
Cultivate human cervical cancer HeLa Kyoto cells in DMEM supplemented with 10% FBS and 1% P/S. For 1.0 × 10⁶–1.5 × 10⁶ cells at time of harvest, plate 6.0 × 10⁵ cells in 6 cm culture dishes, approximately 24 h prior to harvest. In addition to dishes intended for samples and the non-treated control cells, include additional dishes intended for use for barcoding and secondary antibody controls. (Approximately 3 × 10⁵ barcoded cells are needed per sample, and 1.0 × 10⁶–1.5 × 10⁶ cells are needed for the secondary controls at time of harvest.)
Note: The protocol may be adapted for other cell types, e.g., we have used RPE and MRC5 cells.
Prepare 1 μM EdU in DMEM supplemented with 10% FBS and 1% P/S at 37 °C and mix well. Remove cell culture media from the culture dishes and replace with 4 mL per dish of the EdU-containing DMEM, 1 h prior to further treatment or harvest in the absence of additional treatment.
Notes:
1) Samples intended as barcoding controls and controls for secondary antibodies are not labeled with EdU and are therefore left untreated in this protocol. However, they can be EdU-positive if desired.
2) This step may be omitted if cell cycle phase determination by DNA stain alone is sufficient.
Harvest cells:
Remove culture medium and wash the cell layer once with 500 µL of trypsin solution or PBS at room temperature (RT).
Remove trypsin or PBS solution, add 500 µL of fresh trypsin solution, and transfer the dishes to a 37 °C cell culture incubator. After approximately 1 min, check if cells have started to detach by gently tapping the side of the dish. If the cells still adhere to the surface, place them back in the incubator until detachment is observed.
When most cells have detached, resuspend the cells in 4 mL of DMEM and transfer the cell suspension of each dish to separate and labeled 15 mL sterile conical-bottom tubes.
Isolate cell pellets by centrifugation at 634 × g for 5 min and remove supernatant.
Note: If timing is important, e.g., after DNA damage, add cold medium to the cells after they have detached, keep the 15 mL sterile conical-bottom tubes containing the cells on ice, and spin the cells at 4 °C to stop enzymatic reactions as much as possible prior to extraction and fixation.
Extract the cells: to prepare, place the chromatin extraction buffer on ice (in a Styrofoam box with ice) and the 10% formalin solution at RT.
Add 100 μL of ice-cold chromatin extraction buffer to each cell pellet, mix by pipetting, and immediately place the tube on ice. Start the timer at 5 min after the first sample and then continue with remaining samples. Time is of essence, so work efficiently. If the incubation period exceeds 5 min, then adjust for all samples to obtain equal extraction time.
When time is up, add 900 μL of formalin to the first sample, transfer to RT, and continue with the other samples in the same pace and order as before. Start the timer at 10 min after the last sample has been mixed with formalin and placed at RT.
Isolate cell pellets by centrifugation at 634 × g for 5 min at RT.
Resuspend the cells in 500 µL of PBS and continue with staining.
Notes:
1) The extraction is a critical step. Fixation must occur rapidly after extraction, or degradation of RNAPII may occur. Within the time window described here, the time prior to fixation is likely more critical to keep constant than the fixation time itself.
2) Samples intended as barcoding cells and secondary antibody controls should also be extracted prior to fixation.
3) When the cells have been fixed and are in PBS, they can be left overnight at 4 °C prior to barcoding and staining.
4) Prior to barcoding, use PBS without FBS to resuspend the cells, as FBS competes with cellular proteins for binding to Alexa Fluor 647 NHS Ester. However, wash steps with PBS without FBS should be avoided as they lead to loss of cells.
Stain cells for barcoding:
Combine cells from tubes containing cells intended for barcoding from step 4d into one tube. (Approximately 3 × 10⁵ barcoded cells should be prepared per sample.)
Add 12.5 μL of LX Alexa Fluor 647 NHS Ester (see Recipes below) per 500 μL of PBS. Mix by inverting the tube and incubate in the absence of light at RT for 30 min.
Quench barcoding by adding 5 mL of PBS with 5% FBS, mix well by inverting the tube, and leave in the dark at RT for 5 min.
Spin down barcoded cells by centrifugation at 1127 × g for 5 min at RT.
Remove supernatant by suction and resuspend pellet containing barcoded cells with 6 mL of PBS with 5% FBS.
Add 5 mL of PBS with 2% FBS to tubes containing samples, secondary antibody controls, and non-treated control cells from step 4d.
Distribute the barcoded cells from step 5e equally between all tubes containing samples, secondary antibody controls, and non-treated control cells from step 5f (e.g., for 10 tubes, distribute 6 mL of barcoded cell solution/10 = 0.6 mL of barcoded cell suspension per tube).
Stain samples with primary and secondary antibodies
Spin down cells in tubes, now also containing barcoding cells, by centrifugation at 1127 × g for 5 min at RT. Remove most of the supernatant by suction (until approximately 100 μL is left), spin down again, and remove rest of the supernatant with a 200 μL pipette.
Note: The second spin is to ensure the staining is as equal as possible between the samples. If this step is omitted, remaining supernatant adhered to the sides of the 15 mL tube may fall into the staining solution and affect the final staining volume, and thus antibody concentrations during staining.
Resuspend pellet in 50 μL of detergent buffer (see Recipes) and leave at RT for 5 min.
Add 50 μL of detergent buffer with primary antibody: rabbit RNAPII NTD 1:50 (i.e., final dilution 1:100), rat pRNAPII S5 1:50 (i.e., final dilution 1:100), or rat pRNAPII S2 1:50 (i.e., final dilution 1:100). Incubate in the absence of light at RT for 1 h.
Notes:
1) The tube with cells intended for use as secondary antibody control is resuspended in 100 μL of detergent buffer without primary antibody.
2) If EdU staining is included, each sample can be stained with one antibody only.
Add 5 mL of PBS with 2% FBS to each tube.
Spin down cells by centrifugation at 1127 × g for 5 min at RT. Remove most of the supernatant by suction (until approximately 100 μL is left), spin down again, and remove rest of the supernatant with a 200 μL pipette.
Add 100 μL of detergent buffer with secondary antibody: anti-rabbit Alexa Fluor 488 1:500 or anti-rat Alexa Fluor 488 1:500. Incubate in the absence of light at RT for 30 min.
Label EdU with the Click-iT Plus EdU Alexa Fluor 594 Flow Cytometry Assay kit. Prepare by thawing the reaction buffer additive (10×), fluorescent dye azide 594, and copper protectant.
Add 5 mL of PBS with 2% FBS to each tube.
Spin down cells by centrifugation at 1127 × g for 5 min at RT. Remove most of the supernatant by suction (until approximately 100 μL is left), spin down again, and remove rest of the supernatant with a 200 μL pipette.
Resuspend cell pellet in 100 μL of 1× Click-iT permeabilization and wash reagent (see Recipes) and leave for 15 min at RT.
Prepare Click-iT reaction cocktail (see Recipes). This should be used within 15 min of preparation.
Add 500 μL of Click-iT reaction cocktail and incubate in the absence of light at RT for 30 min.
Add 5 mL of PBS with 2% FBS to each tube.
Spin down cells by centrifugation at 1127 × g for 5 min at RT. Remove most of the supernatant by suction (until approximately 100 μL is left), spin down again, and remove rest of the supernatant with a 200 μL pipette.
Label DNA with Hoechst 33258.
Resuspend cells in 500 μL of flow buffer (see Recipes) containing 2.4 μL/mL Hoechst 33258. Incubate in the absence of light at RT for 15 min.
Store in the absence of light at 4 °C overnight or until running flow cytometry.
Data analysis
Acquire data on the flow cytometer
In the flow cytometer acquisition software (DiVA), select the parameters shown in Table 2.
Table 2. Flow cytometry acquisition parameters
Parameter Scale Side scatter (SSC) linear Forward scatter (FSC) linear Hoechst-W (width) linear Hoechst-A (area) linear Alexa Fluor 647 log Alexa Fluor 594 log Alexa Fluor 488 log Open the graphs shown in Table 3.
Table 3. Flow cytometry acquisition graphs
Output x-axis y-axis Size and granularity of cells FSC SSC Single cells Hoechst-W Hoechst-A Barcoding Alexa Fluor 594 Alexa Fluor 647 DNA profile Hoechst-A histogram DNA vs. RNAPII/pRNAPII S5/pRNAPII S2 Hoechst-A Alexa Fluor 488 EdU profile Hoechst-A Alexa Fluor 594 Adjust voltages for FSC vs. SSC such that the majority of the cell population is within the graph window.
Adjust voltage for Hoechst such that the first peak of the histogram is located at 50 K (corresponds to G1 phase).
Gate for single cells based on the distribution of cells in the Hoechst-W vs. Hoechst-A plot (see Figure 2A). While the Hoechst-A will increase during the cell cycle as the DNA content doubles in size, the Hoechst-W (corresponding to the time it takes for the cell to traverse the laser beam) will not increase as much. Doublets (e.g., two G1 cells clumped together) may have equal Hoechst-A signal as G2 cells and can contaminate the G2 cell population. Bu using a narrow Hoechst-W gate, doublets are removed from analysis, as they will have a larger Hoechst-W than single cells (because they take longer time to traverse the laser beam).
Separate barcoded cells (ctrl, shown in orange) from sample (shown in black) based on Alexa Fluor 647 signal and EdU incorporation (Alexa Fluor 594) (Figure 2B). Note that there is bleed-through from high EdU signal into the Alexa Fluor 647 channel, as a subset of the sample population with high Alexa Fluor 594 staining also show high Alexa Fluor 647 intensity. Nevertheless, the barcoded cells form a distinct population that can be separated from the sample cells. Importantly, there is no bleed-through from the EdU (Alexa Fluor 594 signal) into the RNAPII signal (Alexa Fluor 488) (Figure 3).
Gate for cell cycle phases based on EdU incorporation vs. DNA content (Figure 2Ci): G1 cells are negative for EdU and have G1 DNA content. Early S-phase cells have DNA content close to G1 but are EdU positive. Mid S have an intermediary DNA content and are EdU positive. Late S phase have similar DNA content as G2 cells but are EdU positive. G2 cells are EdU negative and have G2 DNA content. Mitotic cells are observed as the small population below the G2 cells and are not included in the analysis of G2 cells. Alternatively, gate for cell cycle phases by DNA content (Figure 2Cii): a strict G1 gate based on DNA content is performed by selecting only the cells to the left of the summit of the G1 peak. This strict gate will minimize contamination of S-phase cells. Likewise, G2 cells are selected to the right of the summit of the G2 peak to minimize contamination of S-phase cells. The S-phase gate should be located between the G1 and G2 peaks. Choosing a location well separated from these will minimize contamination of G1 and G2 cells. The cell cycle gates should be as equal as possible in all the samples during analysis.
Determine median RNAPII levels in individual cell cycle phases.
Raw data output files are generated as .fcs files.
Acquire 20,000 cells of the population identified as sample after separating the sample from the barcoded cells (Figure 2B). If the number of cells is limiting, the minimum number of cells acquired should be 5,000. Use either slow or medium speed when acquiring data on the flow cytometer. Keep the speed constant for all samples.
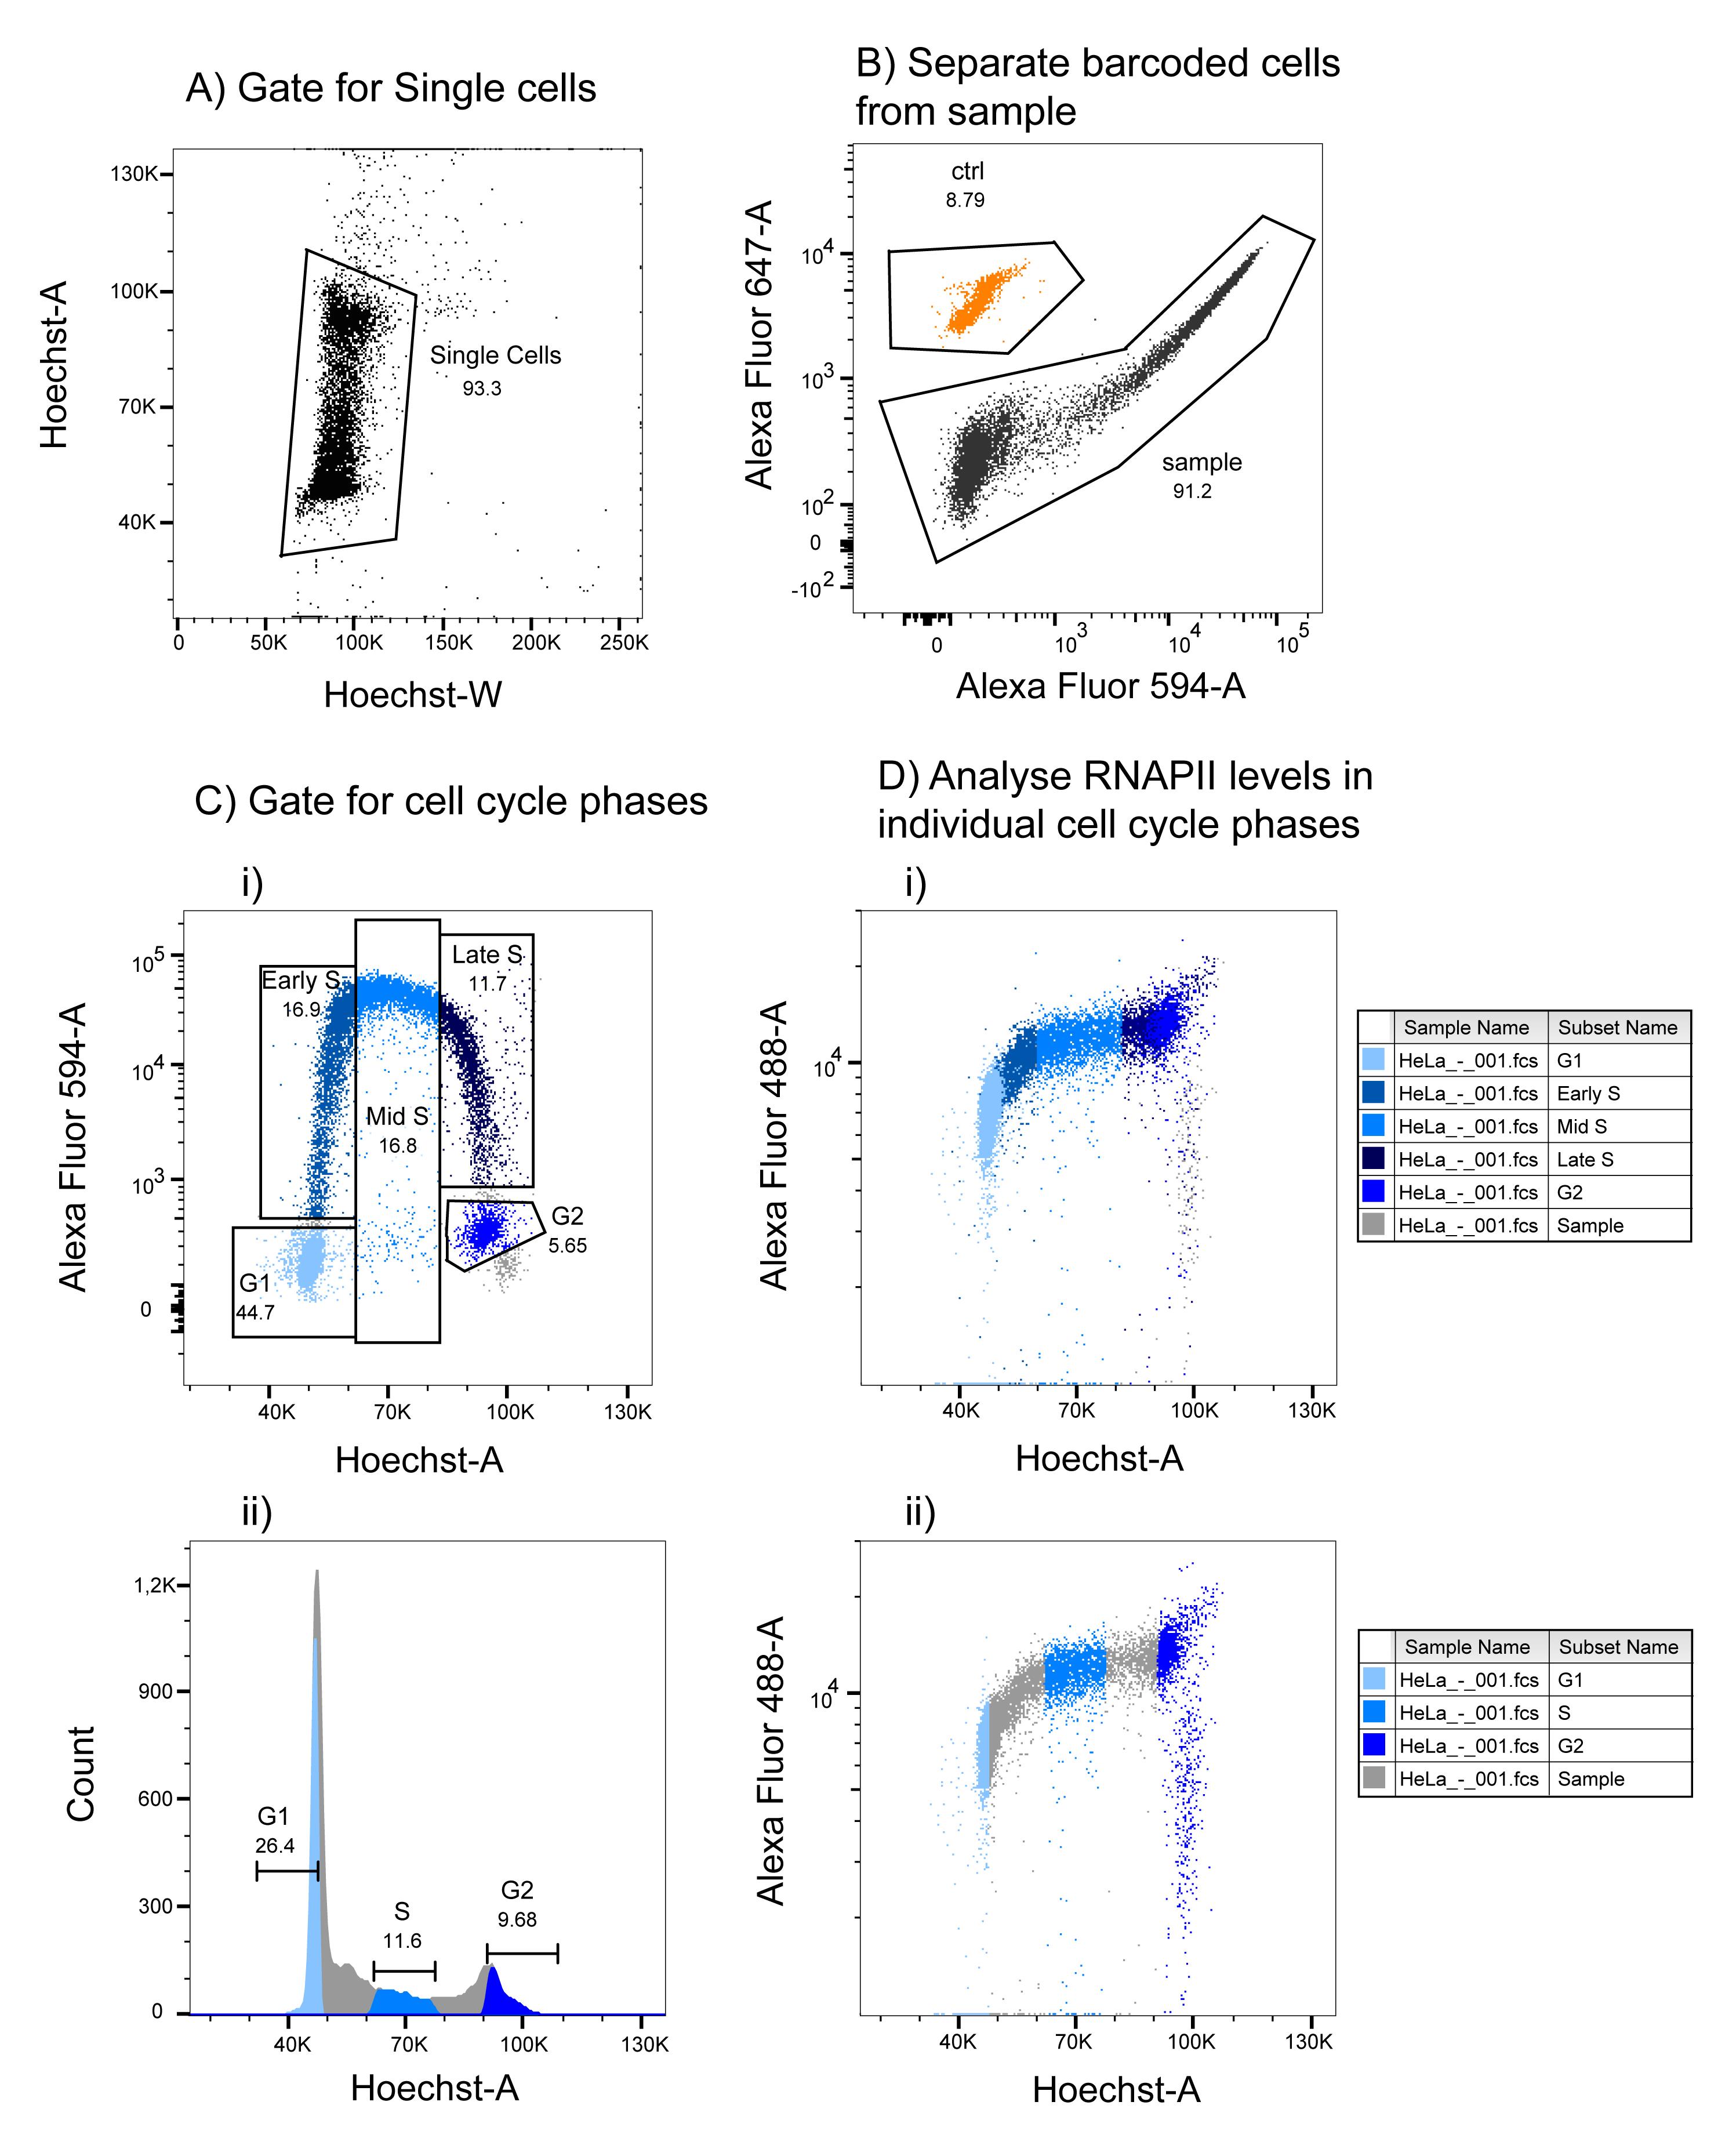
Figure 2. Gating strategy of flow cytometry data. A. Adjust Hoechst voltage so that the G1 peak summit is located at 50 K and gate for single cells as shown. B. Separate the barcoded cells from the sample cells by Alexa Fluor 647 vs. Alexa Fluor 594 signal as shown. C. Gate for cell cycle phases in the sample as indicated based on EdU incorporation and DNA content (Hoechst-A) as shown (i) or DNA content alone (ii) (see text for more details). D. Analyze RNAPII levels in the entire sample, and in individual cell cycle phases, by obtaining the median levels from the cell cycle phase populations defined in C. The cells in the different cell cycle phases from C are shown in the RNAPII scatter plots in D.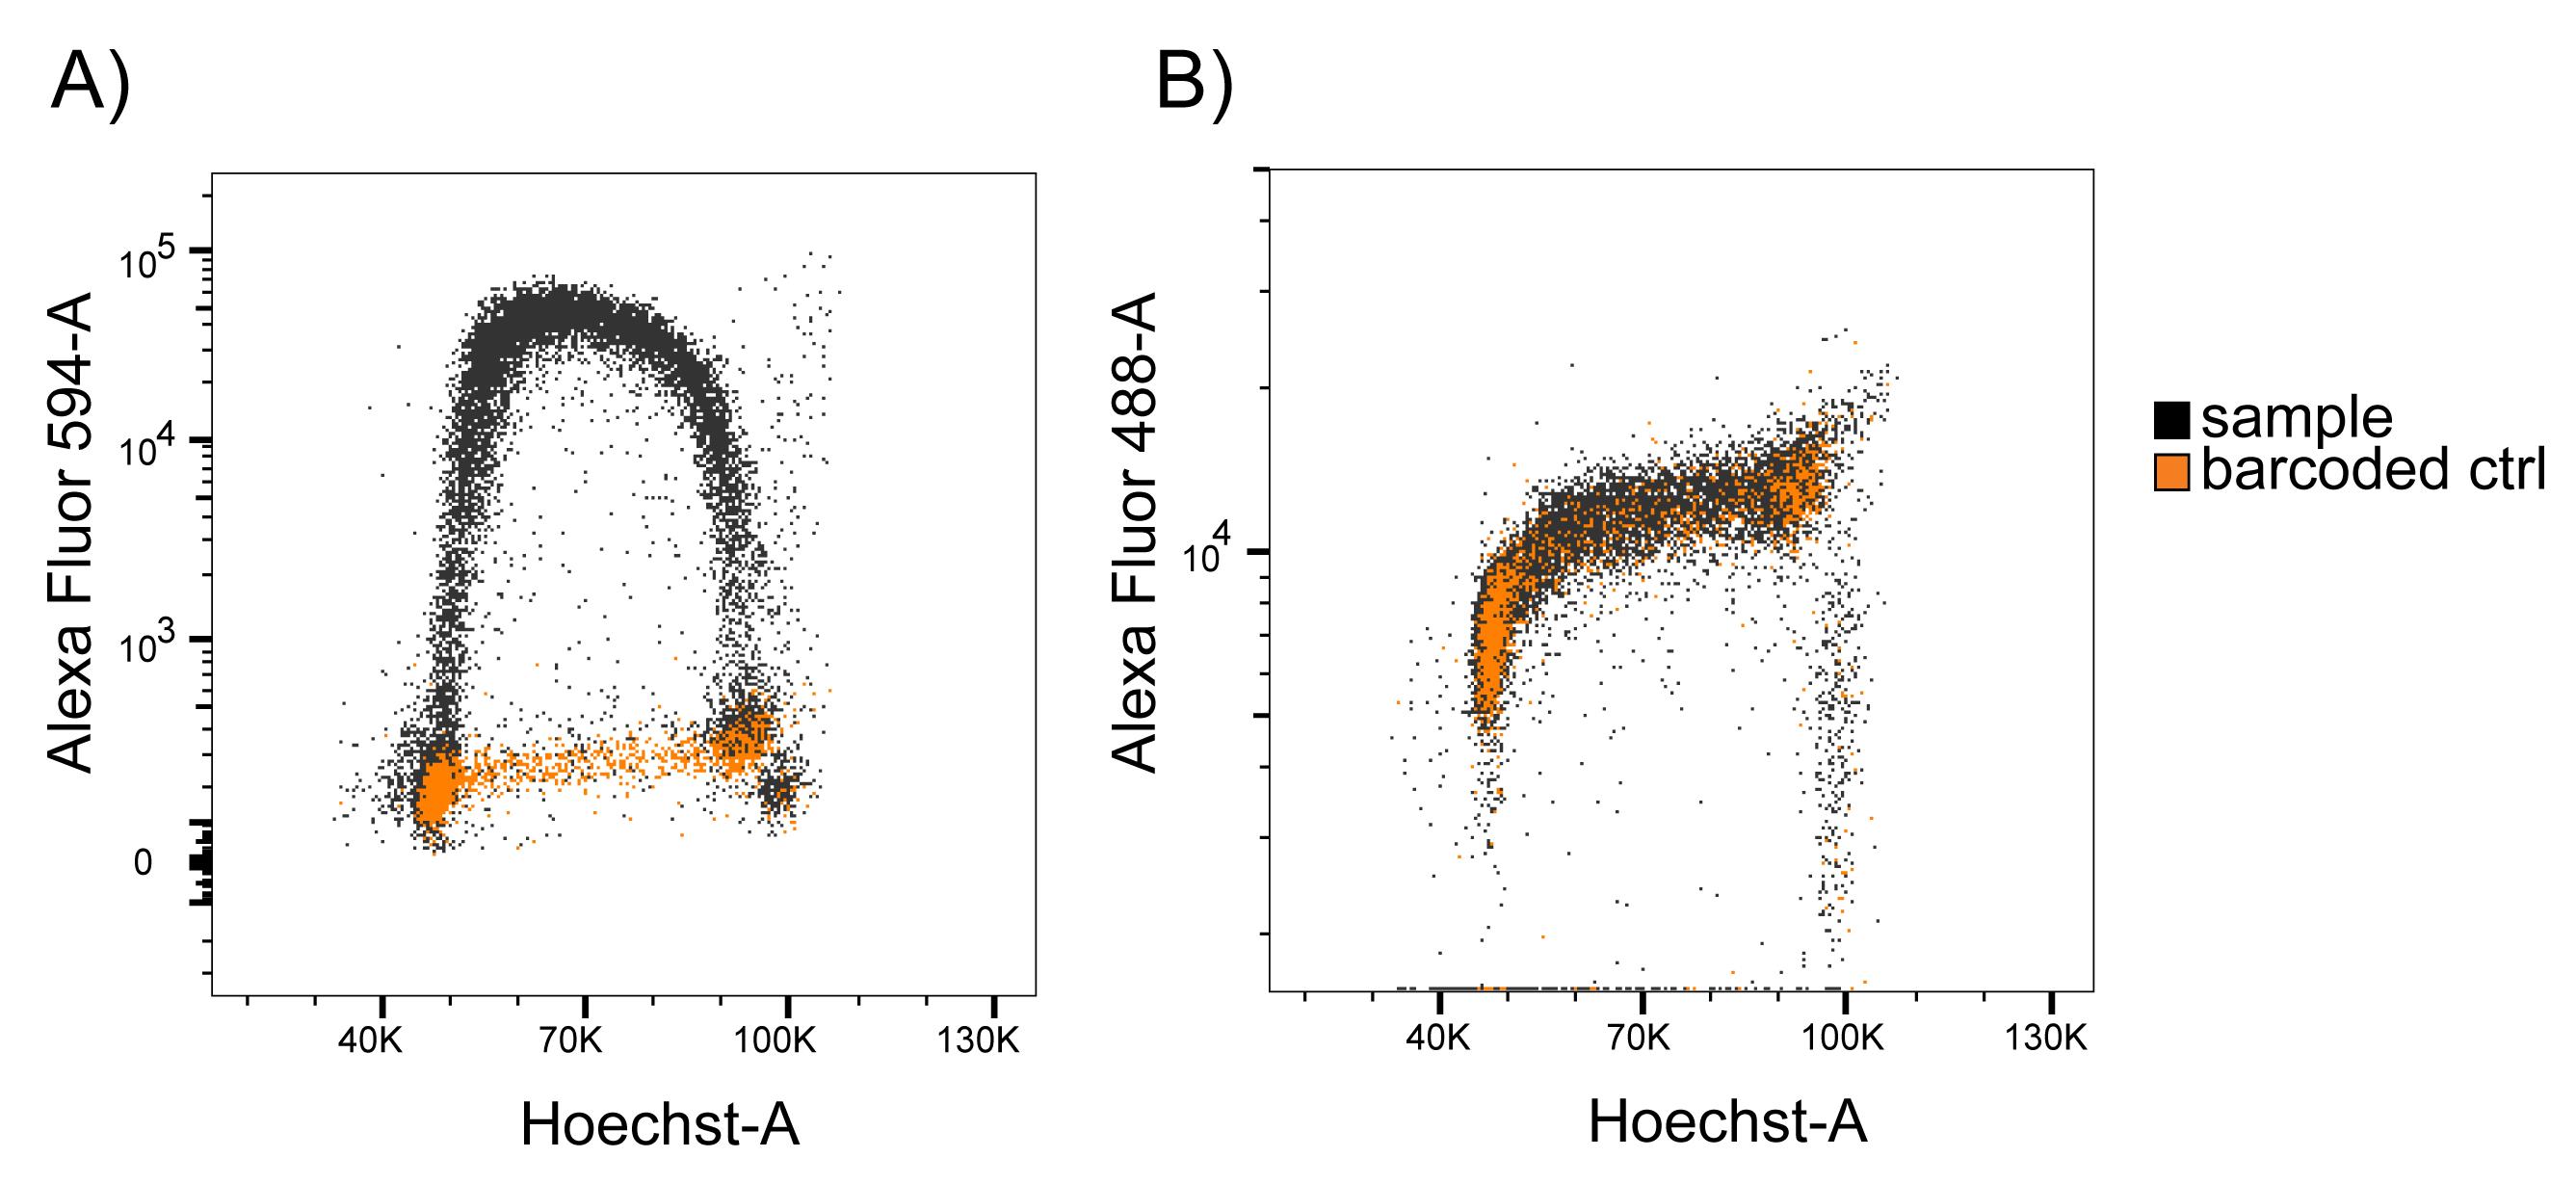
Figure 3. No bleed-through from Alexa Fluor 594-A (EdU) into Alexa Fluor 488-A (RNAPII) measurements. Scatter plots showing A) Alexa Fluor 594 (EdU) and B) Alexa Fluor 488 (RNAPII) intensities vs. Hoechst-A in sample and barcoded cells. Sample cells were identical to the barcoded cells, with the exception of EdU incorporation (performed on sample cells only) and Alexa Fluor 647 barcoding (performed on barcoded cells only). Sample cells show high Alexa Fluor 594 intensity in S phase compared to barcoded cells, which were not treated with EdU. However, intensities of the sample cells overlap completely with the intensities of the barcoded cells in the Alexa Fluor 488 scatter plot, showing that there is no bleed-through from Alexa Fluor 594 into the Alexa Fluor 488 measurements using the conditions described in this protocol.
Analysis of the flow cytometry data
Import .fsc files into a workspace on the flow cytometer software FlowJo V10_5 or other versions of the software.
Use the gating strategy depicted in Figure 2.
RNAPII profiles can be viewed in Layout Editor and median RNAPII levels can be determined in Table Editor.
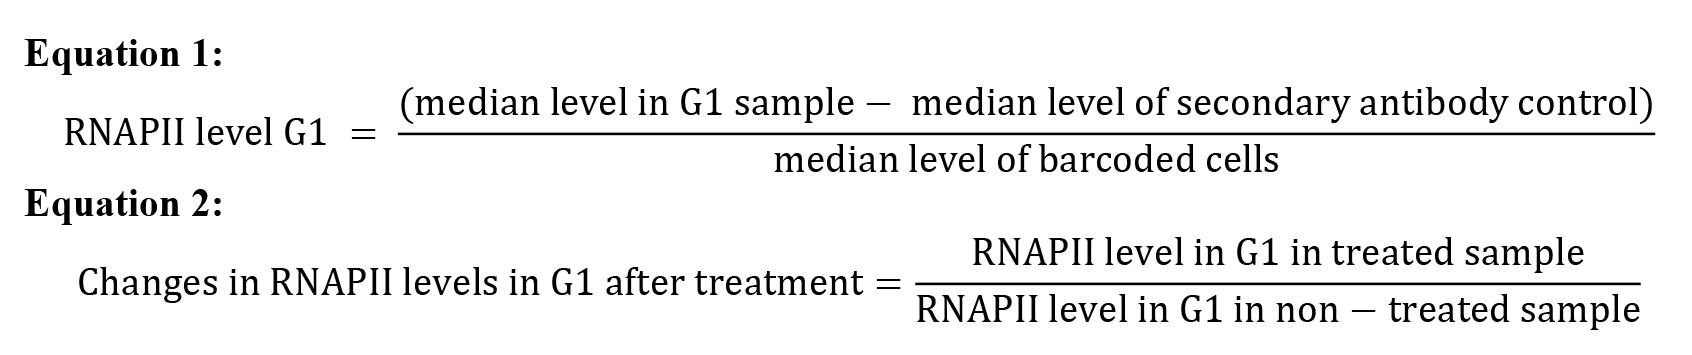
RNAPII level in the sample is determined by subtracting the background fluorescence (using the median level of Alexa Fluor 488 staining in the whole secondary antibody control sample) and by normalizing to the median level of Alexa Fluor 488 staining in the whole barcoded cell sample (Equation 1, G1 levels are shown as an example of cell cycle phase). Also include non-treated cells as one of the samples. This should be used to measure changes after treatment (Equation 2, G1 levels are shown as an example).
Recipes
Chromatin extraction buffer (10 mL)
Reagent Stock Final concentration Volume HEPES, pH 7.9 1 M 20 mM 200 μL MgCl2 0.1 M 1.5 mM 150 μL NaCl 5 M 140 mM 280 μL Sucrose 2.5 M 300 mM 1,200 μL Triton X-100 100% 0.5% 50 μL ddH2O Milli-Q water Adjust with water up to total 10 mL Prior to use, add one tablet of cOmplete EDTA-free protease inhibitor cocktail and one tablet of PhosSTOP phosphatase inhibitors per 10 mL of solution. Add 2 μL of 10 mM MG132 per milliliter of buffer for a final concentration of 20 μM. The extraction buffer should be prepared fresh the day of extraction and kept at 4 °C or on ice prior to use.
LX Alexa Fluor 647 NHS Ester (barcoding)
Add 2 μL of Alexa Fluor 647 NHS Ester (5 mg/mL) stock in 553.5 μL of DMSO; the resulting solution is named working solution (18 μg/mL). Dilute the working solution further by combining 200 µL of the working solution with 160 µL of DMSO. The final solution is called the LX solution (10 µg/mL). Once diluted, the working solution and the LX solution can be stored at -80 °C and are stable for several weeks.
Flow buffer (1 L)
Reagent Stock Final concentration Volume Na2HPO4 0.25 M 6.5 mM 26 mL KH2PO4 1 M 1.5 mM 1.5 mL KCl 1 M 2.7 mM 2.7 mL NaCl 5 M 137 mM 27.4 mL EDTA, pH 7.5 0.5 M 0.5 mM 1 mL ddH2O Milli-Q water Adjust with water up to total 1 L Add 100 μL of Igepal CA-630 100% to 100 mL of flow buffer to obtain a final concentration of 0.1%.
Detergent buffer
Flow buffer + 4% skim milk powder. For 4 mL of flow buffer, add 160 mg of skim milk powder.
Click-iT permeabilization and wash reagent
Reagent Volume PBS 4.5 mL Component E 500 μL BSA 1% Component E is from the Click-iT Plus EdU Alexa Fluor 594 Flow Cytometry Assay kit.
Click-iT reaction cocktail
The copper protectant, fluorescent dye picolyl azide, and 10× reaction buffer additive are obtained from the Click-iT Plus EdU Alexa Fluor 594 Flow Cytometry Assay kit. Dilute 10× reaction buffer additive 1:10 in ddH2O Milli-Q water.
Reagent Volume (for one reaction/sample) PBS 438 μL Copper protectant (Component F) 10 μL Fluorescent dye picolyl azide 2.5 μL Reaction buffer additive 1× 50 μL Total reaction volume 500 μL Adjust volumes according to number of samples in the experiment.
Acknowledgments
The method described here is further developed from Landsverk et al. (2020), Håland et al. (2015) and Stokke et al. (1993). We would like to thank the flow cytometry core facility at the Radium Hospital, Oslo University Hospital, for assistance and use of the flow cytometers. This work was funded by the Norwegian Research Council (275918) and Nansenfondet og de dermed forbundne fond.
Competing interests
The authors declare no competing interests.
References
Akoulitchev, S. and Reinberg, D. (1998). The molecular mechanism of mitotic inhibition of TFIIH is mediated by phosphorylation of CDK7. Genes Dev 12(22): 3541-3550.
- Bay, L. T. E., Syljuåsen, R. G. and Landsverk, H. B. (2022). A novel, rapid and sensitive flow cytometry method reveals degradation of promoter proximal paused RNAPII in the presence and absence of UV. Nucleic Acids Res 50(15): e89.
- Britton, S., Coates, J. and Jackson, S. P. (2013). A new method for high-resolution imaging of Ku foci to decipher mechanisms of DNA double-strand break repair. J Cell Biol 202(3): 579-595.
- Chan, F. L., Marshall, O. J., Saffery, R., Kim, B. W., Earle, E., Choo, K. H. and Wong, L. H. (2012). Active transcription and essential role of RNA polymerase II at the centromere during mitosis. Proc Natl Acad Sci U S A 109(6): 1979-1984.
- Dale Rein, I., Stokke, C., Jalal, M., Myklebust, J. H., Patzke, S. and Stokke, T. (2015). New distinct compartments in the G2 phase of the cell cycle defined by the levels of gammaH2AX. Cell Cycle 14(20): 3261-3269.
- Enserink, J. M. and Chymkowitch, P. (2022). Cell Cycle-Dependent Transcription: The Cyclin Dependent Kinase Cdk1 Is a Direct Regulator of Basal Transcription Machineries. Int J Mol Sci 23(3): 1293.
- Forment, J. V. and Jackson, S. P. (2015). A flow cytometry-based method to simplify the analysis and quantification of protein association to chromatin in mammalian cells. Nat Protoc 10(9): 1297-1307.
- Forment, J. V., Walker, R. V. and Jackson, S. P. (2012). A high-throughput, flow cytometry-based method to quantify DNA-end resection in mammalian cells. Cytometry A 81(10): 922-928.
- Håland, T. W., Boye, E., Stokke, T., Grallert, B. and Syljuåsen, R. G. (2015). Simultaneous measurement of passage through the restriction point and MCM loading in single cells. Nucleic Acids Res 43(22): e150.
- Hauge, S., Eek Mariampillai, A., Rødland, G. E., Bay, L. T. E., Landsverk, H. B. and Syljuåsen, R. G. (2021). Expanding roles of cell cycle checkpoint inhibitors in radiation oncology. Int J Radiat Biol: 1-10.
- Heidemann, M., Hintermair, C., Voss, K. and Eick, D. (2013). Dynamic phosphorylation patterns of RNA polymerase II CTD during transcription. Biochim Biophys Acta 1829(1): 55-62.
- Kilgas, S., Kiltie, A. E. and Ramadan, K. (2021). Immunofluorescence microscopy-based detection of ssDNA foci by BrdU in mammalian cells. STAR Protoc 2(4): 100978.
- Krutzik, P. O. and Nolan, G. P. (2006). Fluorescent cell barcoding in flow cytometry allows high-throughput drug screening and signaling profiling. Nat Methods 3(5): 361-368.
- Lagerwerf, S., Vrouwe, M. G., Overmeer, R. M., Fousteri, M. I. and Mullenders, L. H. (2011). DNA damage response and transcription. DNA Repair (Amst) 10(7): 743-750.
- Landsverk, H. B., Sandquist, L. E., Bay, L. T. E., Steurer, B., Campsteijn, C., Landsverk, O. J. B., Marteijn, J. A., Petermann, E., Trinkle-Mulcahy, L. and Syljuåsen, R. G. (2020). WDR82/PNUTS-PP1 Prevents Transcription-Replication Conflicts by Promoting RNA Polymerase II Degradation on Chromatin. Cell Rep 33(9): 108469.
- Landsverk, H. B., Sandquist, L. E., Bay, L. T. E. and Syljuåsen, R. G. (2021). New link between the RNA polymerase II-CTD and replication stress. Mol Cell Oncol 8(3): 1910008.
- Lans, H., Hoeijmakers, J. H. J., Vermeulen, W. and Marteijn, J. A. (2019). The DNA damage response to transcription stress. Nat Rev Mol Cell Biol 20(12): 766-784.
- Liang, K., Woodfin, A. R., Slaughter, B. D., Unruh, J. R., Box, A. C., Rickels, R. A., Gao, X., Haug, J. S., Jaspersen, S. L. and Shilatifard, A. (2015). Mitotic Transcriptional Activation: Clearance of Actively Engaged Pol II via Transcriptional Elongation Control in Mitosis. Mol Cell 60(3): 435-445.
- Ljungman, M. and Lane, D. P. (2004). Transcription - guarding the genome by sensing DNA damage. Nat Rev Cancer 4(9): 727-737.
- Palozola, K. C., Donahue, G., Liu, H., Grant, G. R., Becker, J. S., Cote, A., Yu, H., Raj, A. and Zaret, K. S. (2017). Mitotic transcription and waves of gene reactivation during mitotic exit. Science 358(6359): 119-122.
- Steurer, B., Janssens, R. C., Geijer, M. E., Aprile-Garcia, F., Geverts, B., Theil, A. F., Hummel, B., van Royen, M. E., Evers, B., Bernards, R., et al. (2022). DNA damage-induced transcription stress triggers the genome-wide degradation of promoter-bound Pol II. Nat Commun 13(1): 3624.
- Steurer, B., Janssens, R. C., Geverts, B., Geijer, M. E., Wienholz, F., Theil, A. F., Chang, J., Dealy, S., Pothof, J., van Cappellen, W. A., et al. (2018). Live-cell analysis of endogenous GFP-RPB1 uncovers rapid turnover of initiating and promoter-paused RNA Polymerase II. Proc Natl Acad Sci U S A 115(19): E4368-E4376.
- Stokke, T., Erikstein, B., Holte, H., Funderud, S. and Steen, H. B. (1991). Cell cycle-specific expression and nuclear binding of DNA polymerase alpha. Mol Cell Biol 11(6): 3384-3389.
- Stokke, T., Erikstein, B. K., Smedshammer, L., Boye, E. and Steen, H. B. (1993). The retinoblastoma gene product is bound in the nucleus in early G1 phase. Exp Cell Res 204(1): 147-155.
- Syljuåsen, R. G., Sørensen, C. S., Hansen, L. T., Fugger, K., Lundin, C., Johansson, F., Helleday, T., Sehested, M., Lukas, J. and Bartek, J. (2005). Inhibition of human Chk1 causes increased initiation of DNA replication, phosphorylation of ATR targets, and DNA breakage. Mol Cell Biol 25(9): 3553-3562.
- Teves, S. S., An, L., Bhargava-Shah, A., Xie, L., Darzacq, X. and Tjian, R. (2018). A stable mode of bookmarking by TBP recruits RNA polymerase II to mitotic chromosomes. Elife 7: e35621.
- Wang, J., Rojas, P., Mao, J., Muste Sadurni, M., Garnier, O., Xiao, S., Higgs, M. R., Garcia, P. and Saponaro, M. (2021). Persistence of RNA transcription during DNA replication delays duplication of transcription start sites until G2/M. Cell Rep 34(7): 108759.
- Wilson, M. D., Harreman, M. and Svejstrup, J. Q. (2013). Ubiquitylation and degradation of elongating RNA polymerase II: the last resort. Biochim Biophys Acta 1829(1): 151-157.
Article Information
Copyright
© 2023 The Author(s); This is an open access article under the CC BY-NC license (https://creativecommons.org/licenses/by-nc/4.0/).
How to cite
Bay, L. T. E., Stokke, T., Syljuåsen, R. G. and Landsverk, H. B. (2023). Analysis of RNA Polymerase II Chromatin Binding by Flow Cytometry. Bio-protocol 13(8): e4659. DOI: 10.21769/BioProtoc.4659.
Category
Cancer Biology > Cell cycle checkpoints > Cell biology assays
Cell Biology > Cell-based analysis > Flow cytometry
Do you have any questions about this protocol?
Post your question to gather feedback from the community. We will also invite the authors of this article to respond.