- Protocols

- Articles and Issues
- For Authors
- About
- Become a Reviewer

Fluorescence Assays for Real-Time Tracking of Cell Surface Protein Internalization and Endosomal Sorting in Axons of Primary Mouse Hippocampal Neurons
Published: Vol 13, Iss 7, Apr 5, 2023 DOI: 10.21769/BioProtoc.4651 Views: 2442
Reviewed by: Xi FengElma FriasAnonymous reviewer(s)
Original research article
The authors used this protocol in:
Dec 2021
Advertisement


Protocol Collections
Comprehensive collections of detailed, peer-reviewed protocols focusing on specific topics


Related protocols
Abstract
The trafficking and sorting of proteins through the secretory-endolysosomal system is critical for the proper functioning of neurons. Defects in steps of these pathways are associated with neuronal toxicity in various neurodegenerative disorders. The prion protein (PrP) is a glycosylphosphatidylinositol (GPI)-anchored protein that follows the secretory pathway before reaching the cell surface. Following endocytosis from the cell surface, PrP sorts into endosomes and lysosomes for further recycling and degradation, respectively. A few detailed protocols using drug treatments and fluorescent dyes have previously allowed the tracking of PrP trafficking routes in real time in non-neuronal cells. Here, we present a protocol optimized for primary neurons that aims to monitor and/or manipulate the trafficking and sorting of PrP particles at several steps during their secretory-endolysosomal itineraries, including (a) ER export, (b) endocytosis, (c) lysosomal degradation, and (d) accumulation in axonal endolysosomes. These primary neuron live assays allow for the robust quantitation of accumulation and/or degradation of PrP or of other membrane-associated proteins that transition from the ER to the Golgi via the cell surface.
Graphical abstract
Background
Both wild-type (PrPWT) and mutant prion proteins (PrPmut) exit the ER and Golgi and follow secretory and endolysosomal trafficking pathways en route to somatodendritic and axonal cell surfaces, where PrP attaches via its glycosylphosphatidylinositol (GPI) anchor prior to internalization (Satpute-Krishnan et al., 2014; Zavodszky and Hegde, 2019; Chassefeyre et al., 2021). From the cell surface, PrPWT is endocytosed and sorted into endosomes or lysosomes for recycling or degradation, respectively, while PrPmut accumulates inside non-acidic/non-degradative enlarged endolysosomes where it can form aggregates called endoggresomes (Chassefeyre et al., 2021). PrPmut endoggresome formation in axons occurs via an axonal rapid endosomal sorting and transport-dependent aggregation (ARESTA) pathway (Chassefeyre et al., 2021). In ARESTA, vesicles containing luminal PrPmut exit from the Golgi after association with a protein complex composed of the small endolysosomal guanosine triphosphatase (GTPase) ARL8b. ARL8b recruits its effectors SifA and kinesin-interacting protein (SKIP), the kinesin-1 (KIF5C) molecular motor and associated kinesin light chain 1 (KLC1) subunit, and the vacuolar protein sorting 41 (VPS41), a member of the multiunit homotypic fusion and protein sorting (HOPS) complex (Hofmann and Munro, 2006; Khatter et al., 2015), which associate to endosomes carrying PrPmut and promote their entry into the axon and their homotypic fusion to form endoggresomes (Graphical abstract). For aggregation to occur in axons, endosomes carrying PrPmut homotypically fuse within axons after direct trafficking from the Golgi, or after undergoing rapid bouts of exocytosis and endocytosis throughout the axonal surface prior to fusion via the HOPS fusion complex. The rapid and very transient residence at the cell surface of PrPmut compared to PrPWT is key for the formation of endoggresomes vs. their degradation in axons. To understand the biology of misfolded PrPmut endoggresome formation vs. the normal trafficking of PrPWT, it is therefore critical to follow the transit of PrP particles throughout these subcellular itineraries.
Previous studies using drug treatments and fluorescent assays could monitor the trafficking routes of misfolded PrP in non-neuronal cells grown in culture (Satpute-Krishnan et al., 2014; Zavodszky and Hegde, 2019). However, as neurons are primary targets in prion diseases, it is important to follow the subcellular sorting of misfolded PrP in neurons, including in highly polarized compartments such as axons, which are primarily affected in disease. Here, we present live assays to image and quantitate the formation of PrPmut endoggresomes along their subcellular transit inside vesicles at the single-particle level using standard fluorescence microscopy, in either the soma or in axons of primary neurons, in the presence or absence of compounds that can modulate ER export and internalization capacity. These assays also monitor PrPmut accumulation in endolysosomal compartments. These approaches allowed the identification of trafficking and sorting pathways of PrPmut endoggresome biogenesis and would allow the monitoring of the trafficking of various other membrane proteins, including of the amyloid precursor protein (APP) or amyloid beta peptides implicated in the pathophysiology of Alzheimer’s disease, using cultured primary neurons as a model system.
Materials and Reagents
60 × 15 mm NuncTM Cell Culture/Petri Dishes (Thermo Fisher, catalog number: 150288)
150 × 21 mm NuncTM Cell Culture/Petri Dishes (Thermo Fisher, catalog number: 168381)
15 mL Falcon tube (Thermo Fisher, catalog number: 12565268)
#1.5 thickness 12 mm coverslip (Neuvitro, catalog number: NC0319857)
Note: Wash 3× acetone, 3× ethanol, and rinse 3× with sterile water; store in sterile water.
Cell culture plate, size 24-wells, sterile, flat bottom, tissue-culture treated (Sigma, catalog number: SIAL0524)
Syringe filter Millex-GP, 33 mm, PES, 0.22 µm, gamma-sterile, hydrophilic, FDA, CE, 50 pc/PAK (Millipore, catalog number: MPSLGPM33RS)
Eppendorf® Safe-Lock microcentrifuge tubes, 1.5 mL (Sigma, catalog number: T9661)
45 units of papain (Worthington, catalog number: PAPL LS003119)
Hanks' Balanced Salt Solution (HBSS), calcium, magnesium (Gibco, catalog number: 24020-117), store at 4 °C
LipofectamineTM 2000 transfection reagent (Invitrogen, catalog number: 11668030), store at 4 °C
Brefeldin A solution (1,000×) (BioLegend, catalog number: 420601), 5 mg/mL, store at 4 °C
Bungarotoxin (BTX), Alexa Fluor® 647 (AF647) conjugate (Thermo Fisher, catalog number: B35450)
Resuspend in H2O at a concentration of 1 mg/mL
Add sodium azide (Sigma, catalog number: 199931) at 2 mM
Store small aliquots at -20 °C. Avoid freezing and thawing. Protect from light
Tubocurarine hydrochloride pentahydrate (Sigma, catalog number: T2379-100MG)
Resuspend in H2O at 10 mM stock concentration
Store aliquots at 4 °C
Dynasore hydrate (Sigma, catalog number: D7693-5MG)
Resuspend in DMSO to make 80 mM stock solution, store at -20 °C.
LysoTrackerTM Green DND-26 (Invitrogen, catalog number: L7526), 1 mM, store at -20 °C
Magic Red Cathepsin-B Assay kit (ImmunoChemistry Technologies, catalog number: 937), store at 4 °C
Resuspend in 200 µL DMSO to the vial to make 250× stock, store at 4 °C.
Before each use, dilute the 250× DMSO stock in sterile H2O at 1:10 to make 25× sub-stock. Use immediately.
Thrombin from rat plasma (Sigma, catalog number: T5772-100UN), lyophilized powder
Resuspend in 1 mL to make a stock of 100 U/ml (20×), store at -20 °C.
Dimethyl sulfoxide (DMSO) (Sigma, catalog number: D4540), ≥99.5% (GC), suitable for cell culture
Phosphate-buffered saline (PBS), pH 7.2 (Gibco, catalog number: 20012027), suitable for cell culture
Water, cell culture grade (Corning, catalog number: 15363651)
Borate buffer (5 mL) (see Recipes)
Boric acid (Fisher, catalog number: A73-500)
Borax (Sigma, catalog number: B-9876)
1 mL of 0.05% DNaseI (see Recipes)
DNaseI (Boehringer, catalog number: 10104159001, 100 mg from bovine pancreas, grade II)
MgSO4 (Fisher, catalog number: BP213-1)
HBSS (Gibco, catalog number: 24020-117) (without Pen-Strep)
Poly-L-lysine stock solution (see Recipes)
5 mg bottle of Poly-L-lysine hydrobromide, molecular weight = 300,000, lyophilized powder, gamma-irradiated, BioXtra, suitable for cell culture (Sigma, catalog number: P5899-5MG)
Dissection media (see Recipes)
HBSS (Gibco, catalog number: 24020117)
D-glucose (Sigma, catalog number: G6152-100g or G5767-500g)
HEPES (Sigma, catalog number: H4034-100g or H-7523-50g)
Pen-Strep (Gibco, catalog number: 15140148 for 20 mL)
Brain digestion enzyme (Mixture A) (see Recipes)
PBS (Gibco, catalog number: 21600069, or DPBS, catalog number: 14190-144)
DL-cysteine HCl (Sigma, catalog number: C9768)
BSA (Sigma, catalog number: A7906-100G)
D-glucose (Sigma, catalog number: G6152)
Plating media (see Recipes)
DMEM High Glucose (1×) with phenol red + L-Glut w/o Sod. Pyr. (Gibco, catalog number: 11965092)
FBS (Gibco, catalog number: 26050-070)
Growth media (see Recipes)
Neurobasal A (NBA) medium with phenol red (Gibco, catalog number: 10888022)
B-27 Supplement (50×) (Gibco, catalog number: 17504044)
GlutaMAX-I 100× (Gibco, catalog number: 35050061)
Equipment
Surgical scissors (sharp/blunt) 4–6” (Fine Science Tools, catalog number: 14028-10)
Dumont forceps Super Fine #7 (Fine Science Tools, catalog number: 11271-30)
For brain dissections: stereo microscope equipped with dual top and bottom illumination, and with 6× and 12× magnification eyepieces/objectives.
5 mL NuncTM serological pipettes (Thermo Scientific, catalog number: 170355N)
10 mL NuncTM serological pipettes (Thermo Scientific, catalog number: 170356N)
25 mL NuncTM serological pipettes (Thermo Scientific, catalog number: 170357N)
Nikon Ti-E Perfect Focus inverted fluorescence microscope, with a total internal reflection fluorescence (TIRF) setup, equipped with 100×/1.49NA objectives and Andor iXon + DU897 EM Camera
CO2 incubator for live imaging on the microscope
35 mm Dish | No. 1.5 Coverslip | 14 mm glass diameter | uncoated (MatTek, catalog number: P35G-1.5-14-C)
Biosafety cabinet Class II
SciSpin MINI microfuge BLUE, with rotor for 8 × 1.5/2.2 mL, (7,000 rpm/2,680 × g) (SciQuip, catalog numbers: SS-6050 and SS-6058)
Software
ImageJ (Fiji) software (free download from https://imagej.net/software/fiji/)
Microsoft Excel
Procedure
Hippocampal neuron plating preparation
Note: Steps 1–5 should be performed under sterile conditions in a tissue culture room and in a class II biosafety hood, equipped with a vacuum flask system and an aspirator hood.
Dilute poly-L-lysine stock solution to a working solution of 50 µg/mL. Add an appropriate amount of working solution to coat glass coverslips placed inside wells of a 24-well plate (~500 µL/well) or a 35 mm MatTek glass-bottom dish (~1 mL/well) and incubate at 37 °C for at least 2 h or overnight, a range that in our experience coats the coverslip surface for the proper adherence of hippocampal neurons.
Wash coverslips three times in sterile, cell culture grade water.
Fill each well of a 24-well plate containing single coverslips with 500 µL of Plating media (DMEM + 10% FBS) (half the final volume) and incubate at 37 °C and 5.0% CO2 until plating (see Notes #4 below).
Thaw Mixture A and DNase I. Mix 5 mL of Mixture A + 45 units of papain powder in a 15 mL Falcon tube and incubate in a 37 °C water bath for 15 min until papain dissolves completely. Then, add 1 mL of 0.05% DNase I, filter-sterilize the mixture through a 0.22 µm filter, and keep the solution in a 15 mL Falcon tube at room temperature for up to 2 h.
Pre-warm ~25 mL of the Plating media (DMEM + 10% FBS) at 37 °C and 5.0% CO2 in a 150 mm dish.
Mouse hippocampal neuron isolation and plating [adapted from Kaech and Banker (2006)]
Note: Steps 1–8 can be done on a standard laboratory bench. Steps 9–16 should be done in a class II biosafety hood, equipped with a vacuum flask system and an aspirator hood. Steps 4–8 should be done quickly, ideally in under 30 min to avoid deterioration of tissue.
Collect mouse neonates at P0 (Day 0) and up to P2 (Day 2). Keep the pups in contact with a bag of warm water or with a preheated heating pad.
Clean the dissection tools with water and soap, followed by a wash with 70% ethanol.
Dish A and B: Put ~8 mL of Dissection media into two 60 mm dishes and in a 15 mL Falcon tube inside an ice bucket (Figure 1).
Decapitate the pups with surgical scissors into Dish A, containing the Dissection media. Shake gently to clean off the blood (Figure 1A).
Peel off the skin and the skull using two Dumont forceps. Isolate the brain into Dish B (Figure 1B).
Split the brain along the midline with Dumont forceps. Remove the cerebellum on the posterior side and discard. Position the medial side of the hemisphere facing up. Remove the midbrain (ventral part) by inserting the Dumont forceps ~45° and flipping. Peel off meninges (membrane covering cortex) and blood vessels (Figure 1C).
Ensure the hippocampus (seahorse/banana shaped) is visible and intact. To isolate hippocampus, stabilize the hemisphere by spearing the base of the brain and by cutting along the top edges of the hippocampus using Dumont forceps (Figure 1C).
Figure 1. Isolation of hippocampi from mouse P0–P2 neonates for primary hippocampal cultures. (A) Decapitate; (B) Remove the brain; (C) Harvest the hippocampus (outlined by dotted lines in bottom figure). Numbers 4–7 correspond to steps in Procedure B. (adapted from https://www.thermofisher.com/us/en/home/references/protocols/neurobiology/neurobiology-protocols/isolation-of-mouse-primary-neurons.html).Using a 10 mL serological pipette, gently transfer both hippocampi into a 15 mL Falcon tube containing Dissection media. Repeat the steps to harvest more hippocampi, if needed.
Note: Work inside a biosafety hood for the rest of the protocol.
Aspirate the Dissection media and wash the hippocampi twice in ~8 mL of cold HBSS (without antibiotics).
Note: Be careful not to aspirate hippocampi.
Aspirate HBSS. Add ~1 mL of the Brain Digestion Enzyme (5 mL of Mixture A + 45 units of papain + 1 mL of 0.05% DNaseI) per two hippocampi. Incubate for 15 min at 37 °C. Invert the tube gently by hand a couple of times every 2–5 min, so that dead cells on the outer layers detach during this step.
Note: It is critical for viability of plated neurons that temperature is 37 °C and not higher.
Aspirate the Brain Digestion Enzyme slowly and gently. Wash twice with ~6 mL of Plating media (DMEM + 10% FBS), pre-warmed at 37 °C.
Aspirate the Plating media and add back ~1.2 mL of Plating media per two hippocampi. Use a P1000 micropipette to pipette up and down 7–10 times to dissociate the hippocampi (avoid making bubbles). Let the debris sink for 3–5 min.
Pipette ~1 mL of the top part of the supernatant containing dissociated cells into a new 15 mL Falcon tube and add 5 mL of the Plating media for a total volume of 6 mL.
Plating cells in 24-well plates: pipette ~500 µL of the cells into each well of a 24-well plate containing 500 µL of pre-warmed Plating media. Mix each well carefully. The cell density plated for experiments in this protocol is two hippocampi in 12 wells of a 24-well plate, which corresponds to ~ 70,000–125,000 cells per well.
Incubate the cells at 37 °C and 5.0% CO2 (see Notes #4 below), for 1–5 h to allow attachment of the cells to the coverslips.
Gently aspirate the Plating media one well at a time using a P1000 micropipette and replace immediately with 1 mL of Growth media (NBA + B-27 + GlutaMAX) per well. This media should be pre-warmed in the incubator at 37 °C and 5.0% CO2 (see Notes #4 below). Incubate cells at 37 °C and 5.0% CO2 (see Notes #4 below).
Note: Do not let coverslips dry during media change.
Check the plate under the microscope for density, growth, and health of neurons every day. At Days in vitro (DIV) 2, neurites with growth cones should be visible in healthy neurons (Figure 2A). At DIV 4–5, axons (orange arrows) and dendrites (green arrows) are identifiable by morphology (Figure 2B). From this stage forward, neurons are ready for transfection and imaging. By DIV 9–10, axons and dendrites continue to grow and fasciculate extensively (Figure 2C). Researchers might find it difficult to discern a single axon without transfection of axonal fluorescent proteins.
Figure 2. Growth of cultured primary hippocampal neurons at (A) day in vitro (DIV) 2, (B) DIV 4, (C) DIV 9. Neurons were plated at 1:12 dilution, i.e., two hippocampi were plated in 12 wells in a 24-well plate, yielding 75,000–125,000 cells/coverslip. Images were taken with a Nikon Plan Fluor 40×/1.3NA oil objective using Differential Interference Contrast (DIC) optics. Asterisks = soma; arrows point at axons (orange arrows) or dendrites (green arrows). Scale bar = 10 μm.
Transfection of cultured mouse hippocampal neurons
Note: This protocol is modified from one suggested for the use of Lipofectamine 2000 (InvitrogenTM;https://www.thermofisher.com/us/en/home/references/protocols/cell-culture/transfection-protocol/lipofectamine-2000.html). This protocol is for the transfection of one coverslip in a 24-well plate of neurons at DIV 5–8; adjust accordingly for the number of coverslips required. These steps should be done under a sterile biosafety hood in a tissue culture room.
Prepare two 1.5 mL Eppendorf tubes.
In tube 1, add 50 μL (volume adjusted) of Growth media + 400–800 ng of endotoxin-free purified plasmids that will be transfected. For PrP-mCherry (mCh) plasmids, we added 800 ng. Mix by flicking the tip of the Eppendorf tube and incubate for 5 min.
In tube 2, add 48 μL of Growth media + 2 μL of Lipofectamine 2000. Mix by flicking the tip of the Eppendorf tube and incubate for 5 min.
Spin tube 1 and tube 2 quickly (~5 s) in a MINI microfuge.
After 5 min of incubation, combine the diluted DNA (tube 1) with the diluted Lipofectamine 2000 (tube 2) by dropwise pipetting. Mix by flicking the tip of the Eppendorf tube and incubate the mixture at room temperature for 30 min.
Transfer 500 μL of the media from each well of the 24-well plate, where neurons have been plated for 5–8 days (DIV 5–8), into empty wells of a 24-well plate and add 500 μL of new Growth media to these wells to make a total of 1mL. This will be the media to add back to each well of neurons after transfection to allow the transfer of neurotrophic factors secreted in each well pre-transfection.
Add 100 μL of plasmid-Lipofectamine 2000 mix to each well of the 24-well plate where the neurons are plated. Incubate at 37°C and 5.0% CO2 for 2 h (see Notes #4 below).
After 2 h, replace all the media from each well containing the neurons with the Growth media prepared in step 4. Protein expression from the plasmid transfection depends on the plasmid, protein being expressed, and concentration being transfected, but could occur as early as 45 min to 1 h after transfection.
Notes:
Incubation in Lipofectamine 2000 for longer than 3–4 h will result in toxicity.
This protocol usually yields 1%–5% transfection efficiency, which is useful to observe fluorescent protein expression in single neurons and in single axons.
Brefeldin A (BFA) treatment
Note: Parts D–K will demonstrate the experimental procedures for PrPPG14-mCh expressing neurons. The same procedures apply to PrPWT-mCh (control) or any other membrane protein of interest.
Retention of PrPPG14-mCh in the ER
Prepare the transfection mixture (Lipofectamine 2000 + plasmids) as in Procedure C. In the 100 μL mixture, add 0.5 μL of 1,000× BFA solution (1:200 dilution).
Apply the transfection mixture with BFA to neurons. The final concentration of BFA per well is 5 μg/mL (1×).
Incubate for 1 h at 37 °C and 5.0% CO2 (see Notes #4 below) and replace the media with 5 μg/mL BFA for another 1–5 h (Figure 3A).
Note: Longer incubation time results in higher protein expression but more leakage from ER into other compartments.
Image the PrPPG14-mCh expression pattern in the soma and axons using live imaging. Use the same media with BFA during live imaging.
Note: Neurons can be immunostained with organelle-specific antibodies to confirm protein localization in the cellular compartments at a given time (see examples in Chassefeyre et al., 2021).
Releasing PrPPG14-mCh from the ER
Repeat steps 1a–1c from Procedure D.
After 2–6 h of 5 μg/mL BFA treatment, replace the media with new Growth media pre-warmed at 37 °C and 5.0% CO2 (see Notes #4 below; Figure 3B).
Using a live imaging microscope, image the PrPPG14-mCh expression pattern one or two days post-transfection in the soma and in axons every 10–30 min. The signal of PrPPG14-mCh should appear as big, round punctate aggregates along the length of axons, and as large punctate aggregates in the soma. To confirm that PrPPG14-mCh transits into lysosomes in the soma as observed previously (Chassefeyre et al., 2021), follow steps in Procedure H.
Note: Neurons can be immunostained with organelle-specific antibodies to confirm protein localization in the cellular compartments at a given time (see examples in Chassefeyre et al., 2021).
Figure 3. Timeline of Brefeldin A (BFA) treatment of hippocampal neurons. (A) Hold PrPPG14-mCh in the ER. (B) Release PrPPG14-mCh from the ER.
Imaging BTX-AF647-labeled surface PrP and its subsequent internalization (Figure 4)
Cloning of Bungarotoxin binding sequence (BBS) into PrP was fully described in Chessefeyre et al. (2021). In brief, a 13 amino-acid BBS tag (WRYYESSLEPYPD) was inserted at the BspEI site in the linker between mCh and the C-terminal of the PrP sequence downstream of mCh, which was shown to not alter PrP trafficking or endoggresome formation. Endotoxin-free purification of PrPPG14-mCh-BBS in MoPrP.Xho vector is recommended for transfection of primary neurons.
Transfect neurons at DIV 5-8 with PrPWT-mCh-BBS or PrPPG14-mCh-BBS following the Lipofectamine 2000 protocol outlined in Procedure C.
Two days post-transfection, treat neurons with 150 μM tubocurarine chloride diluted in Growth media and incubate for 2 h at 37 °C and 5.0% CO2 (see Notes #4 below; Figure 4B).
Note: BTX can bind to acetylcholine (ACh) receptors on the surface of neurons. Tubocurarine blocks ACh receptors and thus reduces BTX-AF647 binding and background fluorescence signal.
Replace the Growth media containing tubocurarine with Growth media containing 7 μg/mL of BTX-AF647 and incubate neurons at 37 °C and 5.0% CO2 (see Notes #4 below) for 1 h.
Wash with Growth media and image the live BTX-AF647 signal immediately or one day later.
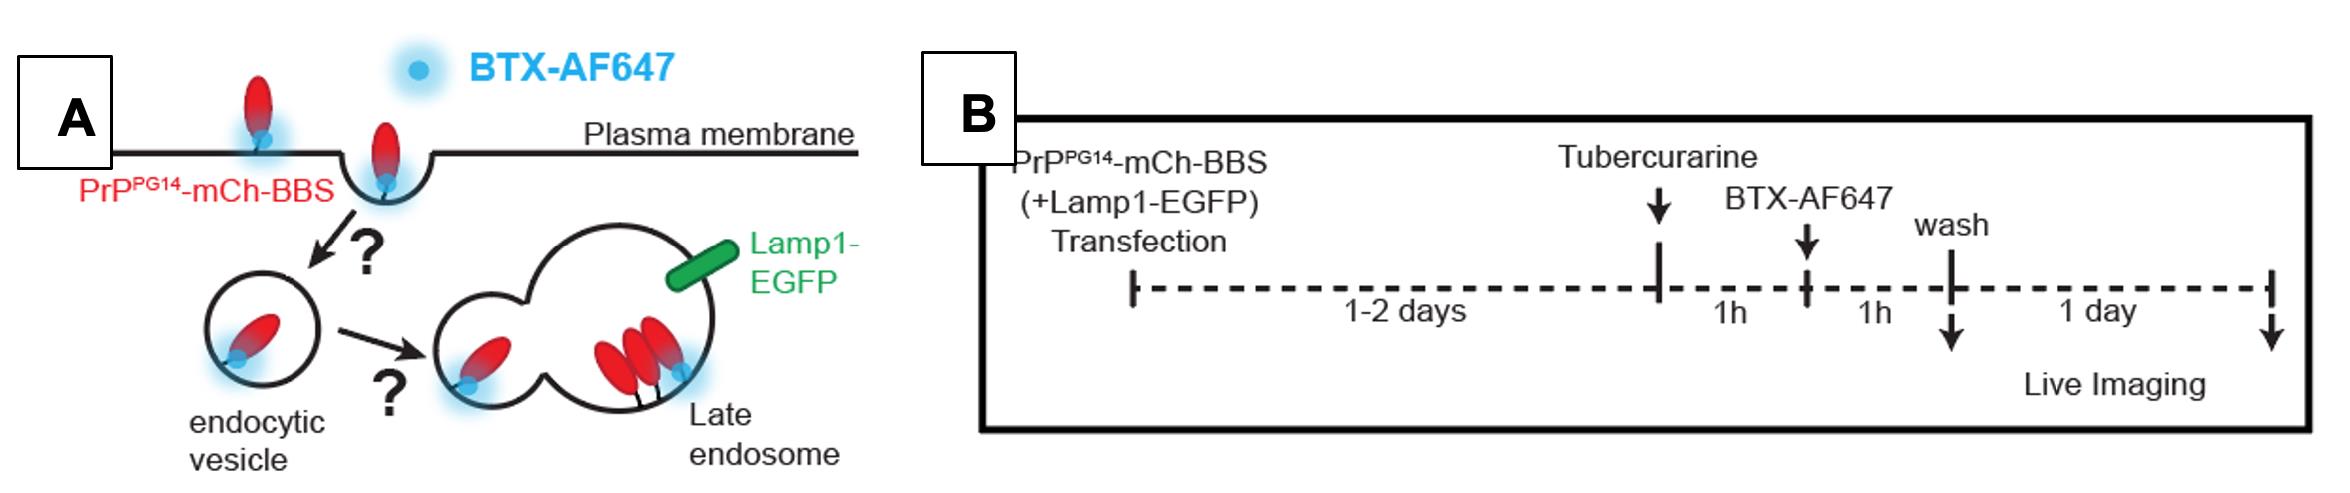
Figure 4. (A) Schematic and (B) timeline of BTX-AF647 treatment of hippocampal cultured neurons. Schematic for the live imaging of endocytosis of PrPPG14-mCh-BBS into endocytic vesicles and/or the accumulation of PrPPG14-mCh-BBS in endoggresomes one day after transfection.
Dynasore treatment to inhibit clathrin-mediated endocytosis of PrPPG14-mCh from the neuronal cell surface
Follow Procedure E steps 1 and 2 to transfect DIV 5–8 neurons with PrPPG14-mCh-BBS. One or two days post-transfection, add 0.5 μL of 80 nM Dynasore DMSO stock to 500 μL Growth media, mix well, and apply to neurons. Incubate for 30 min at 37 °C and 5.0% CO2 (see Notes #4 below) (Figure 5A).
Replace the media with Growth media + 150 μM Tubocurarine + 80 μM Dynasore and incubate for 1 h at 37 °C and 5.0% CO2 (see Notes #4 below) (Figure 5B).
Replace the media with Growth media + 7 μg/mL BTX-AF647 + 80 μM Dynasore and incubate for 1 h at 37 °C and 5.0% CO2 (see Notes #4 below) (Figure 5B).
Replace the media with Growth media and image neurons starting immediately and then at desired timepoints up to a day later, to image PrPWT/PG14-mCh-BBS internalization and/or aggregation in endoggresomes and the requirement of clathrin-mediated endocytosis in these events (Figure 5B).
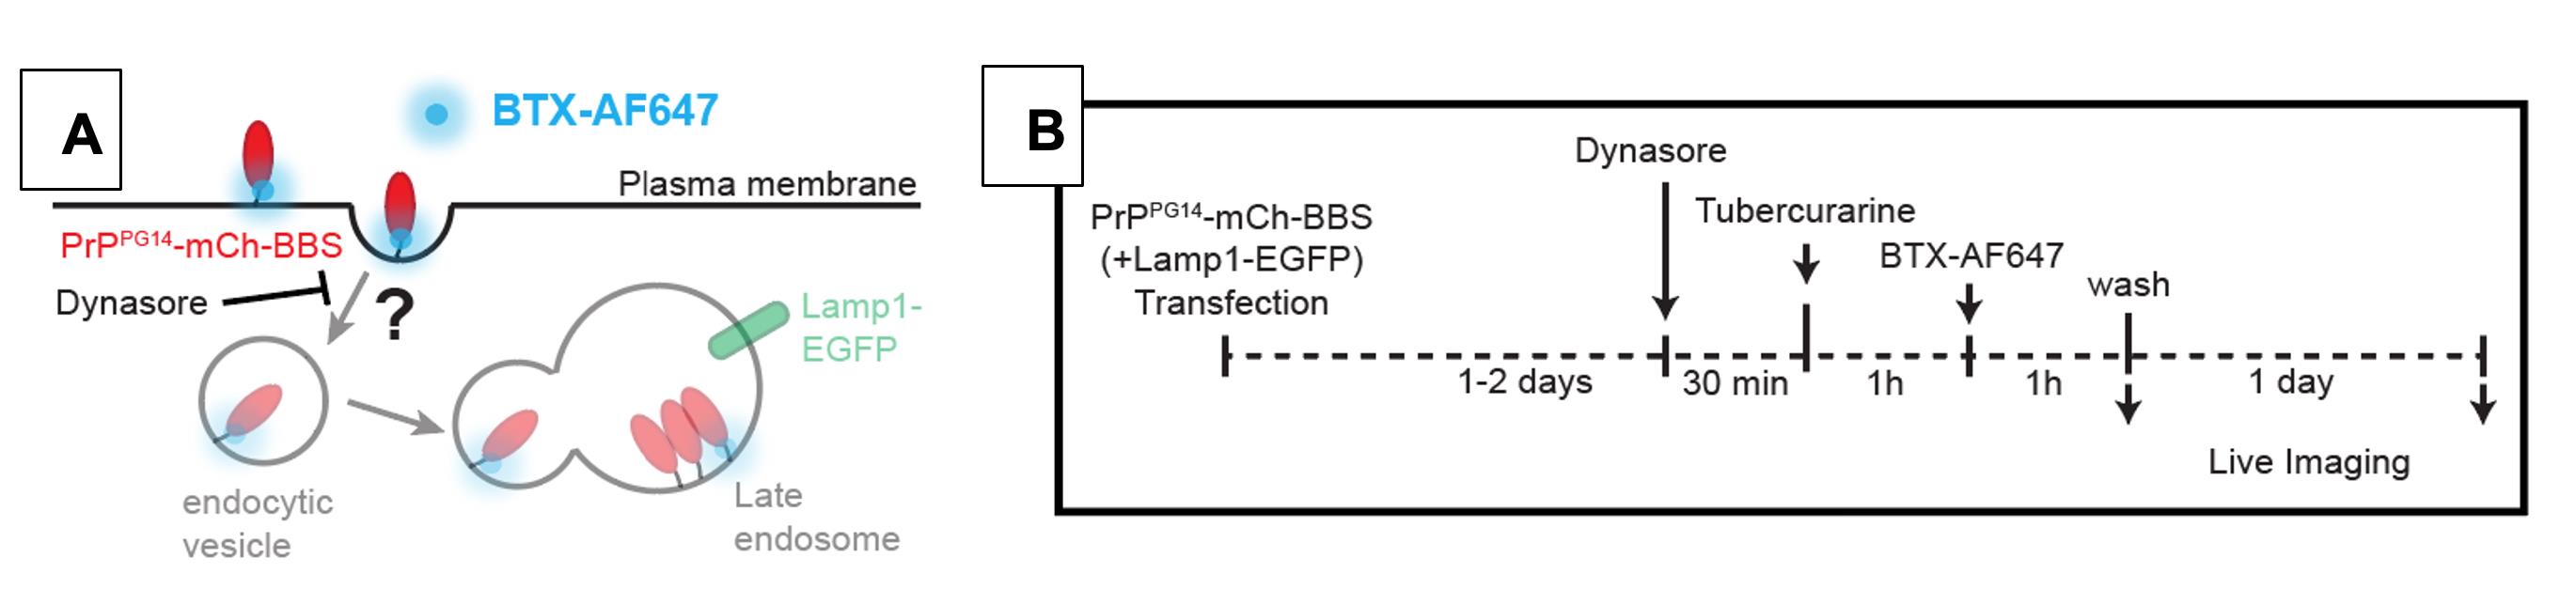
Figure 5. (A) Schematic and (B) timeline of BTX-AF647 treatment of cultured hippocampal neurons with Dynasore. Monitoring the inhibition of clathrin-mediated endocytosis on PrPPG14-mCh-BBS internalization and/or on the formation of endoggresomes within one day after PrPPG14-mCh-BBS expression.
Thrombin treatment to cleave off PrP at the cell surface
Cloning of Thrombin cleavage sequence (TCS)-tagged construct MoPrP.Xho PrPPG14-mCh-TCS was described in Chassefeyre et al. (2021). Briefly, the TCS tag (LVPRGS) was inserted at the BspEI site downstream of mCh and was shown not to alter PrP trafficking or PrPPG14-mCh endoggresome formation. Endotoxin-free purification of PrPPG14-mCh-BBS in MoPrP.Xho vector is recommended for transfection of primary neurons (Figure 6A).
Transfect neurons at DIV 5–8 with PrPPG14-mCh-BBS following the Lipofectamine 2000 protocol outlined in Procedure C (Figure 6B).
After 2 h of incubation in Growth media + Lipofectamine 2000 transfection mix at 37 °C, 5.0% CO2 (see Notes #4 below), replace media with Growth media + 5 units/mL of Thrombin protease. Incubate neurons at 37 °C, 5.0% CO2 (see Notes #4 below) up to 2 days prior to live imaging of PrPPG14-mCh endoggresome formation (Figure 6B).
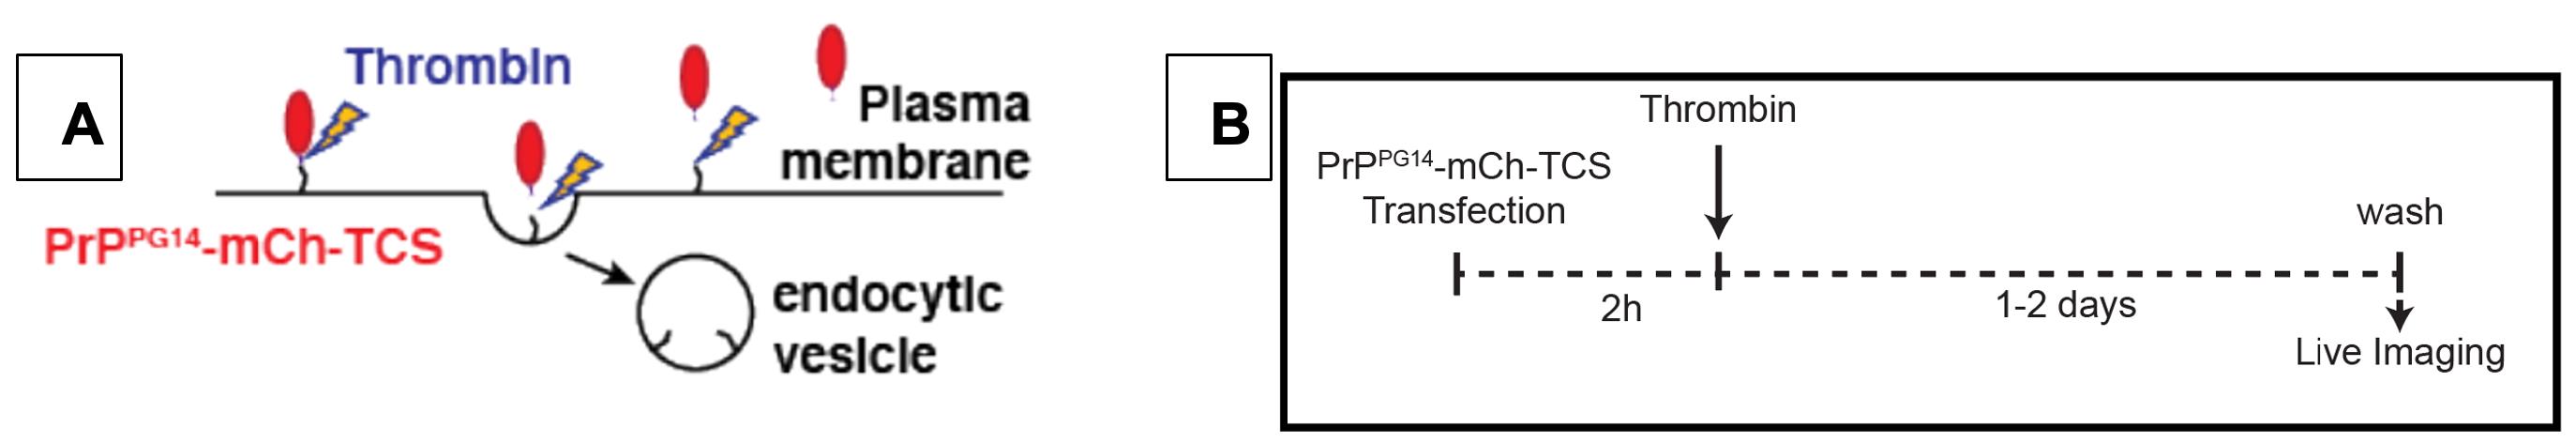
Figure 6. (A) Schematic and (B) timeline of Thrombin treatment of cultured hippocampal neurons. Cleavage of PrPPG14-mCh at the TCS site and its release from the cell surface.
LysoTrackerTMassay to probe for acidic endolysosomes
Grow and transfect neurons with PrPPG14-mCh as described in Procedure C (Figure 7A).
Prepare 50 nM of LysoTrackerTM Green (or other desired LysoTracker with different fluorescent dyes) in Growth media. Incubate DIV 5–8 neurons in LysoTracker for 2 h at 37 °C and 5.0% CO2 (see Notes #4 below). Wash 2–3 times in Growth media and incubate for 30 min at 37 °C and 5.0% CO2 (see Notes #4 below) prior to live imaging. Do not wait longer than 30 min as LysoTrackerTM signal might grow fainter with time (Figure 7B).
Live image LysoTrackerTM Green signal using a microscope equipped with a 488 nm laser (Figure 7B).
Notes:
LysoTrackerTM Green: optimal excitation wavelength is around 504 nm and optimal emission around 511 nm.
LysoTrackerTM fluorescence signal could be weak (Chassefeyre et al., 2021). Image LysoTrackerTM-treated neurons following the recommendations of vendors, which in our protocols is within 30 min to 1 h post-treatment of cells with LysoTrackerTM. This will circumvent the photobleaching that can occur after longer periods of LysoTrackerTM treatment. Imaging using decreased laser power aids in avoiding photobleaching during image acquisition, as well as imaging using other microscopes, e.g., a lattice light sheet microscope. Ideally, this assay should be combined with other lysosomal protein markers (such as LAMP1) or Magic Red® (see Procedure Part I).
Magic Red® Cathepsin B assay to probe the activity of Cathepsin B enzyme in degradative lysosomes (Figure 7)
Grow and transfect neurons with PrPPG14-mCh as described in Procedure C.
Dilute 250× DMSO stock of Magic Red® in sterile H2O. Apply 10 μL into each well of a 24-well plate with plated DIV 5–8 neurons, containing 250 μL of Growth media. Incubate for 2 h at 37 °C and 5.0% CO2 (see Notes #4 below) (Figure 7B).
Wash wells containing Magic Red® 2–3 times with Growth media. Incubate for 30 min at 37 °C and 5.0% CO2 (see Notes #4 below) prior to live imaging (Figure 7B).
Live image Magic Red® signal using a fluorescence microscope equipped with a 561 nm laser (Figure 7B).
Notes:
Magic Red® has an excitation wavelength of 592 nm and an optimal emission of 628 nm.
LysoTrackerTM Green and DeepRed Magic Red® can be combined in the same experiment to cross-validate the observation that degradative and acidic endolysosomal organelles are present in the soma and in axons.
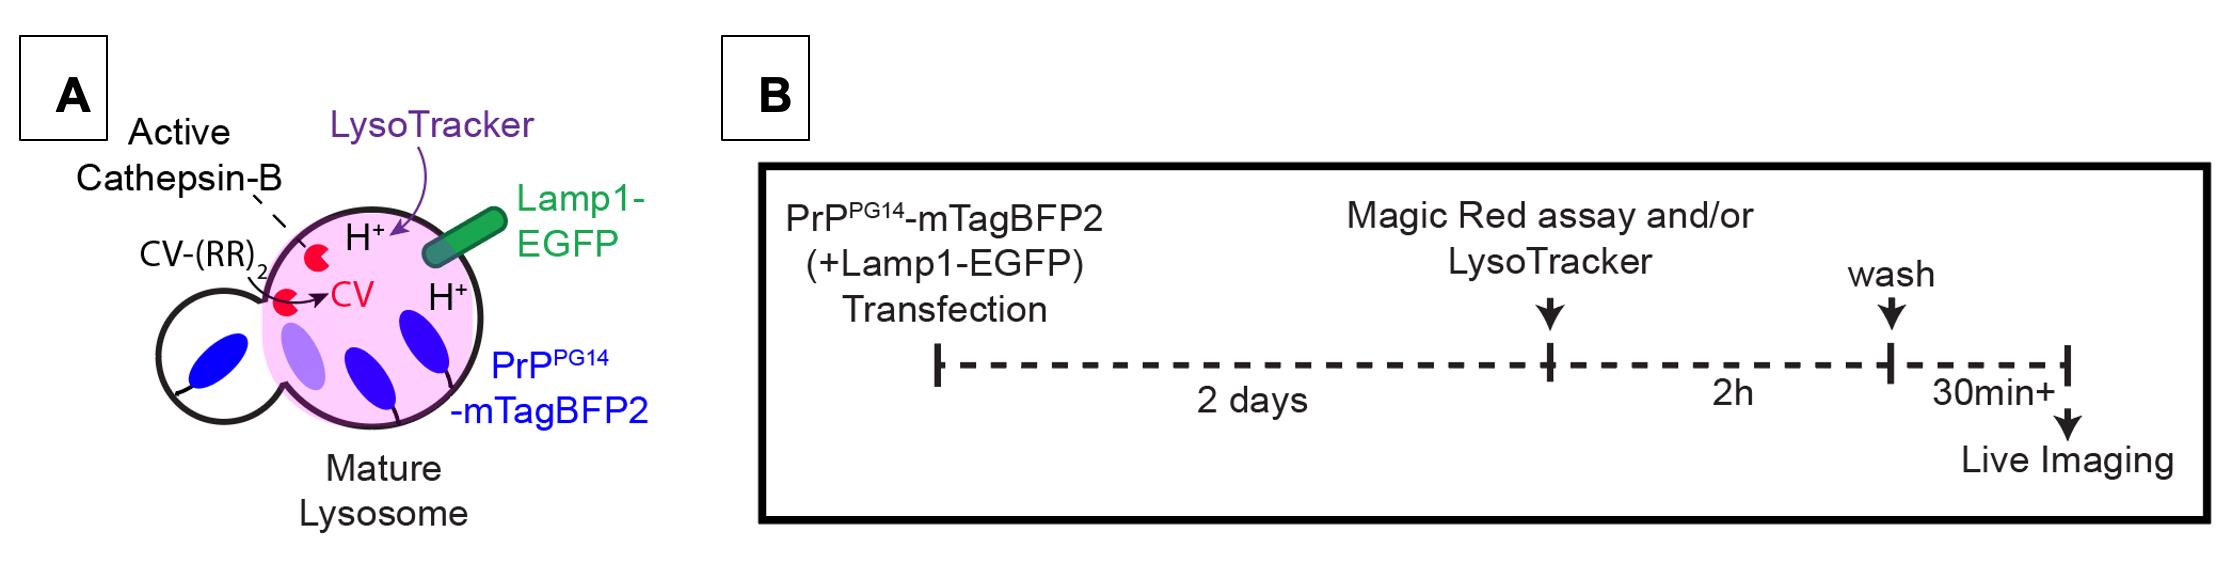
Figure 7. (A) Schematic and (B) timeline of LysoTrackerTM or Magic Red® Cathepsin B Assays. Probing for PrPPG14-mTagBFP2 in degradative endolysosomes.
Image acquisition and axon identification
Pre-warm the incubation chamber on the microscope until the temperature reaches a steady 37 °C. Prepare ahead of time the CO2 chamber.
Live imaging of primary neurons grown on #1.5 glass coverslips in 24-well plates is done on 35 mm MatTek dishes. Add a mixture of ~500 μL of new Growth media and ~500 μL of old Growth media from the culture well to each 35 mm MatTek dish and keep dish at 37 °C and 5.0% CO2 (see Notes #4 below) prior to placing the coverslip inside (step 3).
Using Dumont tweezers with an angled fine tip, pick up the coverslip from the edge. Using care not to drop the coverslip, flip it with the cells side down onto the bottom of the MatTek dish, inside the glass bottom area.
Mount the MatTek dish on the microscope stage within a 37 °C and 5.0% CO2 environment. Let the cells stabilize to that environment for 10–15 min prior to imaging.
Using 60× or 100× objectives with high NA, localize the transfected cells using widefield or fluorescence illumination. Distinguish dendrites vs. axons based on neuronal morphology (Encalada et al., 2011). Find the isolated axon region and acquire images.
Note: Unless otherwise indicated, the axon region imaged is of a mid-axon region, defined as a location at least ~200 μm away from the soma and from the axon termini.
Data analysis
Quantitation of PrPPG14-mCh endoggresome densities in axons using ImageJ
Subtract the background fluorescence from each of the raw images acquired: in ImageJ go to Process – Subtract background, adjust rolling ball radius using ‘preview’ (try rolling ball radius default = 50).
Draw an ROI using the segmented line tool as an outline on top of the axon (Figure 8). Adjust the line width to cover the axon width, which will depend on the width of the axon being analyzed (example below, line width = 1).
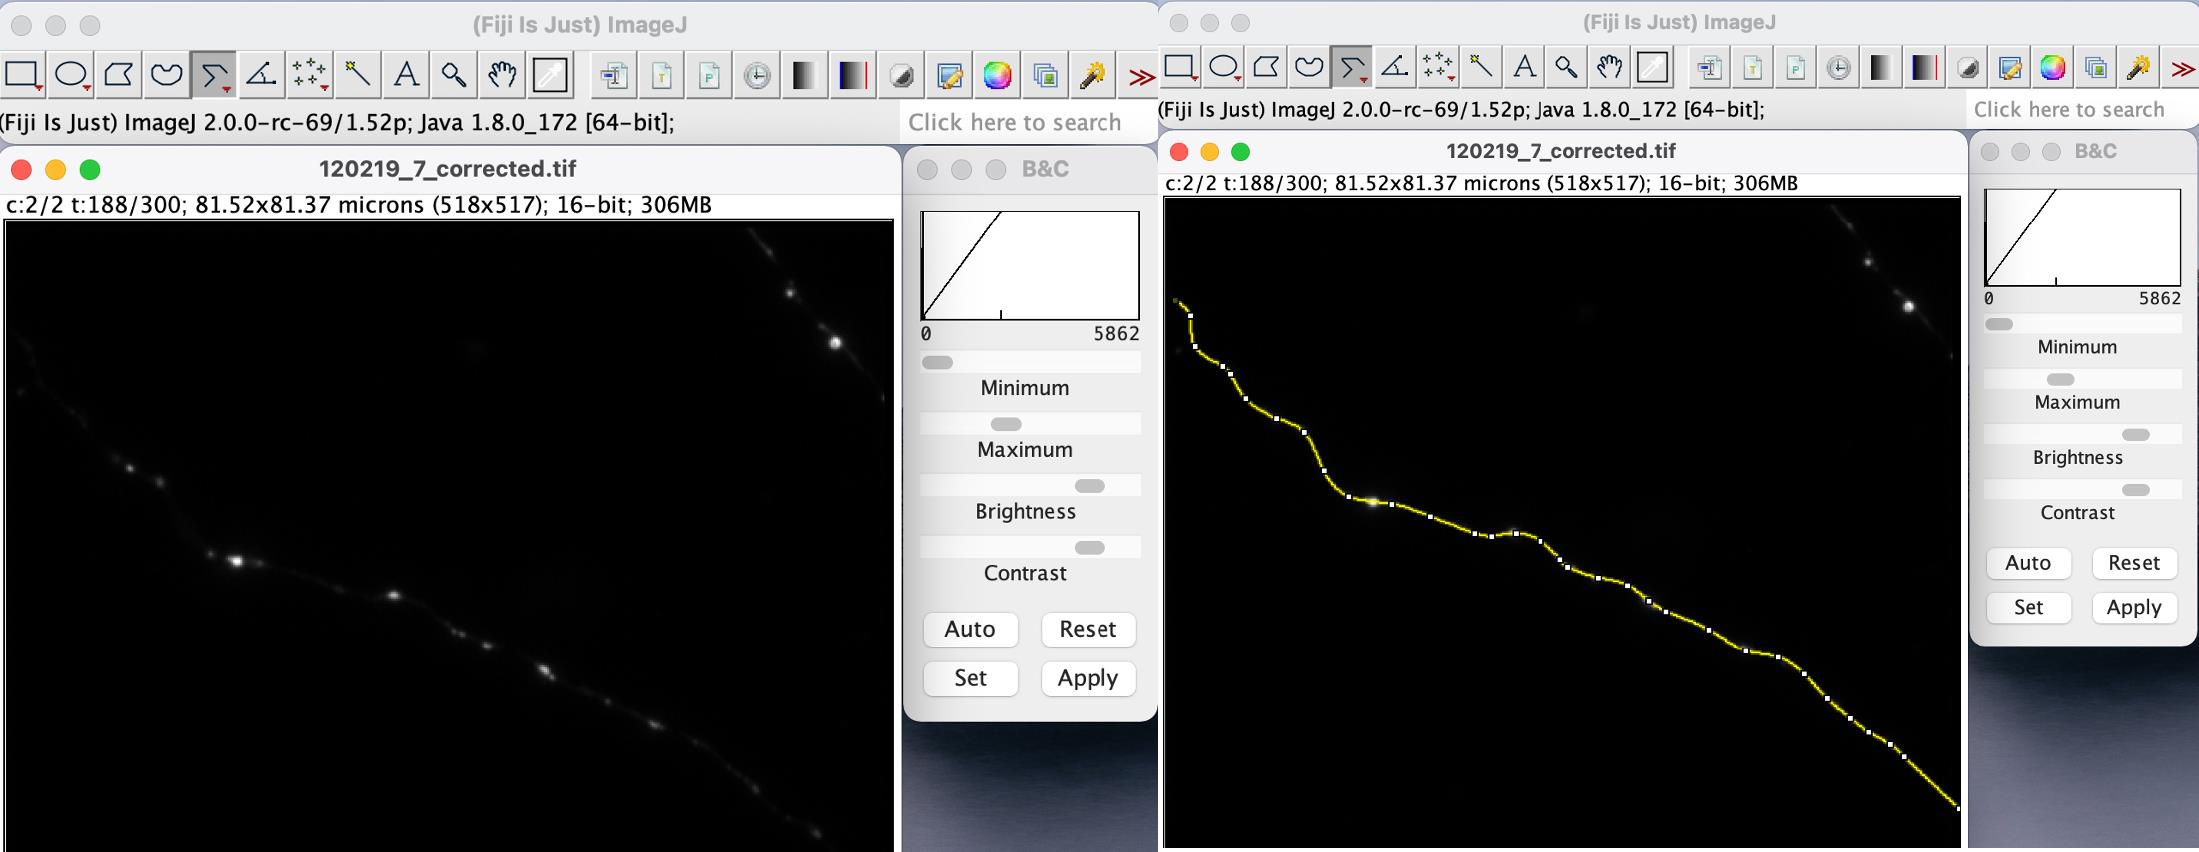
Figure 8. Subtraction of background fluorescence from images of axons of neurons expressing PrPPG14-mCh. Screenshot showing the windows in ImageJ with representative images of an axon of a cultured hippocampal mouse neuron expressing PrPPG14-mCh after background subtraction (left), and the window of the same axon image with the segmented line ROI drawn to outline the axon (right). Use brightness and contrast (B&C) tool to help visualize the axon contour.
To identify PrPPG14-mCh endoggresomes:
In ImageJ, go to Analyze – plot profile. Following manual inspection of hundreds of images (Chassefeyre et al., 2021), we defined endoggresomes within axons, as PrPPG14-mCh fluorescence puncta having an intensity of at least five times the intensity of small PrPPG14-mCh vesicles (Figure 9; see Notes #5).
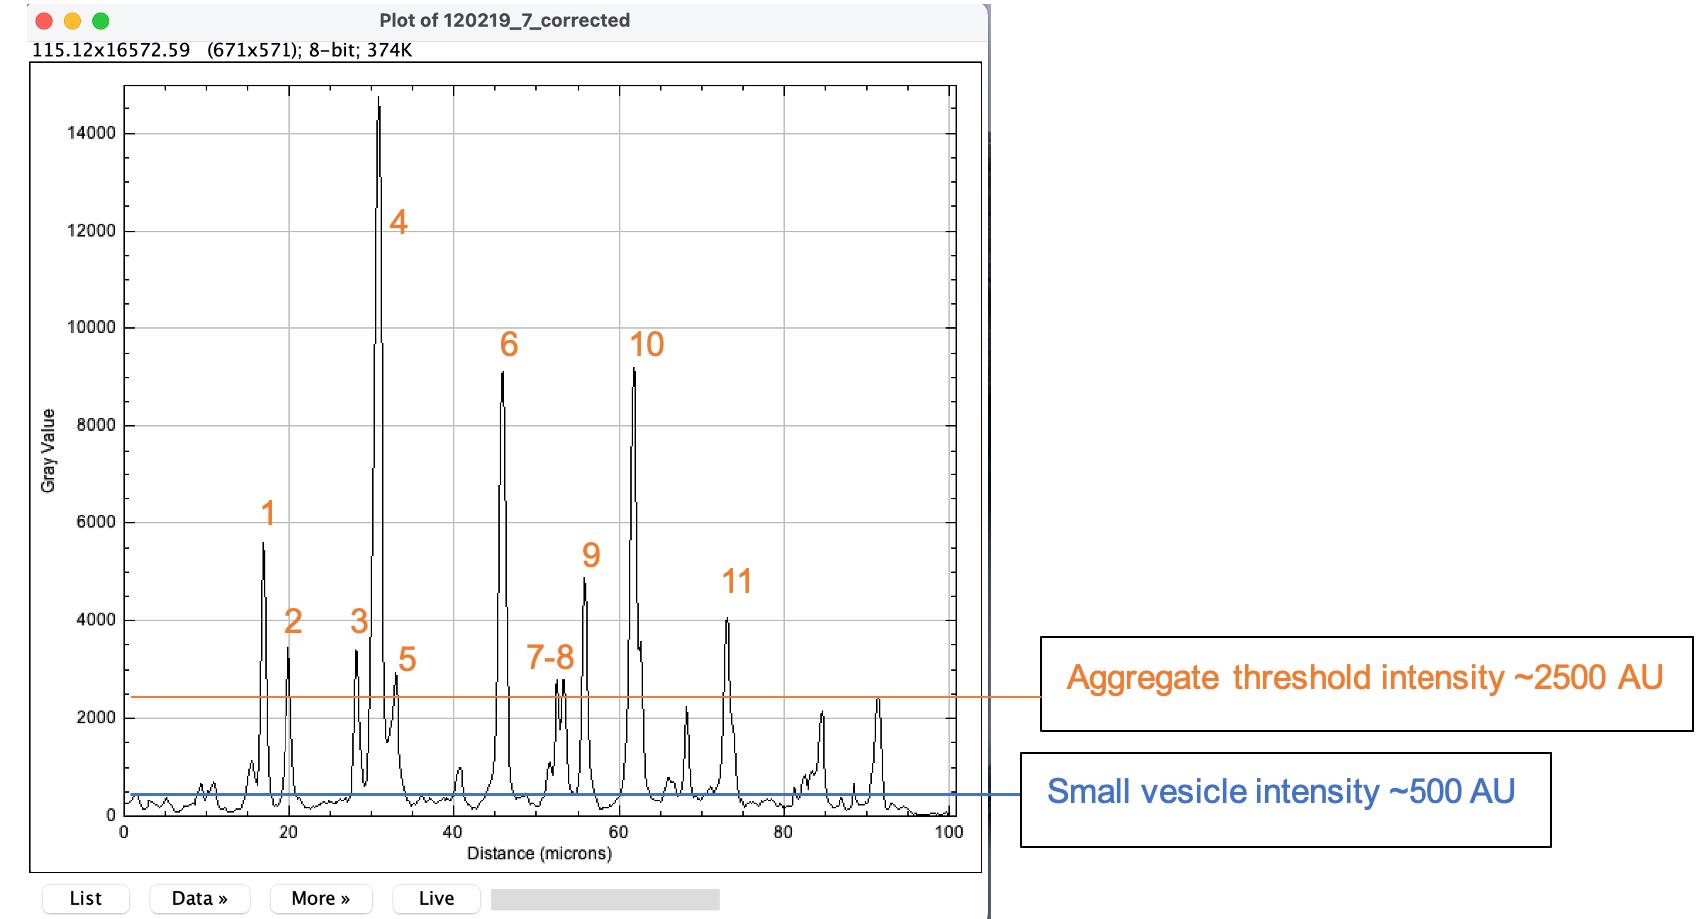
Figure 9. Plot profile of PrPPG14-mCh fluorescent puncta in the axon from Figure 8. A plot profile of fluorescence intensities of the axon in Figure 8, obtained from the drawing of the segmented line ROI feature in ImageJ. The y-axis indicates the fluorescence intensity (gray values) in arbitrary units (AUs) from PrPPG14-mCh point sources along the axon. Following visual examination of fluorescence intensity averages, a threshold was set at AUs = 500 to designate the smallest peaks representing signals from PrPPG14-mCh vesicles. A threshold was then set at five times the vesicle intensity of 500 AUs, to designate these as PrPPG14-mCh endoggresomes. Densities of PrPPG14-mCh endoggresomes are then calculated by manual counts of the peaks. The definitions of thresholds are further described in detail in Chassefeyre et al. (2021).Calculate PrPPG14-mCh endoggresome densities for each axon image, as the number of peaks above threshold intensity (Figure 9) per length of axon. The length of the analyzed axon fragment is equal to the length of the segmented line (see step 2). Divide the number by length × 100 to get aggregate density/100 μm. Analyze only one axon region per neuron; this will be Naxons.
Statistical analysis: If the dataset is normally distributed, display means ± SEM and perform Student’s t-test or ANOVA/multiple comparison tests as appropriate. If the dataset is not normally distributed, display boxplot, violin plot, or all data points and use non-parametric tests, such as Wilcoxon Rank Sum test or an appropriate multiple comparison test.
Co-transport analysis in axons using ImageJ
This protocol is for the analysis of co-transport of a non-PrP cargo (in this case of Lamp1-EGFP endolysosomes), and of PrPPG14-mCh vesicles or endoggresomes moving (or not) along axons of culture mouse hippocampal neurons.
Co-transfect neurons with desired plasmids following the steps in Procedure C. In this case, neurons were co-transfected with PrPPG14-mCh (400 ng) and Lamp1-EGFP (400 ng). Collect images for both PrPPG14-mCh and Lamp1-EGFP channels, as indicated in Procedure J.
Open an image in ImageJ using split channels. Subtract background fluorescence from each raw image as indicated in step A above (Figure 8, left).
Draw ROI with segmented line tool onto the axon of the first channel as indicated in step A above (Figure 8, right). Adjust the line width to cover the axon width, which will depend on the width of the axon being analyzed (example below, line width = 1).
In ImageJ, go to Image – Stacks – Reslice [/]…This step will draw a kymograph showing the trajectories of Lamp-1-EGFP particles (x-axis) over time (y-axis) (Figure 10).
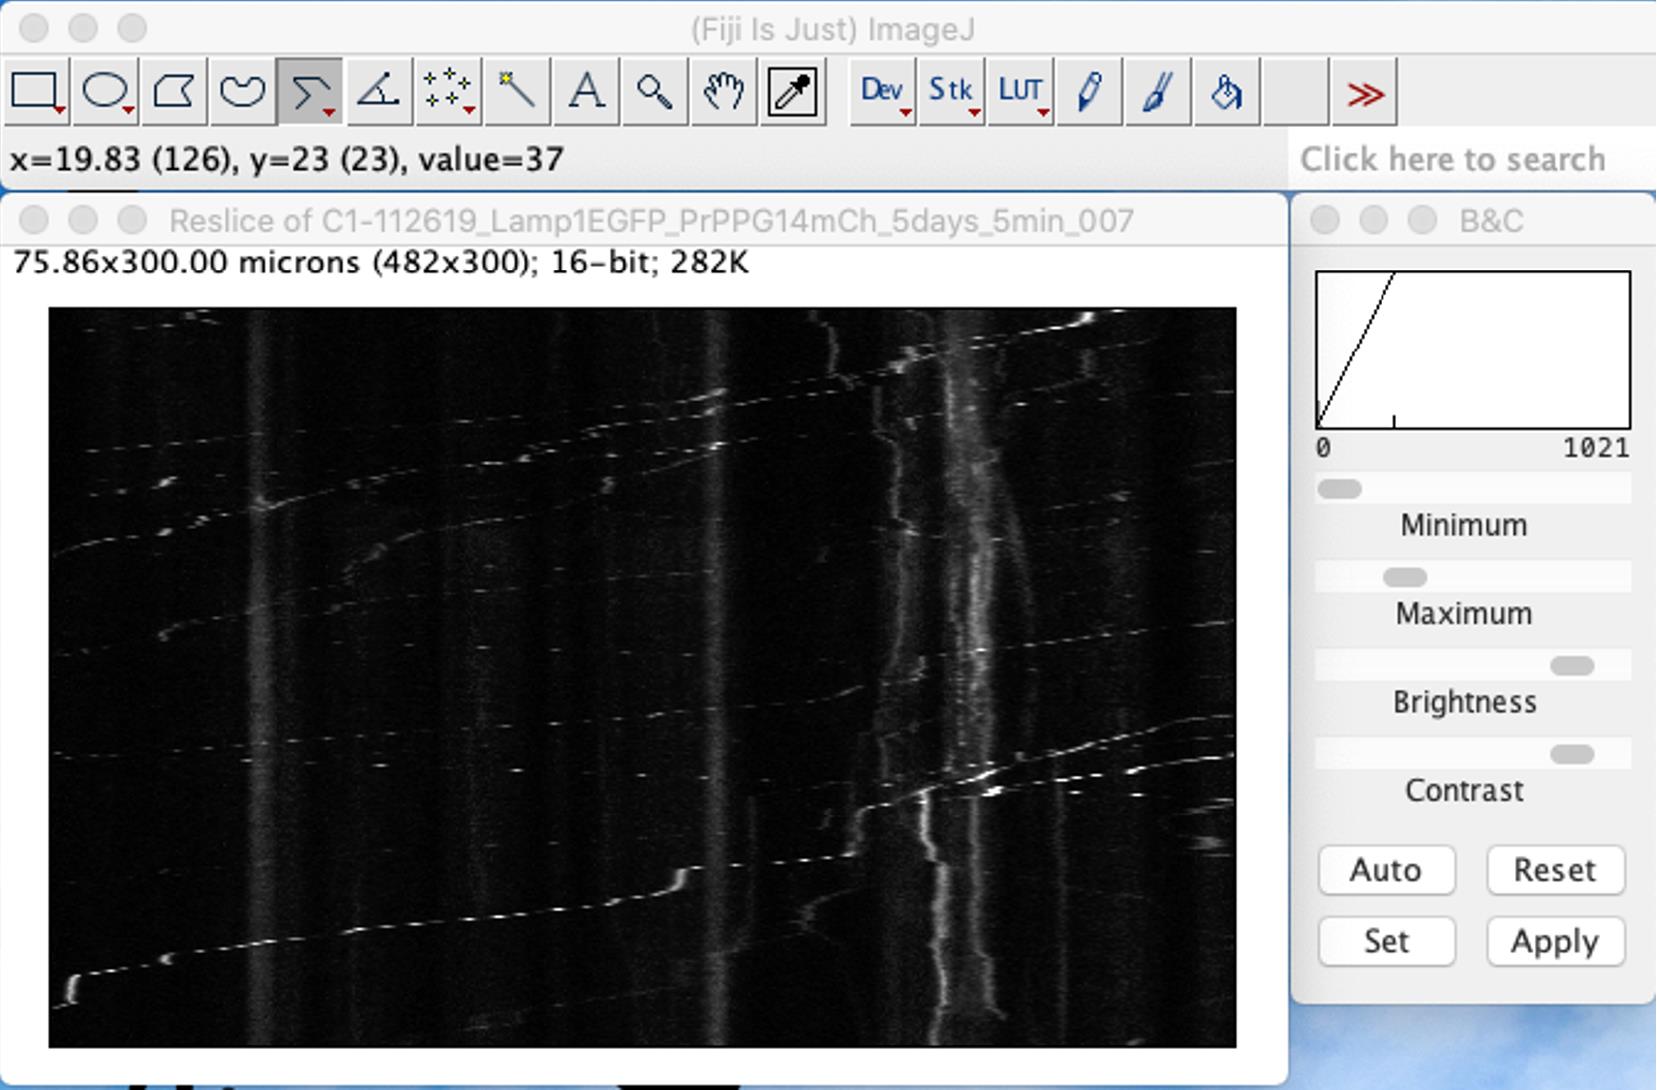
Figure 10. Transport of Lamp1-EGFP vesicles in axons of cultured hippocampal neurons. Screenshot of ImageJ showing a representative image of a kymograph of an axon showing the trajectories of Lamp1-EGFP moving or stationary vesicles. Movies were 5 min long and collected at a frame rate of 1 frame/s (1 Hz) using a Nikon TIRF microscope. For all images and movies acquired, the exposure time was set to 100 ms (Chassefeyre et al., 2021).Transfer the ROI drawn from the Lamp1-EGFP image to the PrPPG14-mCh image using command-E or using ROI manager in ImageJ.
In ImageJ, go to Image – Stacks – Reslice [/]… This step will draw a kymograph showing the trajectories of PrPPG14-mCh particles (x-axis) over time (y-axis) (Figure 11).
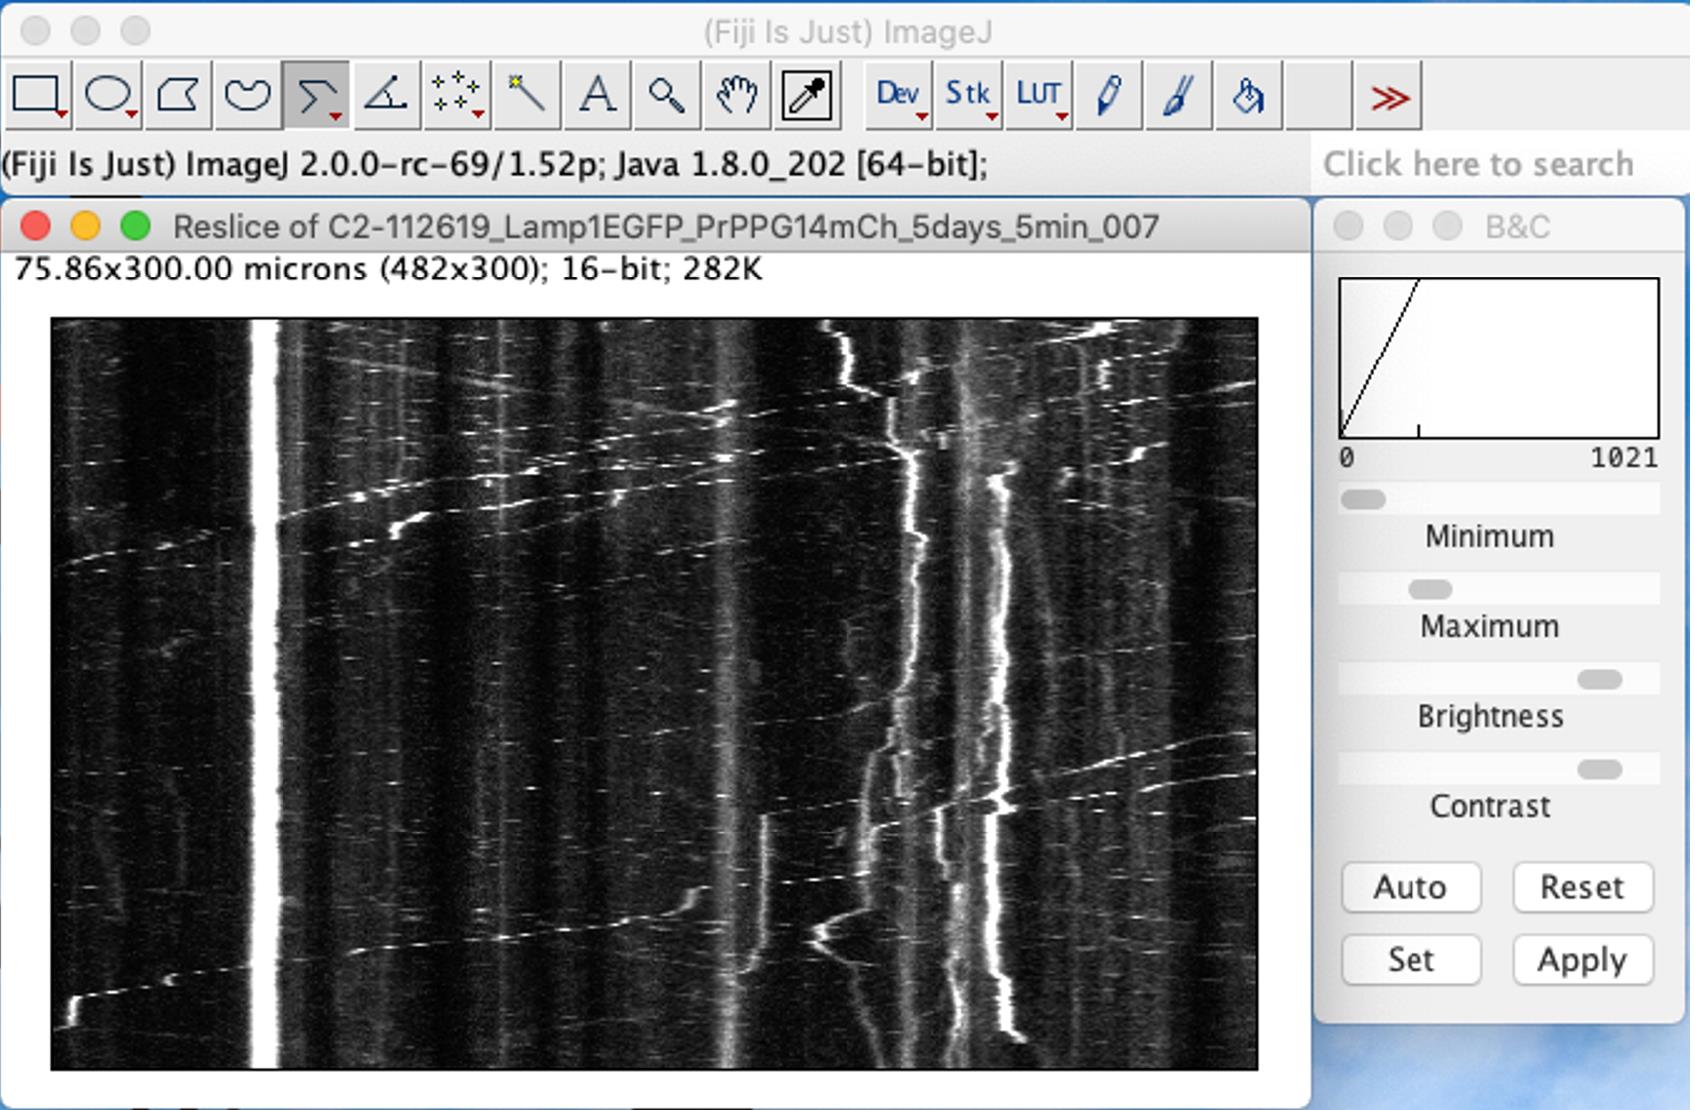
Figure 11. Transport of PrPPG14-mCh vesicles in axons of cultured hippocampal neurons. Screenshot of ImageJ showing a representative image of a kymograph of an axon showing trajectories of PrPPG14-mCh moving or stationary vesicles. Movies were 5 min long and collected at a frame rate of 1 frame/s (1 Hz) using a Nikon TIRF microscope. For all images and movies acquired, the exposure time was set to 100 ms (Chassefeyre et al., 2021).Draw lines on kymographs to annotate all identifiable tracks on both channels (Figure 12, left and middle panels). Use brightness and contrast (B&C) tool to help visualize dim tracks.
Note: The designation of trajectories/tracks, including of those that are dim in fluorescence, is determined empirically by the user. Contrast settings can be adjusted to visualize all tracks, if necessary, but it is advised to use consistency in the designation of all tracks including dim ones.
Copy and paste tracks onto the same image to visualize overlapping tracks (Figure 12, right panel).
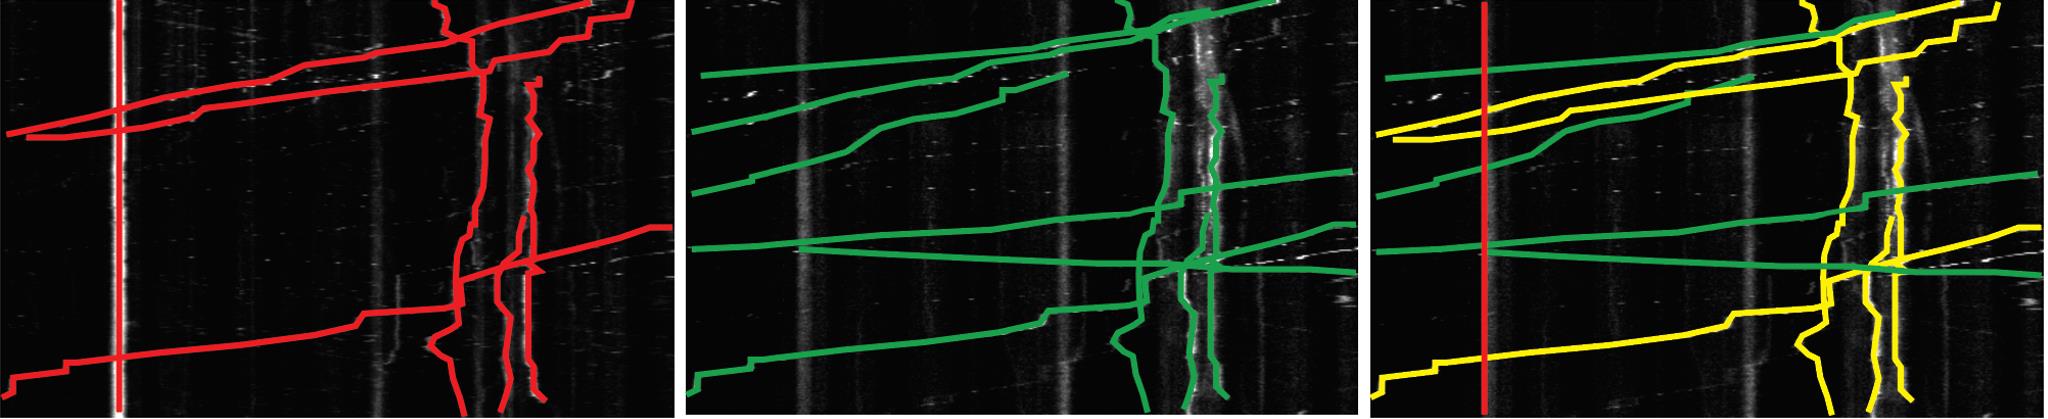
Figure 12. Analysis of kymographs of PrPPG14-mCh vesicle movement. Representative kymograph images of PrPPG14-mCh (left panel, red), and Lamp1-EGFP (middle panel, green) vesicle tracks/trajectories. Combined (right panel, yellow) tracks/trajectories indicate co-transport events.Count percentage of co-transport trajectories per kymograph by calculating number of co-transport tracks divided by number of all tracks (of PrPPG14-mCh) × 100. This indicates the degree of PrPPG14-mCh vesicles/endoggresomes co-transport with a Lamp1-EGFP vesicle. Record the numbers in Microsoft Excel. Analyze only one kymograph per axon of a neuron.
Perform statistical analysis. If the dataset is normally distributed, display means ± SEM and perform Student’s t-test or ANOVA/multiple comparison tests as appropriate. If the dataset is not normally distributed, display boxplot, violin plot, or all data points and use non-parametric tests, such as Wilcoxon Rank Sum test or appropriate multiple comparison tests.
Collect the dataset for three biological replicates, i.e., primary hippocampal neurons plated from three different mice of the same genetic background, plated independently at different time points.
Co-transport analysis requires an appropriate temporal resolution of cargo movement. For example, to image the transport of PrPWT-mCh or PrPPG14-mCh vesicles, a suitable acquisition rate is 10 frames/s for 15 s. In contrast, to image the movement of PrPPG14-mCh endoggresomes, which are largely stationary or move very slowly, use 1 frame/s for 5 min. Consult previous literature on different dynamics of organelles or membrane-bound compartments to get the best time-lapse video quality for quantitative analysis.
Imaging in the cell body requires deconvolution for widefield imaging or a confocal module. In axons, widefield or pseudo-TIRF is sufficient for quantitative imaging, due to little out-of-focus light in thin axonal regions.
For our experiments, incubators for culturing hippocampal mouse neurons were set at 5.5% CO2 to ascertain that small observed fluctuations in CO2 levels from the house lines did not result in CO2 levels dropping below 5.0%, which is the standard level used for hippocampal neuronal culturing (Kaech and Banker, 2006). It is known that mouse hippocampal neurons can grow in >5% CO2 (Geissler et al., 2013). During imaging in the TIRF microscope, CO2 was supplied by a tank that provided continuous stable delivery of 5.0% CO2 directly to the microscope incubation/imaging chamber.
The threshold of gray value for small vesicles and endoggresomes is determined empirically and independently for every image/individual axon.
Borate buffer (5 mL)
1.24 g boric acid
1.90 g borax
Dissolve in 400 mL of ddH2O, pH 8.5, filter-sterilize, and store at 4 °C.
1 mL of 0.05% DNaseI
50 mg of DNaseI
0.5 mL of 1.2 M MgSO4
100 mL of HBSS (without pen-strep)
Poly-L-lysine stock solution
Reagent Final concentration Amount Poly-L-lysine (1 mg/mL) 0.05 mg/mL 0.5 mL Borate buffer (pH 8.5) n/a 9.5 mL Total n/a 10 mL Dissection media
Adjust pH to 7.3, filter-sterilize, and store at 4 °C.
Reagent Final concentration Amount HBSS n/a 500 mL D-glucose
HEPES
Pen-Strep
n/a
n/a
n/a
0.4 g
0.834 g
5 mL
Total n/a 505 mL, pH 7.3, filter-sterilize Brain digestion enzyme (Mixture A)
Filter-sterilize and store aliquots at -20 °C.
Reagent Final concentration Amount PBS
DL-cysteine HCl
BSA
D-glucose
n/a
n/a
n/a
n/a
4 mL
1 mg
1 mg
25 mg
Total n/a 5 mL Plating media
500 mL of DMEM High Glucose (1×) with phenol red + L-Glut w/o Sod. Pyr.
50 mL of FBS
Store at 4 °C and pre-warm to 37 °C before plating.
Reagent Final concentration Amount DMEM n/a 28 mL/brain Total n/a 28 mL Growth media
Store at 4 °C and pre-warm to 37 °C before plating
Reagent Final concentration Amount NBA n/a 48.875 mL GlutaMAX
B27
n/a
n/a
0.125 mL
1 mL
Total n/a 50 mL - Chassefeyre, R., Chaiamarit, T., Verhelle, A., Novak, S. W., Andrade, L. R., Leitao, A. D. G., Manor, U. and Encalada, S. E. (2021). Endosomal sorting drives the formation of axonal prion protein endoggresomes. Sci Adv 7(52): eabg3693.
- Encalada, S. E., Szpankowski, L., Xia, C. H. and Goldstein, L. S. (2011). Stable kinesin and dynein assemblies drive the axonal transport of mammalian prion protein vesicles. Cell 144(4): 551-565.
- Geissler, M., Gottschling, C., Aguado, A., Rauch, U., Wetzel, C. H., Hatt, H. and Faissner, A. (2013). Primary hippocampal neurons, which lack four crucial extracellular matrix molecules, display abnormalities of synaptic structure and function and severe deficits in perineuronal net formation. J Neurosci 33(18): 7742-7755.
- Hofmann, I. and Munro, S. (2006). An N-terminally acetylated Arf-like GTPase is localised to lysosomes and affects their motility. J Cell Sci 119(Pt 8): 1494-1503.
- Kaech, S. and Banker, G. (2006). Culturing hippocampal neurons. Nat Protoc 1(5): 2406-2415.
- Khatter, D., Raina, V. B., Dwivedi, D., Sindhwani, A., Bahl, S. and Sharma, M. (2015). The small GTPase Arl8b regulates assembly of the mammalian HOPS complex on lysosomes. J Cell Sci 128(9): 1746-1761.
- Satpute-Krishnan, P., Ajinkya, M., Bhat, S., Itakura, E., Hegde, R. S. and Lippincott-Schwartz, J. (2014). ER stress-induced clearance of misfolded GPI-anchored proteins via the secretory pathway. Cell 158(3): 522-533.
- Zavodszky, E. and Hegde, R. S. (2019). Misfolded GPI-anchored proteins are escorted through the secretory pathway by ER-derived factors. Elife 8: e46740
Notes
Recipes
Acknowledgments
We thank Romain Chassefeyre and co-authors of the original research paper (Chassefeyre et al., 2021) for performing experiments. This work was supported by NIH/NIA R01AG049483 and R01AG076745 grants; by the Glenn Foundation for Medical Research Award for Research in Biological Mechanisms of Aging; by a New Scholar in Aging Award from the Lawrence Ellison Foundation; and by a Baxter Family Foundation award to S.E.E. T.C. was supported by a Thai Government Scholarship from the Development and Promotion of Science and Technology Talents Project (DPST). A.V. and Y.W were supported by a Dorris Neuroscience Center Fellowship.
Competing interests
The authors declare no competing interests.
Ethics
Our mouse protocols were reviewed and approved by Institutional Animal Care and Use Committee (IACUC) at The Scripps Research Institute (Scripps Research) and all colonies were maintained following the guidelines recommended by the Department of Animal Resources (DAR) at Scripps Research.
References
Article Information
Copyright
© 2023 The Author(s); This is an open access article under the CC BY-NC license (https://creativecommons.org/licenses/by-nc/4.0/).
How to cite
Readers should cite both the Bio-protocol article and the original research article where this protocol was used:
- Chaiamarit, T., Wu, Y., Verhelle, A. and Encalada, S. E. (2023). Fluorescence Assays for Real-Time Tracking of Cell Surface Protein Internalization and Endosomal Sorting in Axons of Primary Mouse Hippocampal Neurons. Bio-protocol 13(7): e4651. DOI: 10.21769/BioProtoc.4651.
- Chassefeyre, R., Chaiamarit, T., Verhelle, A., Novak, S. W., Andrade, L. R., Leitao, A. D. G., Manor, U. and Encalada, S. E. (2021). Endosomal sorting drives the formation of axonal prion protein endoggresomes. Sci Adv 7(52): eabg3693.
Category
Neuroscience > Cellular mechanisms
Cell Biology > Cell imaging
Do you have any questions about this protocol?
Post your question to gather feedback from the community. We will also invite the authors of this article to respond.