- Protocols

- Articles and Issues
- For Authors
- About
- Become a Reviewer

Rapid and Reliable Quantification of Glycerol-3-phosphate Using Gas Chromatography–coupled Mass Spectrometry
Published: Vol 13, Iss 7, Apr 5, 2023 DOI: 10.21769/BioProtoc.4645 Views: 2041
Reviewed by: Saptashati BiswasAnonymous reviewer(s)
Original research article
The authors used this protocol in:

Jun 2022
Advertisement


Protocol Collections
Comprehensive collections of detailed, peer-reviewed protocols focusing on specific topics


Related protocols
Abstract
Glycerol-3-phosphate (G3P) is a conserved precursor of glycerolipids that also plays an important role in plant defense. Its levels and/or metabolism are also associated with many human disorders including insulin resistance, diabetes, obesity, and cancer, among others. In plants, G3P accumulates upon pathogen infection and is a critical component of systemic acquired resistance, which confers broad spectrum disease resistance against secondary infections. G3P also plays an important role in root-shoot-root signaling in soybean that regulates incompatible interactions with nitrogen-fixing bacteria. Thus, accurate quantification of G3P is key to drawing a valid conclusion regarding its role in diverse processes ranging from lipid biosynthesis to defense. G3P quantification is further compounded by its rapid degradation in extracts prepared at room temperature.
Here, we describe a simplified procedure for accurate quantitative analysis of G3P from plant tissues. G3P was extracted along with the internal standard ribitol, derivatized with N-Methyl-N-(trimethylsilyl)trifluoroacetamide (MSTFA) and analyzed by gas chromatography–coupled mass spectrometry using selective ion mode. This procedure is simple, economical, and efficient, and does not involve isotopic internal standards or multiple-step derivatizations.
Keywords: Glycerol-3-phosphateBackground
Glycerol-3-phosphate (G3P) is an obligatory component of energy-producing reactions including glycolysis and glycerolipid biosynthesis (Lim et al., 2017). For glycerolipid biosynthesis, G3P is first acylated with the fatty acid (FA) oleic acid (18:1), to form lyso-phosphatidic acid (lyso-PA); this reaction is catalyzed by the chloroplastic enzyme G3P acyltransferase encoded by the ACT1 gene in Arabidopsis. Lyso-PA is converted to phosphatidic acid (PA) via lysophosphatidic acid acyltransferase–catalyzed transfer of 16:0 FA to the sn-2 position of lyso-PA. PA is in turn converted to phosphatidylglycerol and diacylglycerol (DAG). The DAG pools act as precursors for the synthesis of other major plastidal membrane lipids, including monogalactosyldiacylglycerol, digalactosyldiacylglycerol, and sulpholipids. This pathway of glycerolipid synthesis operates in the chloroplast and is commonly referred to as the prokaryotic pathway.
G3P levels are regulated by enzymes involved in its biosynthesis, as well as those involved in G3P catabolism (Venugopal et al., 2009). G3P is synthesized via the glycerol kinase (GK)-mediated phosphorylation of glycerol, or the G3P dehydrogenase (G3Pdh)-mediated reduction of dihydroxyacetone phosphate (DHAP) (Mandal et al., 2011; Lim et al., 2017). DHAP is derived from glycolysis via triosephosphate isomerase activity on glyceraldehyde-3-phosphate. In Arabidopsis, the total G3P pool is derived from the activities of five G3Pdh isoforms and one GK isoform. The G3Pdh enzymes are present in cytosol, mitochondria, and chloroplast, and only a mutation in the plastid-localized G3Pdh isoforms, designated GLY1, impairs glycerolipid biosynthesis (Shen et al., 2003 and 2006). Unlike GLY1, neither the second chloroplastic nor the two cytosolic isoforms of G3Pdh contribute to plastidal and/or extraplastidal lipid biosynthesis (Chanda et al., 2011). This suggests that a specific sub-pool of G3P in the chloroplast is required for lipid biosynthesis.
The cellular pool of G3P also regulates the plastidal 18:1 level, which in turn governs nitric oxide levels and thereby chloroplast-nucleus retrograde signaling associated with defense. G3P levels are also important for basal defense against the hemibiotrophic fungus, Colletotrichum higginsianum (Chanda et al., 2008). Genetic mutations affecting G3P synthesis in Arabidopsis enhance susceptibility to C. higginsianum; conversely, plants accumulating increased G3P show enhanced resistance. G3P also contributes to R-mediated defense leading to systemic acquired resistance (SAR) in Arabidopsis, soybean, and wheat (Chanda et al., 2011Yang et al., 2013; Yu et al., 2013; Gao et al., 2014; Wang et al., 2014 and 2018; Shine et al., 2019). G3P also plays an important role in root-shoot-root signaling that regulates incompatible response against rhizobia in soybean (Shine et al., 2019). Compromised SAR in G3P-deficient mutants is restored by exogenous application of G3P. G3P is systemically mobile and is transported to the distal tissues via the plasmodesmata (PD) (Lim et al., 2016). This symplastic transport of G3P involves specific isoforms of PD-localizing proteins, which regulate PD gating. Thus, quantification of G3P levels in the plant tissues is an integral part of research on plant defense. Earlier methods to quantify G3P levels from plant tissues was based on high-performance liquid chromatography–based profiling of extracts prepared from ~0.5–1 g of tissue weight. The G3P peaks in chromatograms were assigned using electrochemical detection of analytes corresponding to the G3P standard (Chanda et al., 2008 and 2011). This method was unable to confirm the precise identity of G3P; moreover, it required excessive tissue weight for reliable extraction of G3P.
In the present method, we use gas chromatography (GC)-mass spectrometry (MS)–based selective ion monitoring (SIM) mode to quantify G3P from tissues or petiole exudates. Ribitol was used as an internal standard and both ribitol and G3P were derivatized using N-Methyl-N-(trimethylsilyl)trifluoroacetamide (MSTFA) (Figure 1). This method can reliably quantify G3P from ~10–100 mg of fresh tissue, is cost effective, and can be used to process 100–200 samples in a day.
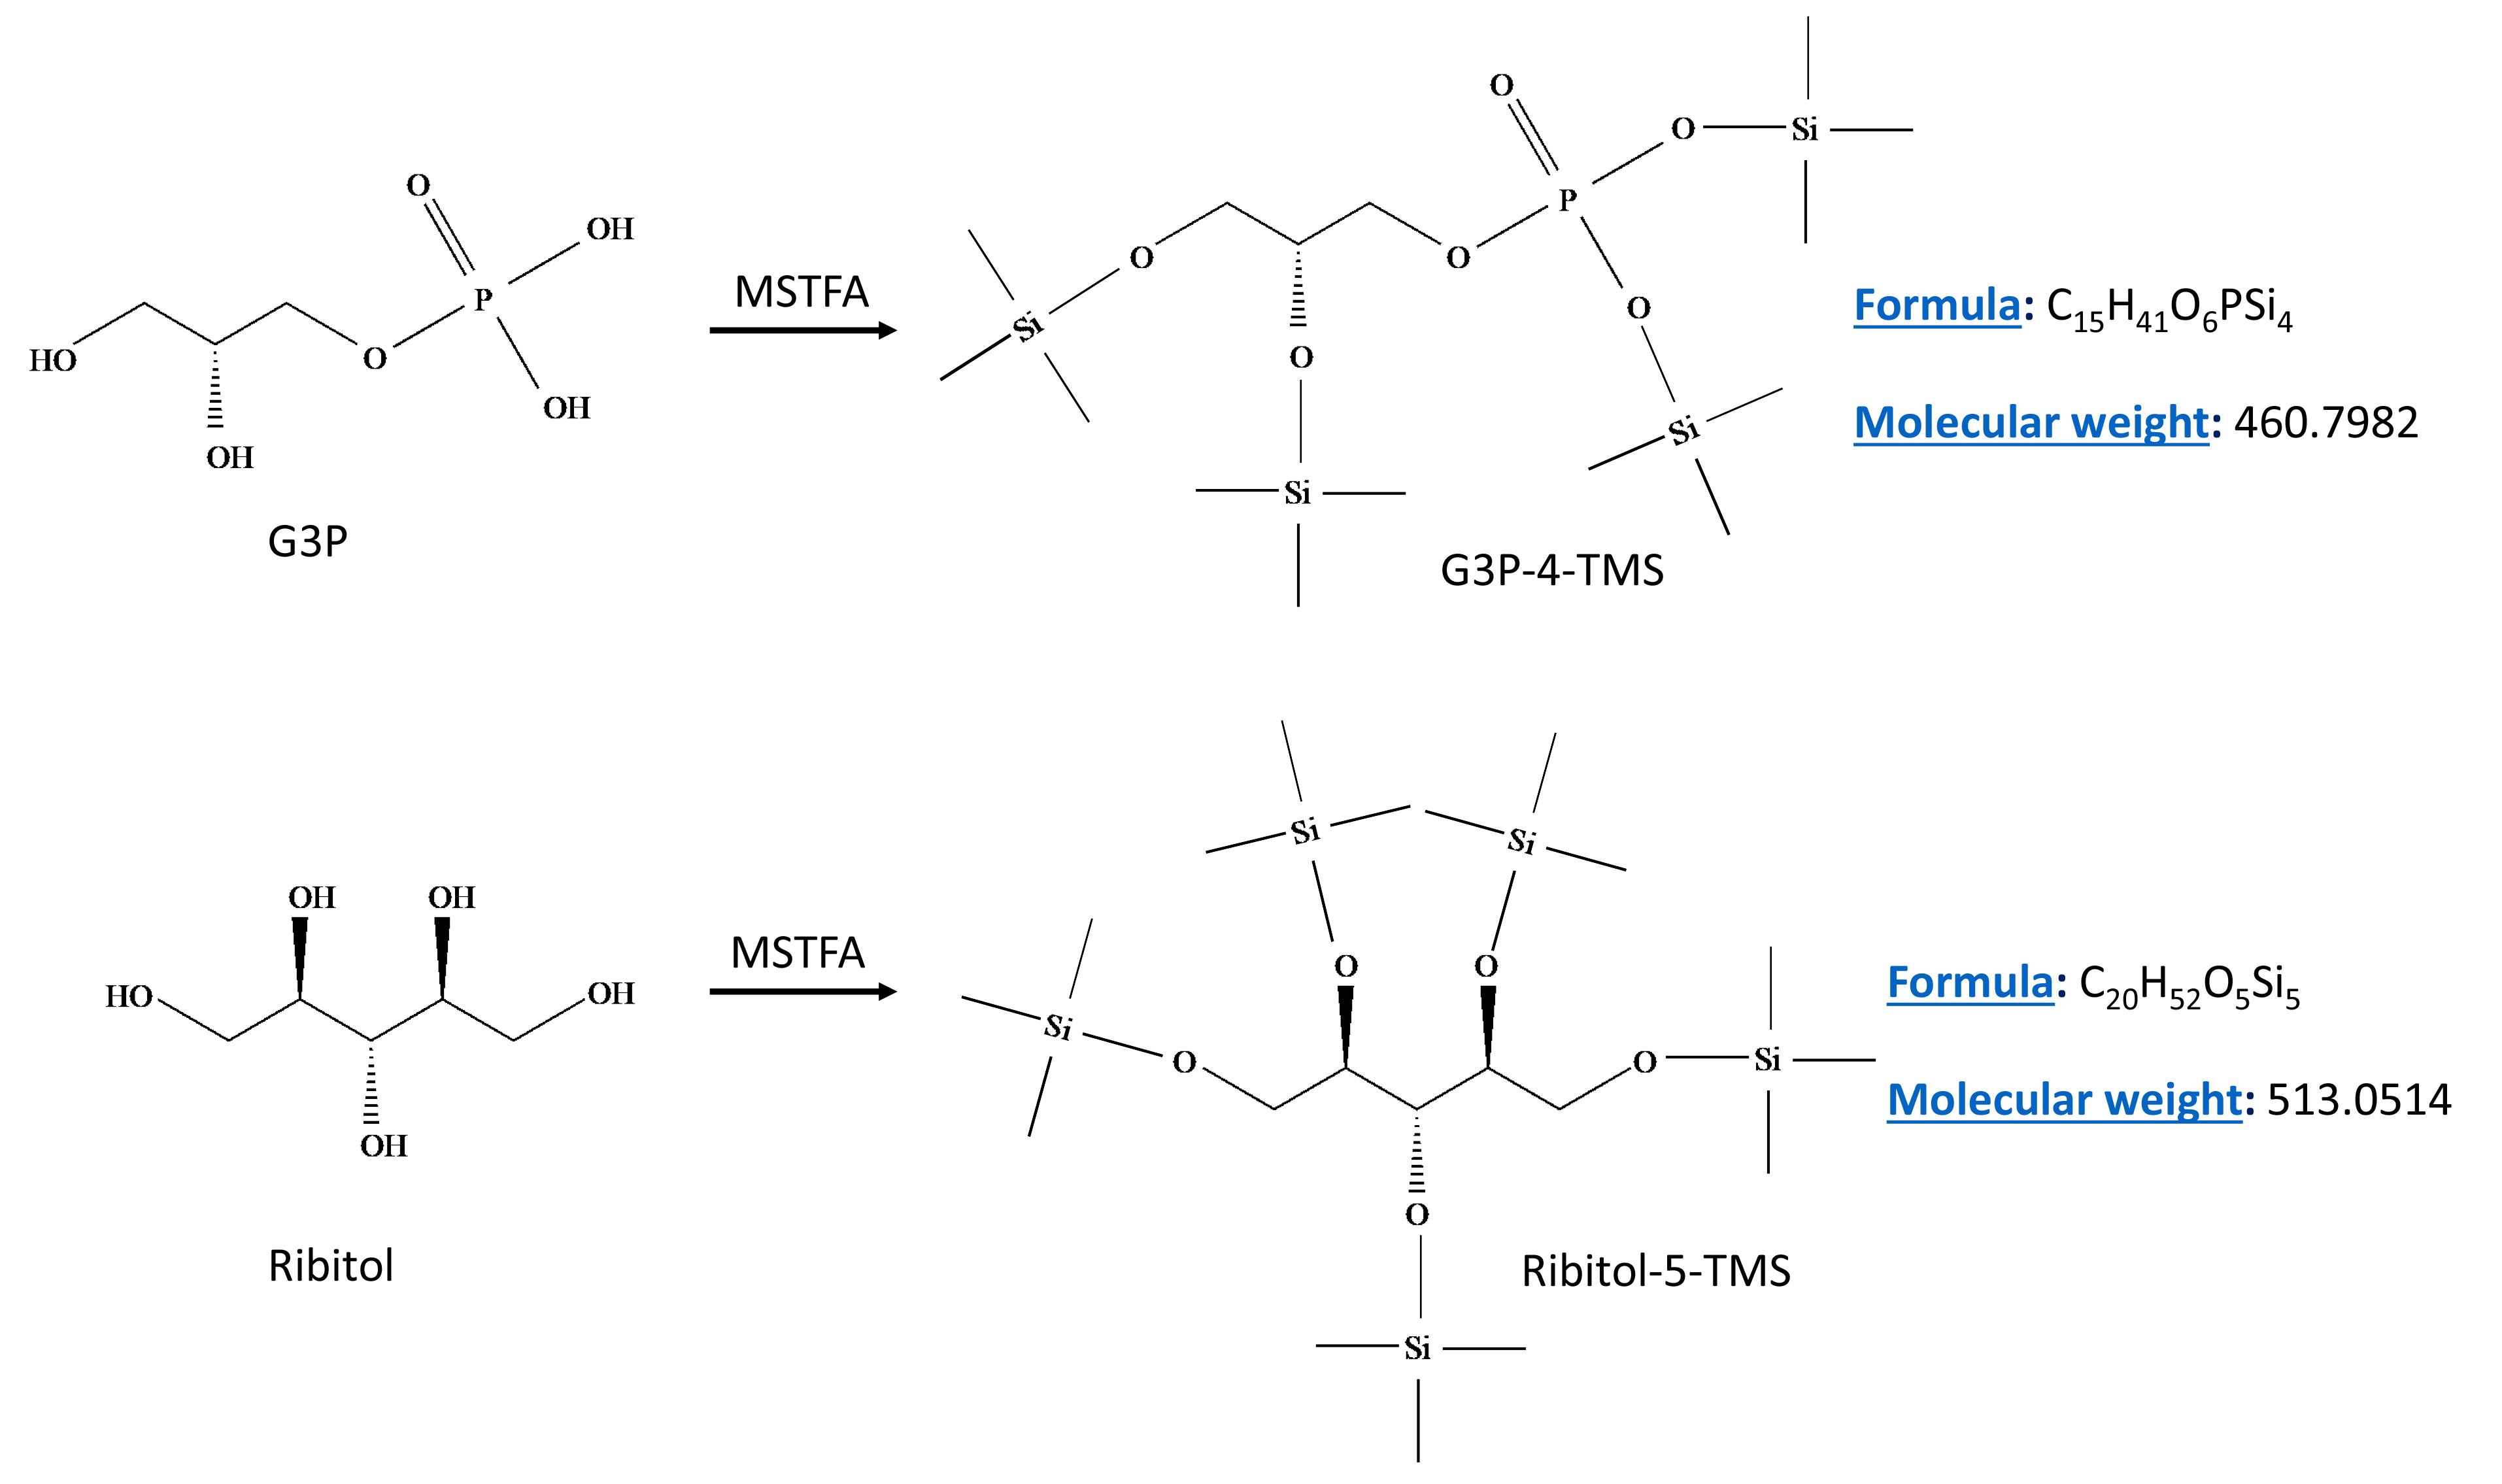
Figure 1. Derivatization reactions for analyte G3P (upper panel) and the internal standard ribitol (lower panel) with N-Methyl-N-(trimethylsilyl)trifluoroacetamide (MSTFA). MSTFA reacts with hydroxyl groups and the derivatized products of G3P and ribitol contain four or five trimethylsilyl groups (TMS), respectively.
Materials and Reagents
BDTM tuberculin syringe, 1 mL (Becton Dickinson, catalog number: 309659)
Kimwipes, 1-ply (Fisher, catalog number: 06-666)
Autoclavable microfuge tubes, 1.5 mL (Sarstedt, catalog number: 72.690.300)
Centrifuge tubes, 15 mL (Sarstedt, catalog number: 50.809.220)
Disposable test tubes, 13 × 100 mm (VWR, catalog number: 47729-572)
GC vials, 2 mL (Agilent, catalog number: 5190-9062)
Screw caps (Agilent, catalog number: 5182-0717)
Pasteur pipets (Fisher, catalog numbers: 13-678-20A and 13-678-20C)
Micro capillary pipets (Kimble, catalog number: 71900-20)
Arabidopsis thaliana (can be obtained from Arabidopsis biological resource center, www.arabidopsis.org)
Pseudomonas syringae expressing avrRpt2 (a gift from Dr. Barbara Kunkel, Washington University in St. Louis)
N-Methyl-N-(trimethylsilyl)trifluoroacetamide (MSTFA) (Soltec Bio Science, catalog number: GC113)
Liquid nitrogen (American Welding & Gas, 22 Psi)
Magnesium chloride hexahydrate (Fisher, catalog number: BP214-500)
Acetonitrile (ACROS, catalog number: 26827-0040)
Acetone (Thermo Scientific, Catalog number: A949-1)
Ribitol (Adonitol; Alfa Aesar, catalog number: L03253)
Glycerol-3-phosphate (Sigma, catalog number: G7886)
Monosodium phosphate (Alfa Aesar, catalog number: 33385)
Sodium orthovanadate (MP Biomedicals, catalog number: 159664)
Sodium pyrophosphate (Fisher Scientific, catalog number: BP330)
10 mM magnesium chloride (see Recipes)
Extraction buffer (see Recipes)
Internal standard (see Recipes)
Phosphatase inhibitors (see Recipes)
Equipment
Milli-Q Advantage A10 Water purification system (EMD Millipore, model: Z00Q0V0WW)
Lyophilizer, VirTis Freezemobile 25ES freeze dryer
Autoclave (Consolidated Stills & Sterilizers, model: SSR3APB)
Electric multi-cooker/streamer (Presto Big Kettle; Walmart.com, catalog number: 06008)
Scissors (Harbor Freight Tools, catalog number: 62458)
Aluminum foil (Thermo Scientific, catalog number: 01-213-102)
Explosion proof clips (M2 Sci, catalog number: C1005-T5-lock)
Balance (METTLER TOLEDO, model: AT261)
Benchtop Dewar flask (Thermo Scientific, catalog number: 10-194-100B)
Tissue grinder (Axygen Scientific, catalog number: PES15BSI)
Vortexer with a Styroform platform (Labnet, model: S0100)
Dewar flask (Thermo Scientific, catalog number: 10-194-100A/B)
Tabletop centrifuge (Eppendorf, model: 5417C), which is used for centrifuging microfuge tubes
Parker Source TriGas Generator (Parker Hannifin, model: LCMS-5000NA, compressor model: SF120872PH)
Table-top swing-arm centrifuge (Clay Adams, model: Dynac 0101), used for centrifuging disposable test tubes
Latex bulbs, 2 mL (VWR, catalog number: 82024-554)
Gas chromatograph-mass spectrometer (GC-MS) (Agilent, model: 7890A-5977)
GC column, HP-5MS (Agilent, catalog number: 19091J-413)
Ultra-high purity helium (AWG gases, Lexington, KY, catalog number: UN1046)
Computer for GC-MS (Dell, model: 3430)
Syringe for manual GC injection, 5 µL (Hamilton, catalog number: 87993)
Software
MassHunter Workstation for qualitative and quantitative analysis (Agilent, software version: 10.0)
Enhanced MassHunter Workstation for data acquisition (Agilent, software version: 10.0)
MS spectral library (NIST; Agilent Technologies)
Procedure
Equipment setup
GC setup
Chromatography: Perform chromatography with a 30 m capillary HP-5MS GC column, using ultra-high pure helium as the carrier gas set at a constant pressure of 1.2 mL/min. Set the injection port temperature to 240 °C and the transfer line temperature to 280 °C. Run samples in splitless mode. Use the temperature program shown in Table 1 for chromatography.
Table 1. GC temperature used for profiling ribitol and G3P
Rate Temperature Hold time 0 80 °C 1 min 15 °C/min 200 °C 1 min 10 °C/min 280 °C 2 min MS setup
Auto-tune the instrument according to the manufacturer’s instructions.
Sample preparation and analysis
For pathogen assays, infiltrate the largest three leaves of ~4-week-old plants with either 10 mM MgCl2 or the pathogen Pseudomonas syringae avrRpt2 using a needleless syringe from the abaxial side of the leaves. After leaf infiltration, remove excess droplets of 10 mM MgCl2 or pathogen suspension with Kimwipes.
Approximately 16 h later, collect ~10–100 mg infiltrated leaf tissue. Sample the entire leaf using a pair of scissors.
Weigh the tissue using a balance that is accurate to the 1 mg digit. Record the weight of each sample. ∆CRITICAL STEP
Lyophilize the leaf tissue overnight in aluminum foil. Weigh and place approximately 1–10 mg of dry leaf tissue in an autoclaved microfuge tube.
Drop the microfuge tubes containing lyophilized tissue into a Dewar flask containing liquid nitrogen. Store frozen tissues at -80 °C until further analysis. •PAUSE POINT
Grind the tissue to a fine powder with a plastic pestle and immediately add 1,000 µL of extraction buffer before the tissue is thawed. ∆CRITICAL STEP
Add 2 µg of internal standard to the extract.
Cap the tubes with explosion proof clips and boil immediately in water for 5 min using an electric multi-cooker. ∆CRITICAL STEP
Centrifuge the tubes at 18,000 × g for 15 min.
Transfer the supernatant to a 13 × 100 mm glass test tube.
Dry the supernatant with a stream of nitrogen gas. Dried extract can be stored at -20 °C indefinitely. •PAUSE POINT
Add 250 µL of water to the dried extract and vortex the tube for 30 s.
Centrifuge the tubes at ~80% speed (approximately 1,250 × g) for 1 min in a tabletop swing-arm centrifuge.
Transfer the supernatant to a fresh microfuge tube followed by incubation at -80 °C for 30 min (this step is for sample cleanup). Thaw the samples at room temperature and then centrifuge at 18,000 × g for 6 min.
Transfer the supernatant to a GC vial and dry with a stream of nitrogen gas.
Wash the vial with 500 µL of acetone to remove residual water in the sample and then dry again with a stream of nitrogen gas.
Use microcapillary pipets to add 50–75 µL of acetonitrile to the dried samples, vortex the vials for 10 s, and add 50–75 µL of MSTFA containing 1% trimethylchlorosilane (TCMS). Incubate the samples at 65 °C for 1 h and transfer the contents to a GC insert with a Pasteur pipet.
Inject 0.5–1 µL into GC/MS for analysis using selective ion monitoring mode (SIM) using quantifier ions 299 (G3P) and 217 (ribitol) and qualifier ions 357 and 445 for G3P, and 147 and 307 for ribitol.
GC-MS data from standard compound analysis
Figure 2 shows the total ion chromatogram (top panel) and corresponding MS of ribitol (middle panel) and G3P (bottom panel) standards run in scan mode.
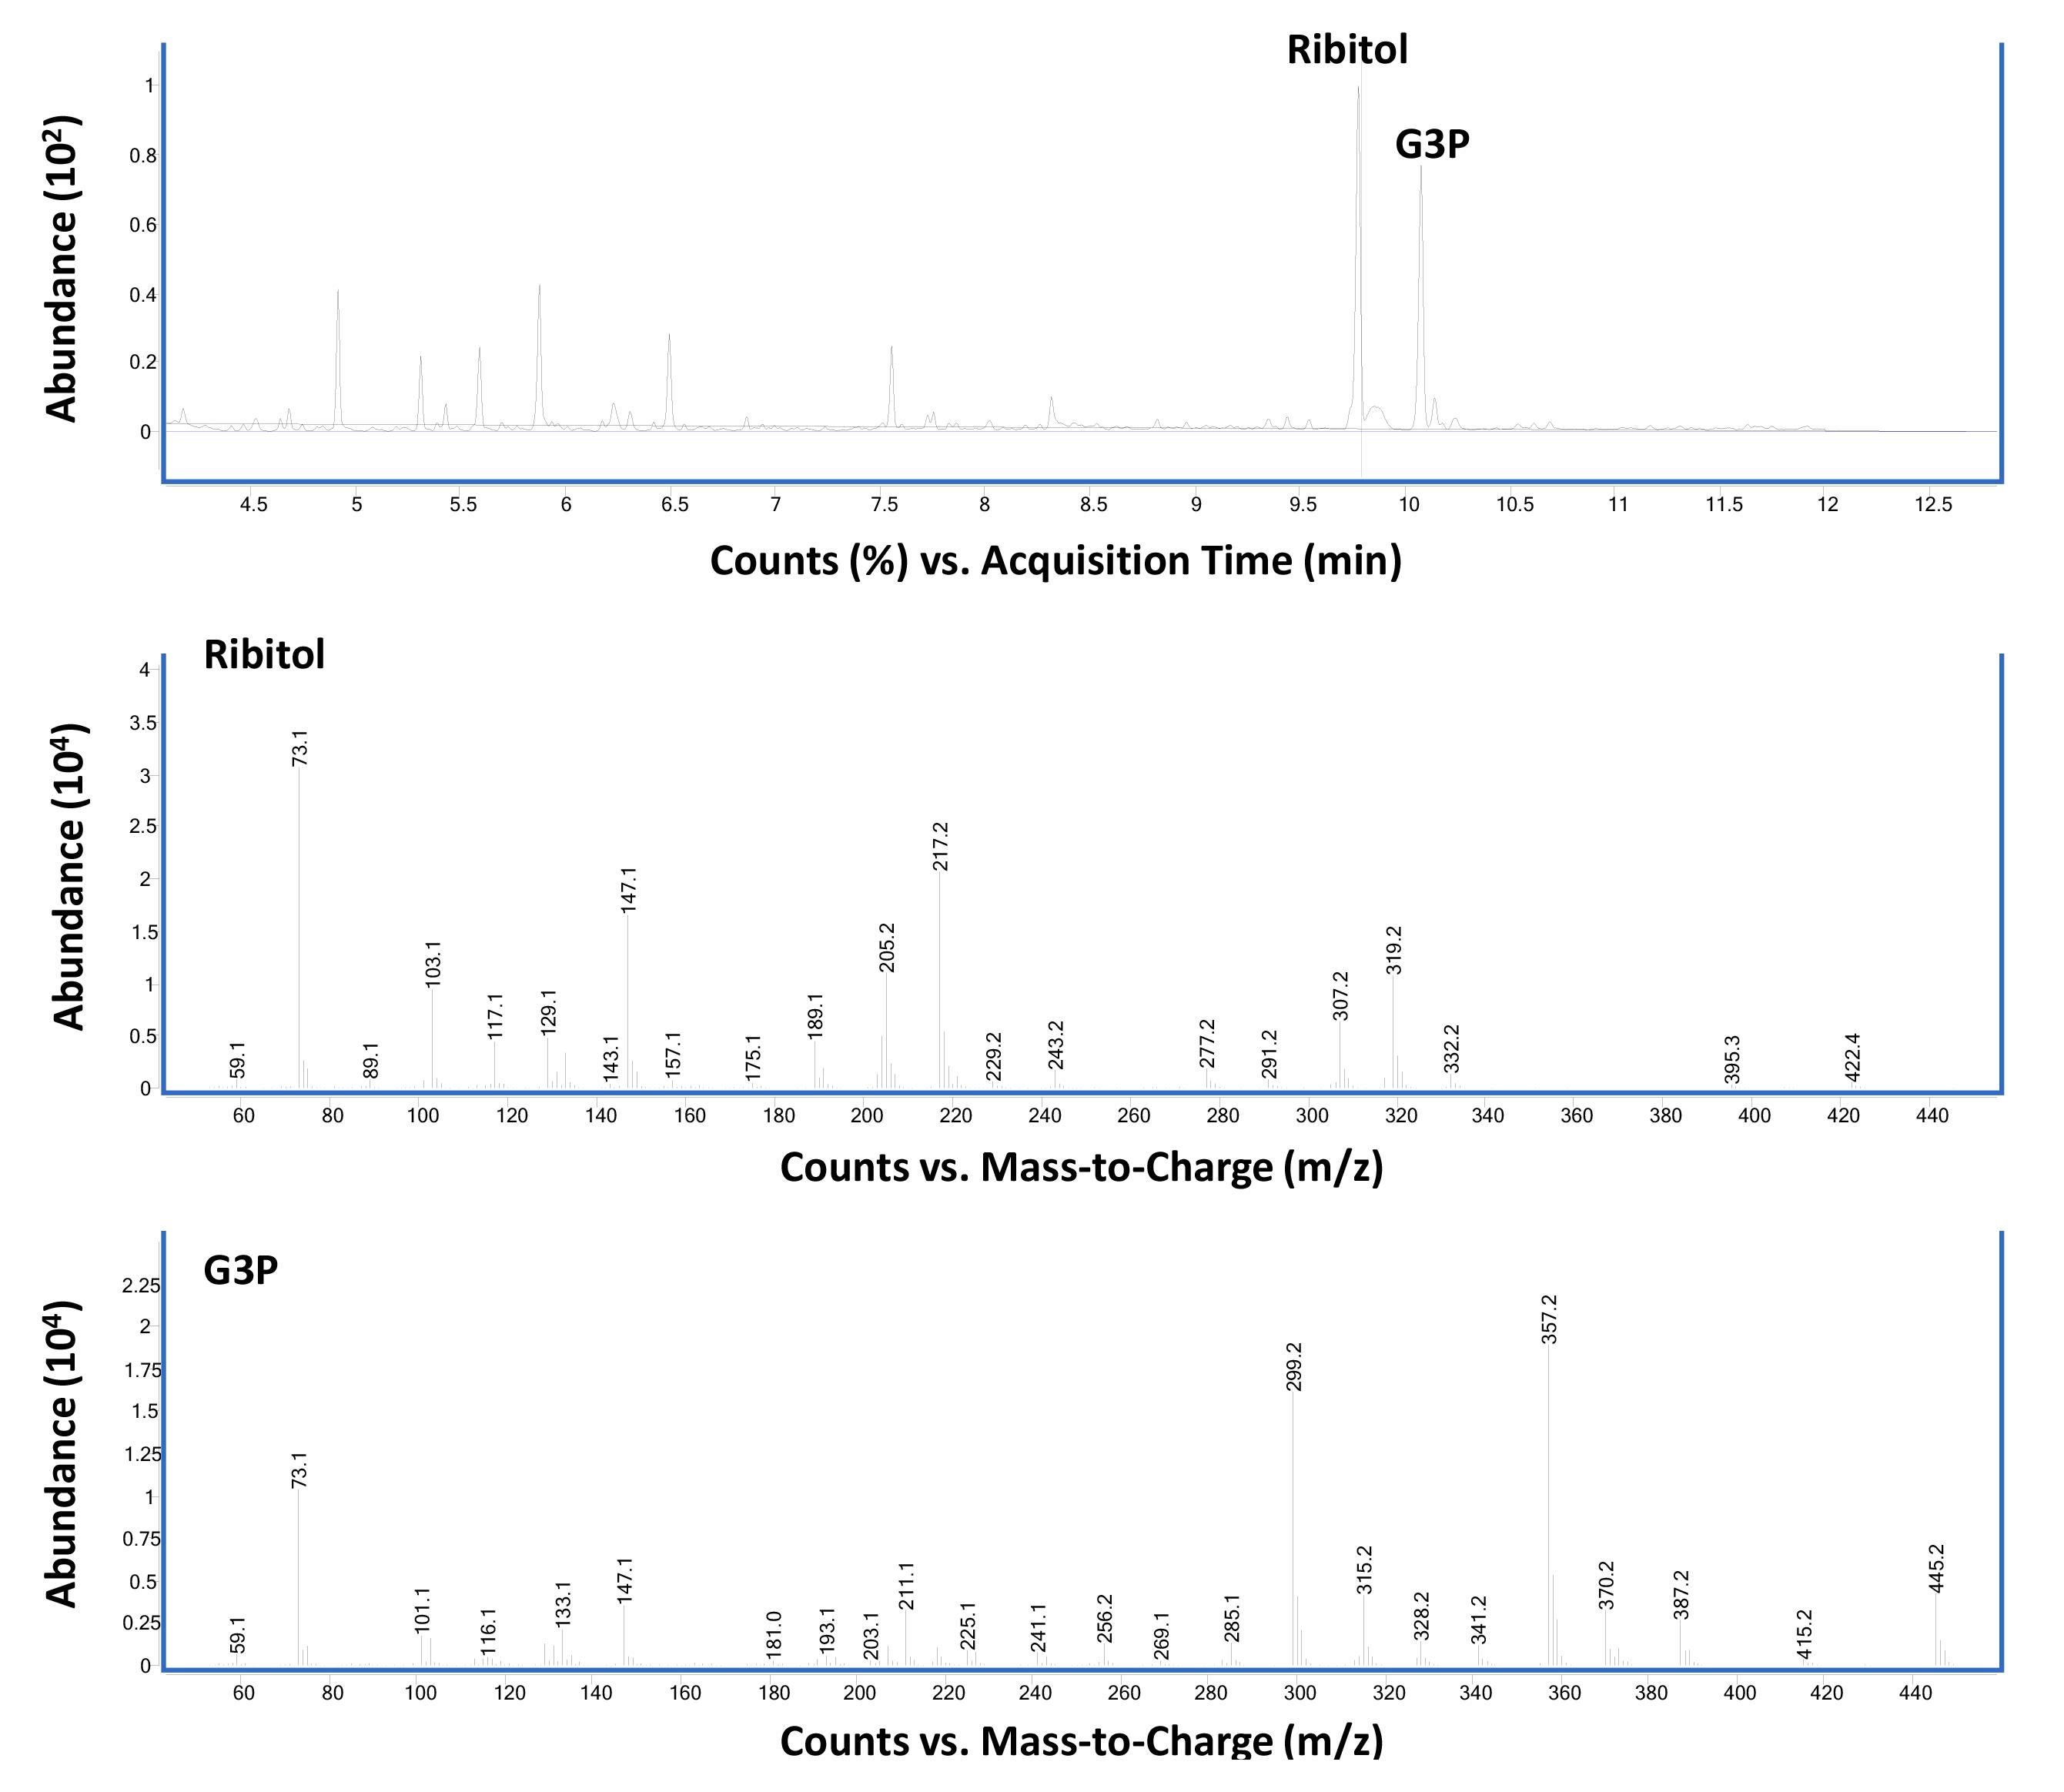
Figure 2. Total ion chromatogram and corresponding mass spectrometry of ribitol and glycerol-3-phosphate (G3P) standards run in scan mode. GC-MS chromatograph of equal weight (2 µg each in 100 µL) mixture of ribitol and G3P derivatized with MSTFA-TCMS as described in Procedure B using scan mode (Top panel) Ribitol-TMS (at 9.77 min) and G3P-TMS (at 10.07 min) are the two major peaks. (Middle panel) Mass spectra of ribitol-TMS derivative. (Bottom Panel) Mass spectra of G3P-TMS derivative.Figure 3 shows the GC-MS data from standard compound analysis using SIM mode. Based on the mass spectra shown in Figure 2, three major ions were used to monitor G3P (299, 357, 445) and ribitol (217, 147, 307) in SIM mode.
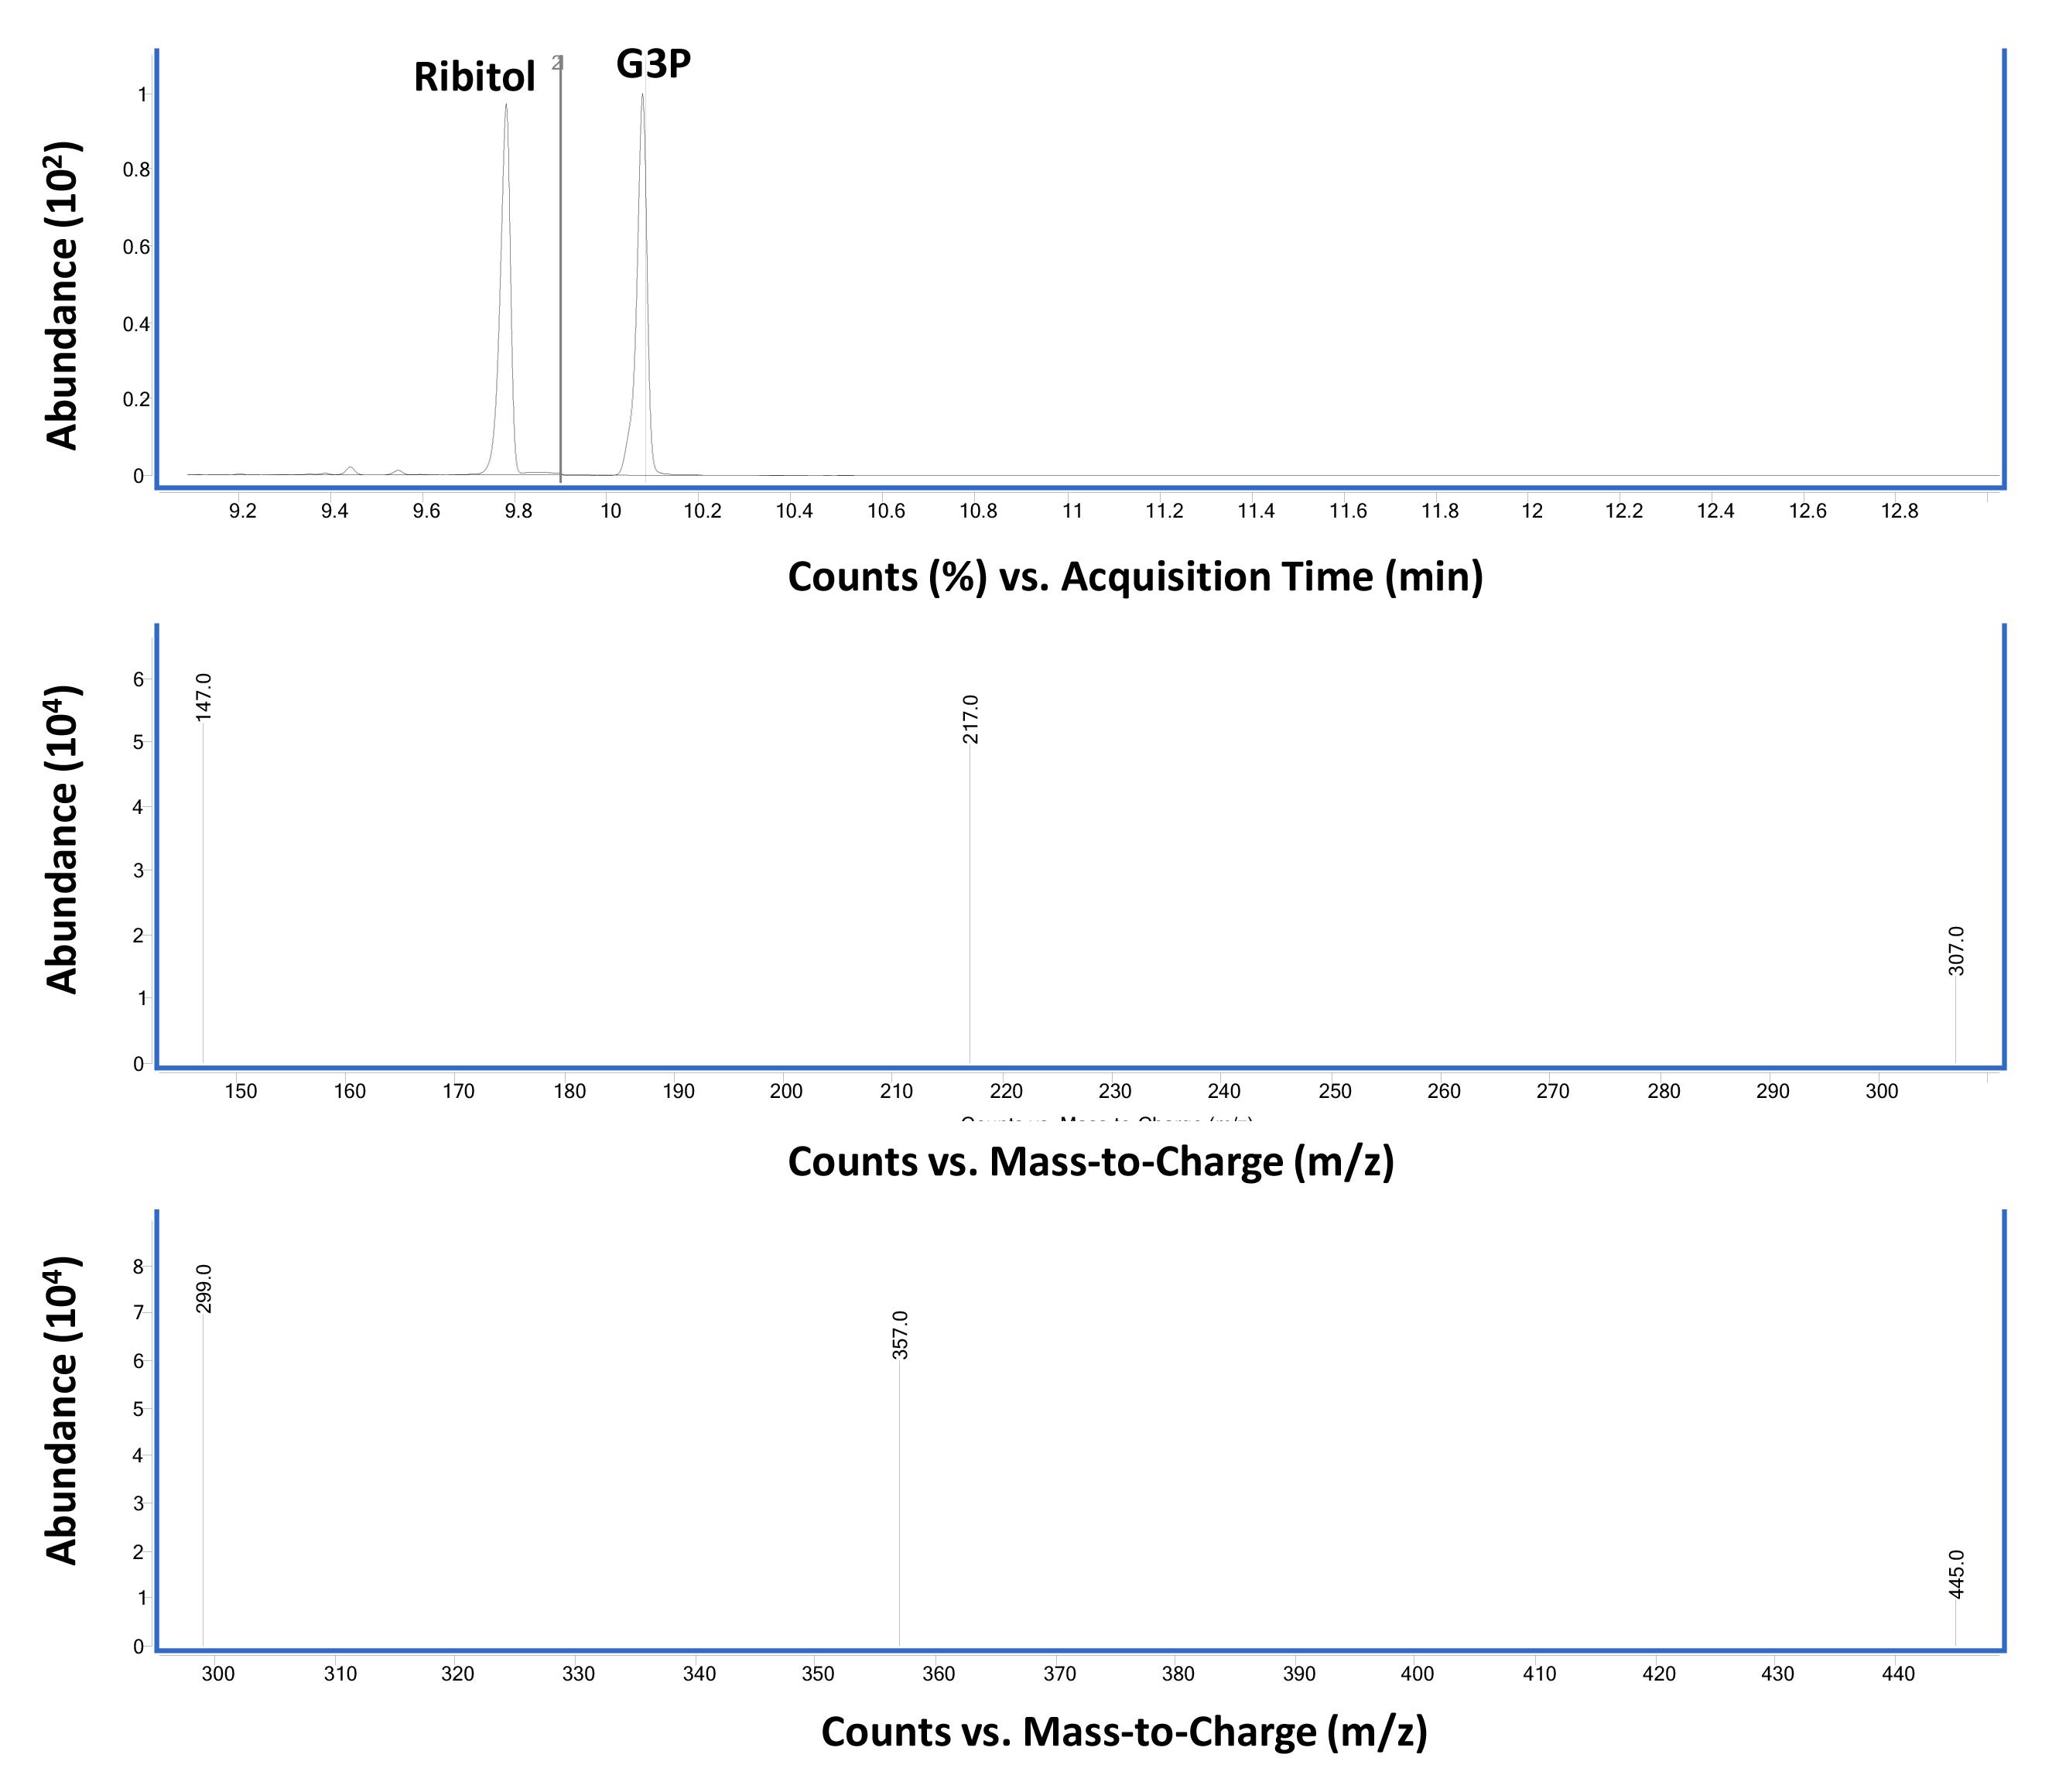
Figure 3. Total ion chromatogram and corresponding MS of ribitol and G3P standards run in selective ion monitoring (SIM) mode. GC-MS chromatograph of equal weight (2 µg each in 100 µL) mixture of ribitol and G3P derivatized with MSTFA-TCMS as described in Procedure B using SIM mode (Top panel) Ribitol- (at 9.77 min) and G3P-TMS (at 10.07 min) derivatives are the two major peaks (indicated by 1/2). (Middle panel) Mass spectra of ribitol-TMS derivative in SIM mode selected for the major ions 217, 147, 307. (Bottom panel) Mass spectra of G3P-TMS derivative in SIM mode selected for the major ions 299, 357, 445. The dwell time for each ion was set at 25 ms. The relative abundance of major and qualifier ions monitored in SIM and scan modes was similar.
G3P levels in Arabidopsis leaf tissue
GC-MS data for G3P analysis from Arabidopsis thaliana leaf tissue samples using scan (Figure 4) and SIM (Figure 5) modes.
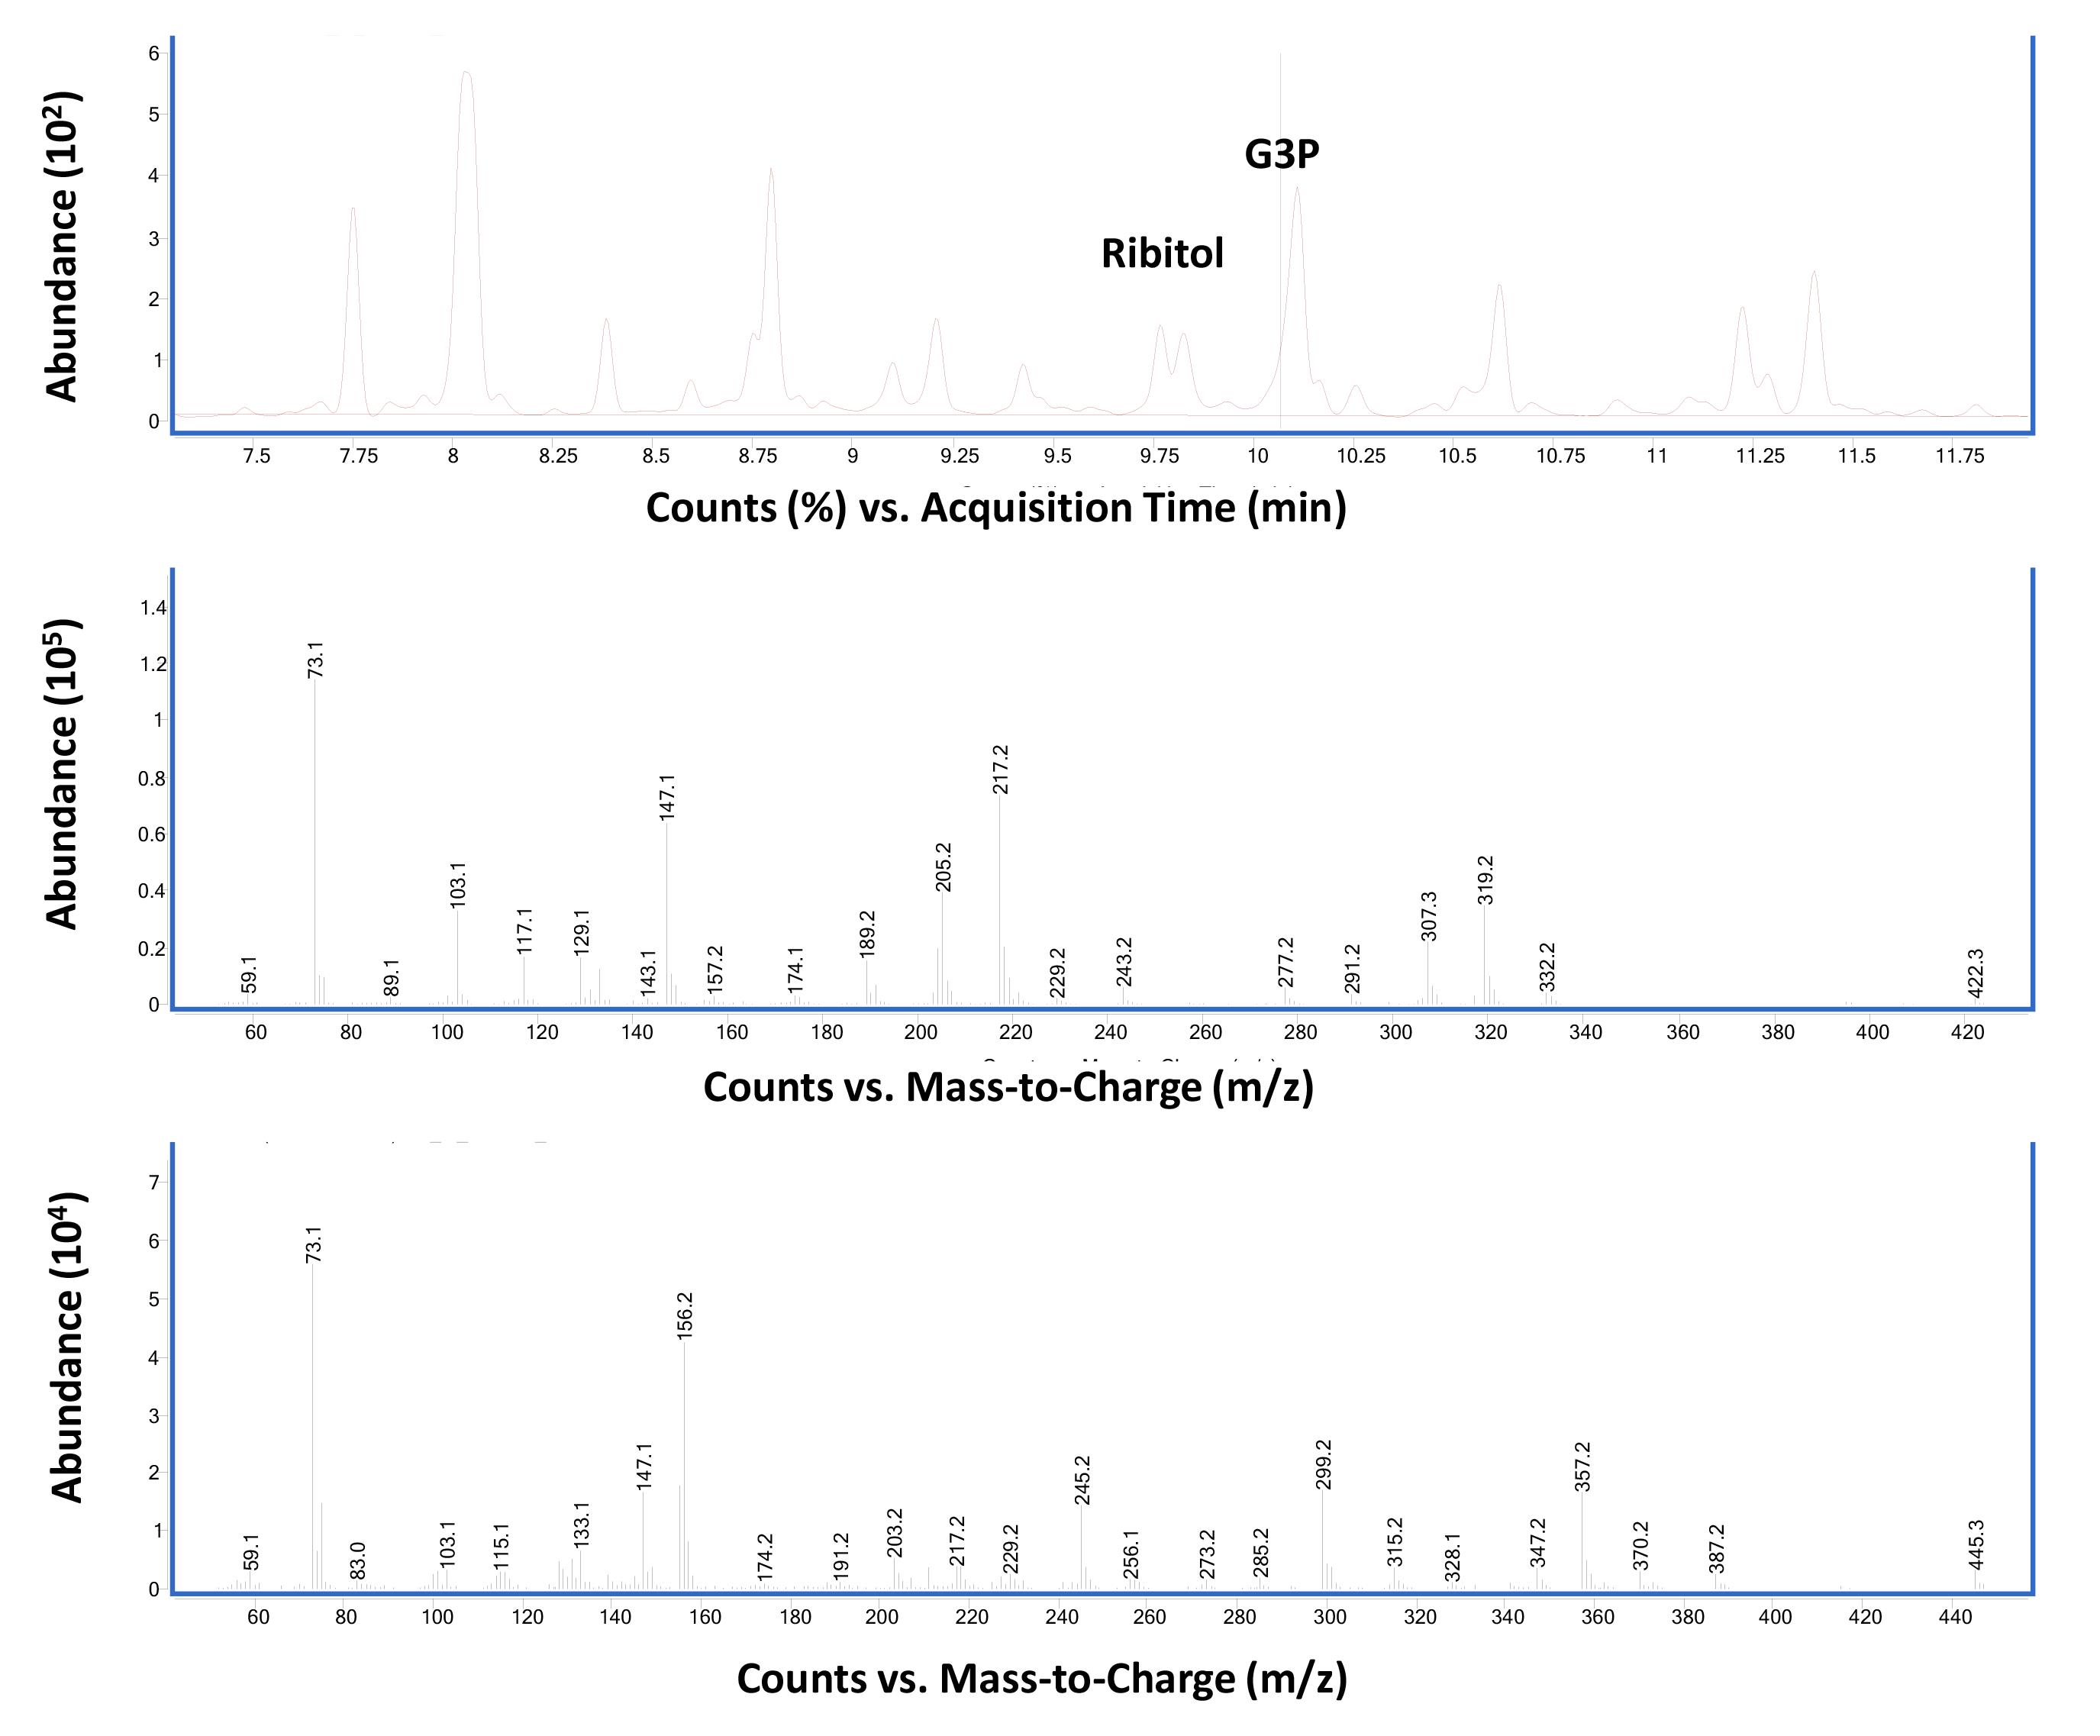
Figure 4. Total ion chromatographs of wild-type Columbia-0 leaf tissues (upper panel). Ribitol (4 µg) was used as an internal standard as described in Procedure B. The middle and bottom panels show MS spectra of ribitol- and G3P-TMS derivatives, respectively. The vertical line in the top panel corresponds to the region that shows G3P specific spectra.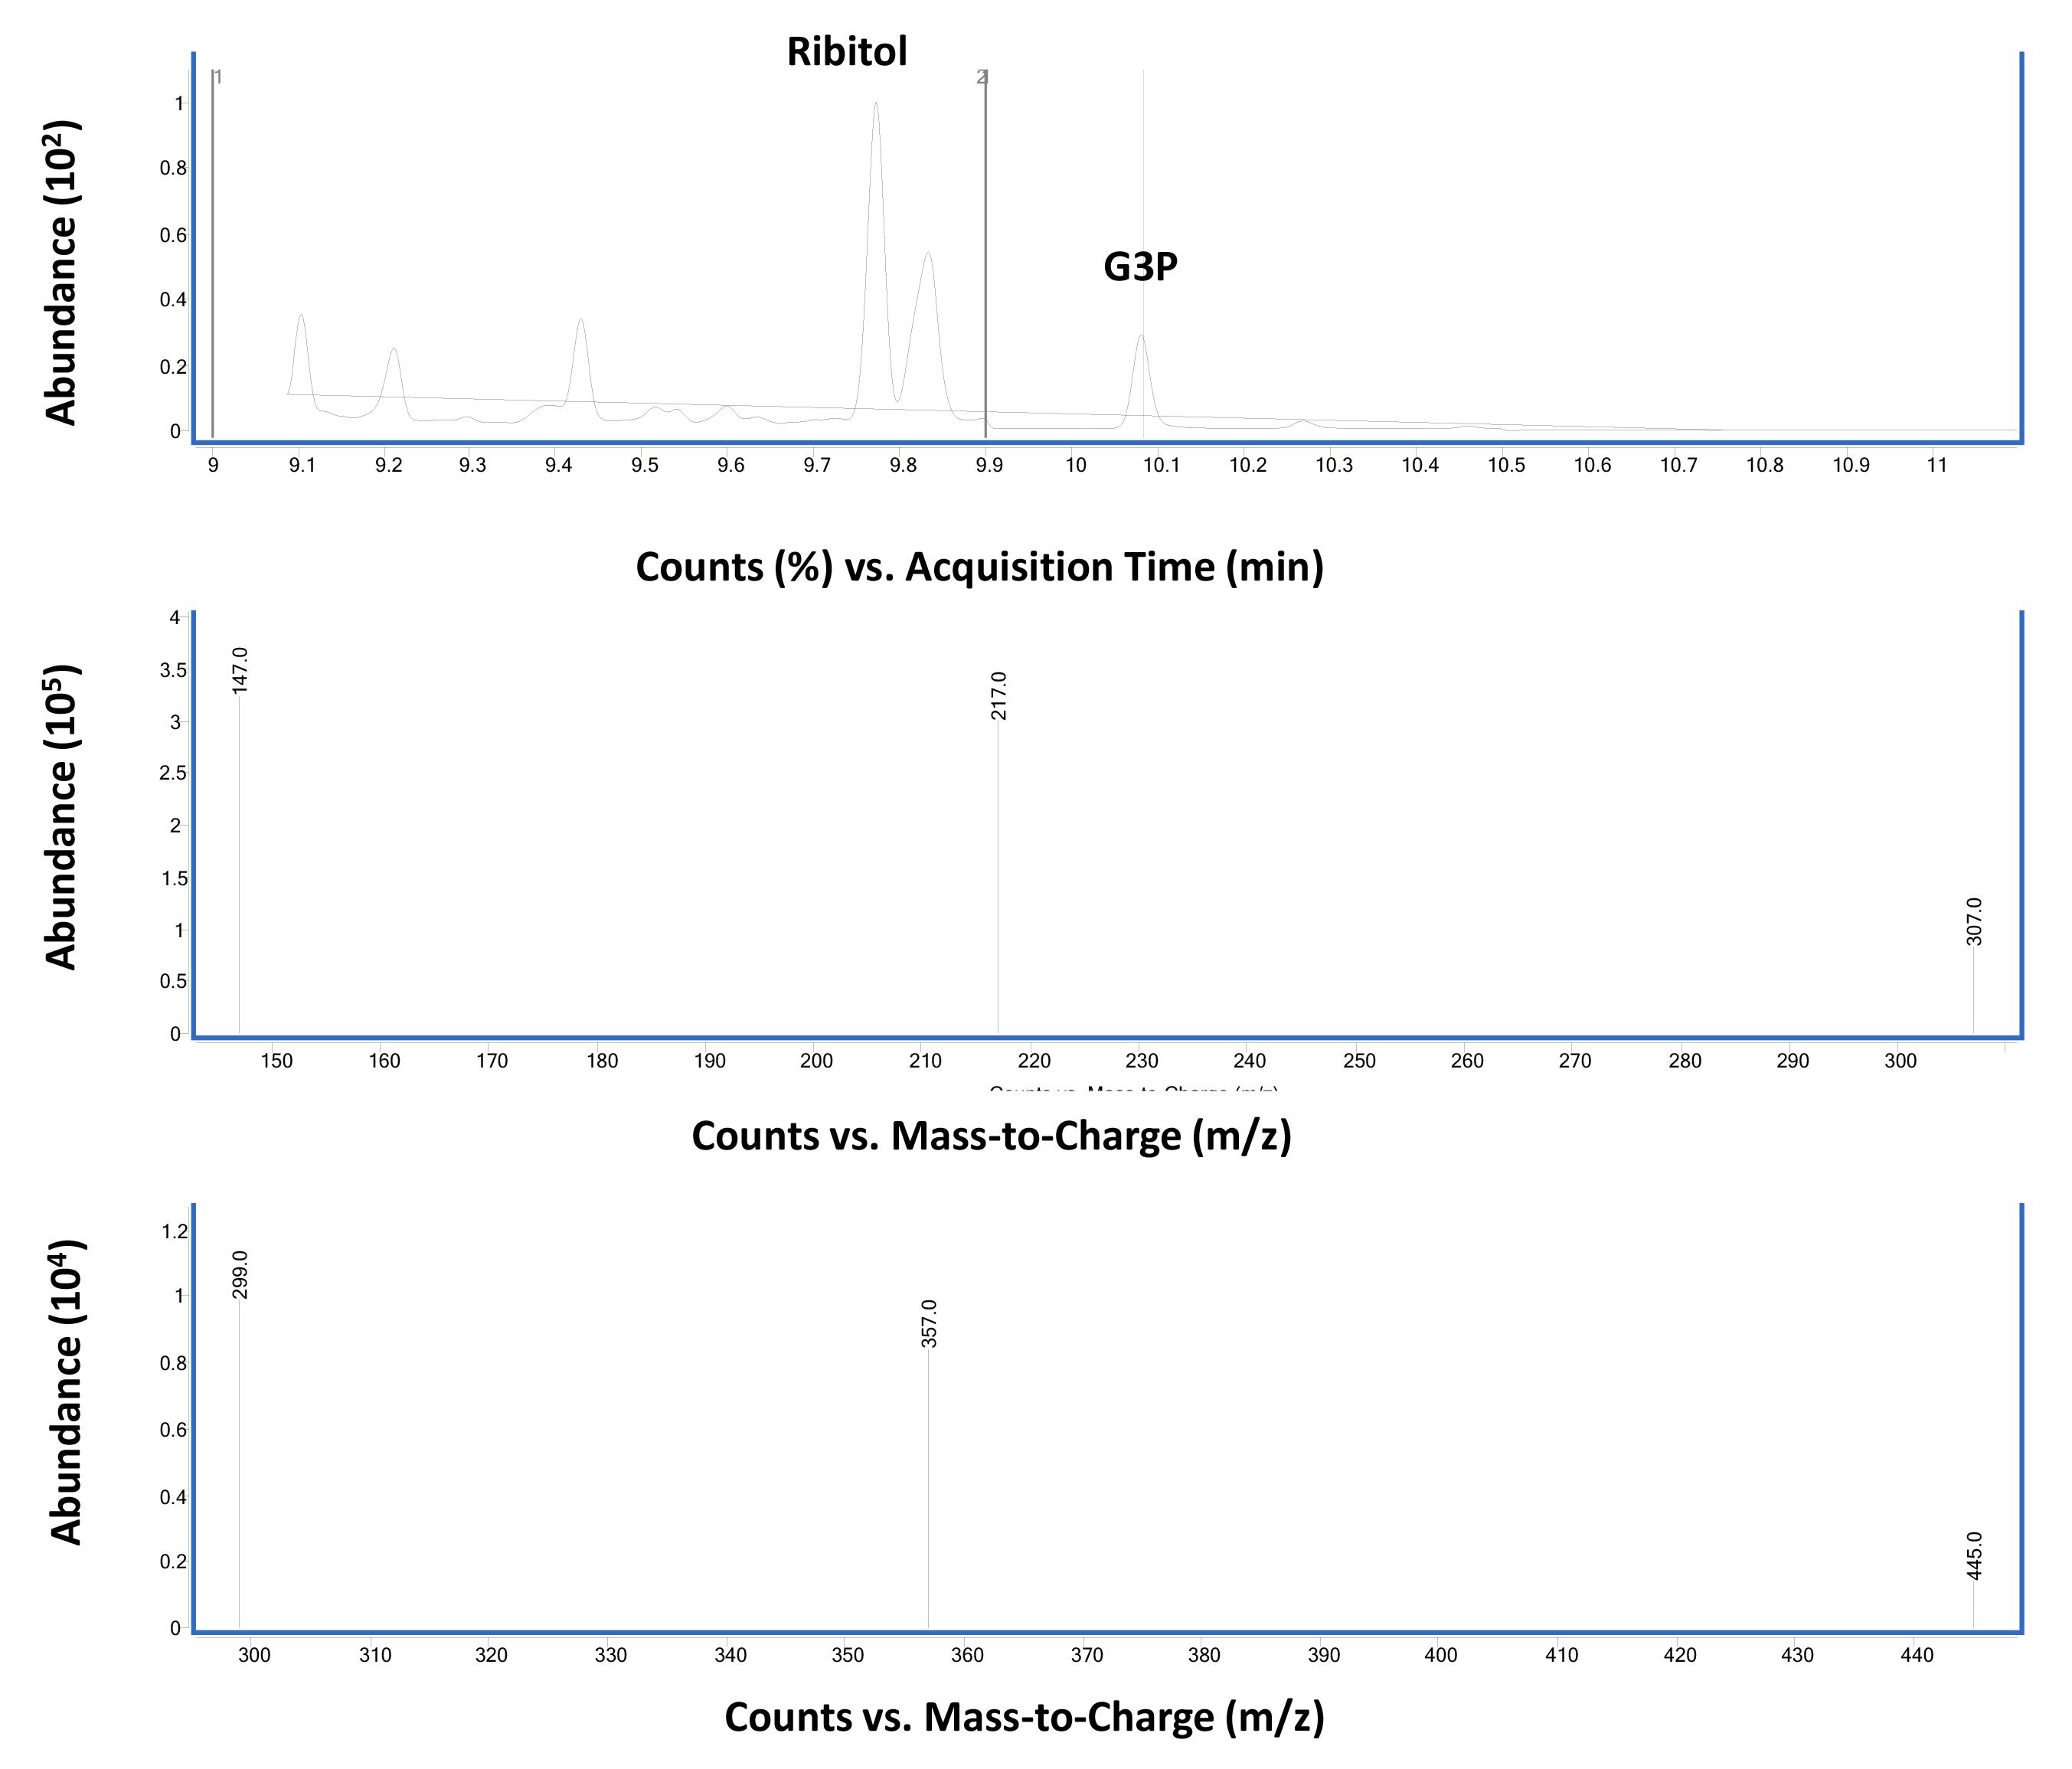
Figure 5. Chromatographs of wild-type Columbia-0 leaf tissues. Ribitol (4 µg) was used as an internal standard as described in Procedure B. (Middle panel) Mass spectra of ribitol-TMS derivative in SIM mode selected for the major ions 217, 147 and 307. (Bottom panel) Mass spectra for G3P-TMS derivative in SIM mode selected for the major ions 299, 357, and 445.Relative G3P levels in Col-0 plants after pathogen infection
Figure 6 shows the relative G3P levels in Col-0 plants inoculated with mock or pathogen. The pathogen-inoculated wild-type plants accumulated ~2–4-fold higher G3P levels compared to mock-inoculated plants.
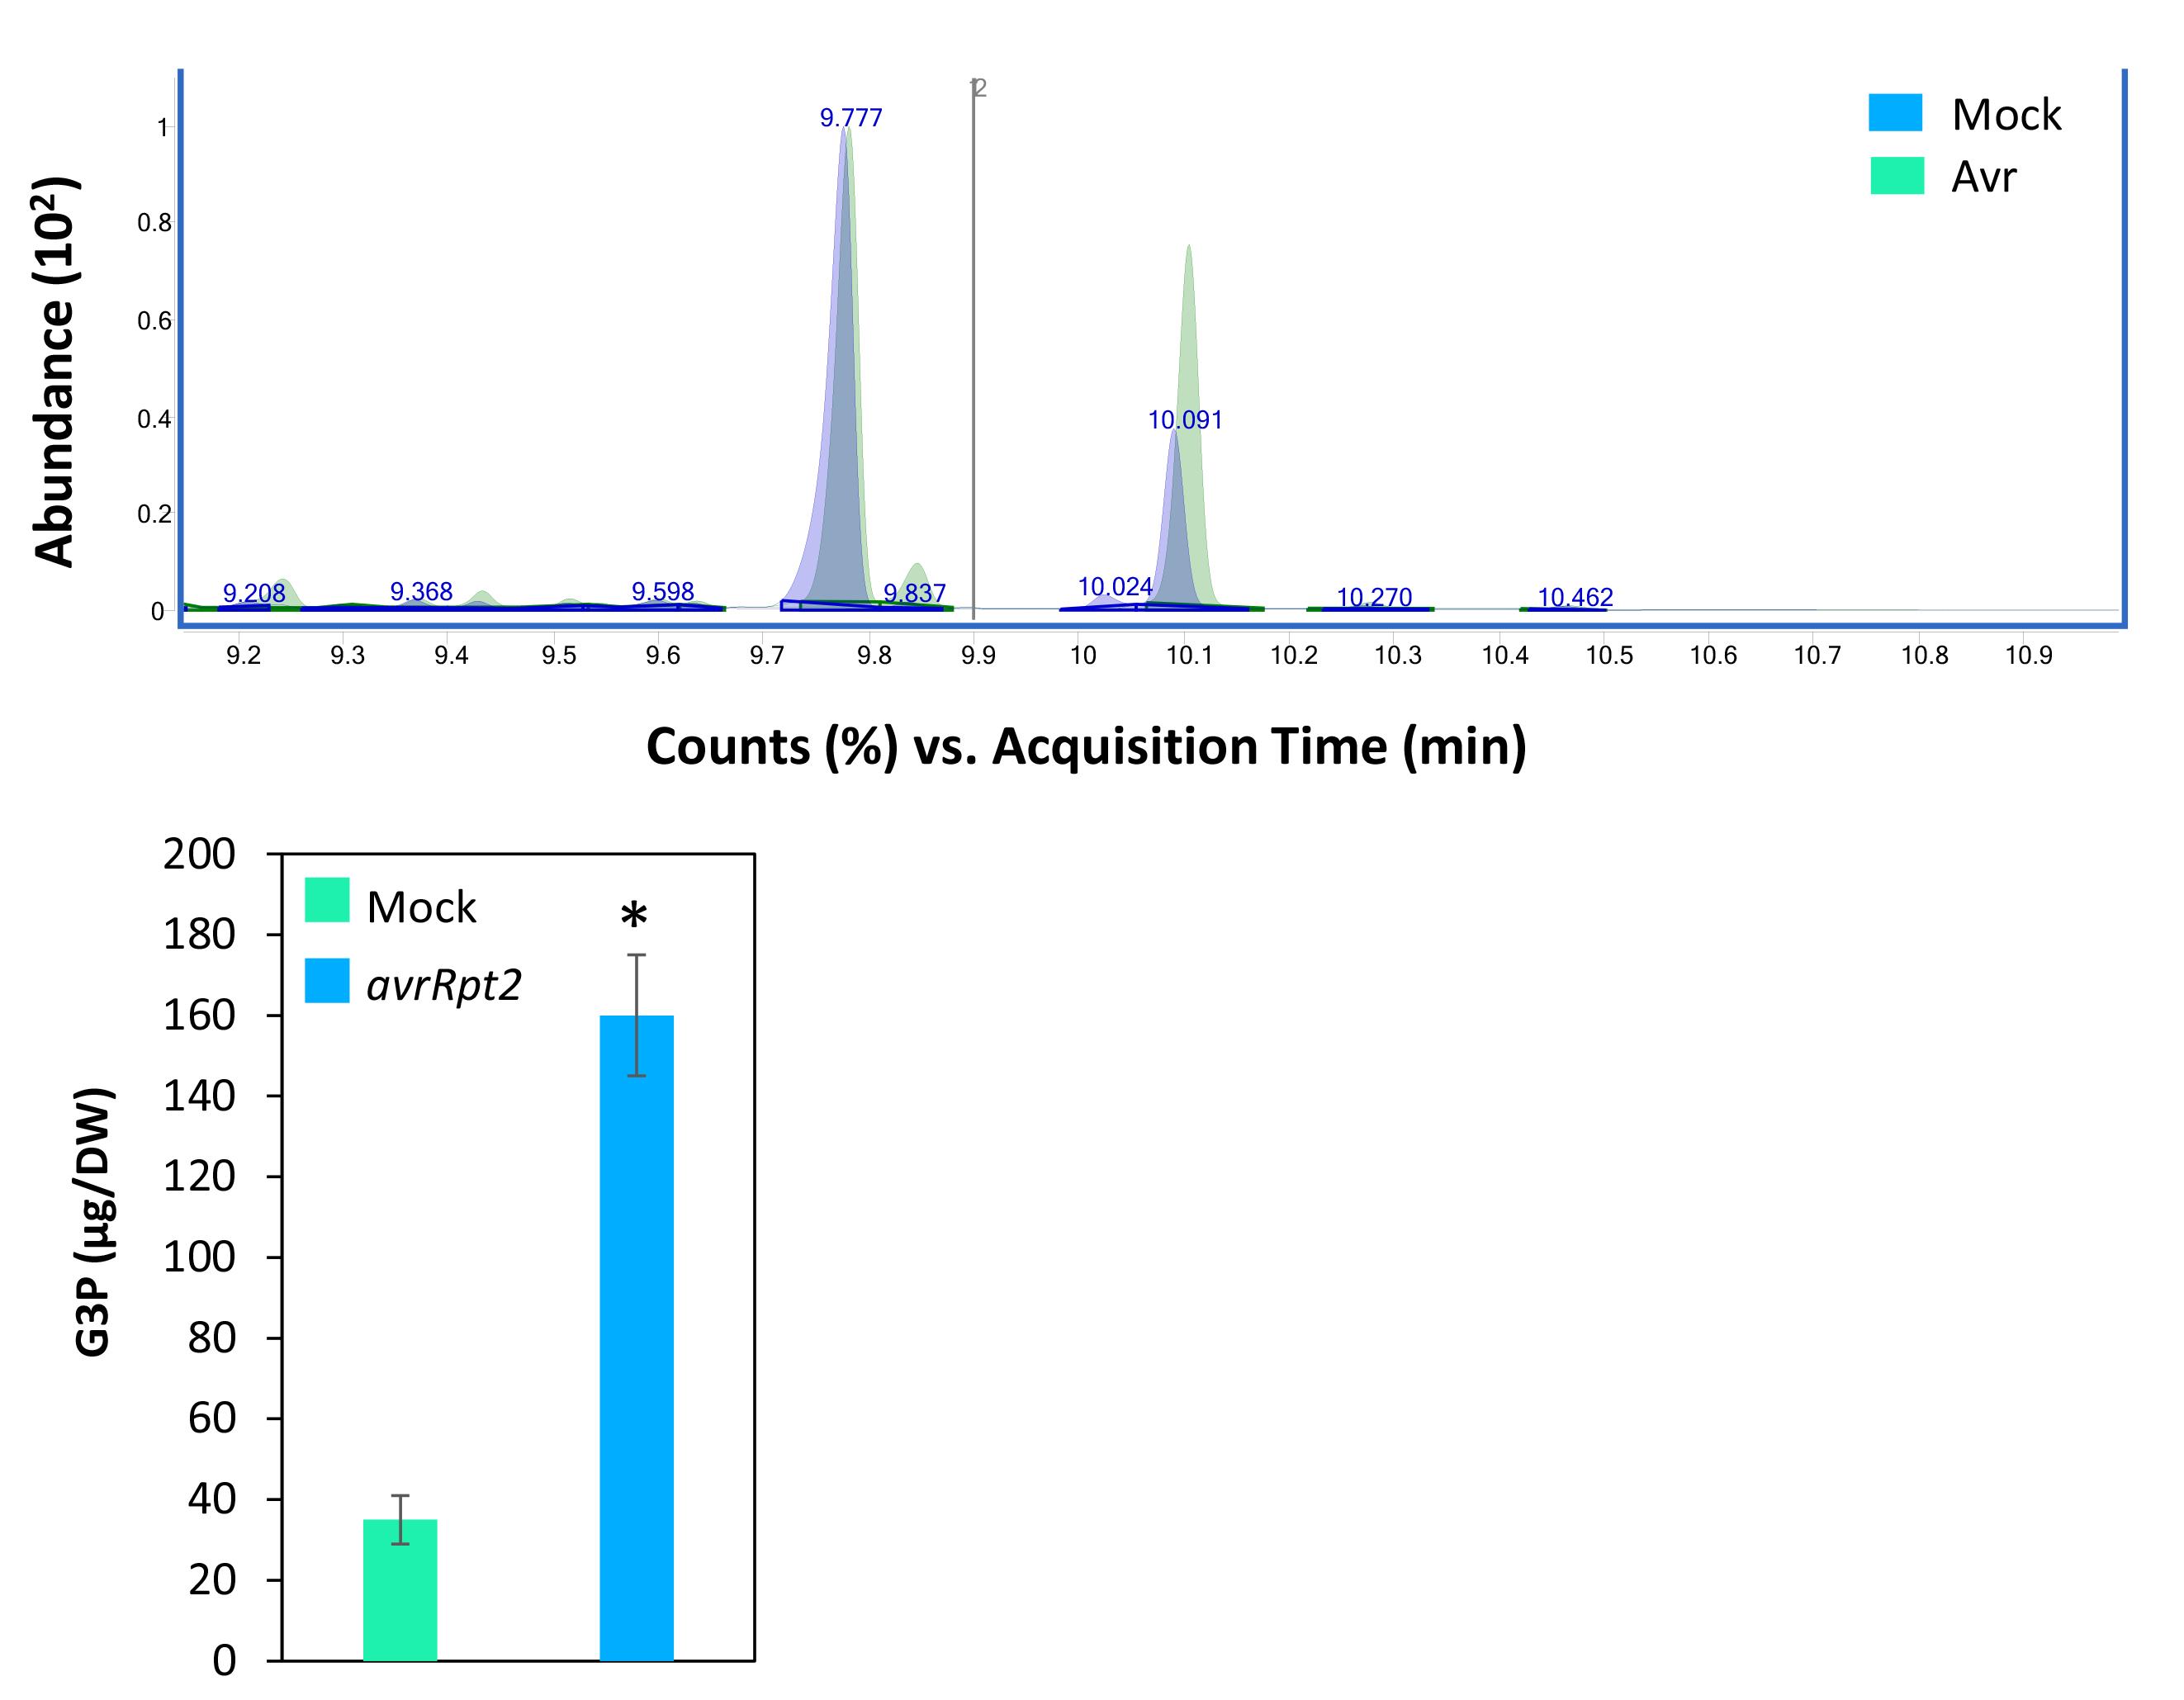
Figure 6. Total ion chromatographs showing ribitol and G3P peaks in mock (10 mM MgCl2)- and pathogen (P. syringae expressing avrRpt2)-inoculated wild-type Columbia-0 leaf tissues at 16 h post inoculation (upper panel). The bottom panel shows quantified G3P levels in mock- and pathogen-inoculated plants. Plants were inoculated with 105 CFU mL-1 in 10 mM MgCl2. Error bars indicate standard deviation (n = 4), and asterisks indicate statistical significance (P > 0.001).
Data analysis
MassHunter Workstation 10.0 was used for qualitative and quantitative data analysis. The ion ratios between quantitative and qualifier ions were used as an additional measure to access proper identification of the analytes using SIM mode. G3P levels were calculated based on the standard curve generated using 500–8,000 ng concentrations of ribitol and G3P run in triplicates (Figure 7).
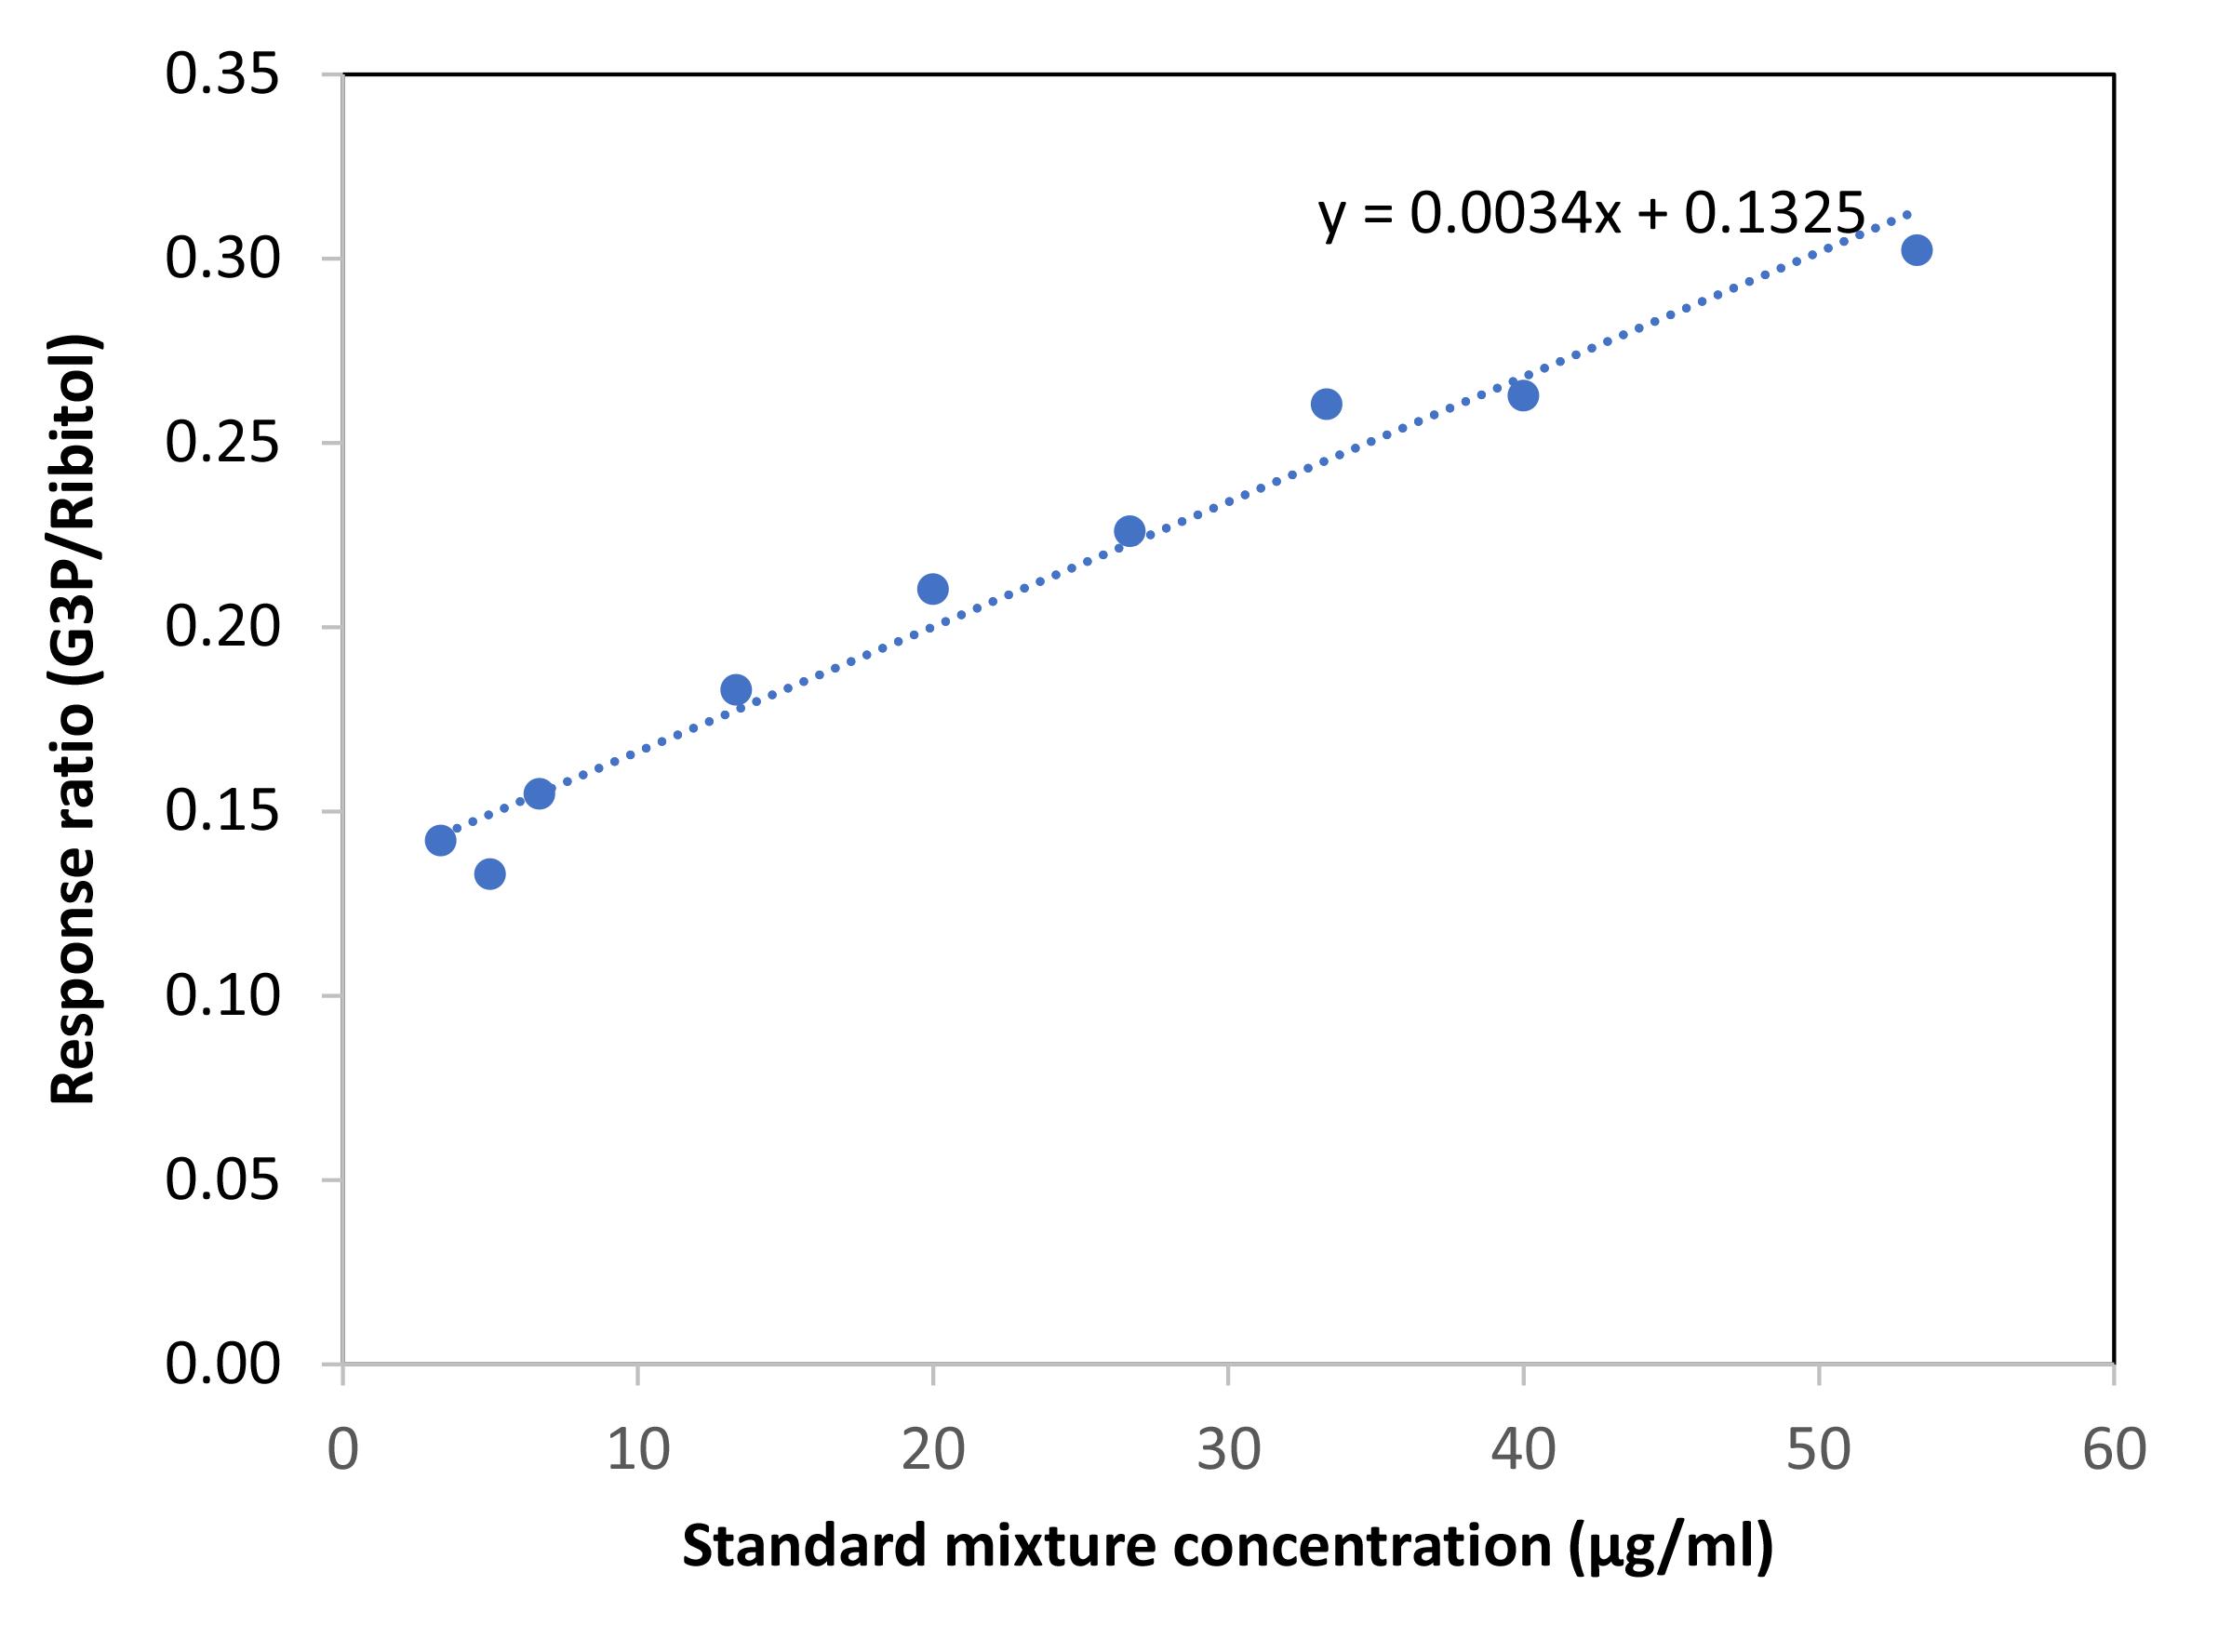
Figure 7. Standard curve showing response ratio of G3P vs. ribitol. Varying concentrations of G3P and ribitol (500, 750, 1,000, 2,000, 3,000, 4,000, 5,000, 6,000, and 8,000 ng) were analyzed in triplicates.Statistical analysis was performed using Student’s t-test. For pathogen assays, ~16 plants/genotype/treatment were analyzed in a single experiment. For metabolite quantification, ~12 plants/genotype/treatment were analyzed in each experiment. Experiments were repeated at least two/three times with a different set of plants. Unless otherwise mentioned, error bars indicate standard deviation.
This method reliably quantified G3P levels in 10–100 mg fresh weight of Arabidopsis tissue and the GC-MS instrument was able to detect 0.1 ng of G3P. Arabidopsis tissues analyzed with and without ribitol showed ~100% recovery of the internal standard. However, Arabidopsis tissue samples spiked with G3P gave variable results, possibly because exogenous G3P can potentially react with other extracted chemicals or enzymes.
Notes
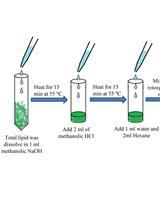
The protocol (Figure 8) shows excellent reproducibility and has been used to analyze extractions reported in our recent study (Shine et al., 2022).
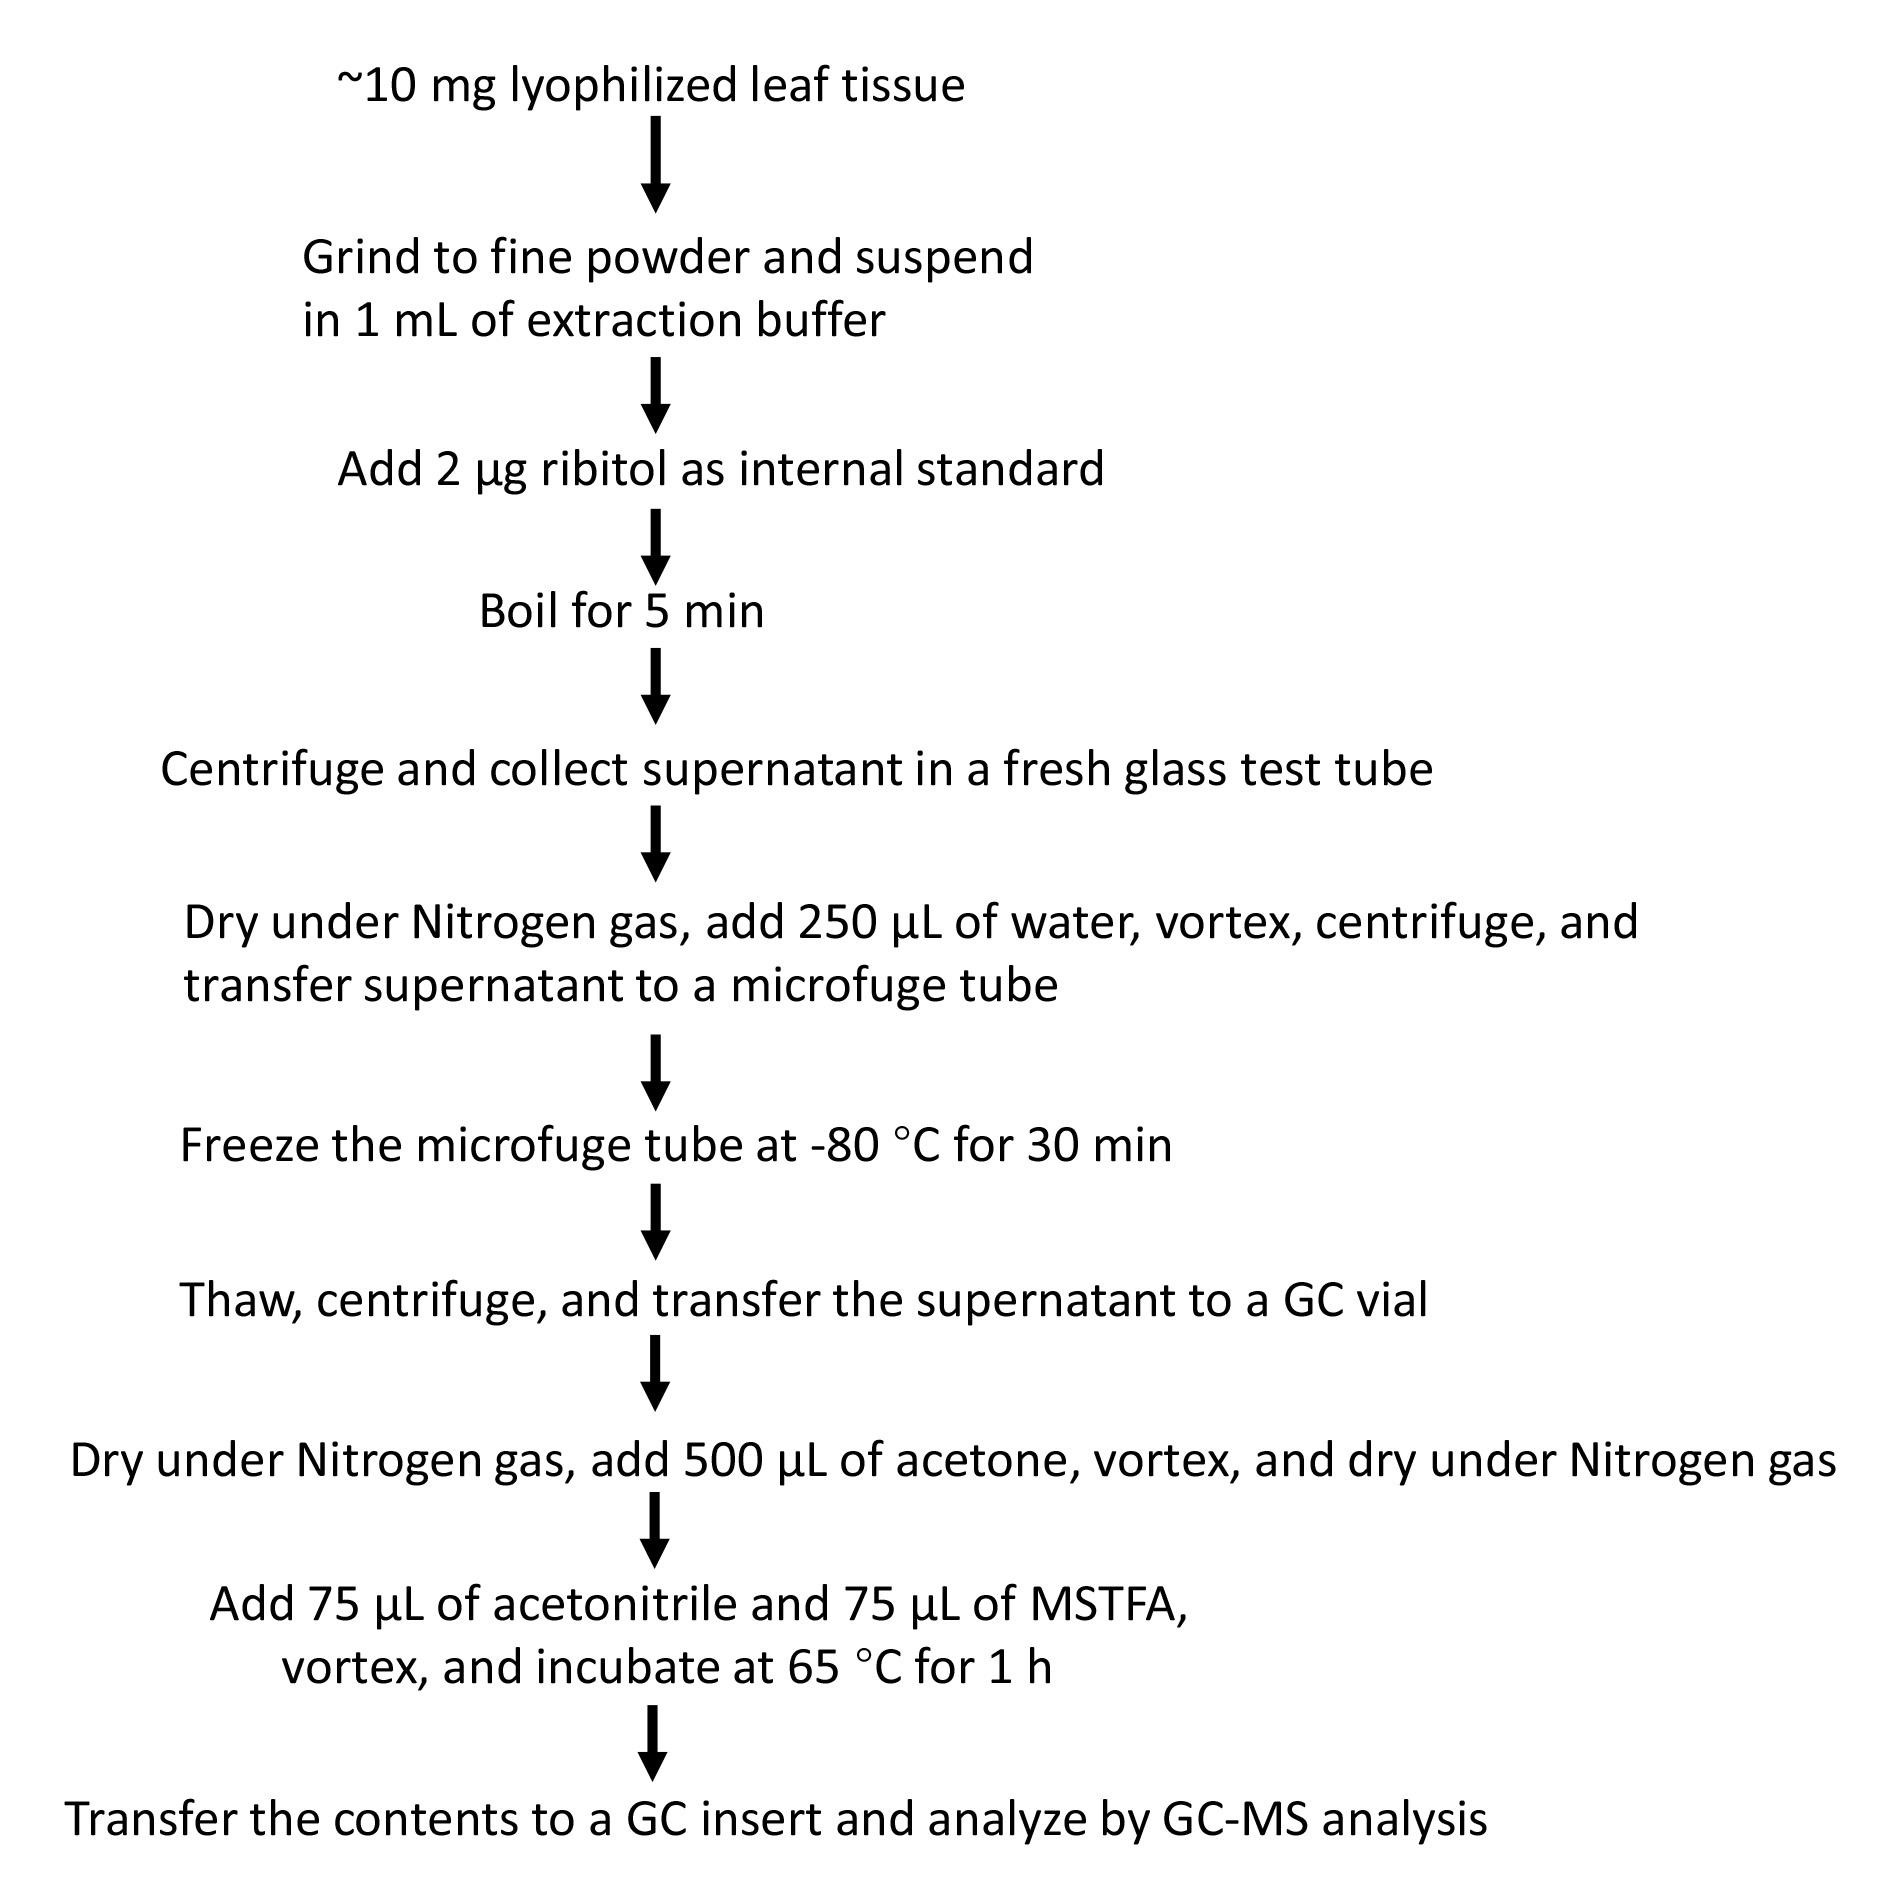
Figure 8. Simplified flowchart showing steps involved in extraction and analysis of GC-MS-based analysis of G3P
Recipes
10 mM magnesium chloride
Dissolve 20.33 g of magnesium chloride hexahydrate in Milli-Q water to a final volume of 100 mL to obtain 1 M MgCl2. Autoclave 1 M MgCl2 along with 1 L of Milli-Q water at 121 °C for 20 min using a liquid cycle. After the solutions cool down to room temperature, add 1 mL of the 1 M MgCl2 to 99 mL of the autoclaved Milli-Q water, and mix well to obtain 10 mM MgCl2.
Extraction buffer
80% ethanol, containing 1× phosphatase inhibitor.
Internal standard
100 ng/µL ribitol (wt/vol) in Milli-Q water.
Suspend 10 mg of ribitol in 1 mL of autoclaved Milli-Q water and vortex to dissolve. Dilute this stock 100-fold by taking 10 µL of the solution to another vial containing 990 µL of autoclaved Milli-Q water.
Phosphatase inhibitors
Prepare stock solutions as follows:
250 mM monosodium phosphate (25 mM)
Suspend 299.95 mg of monosodium phosphate in a total volume of 10 mL autoclaved Milli-Q water and autoclave the solution at 121 °C for 20 min using a liquid cycle.
100 mM sodium orthovanadate (1 mM)
Suspend 183.9 mg of sodium orthovanadate in a total volume of 10 mL autoclaved Milli-Q water and autoclave the solution at 121 °C for 20 min using a liquid cycle.
100 mM sodium pyrophosphate (10 mM)
Suspend 265.9 mg of sodium pyrophosphate in a total volume of 10 mL autoclaved Milli-Q water and autoclave the solution at 121 °C for 20 min using a liquid cycle.
Prepare 1× phosphatase inhibitor solution from the stock solutions by taking 1 mL of 250 mM NaH2PO4, 100 µL of 100 mM sodium orthovanadate, and 1 mL of 100 mM sodium pyrophosphate to a 15 mL sterile tube. To this, add 7.9 mL of autoclaved Milli-Q water to make up 10 mL of 1× phosphatase inhibitor.
Acknowledgments
This work was supported by grants from National Science Foundation (IOS#051909, IOS#2131400). We thank John Johnson for technical help. The authors would like to acknowledge Duncan et al. (1971) whose work was adapted in the present protocol. This protocol is derived from the original research paper (Shine et al., 2022; DOI: 10.1126/sciadv.abm8791).
Competing interests
The authors declare no conflict of interest.
References
- Chanda, B., Venugopal, S. C., Kulshrestha, S., Navarre, D. A., Downie, B., Vaillancourt, L., Kachroo, A. and Kachroo, P. (2008). Glycerol-3-phosphate levels are associated with basal resistance to the hemibiotrophic fungus Colletotrichum higginsianum in Arabidopsis. Plant Physiol 147(4): 2017-2029.
- Chanda, B., Xia, Y., Mandal, M. K., Yu, K., Sekine, K. T., Gao, Q. M., Selote, D., Hu, Y., Stromberg, A., Navarre, D., et al. (2011). Glycerol-3-phosphate is a critical mobile inducer of systemic immunity in plants. Nat Genet 43(5): 421-427.
- Duncan, J. H., Lennarz, W. J. and Fenselau, C. C. (1971). Mass spectral analysis glycerophospholipids. Biochemistry 10(6): 927-932.
- Gao, Q. M., Yu, K., Xia, Y., Shine, M. B., Wang, C., Navarre, D., Kachroo, A. and Kachroo, P. (2014). Mono- and digalactosyldiacylglycerol lipids function nonredundantly to regulate systemic acquired resistance in plants. Cell Rep 9(5): 1681-1691.
- Lim, G. H., Shine, M. B., de Lorenzo, L., Yu, K., Cui, W., Navarre, D., Hunt, A. G., Lee, J. Y., Kachroo, A. and Kachroo, P. (2016). Plasmodesmata Localizing Proteins Regulate Transport and Signaling during Systemic Acquired Immunity in Plants. Cell Host Microbe 19(4): 541-549.
- Lim, G. H., Singhal, R., Kachroo, A. and Kachroo, P. (2017). Fatty Acid- and Lipid-Mediated Signaling in Plant Defense. Annu Rev Phytopathol 55: 505-536.
- Mandal, M. K., Chanda, B., Xia, Y., Yu, K., Sekine, K. T., Gao, Q. M., Selote, D., Kachroo, A. and Kachroo, P. (2011). Glycerol-3-phosphate and systemic immunity. Plant Signal Behav 6(11): 1871-1874.
- Shen, W., Wei, Y., Dauk, M., Tan, Y., Taylor, D. C., Selvaraj, G. and Zou, J. (2006). Involvement of a glycerol-3-phosphate dehydrogenase in modulating the NADH/NAD+ ratio provides evidence of a mitochondrial glycerol-3-phosphate shuttle in Arabidopsis. Plant Cell 18(2): 422-441.
- Shen, W., Wei, Y., Dauk, M., Zheng, Z. and Zou, J. (2003). Identification of a mitochondrial glycerol-3-phosphate dehydrogenase from Arabidopsis thaliana: evidence for a mitochondrial glycerol-3-phosphate shuttle in plants. FEBS Lett 536(1-3): 92-96.
- Shine, M. B., Gao, Q. M., Chowda-Reddy, R. V., Singh, A. K., Kachroo, P. and Kachroo, A. (2019). Glycerol-3-phosphate mediates rhizobia-induced systemic signaling in soybean. Nat Commun 10(1): 5303.
- Shine, M. B., Zhang, K., Liu, H., Lim, G. H., Xia, F., Yu, K., Hunt, A. G., Kachroo, A. and Kachroo, P. (2022). Phased small RNA-mediated systemic signaling in plants. Sci Adv 8(25): eabm8791.
- Venugopal, S. C., Chanda, B., Vaillancourt, L., Kachroo, A. and Kachroo, P. (2009). The common metabolite glycerol-3-phosphate is a novel regulator of plant defense signaling. Plant Signal Behav 4(8): 746-749.
- Wang, C., El-Shetehy, M., Shine, M. B., Yu, K., Navarre, D., Wendehenne, D., Kachroo, A. and Kachroo, P. (2014). Free radicals mediate systemic acquired resistance. Cell Rep 7(2): 348-355.
- Wang, C., Liu, R., Lim, G. H., de Lorenzo, L., Yu, K., Zhang, K., Hunt, A. G., Kachroo, A. and Kachroo, P. (2018). Pipecolic acid confers systemic immunity by regulating free radicals. Sci Adv 4(5): eaar4509.
- Yang, Y., Zhao, J., Liu, P., Xing, H., Li, C., Wei, G. and Kang, Z. (2013). Glycerol-3-phosphate metabolism in wheat contributes to systemic acquired resistance against Puccinia striiformis f. sp. tritici. PLoS One 8(11): e81756.
- Yu, K., Soares, J.M., Mandal, M.K., Wang, C., Chanda, B., Gifford, A.N., Fowler, J.S., Navarre, D., Kachroo, A., and Kachroo, P. (2013). A feedback regulatory loop between G3P and lipid transfer proteins DIR1 and AZI1 mediates azelaic-acid-induced systemic immunity. Cell Rep 3(4): 1266-1278.
Article Information
Copyright
© 2023 The Author(s); This is an open access article under the CC BY-NC license (https://creativecommons.org/licenses/by-nc/4.0/).
How to cite
Readers should cite both the Bio-protocol article and the original research article where this protocol was used:
- Liu, H., Yu, K. and Kachroo, P. (2023). Rapid and Reliable Quantification of Glycerol-3-phosphate Using Gas Chromatography–coupled Mass Spectrometry. Bio-protocol 13(7): e4645. DOI: 10.21769/BioProtoc.4645.
- Shine, M. B., Zhang, K., Liu, H., Lim, G. H., Xia, F., Yu, K., Hunt, A. G., Kachroo, A. and Kachroo, P. (2022). Phased small RNA-mediated systemic signaling in plants. Sci Adv 8(25): eabm8791.
4(8): 746-749.
Category
Biochemistry > Lipid > Lipid measurement
Plant Science > Plant physiology
Do you have any questions about this protocol?
Post your question to gather feedback from the community. We will also invite the authors of this article to respond.