- Protocols

- Articles and Issues
- For Authors
- About
- Become a Reviewer

Evaluating Plant Drought Resistance with a Raspberry Pi and Time-lapse Photography

Published: Vol 13, Iss 2, Jan 20, 2023 DOI: 10.21769/BioProtoc.4593 Views: 2710
Reviewed by: Ansul LokdarshiRicardo Urquidi CamachoWan-Jun Zhang
Original research article
The authors used this protocol in:
Dec 2022
Advertisement


Protocol Collections
Comprehensive collections of detailed, peer-reviewed protocols focusing on specific topics


Related protocols

Abstract
Identifying genetic variations or treatments that confer greater resistance to drought is paramount to ensuring sustainable crop productivity. Accurate and reproducible measurement of drought stress symptoms can be achieved via automated, image-based phenotyping. Many phenotyping platforms are either cost-prohibitive, require specific technical expertise, or are simply more complex than necessary to effectively evaluate drought resistance. Certain mutations, allelic variations, or treatments result in plants that constitutively use less water. To accurately identify genetic differences or treatments that confer a drought phenotype, plants from all experimental groups must be subjected to equal levels of drought stress. This can be easily achieved by growing and imaging plants that are grown in the same pot. Here, we provide a detailed protocol to configure a Raspberry Pi computer and camera module to image seedlings of multiple genotypes growing in shared pots and to transfer images and metadata via the cloud for downstream analyses. Also detailed is a method to calculate percent soil water content of pots while being imaged to allow for comparison of stress symptoms with water availability. This protocol was recently used to uncouple differential water usage from drought resistance in a dwarf Arabidopsis thaliana mutant chiquita1-1/cost1compared to the wild-type control. It is cost effective, suitable for any plant species, customizable to various biological questions, and requires no prior experience with electronics or basic software programming.
Keywords: Drought resistanceBackground
Drought stress symptoms can be qualitatively and quantitatively measured via image-based phenotyping. Imaging plant growth and the visual onset of stress symptoms results in greater sensitivity and data availability than what can be achieved from visual observations or endpoint analysis alone (Mutka and Bart, 2014; Tovar et al., 2018). Many protocols to measure plant stress via image analysis involve either a high up-front cost, a large experimental workspace, or integration of and proficiency with complex analytical software (Shakoor et al., 2017; Tovar et al., 2018). In contrast to these approaches, we have developed a simple, modular, low-cost protocol using a Raspberry Pi–controlled camera (which together require approximately $40 USD) to correctly evaluate drought resistance. We define drought resistance as any combination of plant strategies to cope with insufficient water availability required for maximum plant growth and reproduction, namely drought tolerance, drought avoidance, and drought escape (Blum, 2011; Deikman et al., 2012; Lawlor, 2013). Common plant responses to low water availability include increased root growth or maintenance of cell turgor via increased osmolyte production. Imaging plants as described in this protocol cannot specifically differentiate between drought avoidance and tolerance strategies. When paired with additional assays, however, both drought tolerance and avoidance can be quantified, as we recently demonstrated (Ginzburg et al., 2022). Drought escape (via earlier flowering time in response to reduced soil water content) can readily be quantified via time course imaging. This protocol requires no previous knowledge of software programming and requires only a small amount of space (approximately 1.5 m3 needed for 16 pots with Arabidopsis seedlings; Figure 4). While this protocol is suitable for any plant species, larger species or sample sizes may require additional space.
Some reports of image-based drought phenotyping platforms do not involve growing different genotypes together in the same pot or correcting for differences in % soil water content (SWC) between genotypes that are grown in separate pots (Kim et al., 2020). Experiments conducted without these crucial controls can yield potentially misleading results due to genotype-specific differences in water-use requirements (Lawlor, 2013). To account for these differences when evaluating drought resistance, soil water content for each genotype needs to be kept uniform throughout the drought treatment for all genotypes. This can be easily achieved, for example, by growing plants together in the same pot (Ginzburg et al., 2022), or, if in separate pots, by using soil moisture probes (Miralles-Crespo and van Iersel, 2011) or gravimetrically (Granier et al., 2006; de Ollas et al., 2019).
The persistence of reports that equate delayed onset of stress symptoms with drought resistance goes against established knowledge and slows progress in identifying true drought phenotypes (Lawlor, 2013). The protocol described here was recently used to differentiate between drought resistance and prolonged survival due to lower water usage in a dwarf Arabidopsis thaliana mutant chiquita1-1/cost1 (Ginzburg et al., 2022). Because plant responses to drought can vary depending on plant species, developmental stage, and degree of stress, there is no single set of measurements that can capture a drought phenotype in its entirety. Therefore, this protocol does not prescribe or outline in detail any specific measurements of plant stress. Rather, it provides readers with a foundation to properly set up a comparative drought experiment and capture images throughout the experiment to use for whichever downstream analyses are most appropriate to the experimental design and biological question(s). The straightforward methodology outlined here will be a valuable resource to the plant science community at large, not only for studying plant responses to drought but for any research requiring accurate visual comparisons of plant growth and development.
Equipment
Raspberry Pi–related equipment
Raspberry Pi (model 3 or newer)
Micro SD card (should have 6 GB or more of storage)
Micro USB power cable
Camera module: Minimum specifications (i.e., lens resolution, pixels, frame rate, etc.) will vary based on the distance between the lens and samples, sample size, and external light source provided. An Arducam M12 lens (model B0031; 5 MP 2,592 × 1,944 resolution, 4 mm focal length) was used in this protocol to image Arabidopsis seedlings from approximately 75 cm above the pots.
Camera cable
Note: If using a Raspberry Pi Zero W, you will need a smaller cable connection to insert into the Raspberry Pi.
Monitor with HDMI port
HDMI cable
Note: If using a Raspberry Pi Zero W, you will need a mini-HDMI to HDMI cable.
Keyboard and mouse
Mounting-related equipment
Adhesive or
Bungee cables or
Mounting stand (see Tovar et al., 2018)
Optional
Case for Raspberry Pi and camera module
Plant growth–related equipment
Pots: Appropriate size depends on species and number of plants grown in each pot. For growing two Arabidopsis seedlings together in a single pot, it is recommended to use square pots of at least 40 cm 2.
Soil: Any horticultural or potting soil/mix is suitable. PRO-MIX HP Mycorrhizae potting soil (Premier Tech Horticulture, Quakertown, PA) is suitable for a wide range of species. Additional amendments may be added based on species-specific requirements.
Scale: For small plants grown in small pots, such as Arabidopsis , use a scale sensitive to 0.1 g. A scale sensitive to 1.0 g is suitable for larger plants and bigger pots.
Plastic cover
Oven: It should be capable of reaching 45°C.
Adhesive: It should be strong enough to support the weight of the Raspberry Pi, lens, and power cable (approximately 20 g).
Procedure
Initial Raspberry Pi configuration
Note: This protocol requires the Raspberry Pi to be connected to the internet. All third-generation models or newer with built-in Wi-Fi capabilities (which excludes the Raspberry Pi Zero and Pico) are recommended.
Whichever model of Raspberry Pi used will need a Micro SD card with Raspberry Pi OS (Raspbian) installed. Micro SD cards can be purchased either with Raspbian preinstalled or the latest version of Raspbian can be installed from https://www.raspberrypi.org/downloads/raspbian/. Ensure you use a Micro SD card with at least 6 GB of storage to allow for temporary image storage on the Micro SD before being transferred to cloud storage.
Insert the Micro SD card with Raspbian installed into the Raspberry Pi. Connect the monitor, keyboard, and mouse into the Raspberry Pi and then insert the power cable.
Note that once the Micro SD card is inserted into the Pi, all scripts outlined in this protocol will be written to and saved onto the Micro SD card itself. No additional steps other than those outlined below will be required to perform the protocol.
If starting your Pi for the first time, the Welcome to Raspberry Pi application will pop up and guide you through initial configuration, including setting a username and password, time zone, and connecting to Wi-Fi.
Step-by-step instructions can also be found at https://projects.raspberrypi.org/en/projects/raspberry-pi-getting-started/1.
Once initial setup is complete, click on the raspberry icon on the top left of the desktop and navigate to Preferences > Raspberry Pi Configuration. This can also be achieved by typing “sudo raspi-config” in the terminal window, which can be opened by clicking on the black monitor icon on the toolbar, located at the top of the desktop.
In the interfaces tab, set camera and secure shell (SSH) to “enabled.” These configurations will allow you to take images and communicate with the Pi without connecting it to a monitor.
In order to communicate with the Pi remotely via SSH, you will need to first get your Pi’s IP address.
In the terminal window, type “hostname -I.”
Also write down the MAC address in case your IP address is set to change and you want to confirm a given device is yours using a network scanner [i.e., Fing (https://www.fing.com/), available for Android and iOS].
Type “ifconfig” in the terminal window. In the outputted text, the MAC address is the 12-digit hexadecimal number immediately after “ether.”
You can connect to your Pi via SSH directly from the terminal window of your computer (running Linux, Mac OS, or Windows 10 or later).
Type “ssh pi@<IP>” replacing “IP” with your Pi’s IP address.
Alternatively, you can use a free SSH client such as Termius (https://www.termius.com/), which is compatible with Linux, Mac OS, and Windows operating systems.
Configuring remote data transfer
Note: Before configuring the camera, it will be helpful to first configure how to transfer images from the Raspberry Pi to a cloud-based server or a local computer where images can be more easily analyzed than on the Pi itself. While there are many methods for remote data transfer, this protocol describes the configuration of rclone (https://rclone.org/), an open-source software designed for managing content on common cloud-based platforms.
Open a terminal window either by clicking on the terminal icon at the top of the screen (if using an external monitor) or by typing Ctrl + Alt + T.
Run the following command in the opened terminal window to download and install the latest, stable release of rclone:
wget https://downloads.rclone.org/rclone-current-linux-arm.zip
After successful installation, run the following configuration command:
rclone config
Create a new remote connection by typing “n” and then pressing Enter.
Enter a name for your new remote connection, e.g., “RPi_Drive.”
You will now see a list of various backend storage systems to connect to. Subsequent steps after choosing a specific storage system, e.g., Google Drive, will vary widely depending on the storage system chosen. Refer to https://rclone.org/overview/ for the various storage systems supported and corresponding documentation for how to configure each one.
Mounting the Raspberry Pi and camera
Note: Given the specific lighting and spacing requirements in the location where the experiment will be performed, it is recommended to first find a suitable location for the drought experiment and only then to configure the camera in that space.
The available space above or adjacent to your plants where a camera can be mounted may vary across growth chambers or plant species. It is therefore recommended to use a Raspberry Pi–compatible lens with modular focusing capabilities. There are many Raspberry Pi–compatible options developed by Arducam (https://www.arducam.com/), which yield publication-quality images. Also, be sure to pick a location with uninterrupted access to a power outlet, as the Raspberry Pi will need to be powered continuously for the duration of the experiment. If planning to conduct experiments at high relative humidity (>70% relative humidity; Comizzoli et al., 1986), we recommend using a fan, protective case, or desiccant to avoid damaging the Raspberry Pi and camera components. Relative humidity values below 70% (40% was used in this protocol) should not cause any technical issues with the Raspberry Pi and camera components.
When a suitable location has been identified, ensure your Raspberry Pi is powered off before connecting the camera module to the Raspberry Pi.
Notes:
Be very careful when inserting the camera cable into Raspberry Pi as the plastic clamp necessary for establishing and maintaining a connection is fragile and can easily bend or crack.
Raspberry Pi Zero W has a smaller camera module port and thus needs a correspondingly smaller ribbon cable for connecting the camera to the Pi.
The Raspberry Pi and camera module can be physically mounted or suspended above or adjacent to the experimental growth space in several manners. Regardless of the approach used, the camera should be free of physical disturbance (including vibrations) and far enough away from the pots to allow the user to comfortably pick up and weigh pots throughout the experiment. See Tovar et al. (2018) for additional information.
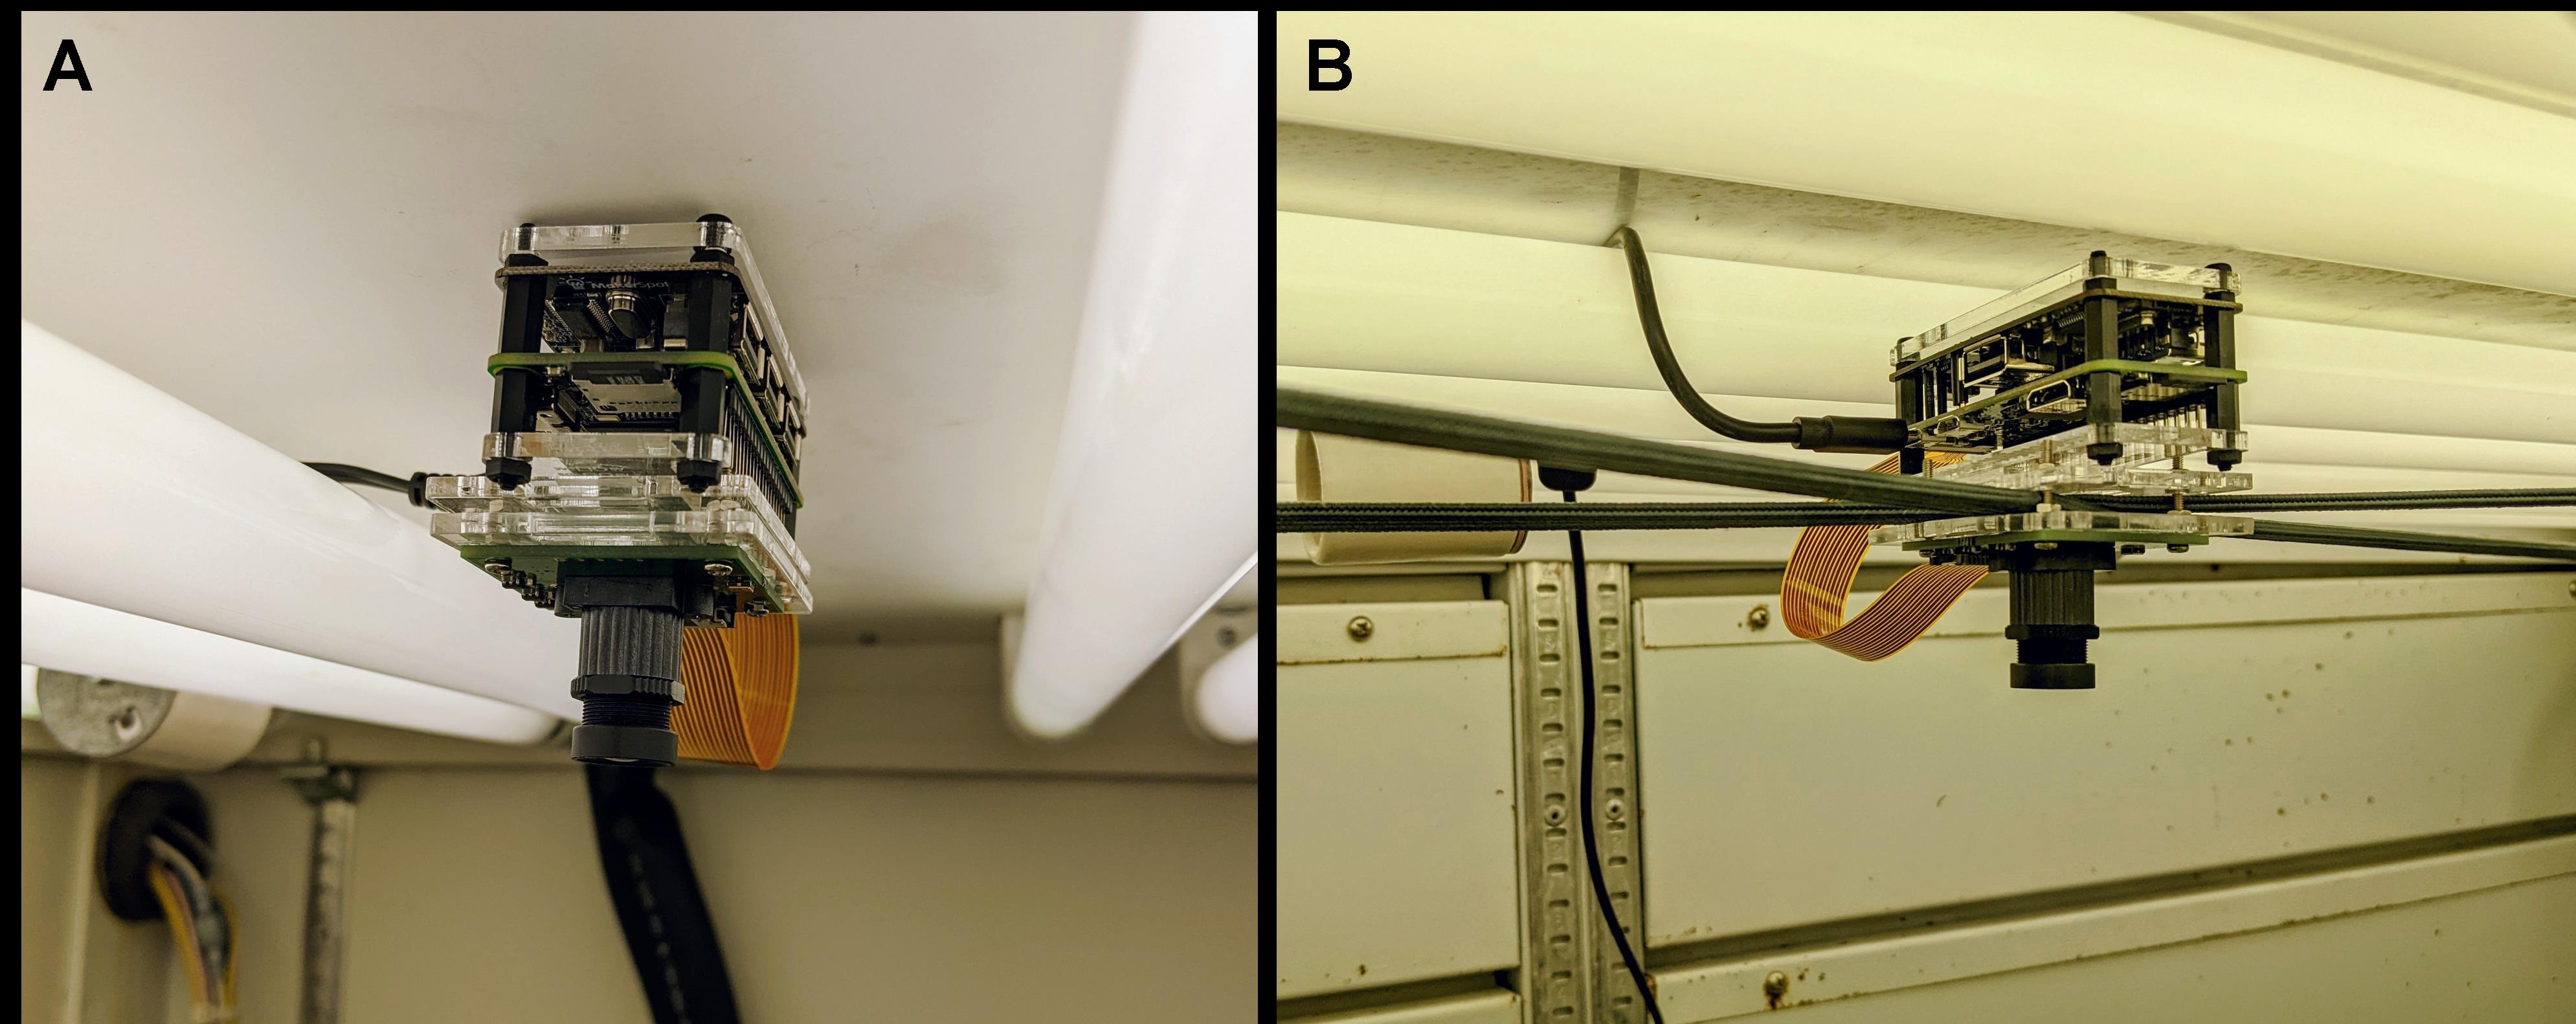
Figure 1. Methods of mounting Raspberry Pi and camera module inside the growth chamber. (A) Pi and camera are affixed to the roof of the growth cabinet with adhesive. (B) Pi and camera are suspended from bungee cords to minimize vibrations within the growth cabinet. In both images, the camera module and Pi are encased in protective cases.Configuring image capture
While connected to your Pi via SSH, make a folder for your images on the Pi’s desktop.
From the terminal window, type “mkdir /home/pi/Desktop/Images”.
The camera module can be controlled either from the command line (in a terminal window) or via Python scripts. This protocol recommends using the pre-installed Python picamera library due to its rich functionality and ease of configuration.
From the terminal window, enter “nano [filename].py” replacing [filename] with a file name of your choice.
The following scripts, which are written in the opened [filename].py file, include commands for capturing and saving images with the current time to a destination of your choice. Adding a timestamp to your images will provide valuable metadata to correlate images with time of day and duration of drought. A predictable file-naming scheme will also allow you to check if all images were captured and transferred as desired.
from picamera import PiCamera
from time import sleep
camera = PiCamera()
import datetime
time = datetime.datetime.now().strftime("%Y-%m-%d-%H:%M")
#adjust image resolution
camera.resolution = (1950, 1900)
camera.start_preview()
sleep(5)
camera.capture(r'/home/pi/Desktop/Images/image-' + time + '.jpg')
camera.stop_preview()
To save and exit, press Ctrl + X. Then, when prompted if you want to save your changes, press “Y”. Alternatively, you can save your changes by first pressing Ctrl + O and then clicking Enter, then pressing Ctrl + X.
Place some pots, which will be used for the growth experiment, into the area where plants will be grown, and capture an image by typing “python [filename].py”.
Images can be viewed by sending them remotely to your designated and previously configured storage system. While they can also be viewed by connecting your Pi to a monitor, a remote transfer system enables faster positioning of your camera.
Return to the Desktop by typing “cd /home/pi/Desktop”.
Create a new file on your Pi’s desktop, which will trigger remote image transfer.
nano sync.sh
Inside the newly created “sync.sh” file, invoke the rclone sync function to send images from the images folder to a folder in your online storage solution. The following code uses a Google Drive folder named “Raspberry_Pi_images” as an example:
rclone sync -v /home/pi/Desktop/Images gdrive:Rapsberry_Pi_images
Save your changes by pressing Ctrl + O and then clicking Enter, then pressing Ctrl + X.
From the Desktop, run the script to transfer images
./sync.sh
After viewing your captured image(s), you can manually adjust the focus of the camera lens and add modifications to your image-capturing script (resolution, angle, frame rate, color correction, etc.) based on the needs of your experiment and physical constraints of your working environment.
Note: 300 pixels per inch (ppi) is frequently suggested as the minimum resolution for high-quality color images in scientific publications. PPI is based on both image resolution per dimension (pixels by width and height) and by image size, whereby larger images require a higher resolution to maintain a given PPI. The Arducam M12 lens (model B0031), for example, has a maximum resolution of 2,592 × 1,944 pixels. Using this resolution, any image with a diagonal length less than 27.4 cm would have a PPI greater than or equal to 300 ppi. The width of a single-column in most academic journals is 8.6 cm, meaning that even much smaller resolutions than are possible with the Arducam M12 (model B0031) would be sufficient to ensure publication-quality images.
Modifications to how your image looks can be added to the Python script by once again entering “nano [filename].py” in the terminal window and entering additional lines of code as desired. Some useful image modifications can be found at https://projects.raspberrypi.org/en/projects/getting-started-with-picamera/.
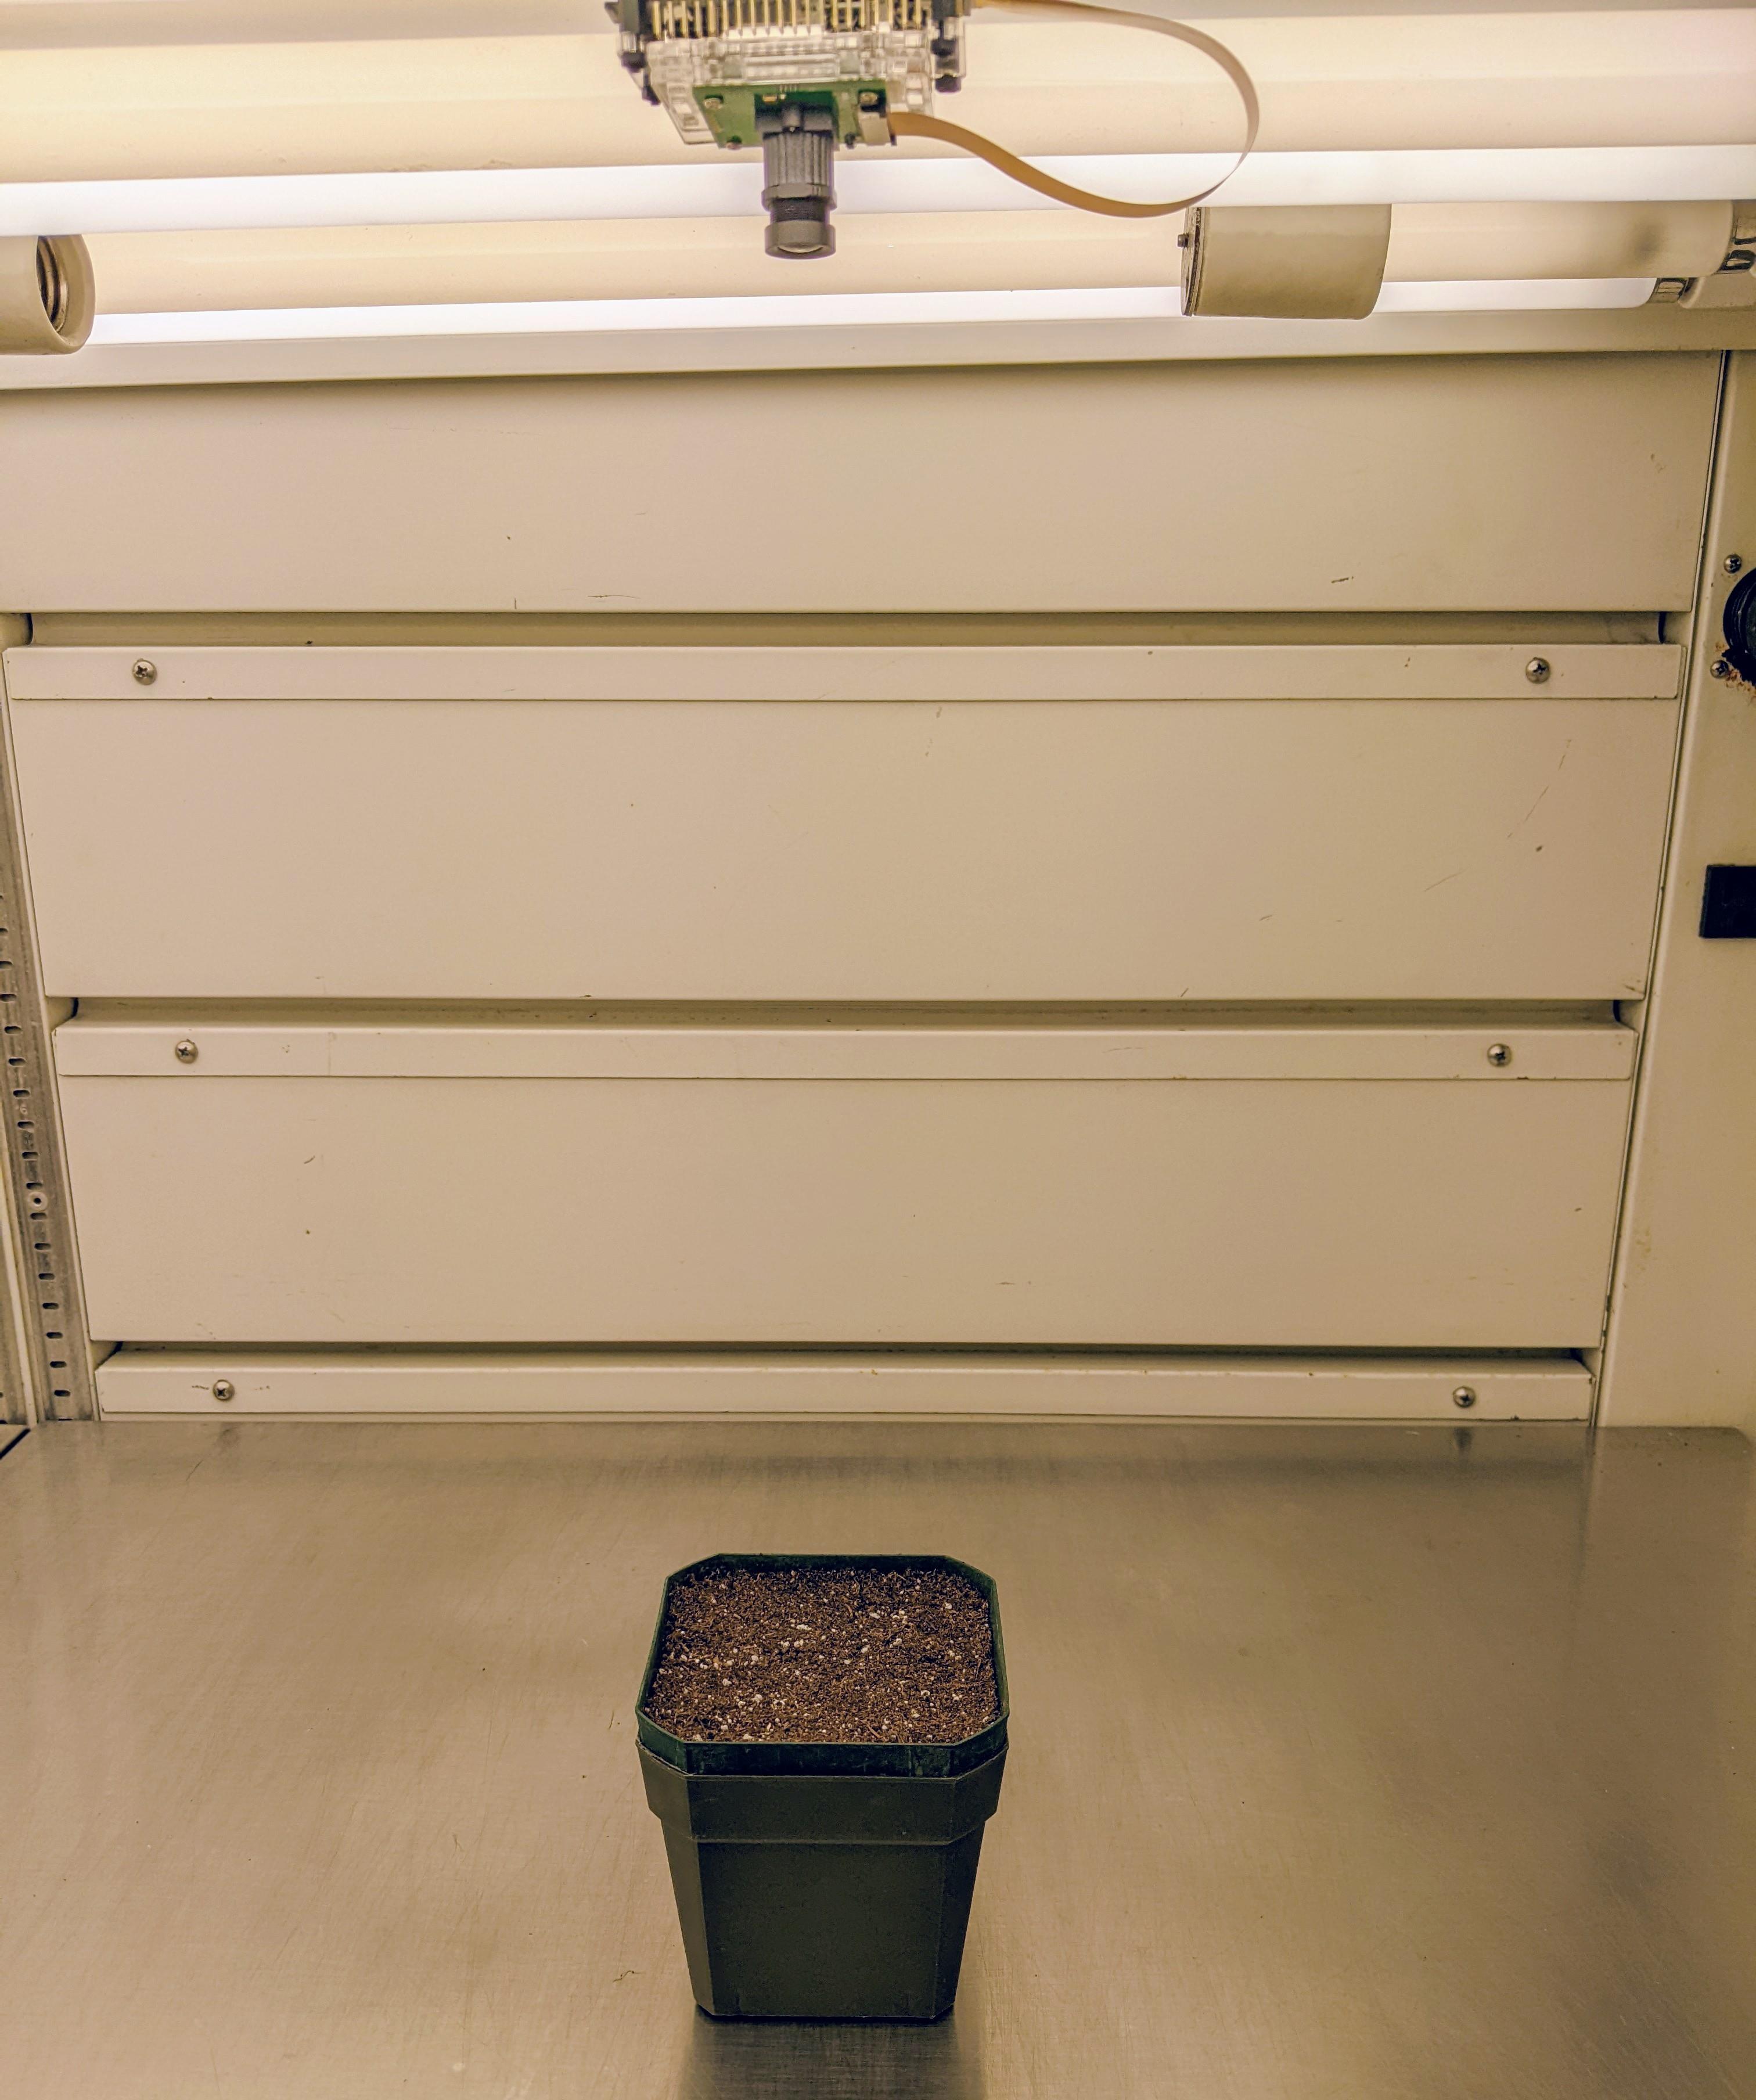
Figure 2. Setting up camera location within the growth cabinet and placing a representative pot below for image optimizationNote that image focusing and optimization should be done with a soil-filled pot placed within an empty pot to ensure the correct distance between lens and soil for optimizing image focus. As will be described in the next section, the two-pot system allows rotating pots for reducing the effect of micro environmental variations while ensuring that the pot positions stay the same for imaging.
When satisfied with how your images look, you can now schedule automated image capture and upload to the cloud.
Using the job scheduler crontab (https://crontab.guru/), first open the editing table of jobs:
crontab -e
Write scripts (“cron jobs”) for both automated image capturing and uploading images to the cloud. You can test out how to code your desired schedule at https://crontab.guru/. Examples for both jobs are provided below.
#run the python image-capture script every 15 minutes
15 * * * * python /home/pi/Desktop/Take_photo_with_timestamp.py
#run the sync.sh program every 2 hours at minute 30 minutes past the hour
30 0-23/2 * * * /home/pi/Desktop/sync.sh
Save your changes by pressing Ctrl + O and then clicking Enter, then pressing Ctrl + X.
These settings can be viewed by entering “crontab -I” and can be modified again by entering “crontab -e”.
Determining of soil characteristics
Weigh 8–10 empty pots to determine the average weight of an empty pot. Fill each pot with a fixed amount of fresh soil by weight. To determine the average amount of water held within fresh soil, by weight, dry 8–10 soil samples in an oven set to at least 45°C. Measure pot and soil weights daily until there is no change in sample weight (approximately 2–3 days). Record final pot and dried soil weights.
Dry soil weight (DSW) = [(Pot + dried soil) – empty pot]
DSW % = DSW/[(Pot + fresh soil) – empty pot].
Slowly add water to the above-mentioned pots with dried soil. Stop adding water once water starts dripping from the bottom. Put a cover over the pots to reduce evaporation. When dripping from the bottom has ceased, pots have reached pot capacity (PC; 100% SWC). Weigh each pot to determine weight at PC.
Water weight at PC = [(Pot + soil at PC) – empty pot – DSW]
Soil pot capacity (SPC; g water/g dry soil) = (Total weight at PC – DSW – pot)/(DSW)
Setting up pots and conducting a drought experiment
While comparisons of drought resistance are only made between seedlings grown in the same pot, all seedlings should be maintained uniformly to reduce variation across replicates.
With tape or some other adhesive, affix an equal number of empty pots as experimental pots to the shelf or table where plants will be grown and images captured.
Arrange these empty pots in an area that can be fully captured by your camera. Some modifications to camera and pot placement may be required to optimize the number of samples that can be captured by the camera.
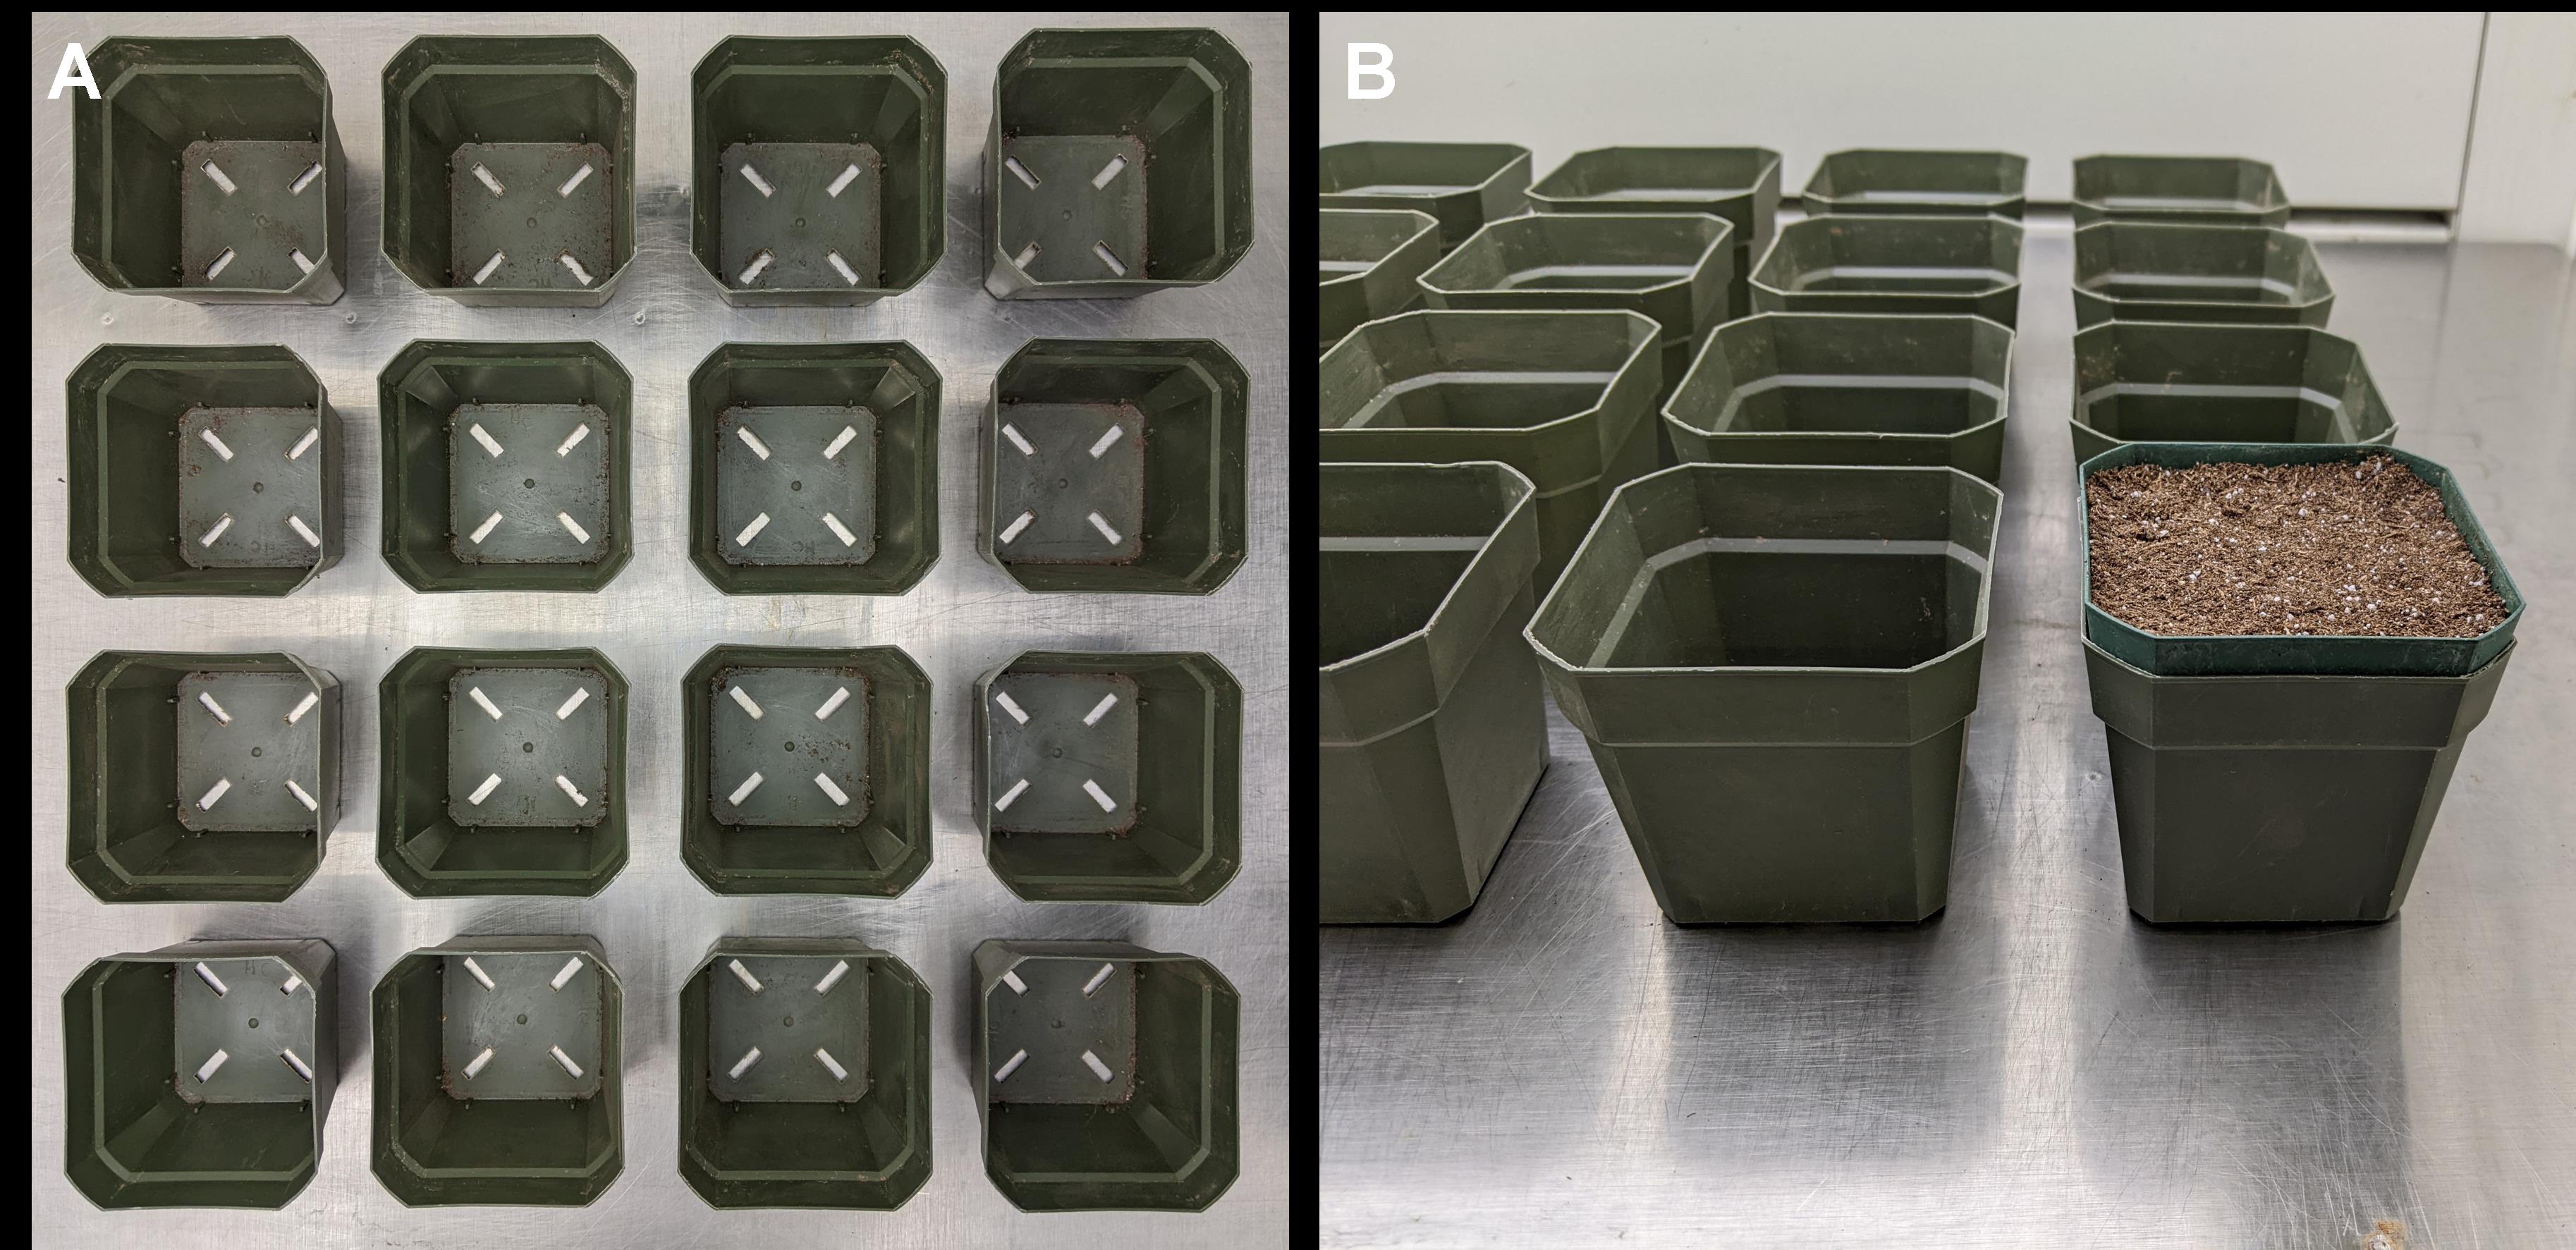
Figure 3. Arranging empty pots into imaging space. (A) Affixed pots are evenly spaced out and fill up the entirety of the viewable space of the camera. (B) Representative image of a soil-filled experimental pot sitting within an affixed empty pot.Fill new pots with equal amounts of fresh soil by weight.
Plant seeds at designated locations in each pot (i.e., top/bottom, right/left) to eliminate any potential differences in micro-environment during image capture period.
Seeds should be planted such that each pot contains one wild-type (control) seedling and one seedling from at least one mutant.
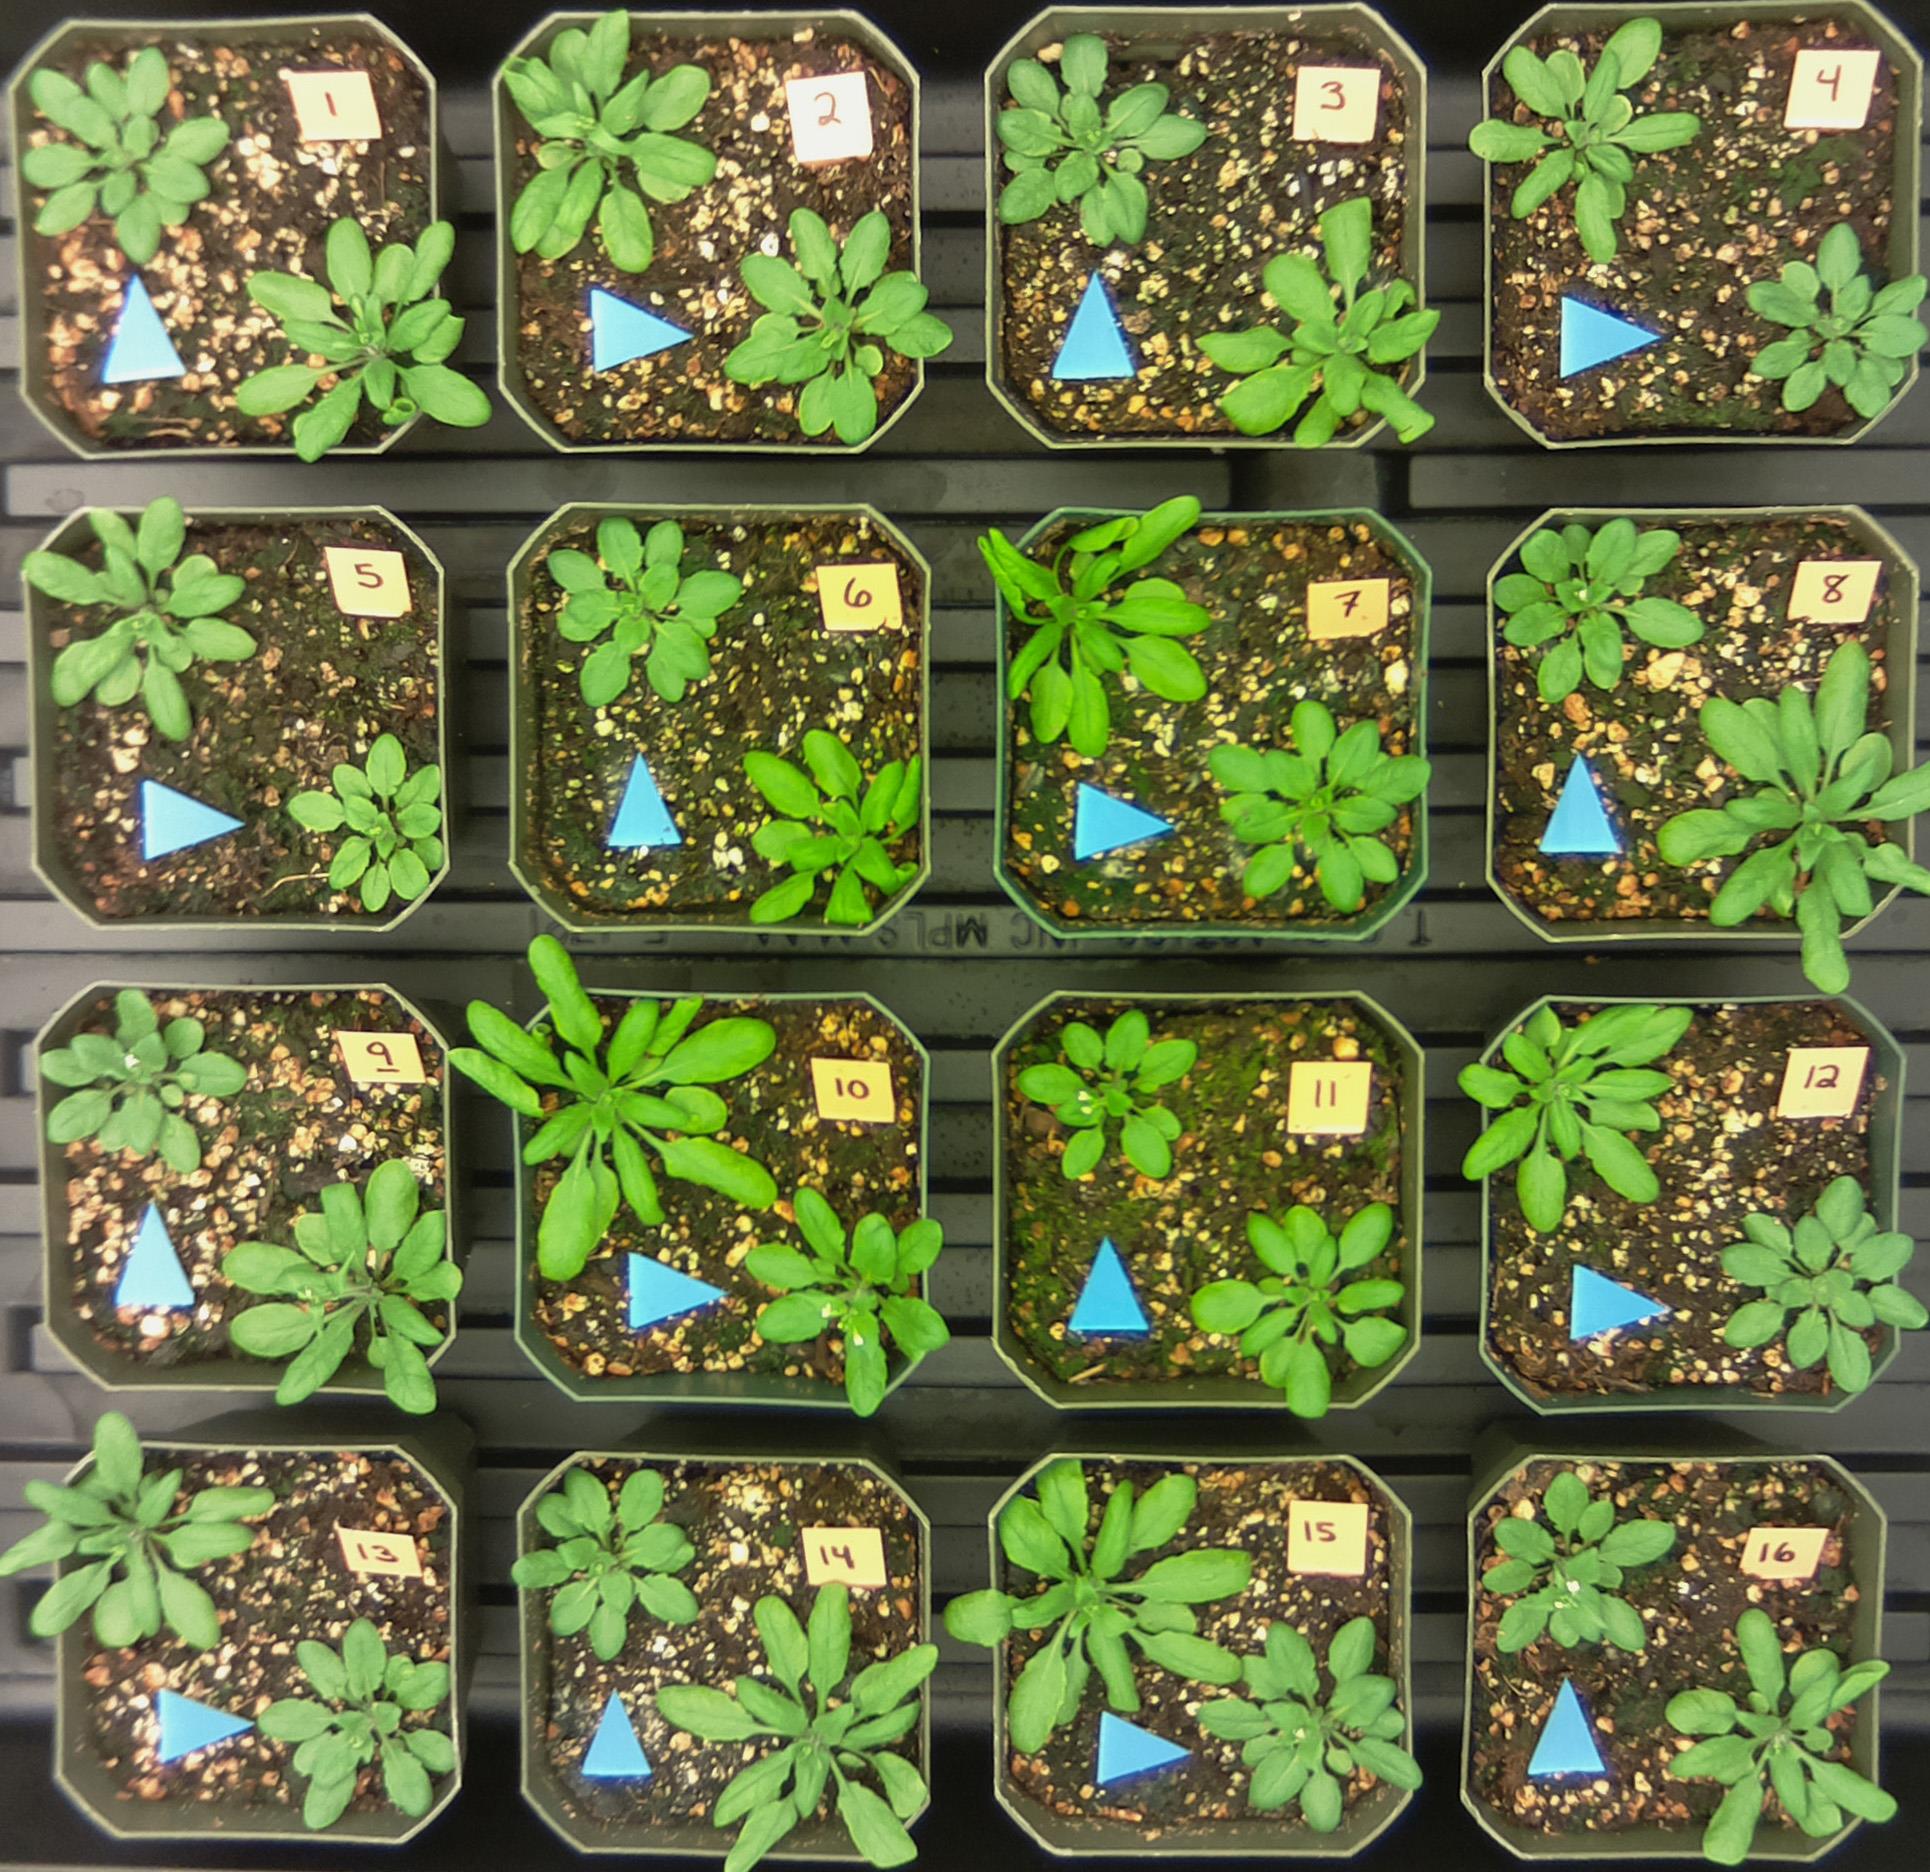
Figure 4. Planting evenly spaced seeds such that each pot contains one wild-type and at least one mutant seedling. Pots also contain numbers and arrows to indicate sample number and the mutant seedling, respectively. Image was taken approximately 75 cm above pots (40 cm2) using a 5 megapixel Arducam M12 lens (model B0031) at resolution of 1,950 × 1,900 (W × H). Approximate dimensions of growth cabinet space used: 63.5 cm × 63.5 cm × 75 cm (L × W × H).Place seeded pots into the pre-arranged empty pots.
Weigh and add water to pots daily to maintain SWC at a designated well-watered state (i.e., 70% SWC).
Well-watered weight (70% SWC) = [(Fresh soil weight × DSW% × SPC × 0.7) + (Fresh soil weight × DSW%) + empty pot]
Note: Weigh pots when you know images are not being captured to ensure an uninterrupted progression of images throughout the experiment.
When seedlings have reached a predetermined age, size, or developmental stage, water one last time up to the well-watered state, and then stop watering, as an example of a drought experiment.
Note: This is only one type of drought experiment. Another type of drought experiment is to maintain soil water content at specific levels. Also, this protocol can be used for experiments other than drought treatment, such as exposure to high or low temperatures, salinity stress, etc.If images were not yet being captured, start automated image capture as described above.
On a regular basis (i.e., daily), gently lift up and remove experimental pots from empty pots and weigh them to determine SWC. Return each experimental pot to the same empty pot.
If interested in evaluating recovery from drought, saturate pots at a predetermined time, age, or degree of stress and then return them to the same empty pot for continued imaging.
Combining images into a timelapse video
Combining images into a video file format is not necessary to evaluate changes in plant growth throughout the course of an experiment. Depending on the desired analyses, inspection of individual images may be more helpful than a video of multiple images. However, viewing the progression of the entire experiment in a video format may aid users in more easily identifying overall trends in plant growth. A sample protocol for creating a timelapse video from individual images is therefore provided below. While many software programs can be used for this purpose, the following example makes use of the free video editing software Davinci Resolve (https://www.blackmagicdesign.com/products/davinciresolve/).
Import images by clicking on File > Import > Media and select the folder containing your images.
Make sure they are arranged by date and time to ensure a chronological order.
With all images selected, right-click and select “Create New Timeline Using Selected Clips…”
Images will now appear arranged from left to right on the bottom of the window. Without any additional modifications, a video progression can now be played using the Play button in the middle of the window.
To modify the length of the video, select all images from the timeline at the bottom of the window. Right-click and select “Change Clip Duration”. The length of the video, or even parts of it based on the selected frames, can be modified by either changing the value in the “Time” or “Frames” tab.
When satisfied with the duration of the video, click on the “Deliver” tab at the very bottom of the window. Here, users can select the file type, resolution, frame rate, and quality of the video to be generated, in addition to more advanced features.
Once all settings have been selected and a name and destination for the file have been set, click “Add to Render Queue”. A new job will appear in the top right side of the window. Click “Render All”.
Additional video editing features can be found at https://www.blackmagicdesign.com/products/davinciresolve/training.
Data analysis
Captured images provide the basis for all downstream analyses. Images or timelapse videos alone can be used to qualitatively evaluate relative drought resistance across genotypes, as was done previously (Ginzburg et al., 2022). Specific metrics to quantify plant growth and stress will vary by plant species, developmental stage, degree of stress, and by the biological question(s) of interest. No additional software is required for performing basic analysis of plant growth and stress symptoms, as images alone can be used to visually score stress symptoms (Diaz et al., 2006;Sarkar et al., 2021). Images can also be uploaded to image analysis software, such as ImageJ (Schneider et al., 2012) or PlantCV (Fahlgren et al., 2015), for additional analyses, such as quantifying vegetative area, relative area of stressed/diseased tissue to green tissue, etc. Utilizing the timestamps of captured images also allows for easy comparison of key developmental stage transitions, such as flowering time.
This protocol also allows users to perform additional, non-destructive measurements on plants throughout the experiment to complement image capture. For example, chlorophyll fluorescence was measured on droughted seedlings grown and imaged using this protocol (Ginzburg et al., 2022) to compare drought tolerance between mutant and wild-type seedlings.
Daily SWC levels can be correlated with chosen metrics of plant growth and stress onset to understand the relationship between soil water availability and stress symptoms. If evaluating the stress resistance of multiple mutant lines, SWC levels can also be used to determine relative water requirements of each genotype, as demonstrated in Ginzburg et al. (2022).
Acknowledgments
We thank A. Malkovskiy for helpful advice on imaging, G. Materassi-Shultz for plant growth facility support, and the Rhee lab for helpful discussions. This work was done on the ancestral land of the Muwekma Ohlone Tribe, which was and continues to be of great importance to the Ohlone people.
Funding:
This work was supported in part by Carnegie Institution for Science Endowment and grants from the National Science Foundation (IOS-1546838, IOS-1026003) and the U.S. Department of Energy, Office of Science, Office of Biological and Environmental Research, Genomic Science Program grant nos. DE-SC0018277, DE-SC0008769, DE-SC0020366, and DE-SC0021286.
Competing interests
Authors declare no conflict of interest.
References
- Blum, A. (2011). Drought Resistance and Its Improvement. Blum, A. (Ed.) Plant Breeding for Water-Limited Environments. Springer New York, 53-152.
- Comizzoli, R. B., Frankenthal, R. P., Milner, P. C., and Sinclair, J. D. (1986). Corrosion of electronic materials and devices. Science 234(4774): 340-345.
- de Ollas, C., Segarra-Medina, C., Gonzalez-Guzman, M., Puertolas, J. and Gomez-Cadenas, A. (2019). A customizable method to characterize Arabidopsis thaliana transpiration under drought conditions. Plant Methods 15: 89.
- Deikman, J., Petracek, M. and Heard, J. E. (2012). Drought tolerance through biotechnology: improving translation from the laboratory to farmers' fields. Curr Opin Biotechnol 23(2): 243-250.
- Diaz, C., Saliba-Colombani, V., Loudet, O., Belluomo, P., Moreau, L., Daniel-Vedele, F., Morot-Gaudry, J. F. and Masclaux-Daubresse, C. (2006). Leaf yellowing and anthocyanin accumulation are two genetically independent strategies in response to nitrogen limitation in Arabidopsis thaliana. Plant Cell Physiol 47(1): 74-83.
- Fahlgren, N., Feldman, M., Gehan, M. A., Wilson, M. S., Shyu, C., Bryant, D. W., Hill, S. T., McEntee, C. J., Warnasooriya, S. N., Kumar, I., et al. (2015). A Versatile Phenotyping System and Analytics Platform Reveals Diverse Temporal Responses to Water Availability in Setaria. Mol Plant 8(10): 1520-1535.
- Diaz, C., Saliba-Colombani, V., Loudet, O., Belluomo, P., Moreau, L., Daniel-Vedele, F., Morot-Gaudry, J. F. and Masclaux-Daubresse, C. (2006). Leaf yellowing and anthocyanin accumulation are two genetically independent strategies in response to nitrogen limitation in Arabidopsis thaliana. Plant Cell Physiol 47(1): 74-83.
- Ginzburg, D.N., Bossi, F., and Rhee, S.Y. (2022). Uncoupling differential water usage from drought resistance in a dwarf Arabidopsis mutant. Plant Physiol 190(4): 2115-2121.
- Granier, C., Aguirrezabal, L., Chenu, K., Cookson, S. J., Dauzat, M., Hamard, P., Thioux, J. J., Rolland, G., Bouchier-Combaud, S., Lebaudy, A., et al. (2006). PHENOPSIS, an automated platform for reproducible phenotyping of plant responses to soil water deficit in Arabidopsis thaliana permitted the identification of an accession with low sensitivity to soil water deficit. New Phytol 169(3): 623-635.
- Kim, S. L., Kim, N., Lee, H., Lee, E., Cheon, K.-S., Kim, M., Baek, J., Choi, I., Ji, H., Yoon, I. S., et al. (2020). High-throughput phenotyping platform for analyzing drought tolerance in rice. Planta 252(3): 38.
- Lawlor, D. W. (2013). Genetic engineering to improve plant performance under drought: physiological evaluation of achievements, limitations, and possibilities. J Exp Bot 64(1): 83-108.
- Miralles-Crespo, J., and van Iersel, M.W. (2011). A Calibrated Time Domain Transmissometry Soil Moisture Sensor Can Be Used for Precise Automated Irrigation of Container-grown Plants.HortScience 46: 889-894.
- Mutka, A. M. and Bart, R. S. (2014). Image-based phenotyping of plant disease symptoms. Front Plant Sci 5: 734.
- Sarkar, S., Ramsey, A. F., Cazenave, A. B. and Balota, M. (2021). Peanut Leaf Wilting Estimation From RGB Color Indices and Logistic Models. Front Plant Sci 12: 658621.
- Schneider, C. A., Rasband, W. S. and Eliceiri, K. W. (2012). NIH Image to ImageJ: 25 years of image analysis. Nat Methods 9(7): 671-675.
- Shakoor, N., Lee, S. and Mockler, T. C. (2017). High throughput phenotyping to accelerate crop breeding and monitoring of diseases in the field. Curr Opin Plant Biol 38: 184-192.
- Tovar, J. C., Hoyer, J. S., Lin, A., Tielking, A., Callen, S. T., Elizabeth Castillo, S., Miller, M., Tessman, M., Fahlgren, N., Carrington, J. C., et al. (2018). Raspberry Pi-powered imaging for plant phenotyping. Appl Plant Sci 6(3): e1031.
Article Information
Copyright
© 2023 The Authors; exclusive licensee Bio-protocol LLC.
How to cite
Ginzburg, D. N. and Rhee, S. Y. (2023). Evaluating Plant Drought Resistance with a Raspberry Pi and Time-lapse Photography. Bio-protocol 13(2): e4593. DOI: 10.21769/BioProtoc.4593.
Category
Plant Science > Plant physiology > Abiotic stress
Biological Sciences > Biological techniques
Do you have any questions about this protocol?
Post your question to gather feedback from the community. We will also invite the authors of this article to respond.