- Protocols

- Articles and Issues
- For Authors
- About
- Become a Reviewer

Arrayed CRISPR/Cas9 Screening for the Functional Validation of Cancer Genetic Dependencies
Published: Vol 12, Iss 24, Dec 20, 2022 DOI: 10.21769/BioProtoc.4577 Views: 3109
Reviewed by: Rene WinklerSalim GasmiAnonymous reviewer(s)
Original research article
The authors used this protocol in:
Sep 2021
Advertisement


Protocol Collections
Comprehensive collections of detailed, peer-reviewed protocols focusing on specific topics


Related protocols

Abstract
CRISPR/Cas9 screening has revolutionized functional genomics in biomedical research and is a widely used approach for the identification of genetic dependencies in cancer cells. Here, we present an efficient and versatile protocol for the cloning of guide RNAs (gRNA) into lentiviral vectors, the production of lentiviral supernatants, and the transduction of target cells in a 96-well format. To assess the effect of gene knockouts on cellular fitness, we describe a competition-based cell proliferation assay using flow cytometry, enabling the screening of many genes at the same time in a fast and reproducible manner. This readout can be extended to any parameter that is accessible to flow-based measurements, such as protein expression and stability, differentiation, cell death, and others. In summary, this protocol allows to functionally assess the effect of a set of 50–300 gene knockouts on various cellular parameters within eight weeks.
Graphical abstract
Background
The experimental identification of genes that are essential for cancer cell proliferation and survival has radically changed over the last decade. The CRISPR/Cas9 technology is a powerful tool for the assessment of cancer-specific vulnerabilities (u and Yusa, 2019; Behan et al., 2019). It has been successfully employed in various cancer models and led to the identification of multiple genetic dependencies, such as WRN1 in cancers with microsatellite instability, YTHDF2 in triple-negative breast cancer, TRIM8 in Ewing sarcoma, or STAUFEN2 and ERG in acute myeloid leukemia (Lin and Sheltzer, 2020; Chan et al., 2019; Bajaj et al., 2020; Einstein et al., 2021; Seong et al., 2021; Schmoellerl et al., 2022). Indeed, pooled genome-wide loss-of-function screens to identify genetic dependencies have become common practice in cancer biology (Behan et al., 2019; Bajaj et al., 2020) as well as in many other fields of the molecular life sciences, such as stem cell biology, immunology, or cell and developmental biology (Arroyo et al., 2016; Y. Zhu, et al., 2021; Dong et al., 2022; Zhang et al., 2022). In parallel, pooled focused screens covering smaller sets of genes representing specific pathways or protein families are often employed (X. G. Zhu et al., 2021; Cao et al., 2021). Furthermore, next-generation sequencing–based methods, such as RNA-seq, ATAC-seq, or Cut&Run, as well as mass spectrometry–based proteomics are increasingly used to characterize molecular alterations in cancer cells in an unbiased global fashion. However, all these experimental approaches yield large amounts of data and high numbers of candidate genes, ranging from a few hundred to several thousand. Consequently, streamlined strategies for efficient functional genomic screening and validation of candidate genes downstream of pooled screens need to be developed. Here, we describe how to design and perform arrayed CRISPR/Cas9 screening experiments of candidate sets ranging from 50 to 300 gene knockouts for the validation and identification of functional genetic dependencies of cancer cells using flow cytometry that can serve as starting points for detailed molecular analyses.
Materials and Reagents
Cloning
Scalpel
Pipette tips, filtered, sterile, 0.5–1,250 µL (Biozym Surphob)
1.5 mL tubes (Eppendorf, catalog number: 0030121872)
96-well PCR plates (Biozym Scientific, catalog number: 710880)
96-well deep well plates, 2.2 mL, V-bottom (Biozym Scientific, catalog number: 710850)
LentiGuide-Puro-P2A-EGFP (Addgene, Plasmid #137729) (Panda et al., 2020)
BsmBI-v2 (New England Biolabs, catalog number: R0739L)
NEBuffer r3.1 (New England Biolabs, catalog number: B6003S)
Double-distilled water (ddH2O)
Antarctic phosphatase (New England Biolabs, catalog number: M0289L)
Antarctic phosphatase reaction buffer (New England Biolabs, catalog number: B0289S)
Agarose (Sigma Aldrich, catalog number: A9539)
Monarch® DNA Gel Extraction kit (New England Biolabs, catalog number: T1020L)
T4 DNA ligase (New England Biolabs, catalog number: M0202L)
T4 DNA ligase reaction buffer (New England Biolabs, catalog number: B0202S)
T4 polynucleotide kinase (PNK) (New England Biolabs, catalog number: M0201L)
NEB stable competent E. coli (New England Biolabs, catalog number: C3040H)
LB medium (Carl Roth, catalog number: X964.4)
LB agar (Carl Roth, catalog number: 6671.2)
Carbenicillin (Carl Roth, catalog number: 6344)
Petri dish, square, 12 × 12 cm (Greiner Bio-One, catalog number: 688161)
Inoculation loop (Sarstedt, catalog number: 86.1562.050)
Monarch® Plasmid Miniprep kit (New England Biolabs, catalog number: T1010L)
Cell culture
Sterile flat-bottom 96-well plates (Greiner, catalog number: 655180)
Round bottom 96-well plates (Greiner, catalog number: 650188)
10 cm2 dishes (Greiner, catalog number: 655160)
24-well cell culture plates (Stölzle Oberglas, catalog number: GR-662160)
Syringe filter 0.45 µm, 33 mm diameter (M&B Stricker, catalog number: 99745)
Sterile distilled water (Ecotainer, Braun, catalog number: 82479E-E)
DMEM high glucose, no glutamine, 10 × 500 mL (Life Tech, catalog number: 11960085)
Fetal bovine serum (FBS), heat inactivated (Sigma-Aldrich, catalog number: F9665-500ML)
L-glutamine 200 mM (100×), liquid (Gibco, catalog number: 25030024)
Penicillin-streptomycin, 10,000 U/mL (Life Tech, catalog number: 15140122)
Phosphate buffered saline (PBS), 10×, pH 7.2–10 (Life Tech, catalog number: 70013065)
Trypsin, 0.25% (1×) with EDTA 4Na, liquid (Gibco, catalog number: 25200056)
Lenti-X 293T cells (Takara bio, catalog number: 632180)
psPAX2 (packaging plasmid) (Addgene, catalog number: 12260)
pMD2.G (packaging plasmid) (Addgene, catalog number: 12259)
Polyethylenimine HCl MAX, linear, MW 40,000 (PEI) (Polysciences Europe, catalog number: 24765-1)
PEI stock: 1 mg/mL in water according to the supplier’s protocol
Polybrene transfection reagent (Merck, catalog number: TR-1003-G)
Oligonucleotides
DNA oligonucleotide primers from Integrated DNA Technologies (IDT) in 96-well format, premixed
hU6 prom_fwd GACTATCATATGCTTACCGT
Polybrene stock: 10 mg/mL in sterile water
Equipment
Single-channel pipettes, 0.5–1000 µL (Eppendorf Research)
Multi-channel pipettes, 1–200 µL (Thermo Scientific Finnpette F2)
Thermomixer (Eppendorf, catalog number: 5355)
Thermal cycler S1000 (Bio-Rad, catalog number: 1852196)
Incubator (Thermo Scientific, catalog number: 51029323)
Shaker (GFL, catalog number: 3015)
Tabletop microcentrifuge (Eppendorf 5424)
Vortex (Scientific Industries, model: Vortex Genie 2)
Spectrophotometer (Spark, Tecan)
Incubator (Thermo Scientific Heraeus, BBD 6220)
Incubator settings: 37 °C, 5 % CO2 , 95 % relative humidity
Centrifuge (Eppendorf, 5810, equipped with aerosol-tight buckets located in a BSL2 laboratory)
Fully-equipped biosafety level 2 laboratory authorized for work with virus particles (BSL 2)
IQue Screener Plus [Intellicyt, equipped with plate reader, blue (488 nm) and red (640 nm) laser]
Software
Geneious Prime 2022.0.2
Forecyt standard Edition 7.0 (R2) (7.0.7035)
Microsoft Excel
R studio version: 1.3.1056
Procedure
Guide RNA (gRNA) design
Use the user-friendly VBC Score online tool (https://www.vbc-score.org/) (Michlits et al., 2020) to select gRNAs targeting the genes of interest. It is recommended to select two to three gRNAs per target gene. A high VBC score indicates high targeting efficiency and low off-target effects. The complete oligonucleotide sequences needed for cloning can be found in columns “GeCKO_cloning_FW” and “GeCKO_cloning_RV” in the Microsoft Excel files provided by the tool. The oligonucleotide sequences are as follows:
Oligo forward: 5’-CACCG NNNNNNNNNNNNNNNNNNNN-3’
Oligo reverse: 3’-C NNNNNNNNNNNNNNNNNNNN CAAA-5’
Note: The PAM sequence is not included in the primers but is specified in the “sgRNA + NGG” column.
Order pre-mixed gRNA (forward and reverse) oligonucleotides in 96-well plate format from IDT (https://eu.idtdna.com) as follows:
Plate Specifications Scale: 25 nmol DNA Purification: Standard de-salted Plate type: PCR Loading Scheme Forward/Reverse mixed in wells Shipping: Normalization: nmol/well Amount per well: 4 nm If wet: Final concentration 40 micromolar Final volume 100 microliters/well Buffer: IDTE buffer pH 8.0
Preparation of gRNA expression vector
Digest 5,000 ng of the LentiGuide-Puro-P2A-EGFP backbone (Figure 1) for 2 h at 55 °C with the restriction enzyme BsmBI-v2 (Figure 2A).
Component Volume/Amount LentiGuide-Puro.P2A-EGFP 5,000 ng BsmBI-v2 3 µL NEBuffer 3.1 5 µL ddH2O up to 50 µL (= final volume) 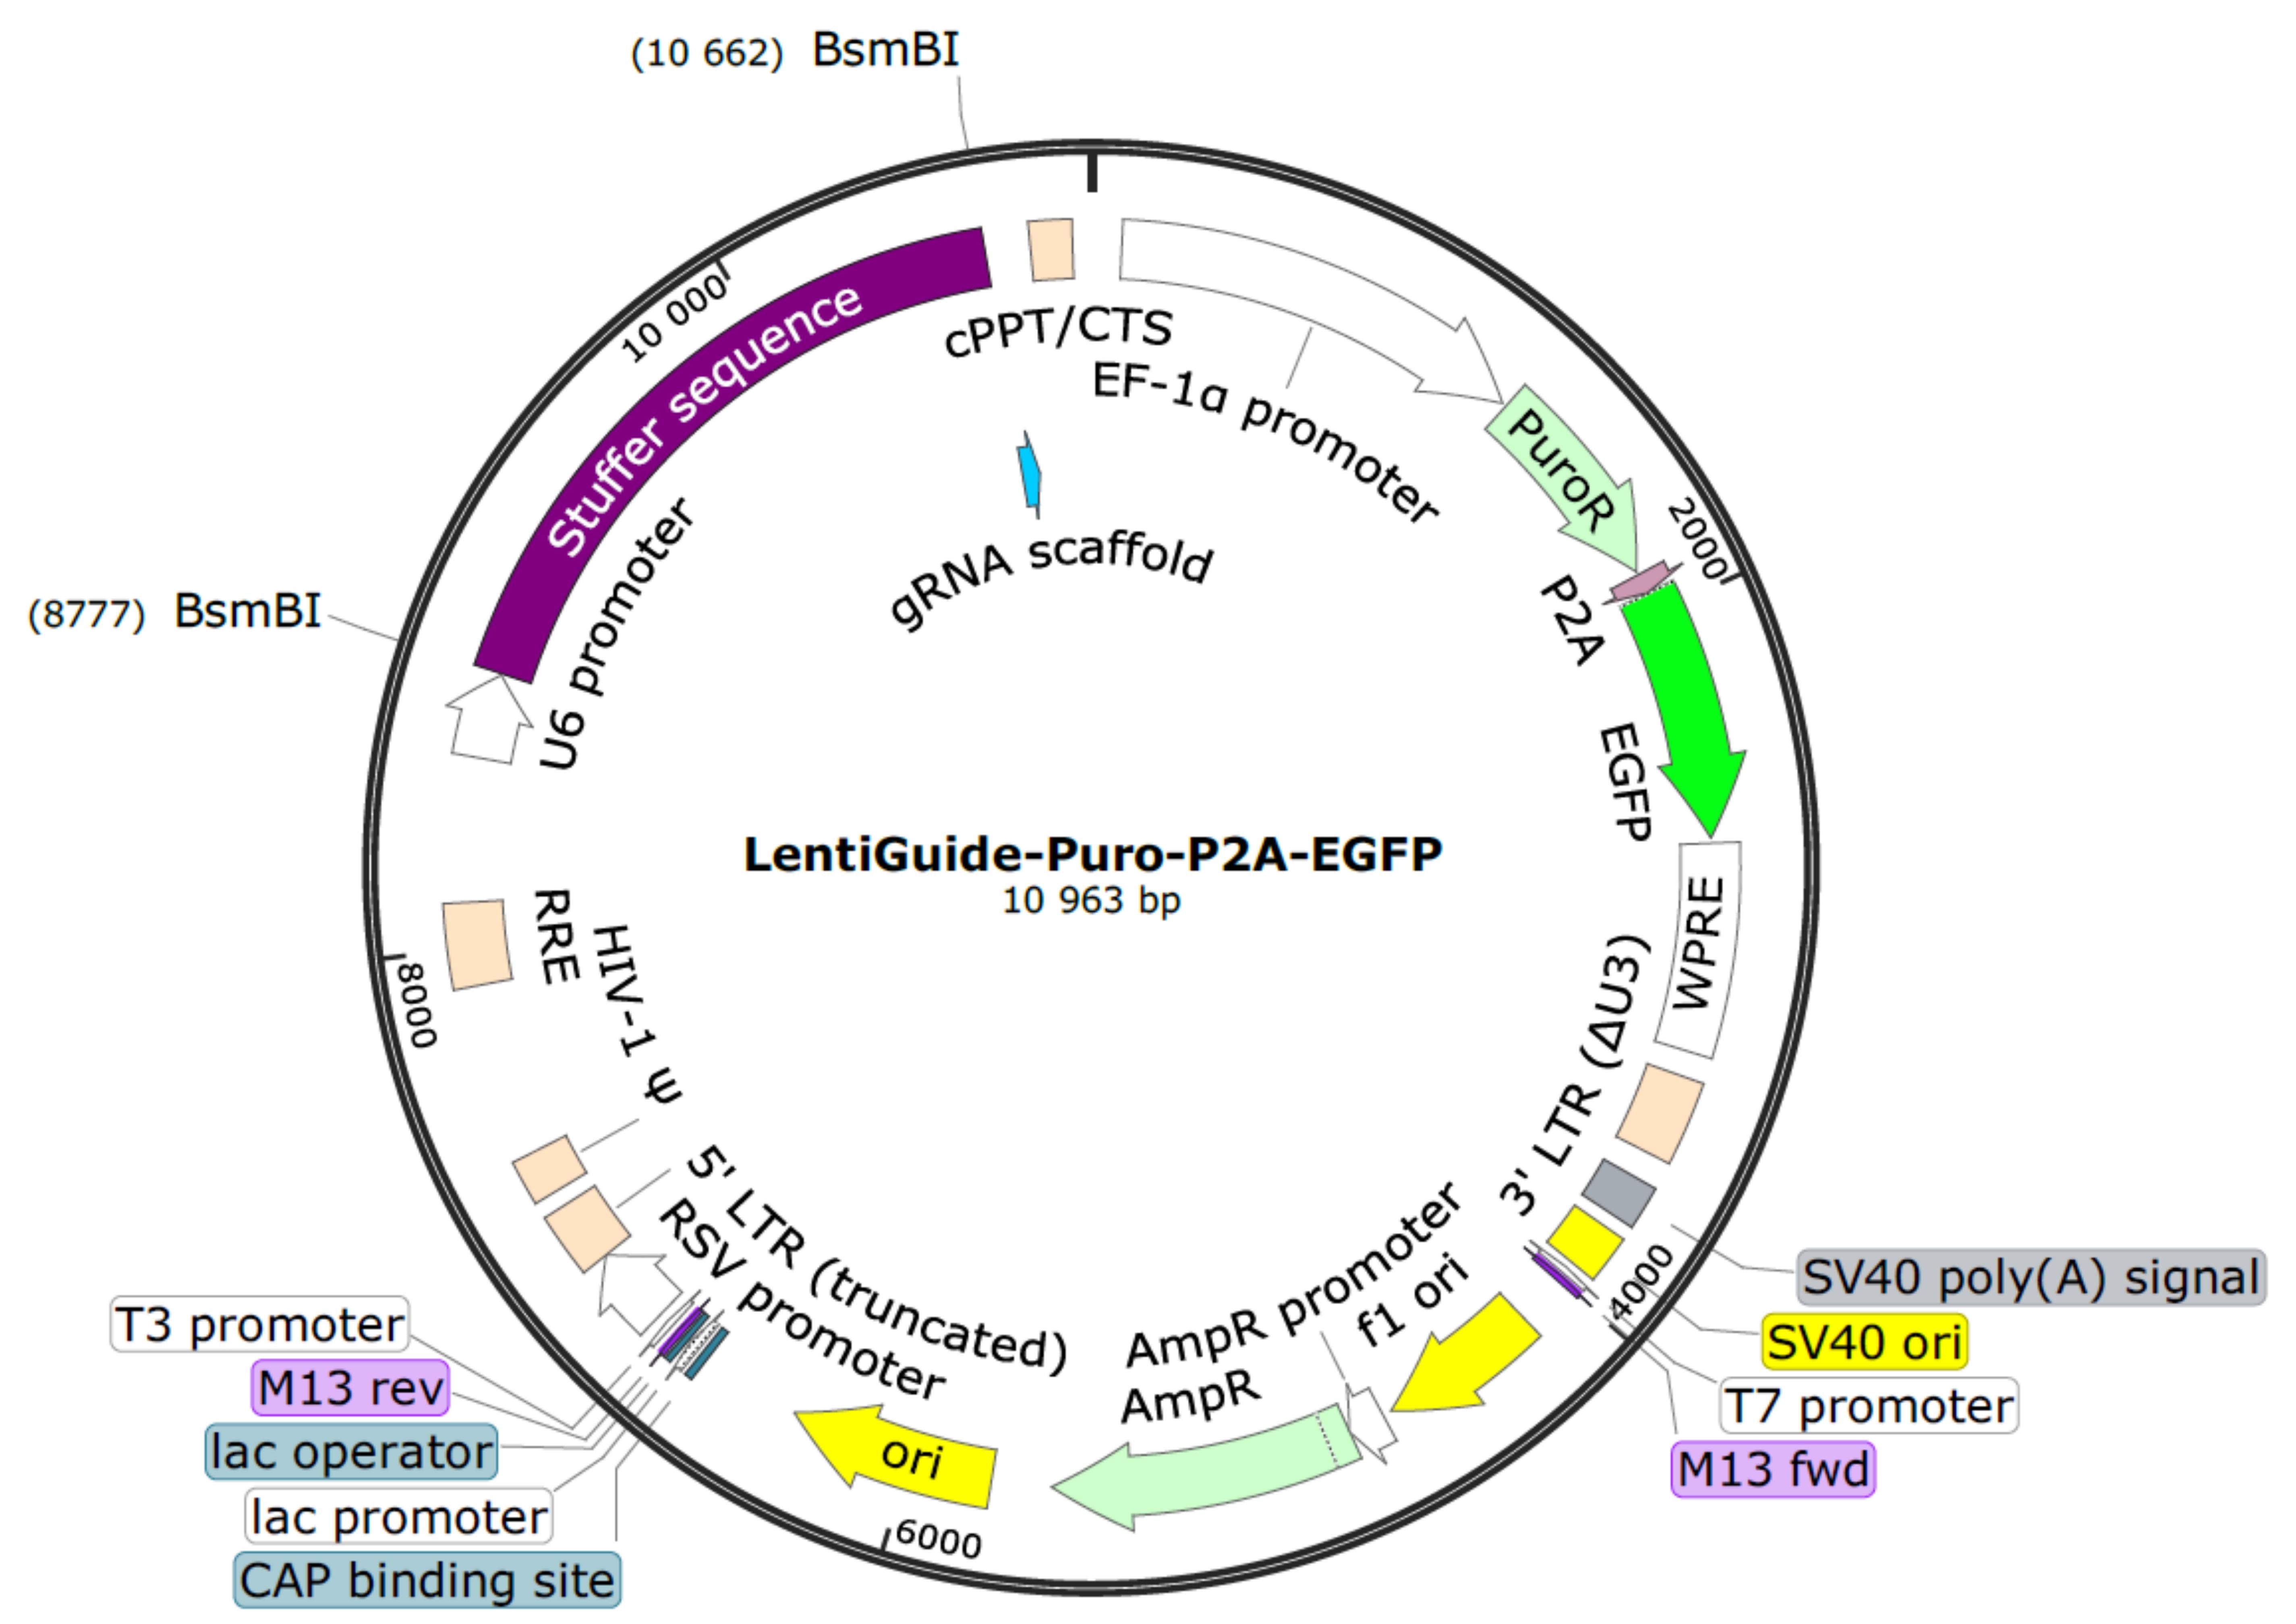
Figure 1. LentiGuide-Puro-P2A-EGFP from Addgene (Plasmid #137729)For dephosphorylation, add the following reagents to the digestion reaction from step B1 and incubate for 1 h at 37 °C.
Component Volume Antarctic phosphatase 1 µL Antarctic phosphatase buffer 6 µL ddH2O 3 µL Total 60 µL Separate the backbone (approximately 9,000 bp) from the filler piece (1,885 bp) on a 0.7% agarose gel. Add an aliquot of undigested backbone to a separate gel pocket for comparison and to verify successful digestion of the backbone. Excise the band at approximately 9 kb with a scalpel and purify with a gel extraction kit. Elute DNA in 30–50 µL ddH2O.
Note: As a considerable fraction of DNA is usually lost during gel purification, we recommend performing three to four digestion reactions in parallel and purify DNA from all bands using a single purification column. This will ensure obtaining sufficient quantities of backbone DNA.
Measure the concentration of the eluted DNA and dilute to 100 ng/µL with ddH2O.
gRNA cloning in 96-well plate format
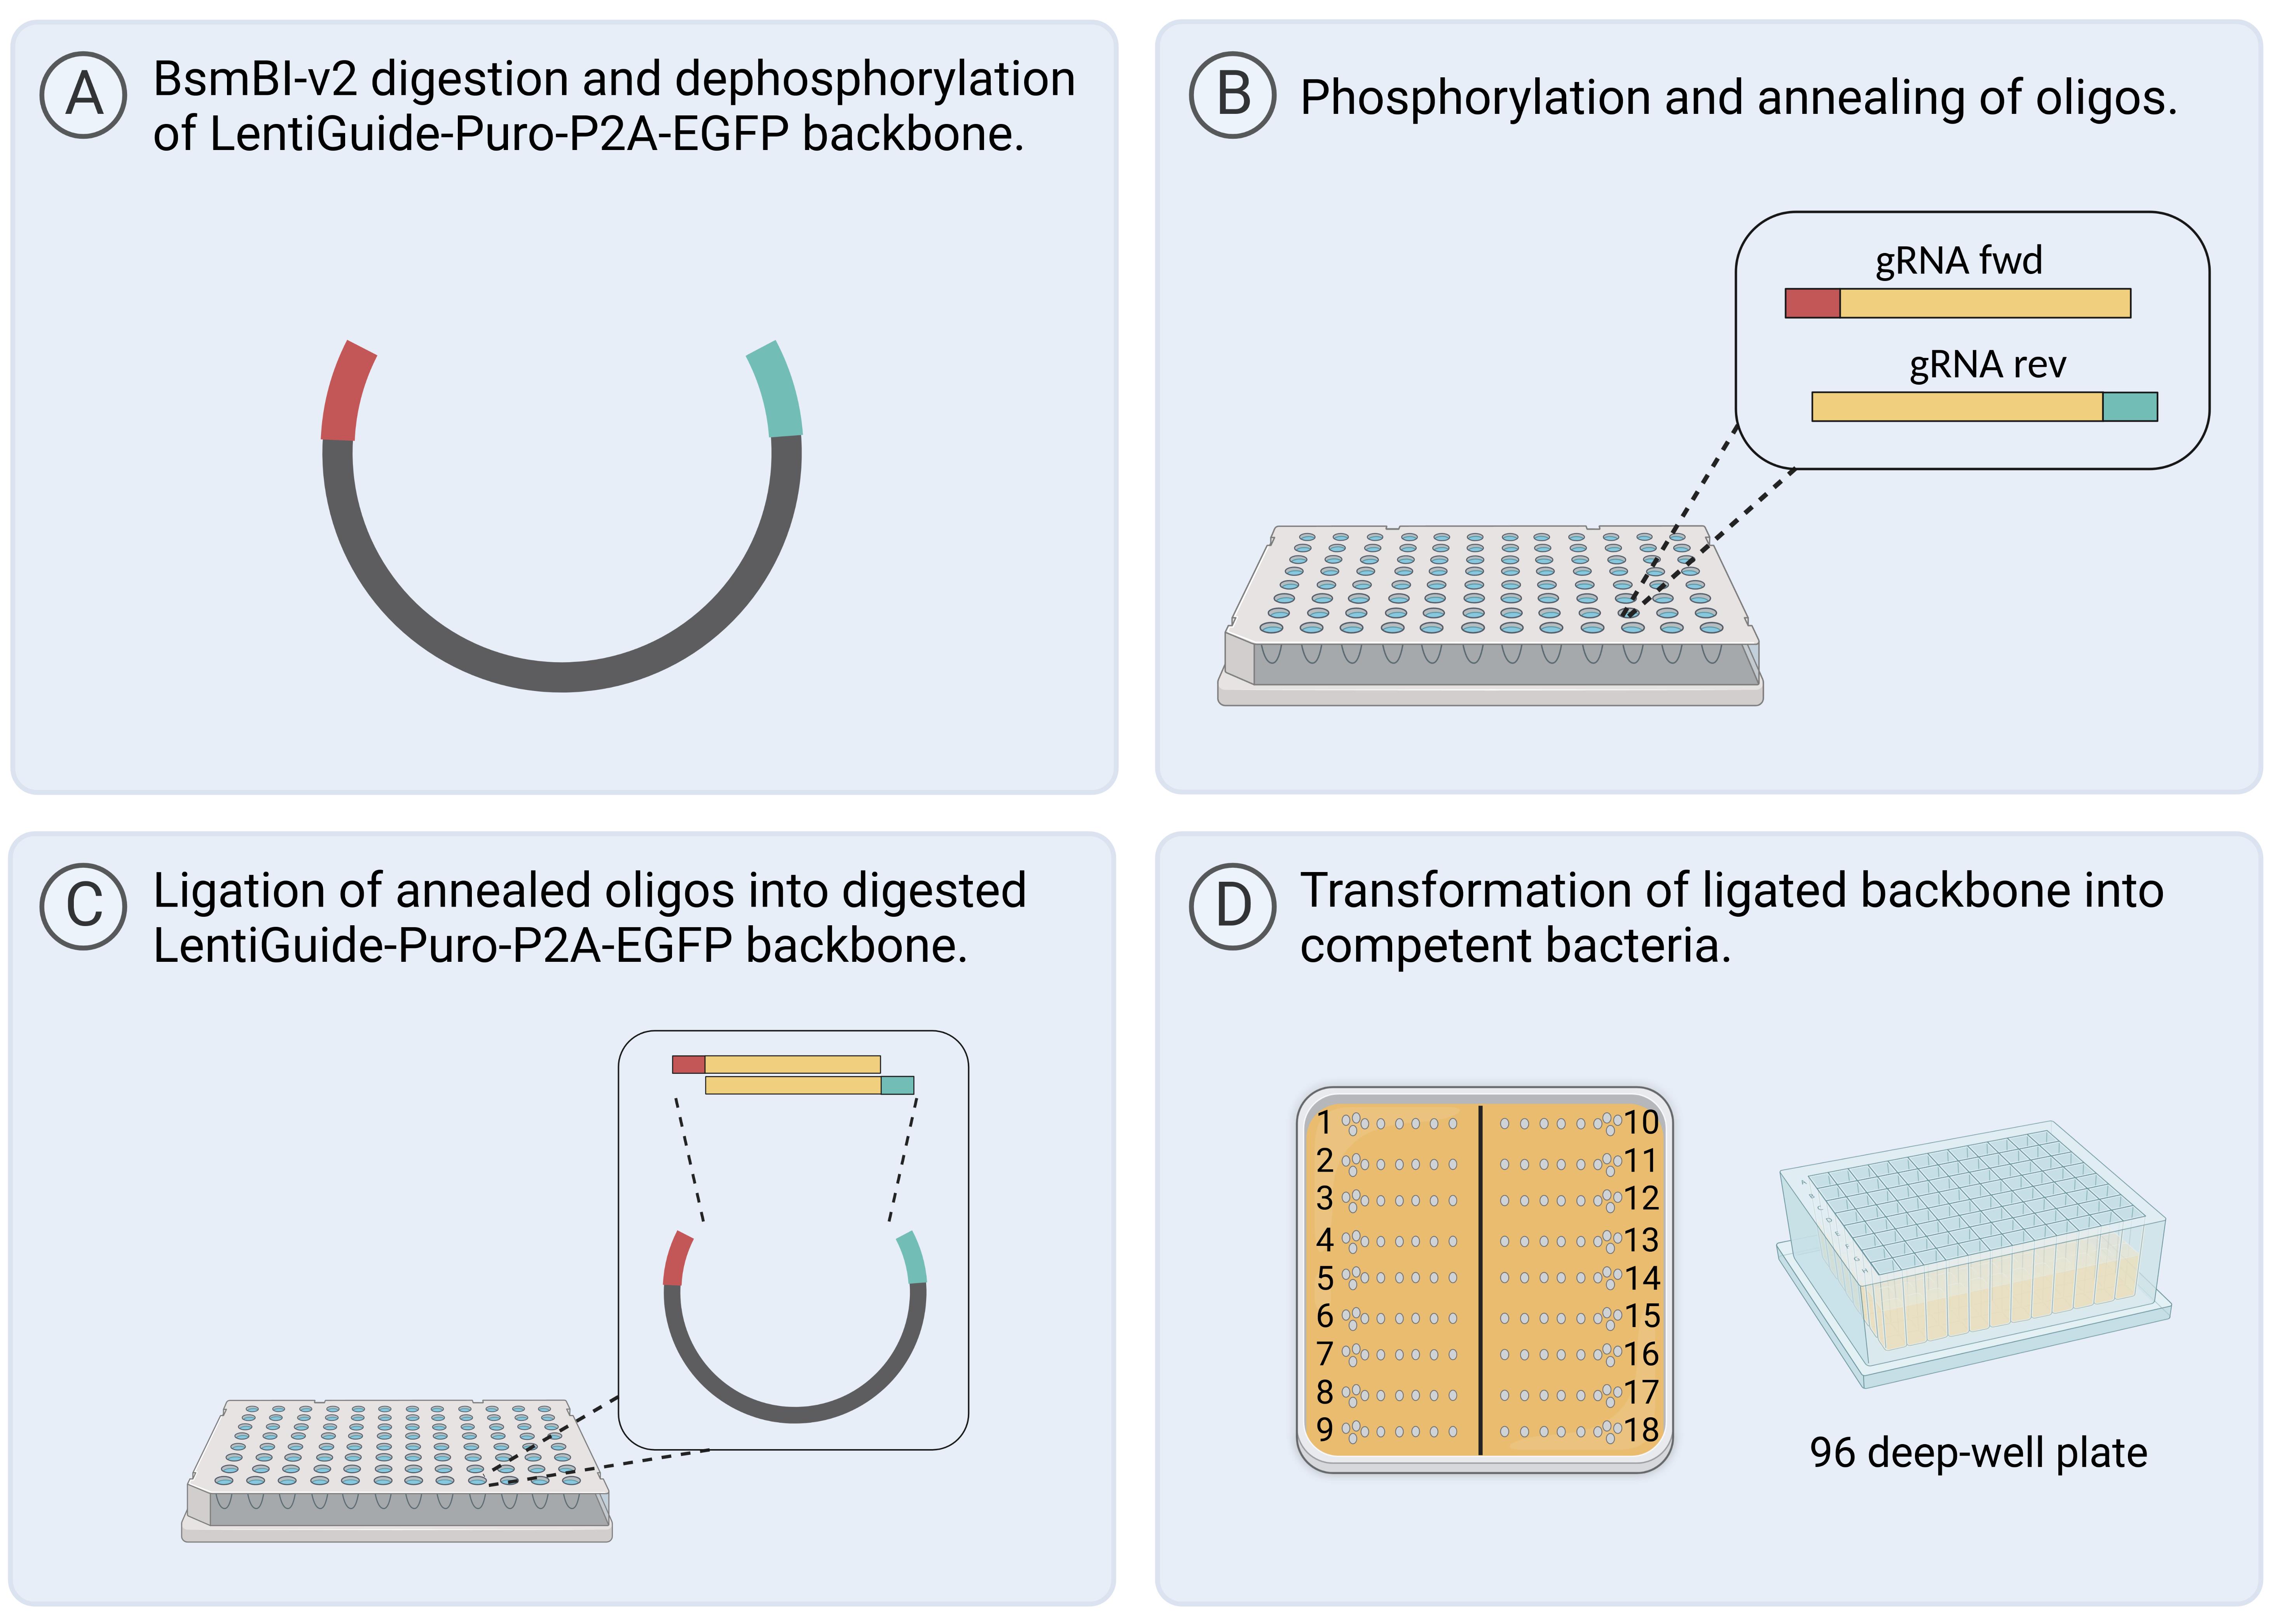
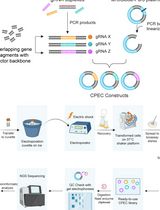
Figure 2. Workflow for gRNA cloning in 96-well format. Created with BioRender.com.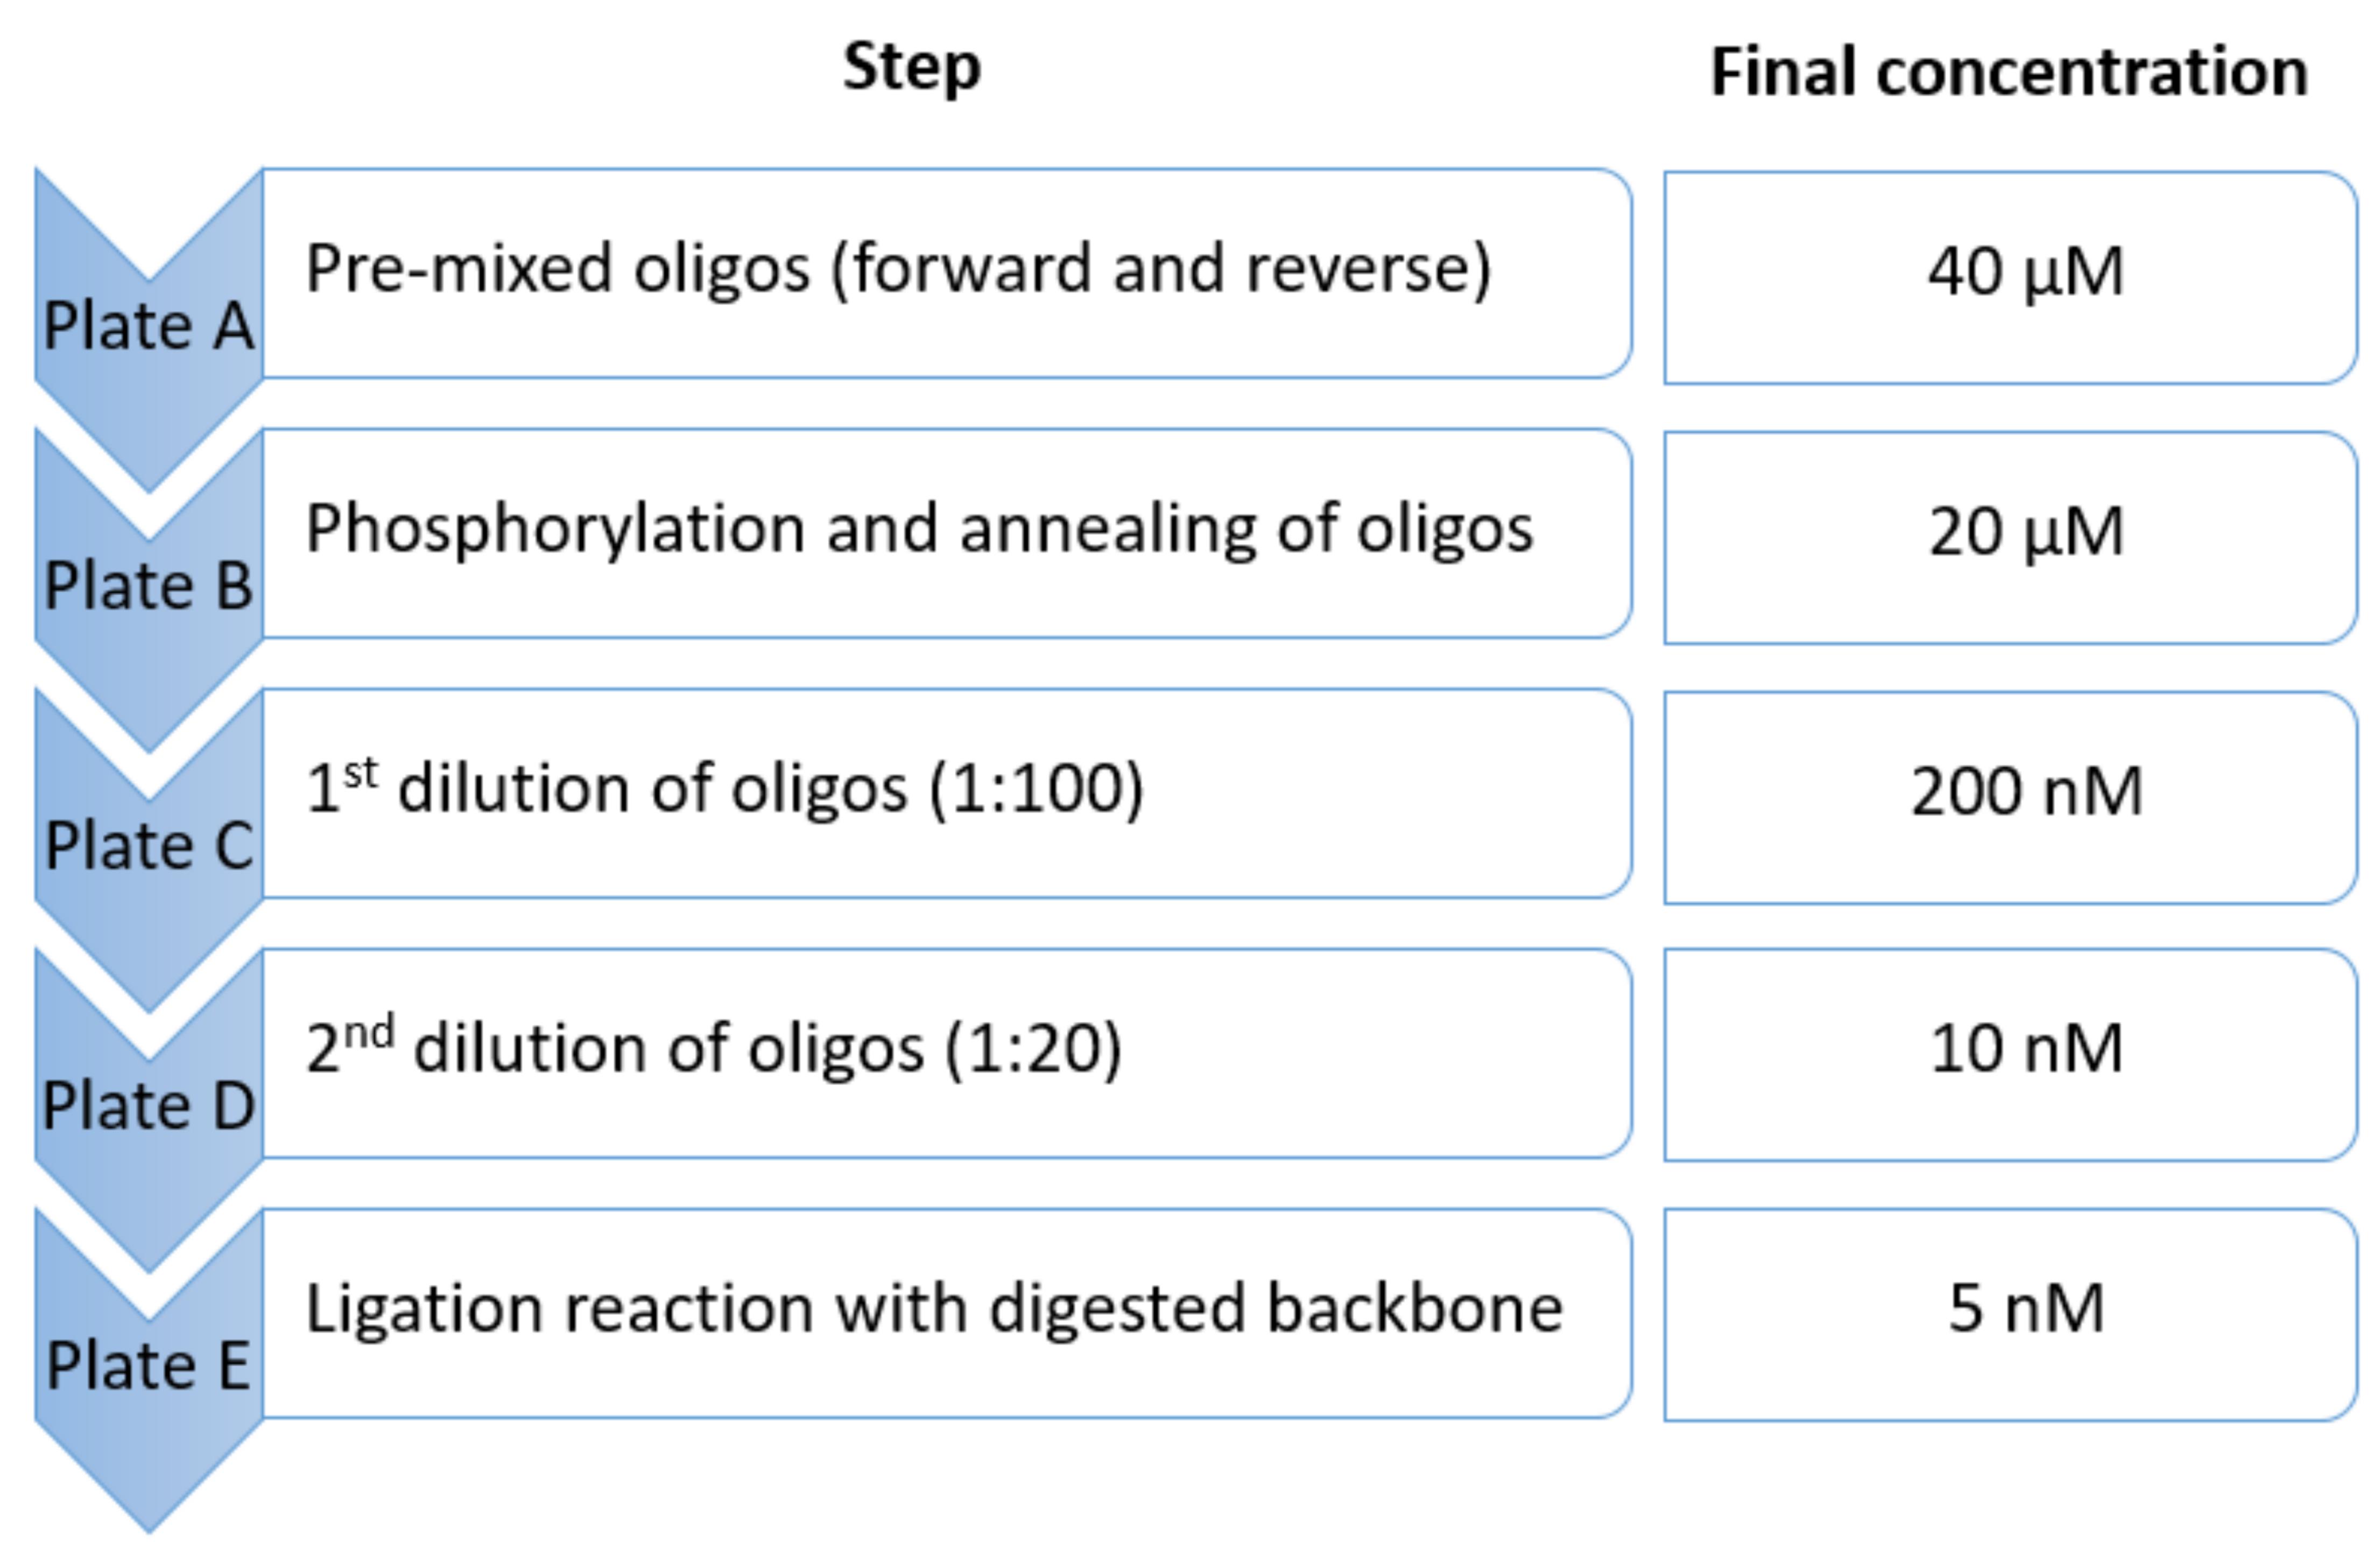
Figure 3. Overview of plates A-E and the corresponding final concentration of oligosThaw pre-mixed gRNA forward and reverse primers from IDT at room temperature (RT) (Plate A).
For the phosphorylation and annealing of oligonucleotides (Figure 2B):
Prepare the following master mix:
Component Volume (×1) Volume (×96) T4 DNA ligase reaction buffer 0.4 µL 38.4 µL T4 PNK 0.2 µL 19.2 µL ddH2O 1.4 µL 134.4 µL Master mix 2 µL 192 µL Add 2 µL per well of the master mix to a new 96-well plate (plate B).
Add 2 µL per well of oligonucleotides from plate A according to plate layout (final concentration: 20 µM) (Figure 3).
Seal plate B and transfer to a thermocycler and apply the following conditions:
Temperature Time 37 °C 30 min 95 °C 30 s Ramp down to 25 °C at 5 °C/min
Dilute phosphorylated and annealed oligonucleotides in a new 96-well plate (plate C) by adding 2 µL of oligos to 198 µL of ddH2O (dilution factor: 100; final concentration: 200 nM) (Figure 3).
Dilute plate C further in a new 96-well plate (plate D) by adding 5 µL of diluted oligonucleotides from plate C to 95 µL of ddH2O (dilution factor: 20; total dilution: 1:2,000; final concentration: 10 nM) (Figure 3).
Set up the ligation reaction:
Prepare the following master mix:
Component Volume (×1) Volume (×96) Digested backbone 100 ng/µL 0.4 µL 38.4 µL T4 DNA ligase reaction buffer 0.4 µL 38.4 µL T4 DNA ligase 0.2 µL 19.2 µL ddH2O 1 µL 96 µL Total 2 µL 192 µL Add 2 µL per well of master mix to a new plate (plate E).
Add 2 µL per well of annealed oligos from plate D (final concentration: 5 nM) (Figure 3).
Let plate E stand for 20 min at RT to allow the ligation reaction to occur (Figure 2C).
Bacterial transformation
Dilute ligation reaction by adding 6 µL of ddH2O to each well of plate E.
Thaw competent E. coli on ice.
Seed 10 µL of bacteria per well in a 96-well plate on ice.
Add 2 µL of ligation reaction to bacteria and pipette up and down two to three times.
Incubate for 5 min on ice.
Perform a heat shock at 42 °C for 45 s using a thermocycler.
Incubate for 1 min on ice.
Add 180 µL of LB medium to each well.
Loosely cover the plate with aluminum foil and incubate at 37 °C for 30 min.
Seed 5 µL of recovered bacteria on 12 × 12 cm petri dishes with LB medium + carbenicillin (Figure 2D).
Note: Distribute 5 µL bacteria with a multichannel pipette and streak them out using an inoculation loop.
Incubate overnight at 37 °C.
Isolation of plasmids (backbone + gRNA)
Add 2 mL of LB medium + carbenicillin into each well of a 96-deep-well plate.
Pick single colonies using an inoculation loop or a pipette tip.
Incubate overnight at 37 °C on a shaker.
On the next day, isolate plasmid DNA using Monarch® Plasmid Miniprep kit according to the manufacturer’s instructions.
Measure plasmid DNA concentration using a spectrophotometer.
Submit plasmid DNA to Sanger Sequencing using hU6 prom_fwd sequencing primer (GACTATCATATGCTTACCGT).
Check sequencing results using appropriate software (e.g., Geneious Prime) (Figure 4).
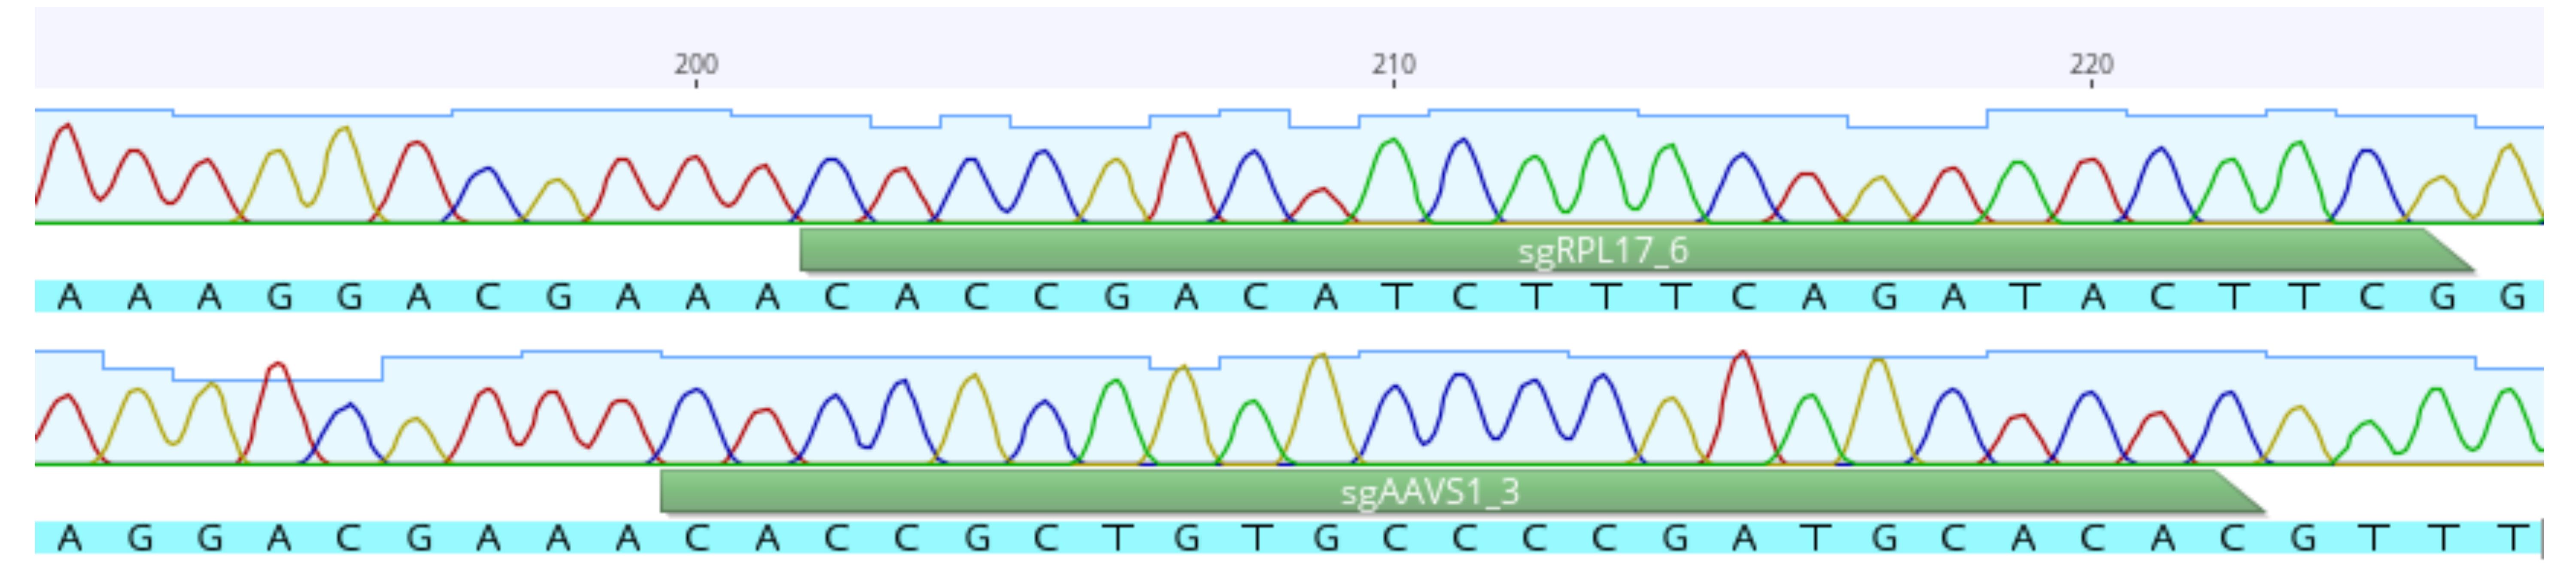
Figure 4. Example of sequence analysis using Geneious Prime
Notes:
For the arrayed CRISPR/Cas9 screen (Figure 5), we recommend the generation of a functional SpCas9-expressing clone from your cell line of interest. For validation, conduct a competition assay as described below using control gRNAs. For instance, in human cell lines, gRNAs targeting AAVS1 should be used as negative control, as the introduction of indels into this locus is not expected to have any effect on cellular fitness. gRNAs targeting RPL17 can be used as positive controls, as this gene is essential in most human cells.
It is recommended to perform all functional experiments in at least three biological replicates.
Transfection of Lenti-X cells with lentiviral constructs
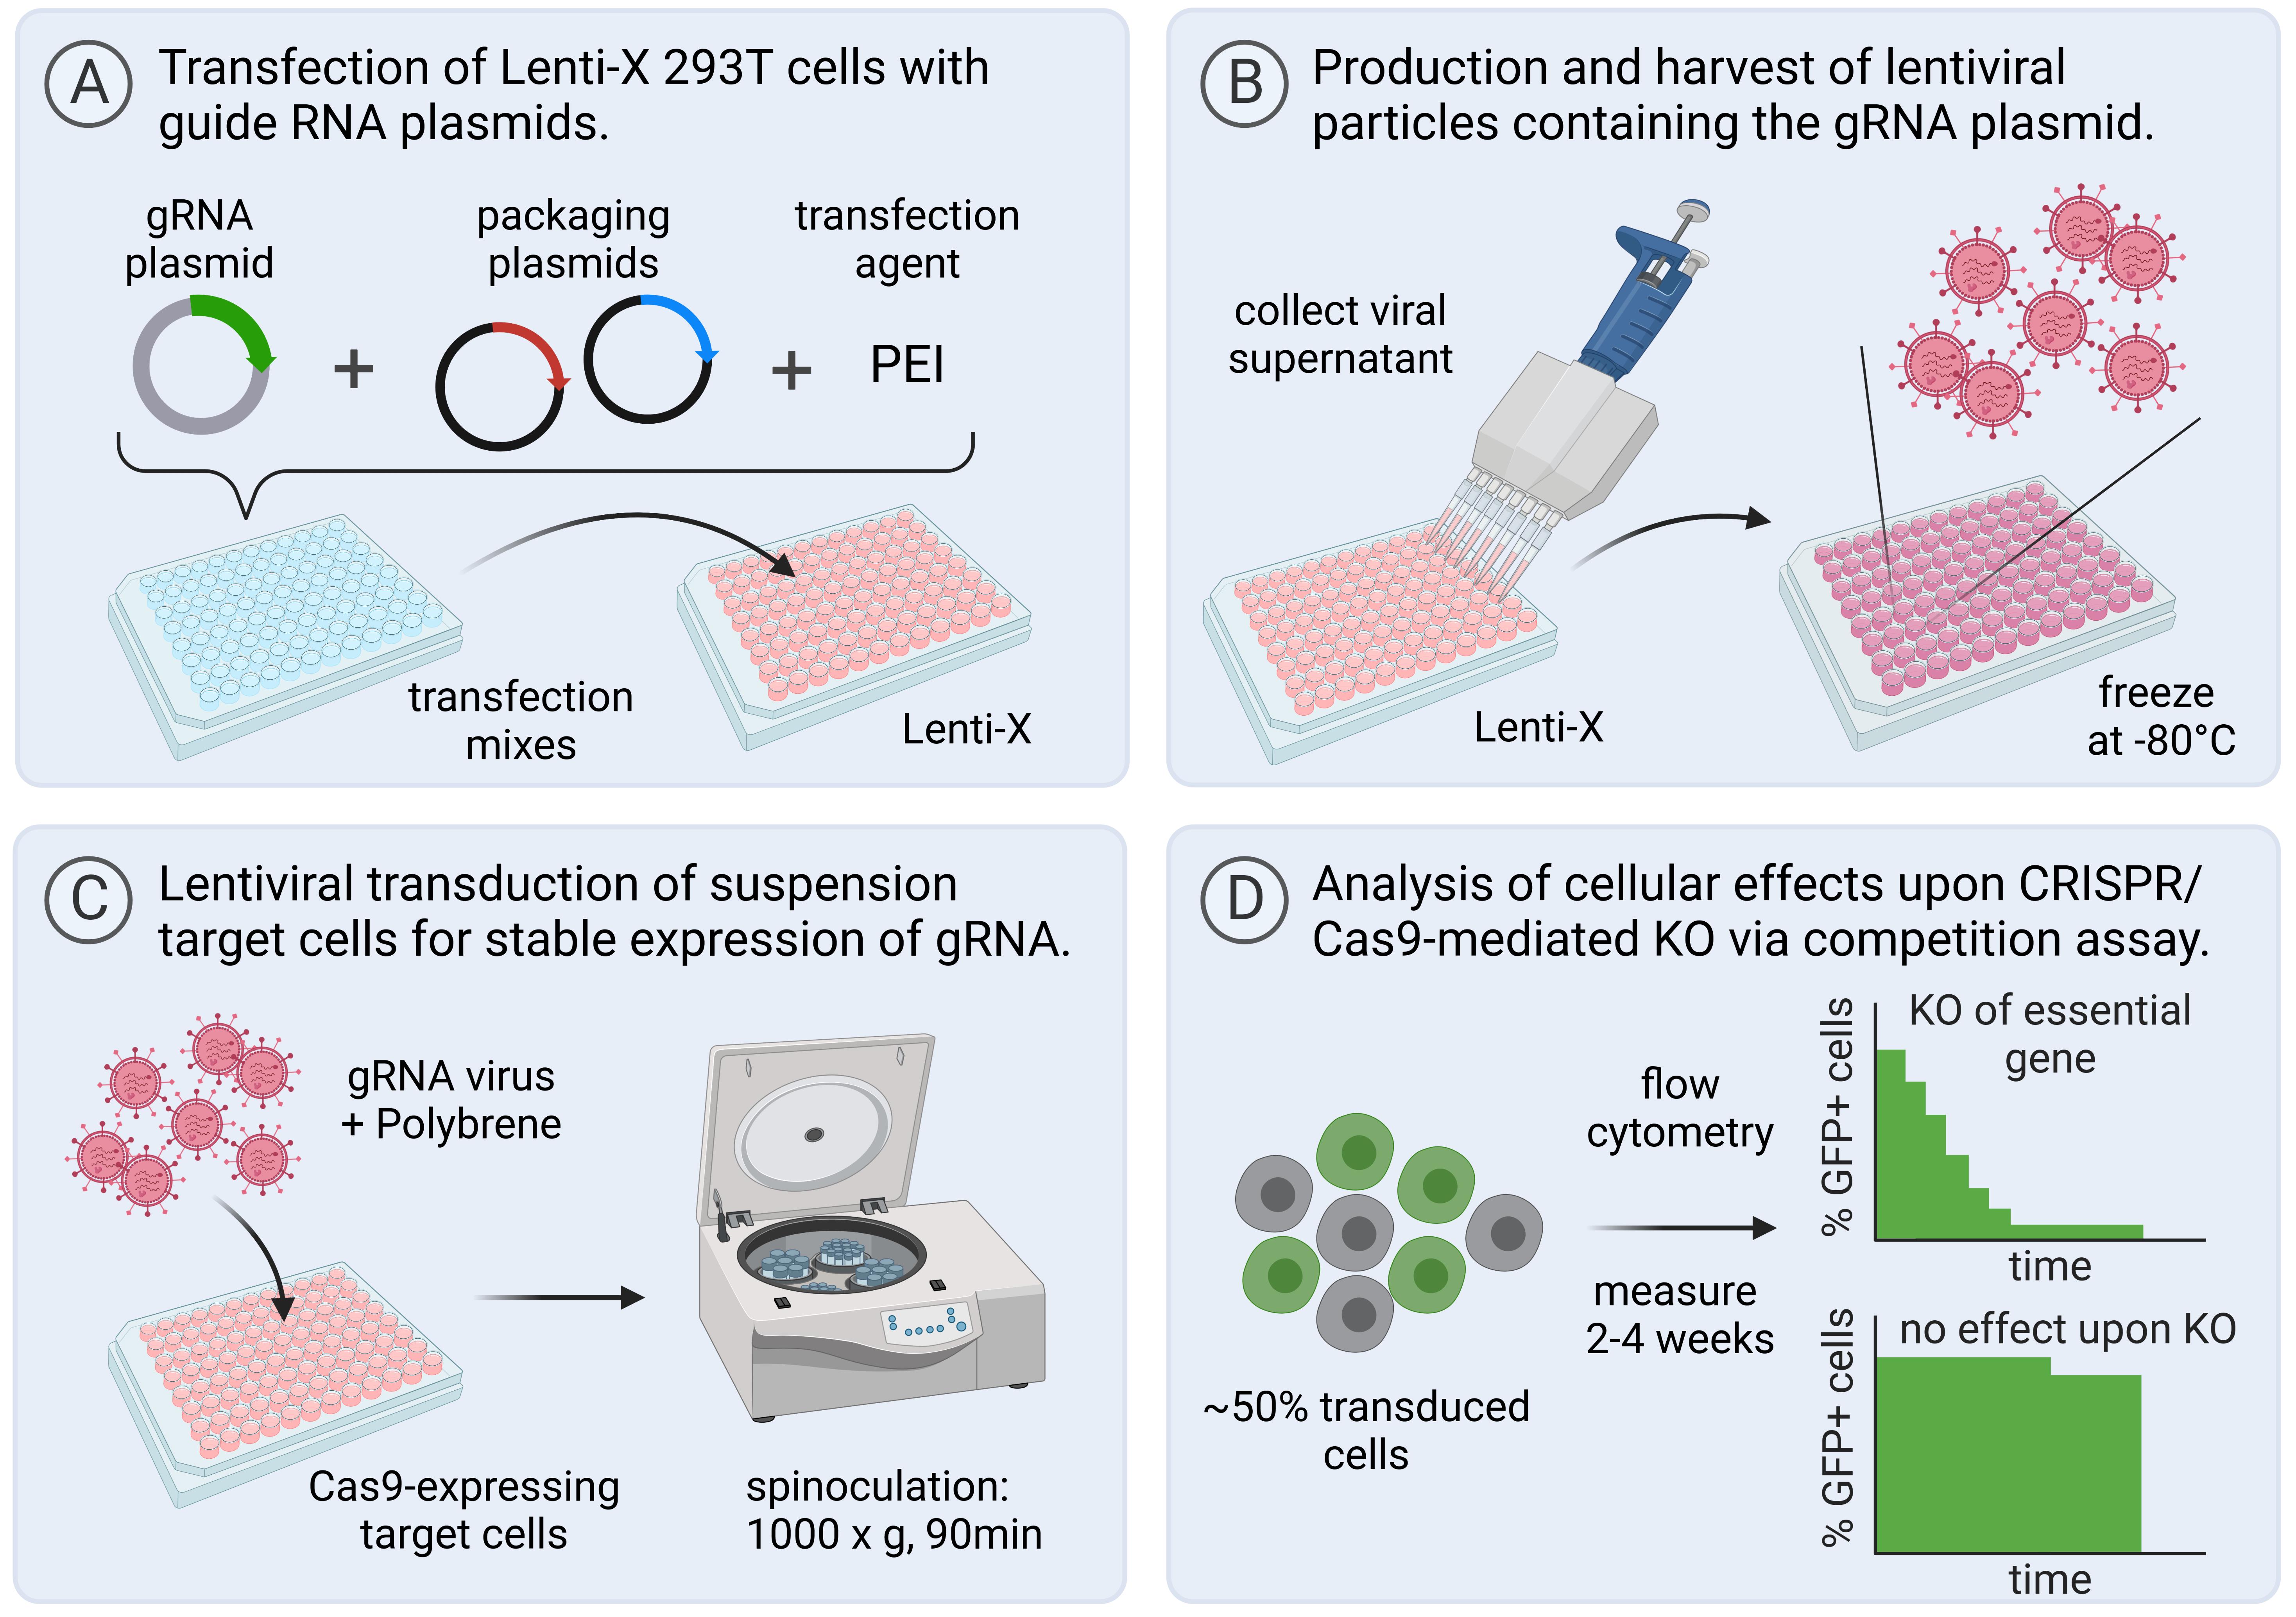
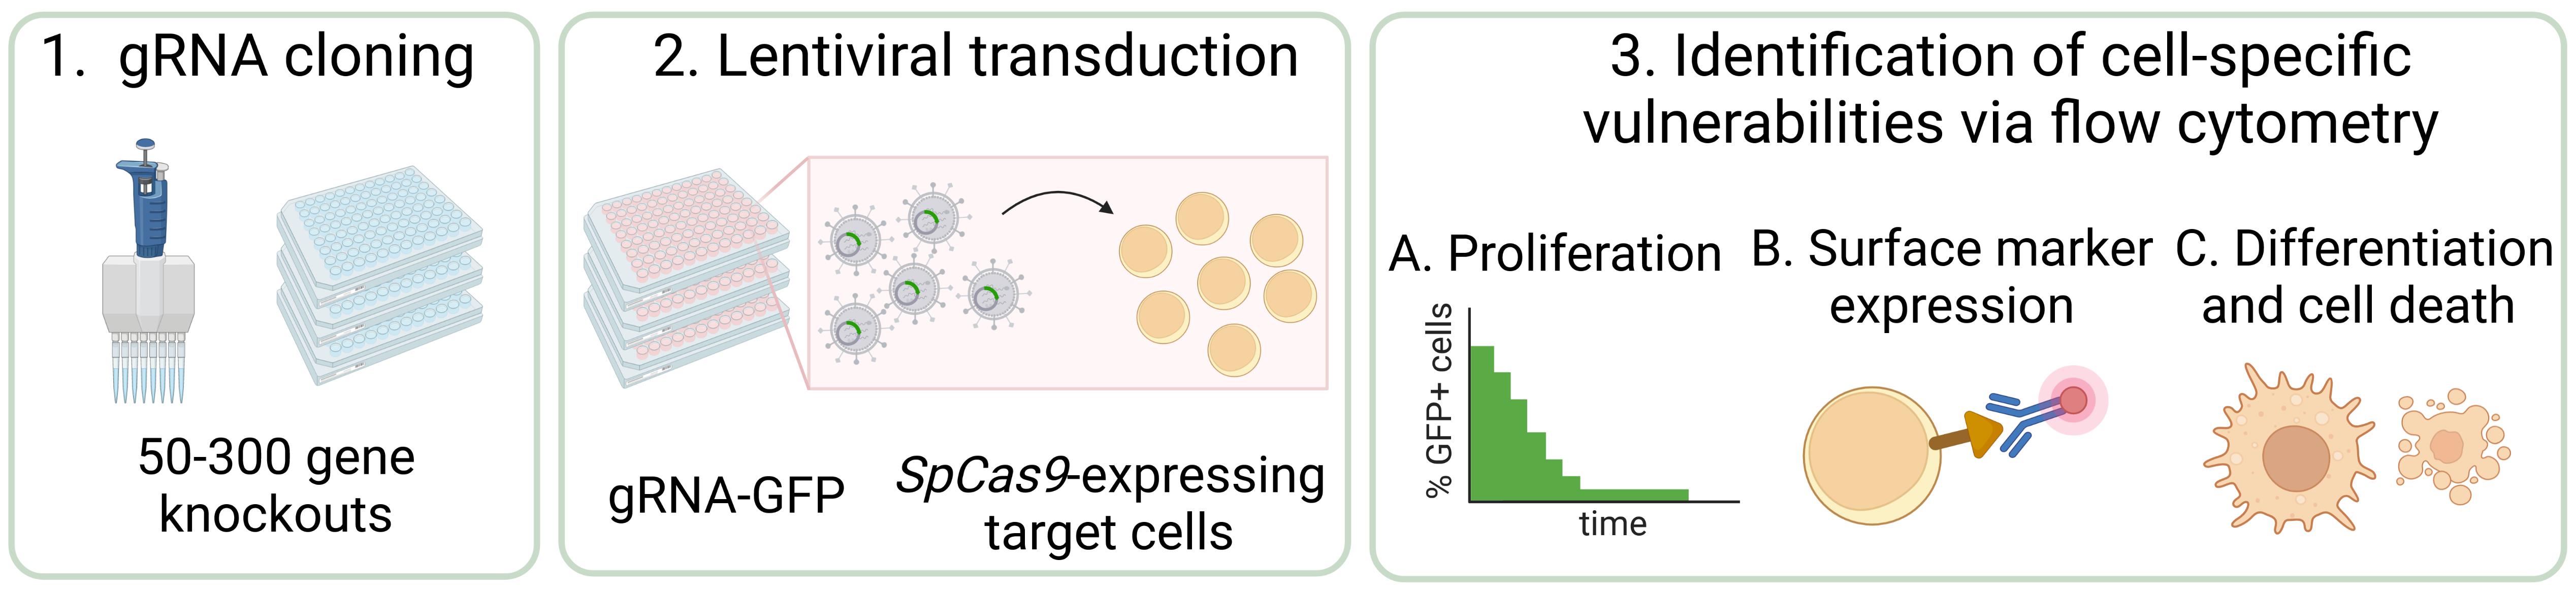
Figure 5. Workflow for virus production, transduction of target cells in 96-well plate format, and functional analysis of gene knockouts using a flow cytometry–based competition assay. Created with BioRender.com.Day 1:
Determine the concentration of all gRNA constructs and dilute to 20 ng/µL in ddH2O in a 96-well plate. This plate can be stored at -20 °C for later use.
Culture Lenti-X 293T (Lenti-X) in 10 cm2 dishes in DMEM supplemented with 10% FBS, 4 mM L-glutamine, 100 U/mL penicillin, and 100 µg/mL streptomycin. Make sure cultures do not grow beyond confluency (≥60%–80%). For the transfection, remove the supernatant, wash once with 5–10 mL of PBS and detach cells by incubating them in 1 mL of trypsin solution for 3–5 min in the incubator. After detachment, resuspend cells in 10 mL of fresh medium.
Dilute the cells to 1.4 × 10⁵ cells/mL and transfer 100 µL per well to a flat-bottom 96-well plate.
Day 2:
Prepare the transfection master mix as follows:
Component Volume (×1) Volume (×96) psPAX2 100 ng 9600 ng pMD2.G 10 ng 960 ng DMEM (plain) 25 µL 2.4 mL Add 25 µL of master mix and 10 µL of each construct [20 ng/µL] to each well of a 96-well plate.
Dilute PEI 1:10 in plain medium, add 12.6 µL per well, and mix thoroughly.
Incubate for 25 min at RT.
Carefully add 30 µL of each mix to the pre-seeded Lenti-X cells and incubate overnight.
Note: From this step onwards, a BSL2 environment is required for work with virus particles.
Day 3:
Carefully remove the supernatant and replace with 170 µL per well of fresh medium.
Note: Choose the fresh medium according to the growth medium of the cell line to be transduced. Since the chosen vector contains a fluorescent reporter, such as GFP, you can check the success of the transfection with a fluorescence microscope after changing the medium (Figure 6).
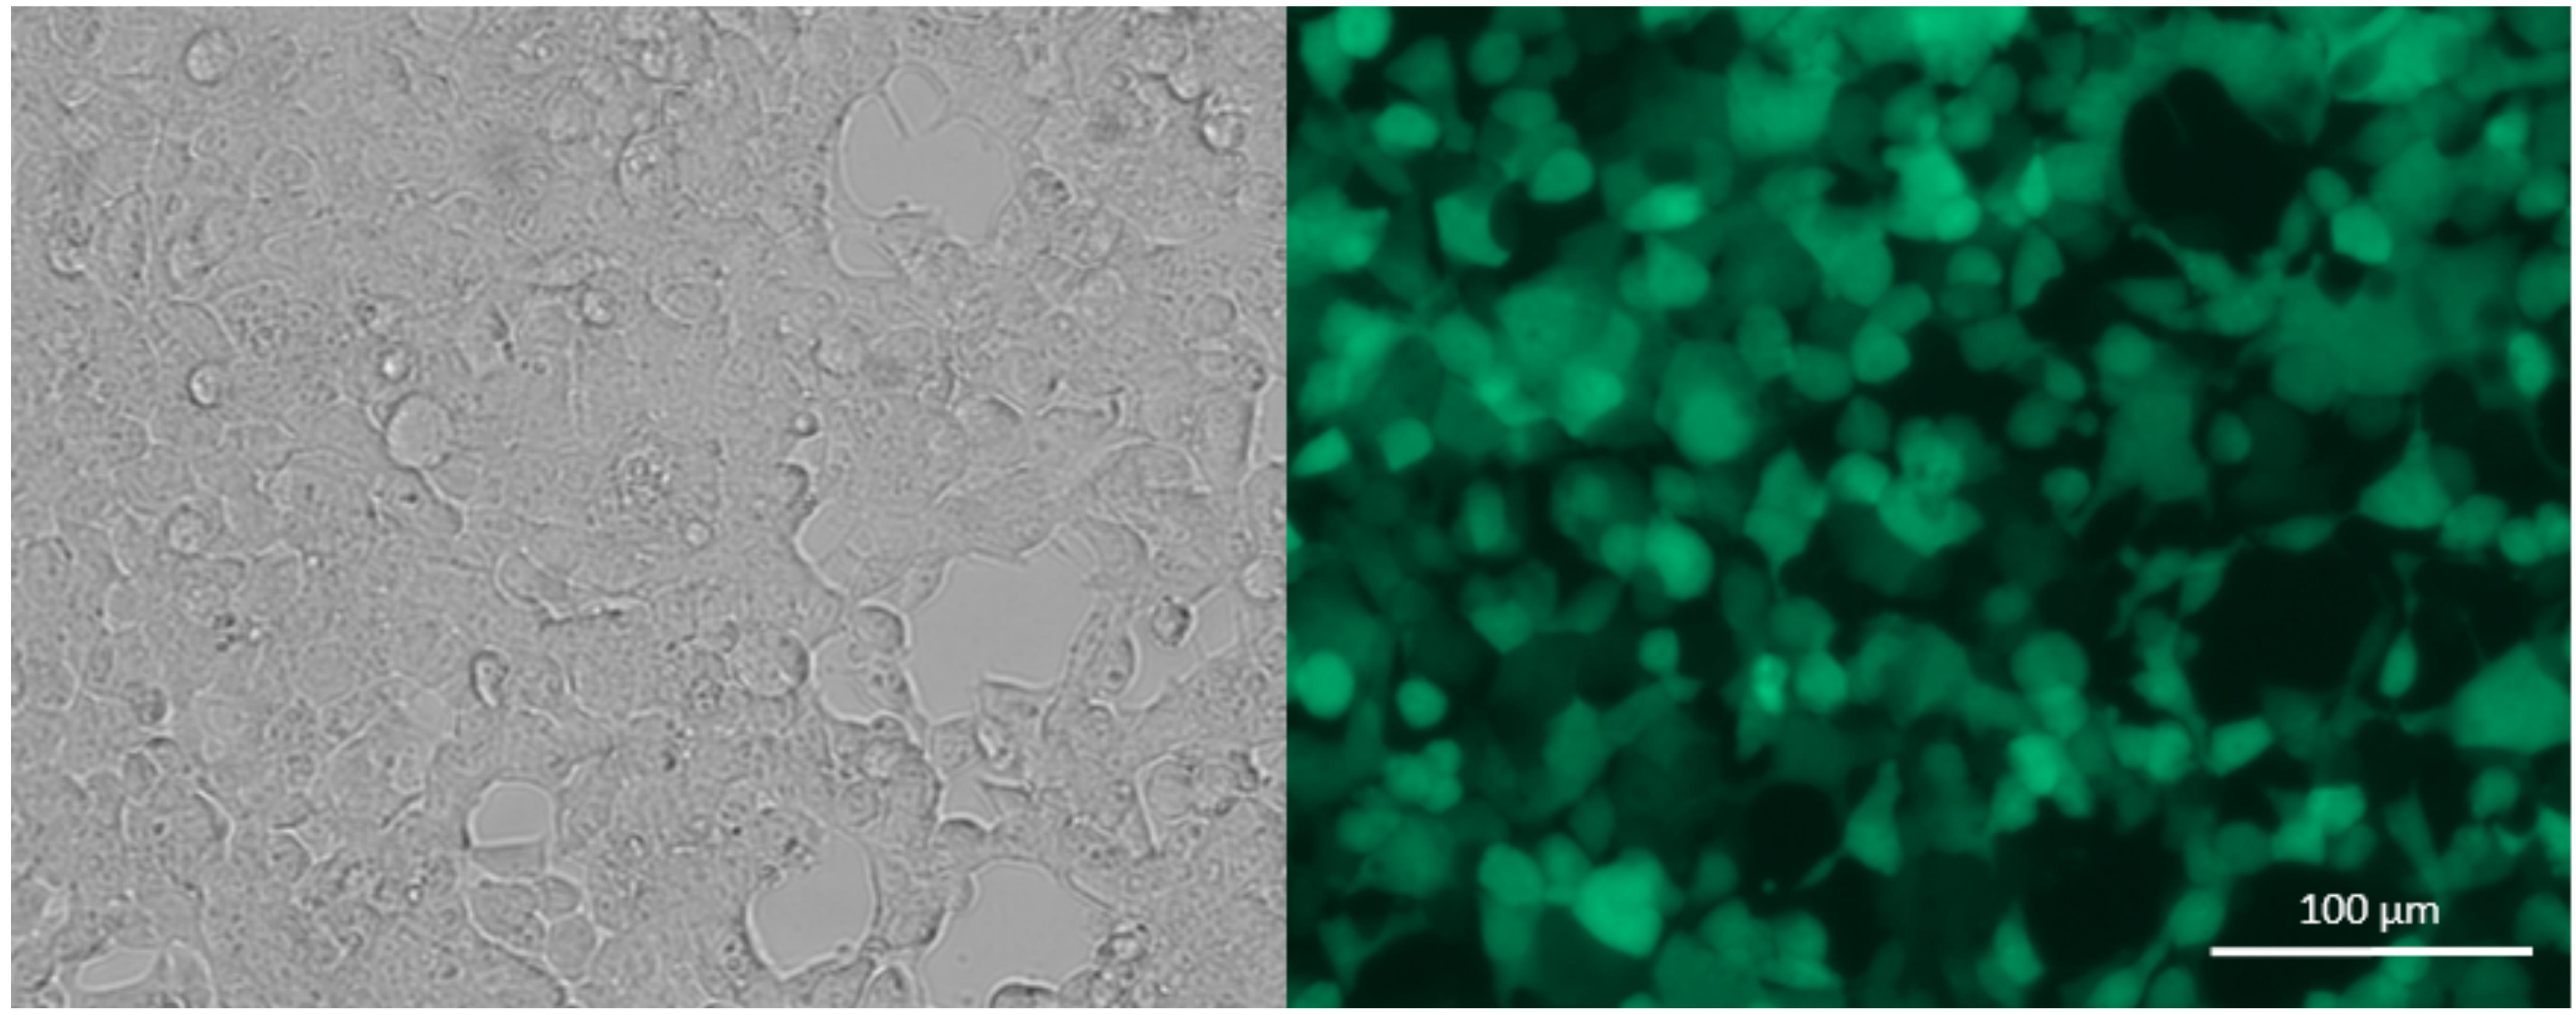
Figure 6. Bright field (left) and fluorescence (right) microscope picture of Lenti-X cells 24 h post transfection (10×), showing expression of GFP
Day 4/5:
To harvest virus particles, carefully transfer 150 µL of supernatant from Lenti-X cells to a 96-well plate, store at 4 °C, and add 170 µL per well of the same medium to Lenti-X cells for an optional second harvest on the next day. Pool the second with the first harvest and freeze viruses in 100 µL of aliquots at -80 °C.
Note: The infectious capacity of lentiviral particles may be reduced upon freezing. However, this step efficiently eliminates Lenti-X cells, which might eventually be present in the supernatant and contaminate target cells with Lenti-X cells during the transduction process.
Transduction of target suspension cells and setup of the flow cytometry–based competition assay
Count target cells and collect the required number of cells by centrifugation.
Note: The supernatant obtained after centrifugation and filtering with a 0.45 µm filter can be kept at 4 °C and used as conditioned medium to supplement cells after the transduction. This is recommended for cells that are particularly susceptible to stress upon external perturbations, such as lentiviral infection. Optionally, the medium can be supplemented with 20% FBS during the transduction process to increase cell viability.
Resuspend cell pellet in medium to reach a concentration of 2 × 10⁶ cells/mL and transfer 100 µL per well to a flat-bottom 96-well plate (= 2 × 10⁵ cells/well).
Pre-dilute polybrene to 100 µg/mL in the growth medium of target cells, add 8 µL to 100 µL of virus, and add the mix (virus + polybrene) to each 100 µL of cells (polybrene final = 4 µg/mL).
Centrifuge the plate in an aerosol-tight bucket at 1,000 × g for 90 min. After the spinoculation, transfer the plate to an incubator.
Notes: For an optional second spinoculation, carefully remove 100 µL per well of supernatant, defrost new 100 µL aliquots of virus, add fresh pre-diluted polybrene, add the mix to cells, and centrifuge again.
For adherent cells, the addition of polybrene and the spinoculation may be omitted.
Remove the virus 6–24 h after the last spinoculation. Centrifuge the plate (300 × g, 5 min) and carefully remove most of the supernatant. Optionally wash cells with PBS before resuspending them in fresh growth medium.
Culture the cells as usual.
Note: Cells may show reduced growth and increased cell death for a few days post transduction.
After three days, determine the percentage of transduced cells per well by flow cytometry, e.g., via a fluorescent reporter protein such as GFP. After successful transduction, measure the percentage of GFP-positive cells per well every two to three days and split cultures as required.
Note: In addition to monitoring GFP signal, the analysis can be extended to any other parameter that is accessible with flow-based measurements, such as differentiation, apoptosis, and cell cycle analysis to acquire deeper insights into the cellular effects of gene knockout.
The typical monitoring time is two to four weeks post transduction but will depend on the growth characteristics of the target cell line and the effect of the knockout. We recommend transferring the cells to 24-well plates for culturing and monitoring the percentage of GFP-positive cells. Cultures can be efficiently split using a 12-channel pipette using every second tip only. During each splitting event, transfer an aliquot of cells to a 96-well plate and analyze on the IQue Screener Plus flow cytometer or a similar device.
Notes:
Transduction rates between 20%–80% are recommended; the optimum is 50%.
Test the procedure with only a few constructs (e.g., a set of controls) and adjust if required.
Optional changes include:
Adjust concentration of Lenti-X cells (e.g., 1 × 10⁴ –2 × 10⁴ cells per well).
Adjust concentration of target cells (e.g., scale down to 1 × 10⁵ cells per well).
Adjust dilutions of virus (dilute virus more or less to decrease or increase transduction rates, respectively).
Increase/decrease number of spinoculations.
Scale up to a 24-well format for transfection and/or transduction.
In general, every flow cytometer equipped with the required laser and detector system to measure the reporter protein can be used for monitoring the percentage of transduced cells. We recommend a device with a plate loader module to most efficiently analyze high numbers of samples that are usually present in an arrayed CRISPR/Cas9 screen.
Analysis of the competition assay
In the Forecyt software of the IQue Screener Plus, use the gating strategy shown in Figure 7 to identify the number of transduced cells as “percentage of GFP-positive cells of singlets.”
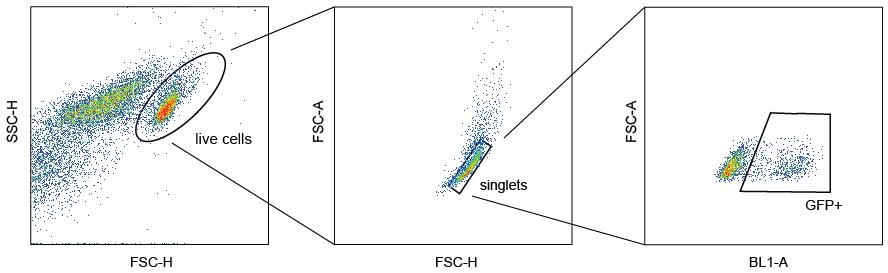
Figure 7. Gating strategy for identifying GFP-positive cells as the percentage of all live singlets per wellGenerate a heat map of each measurement plate with GFP-positive cells as percentage of all singlet cells for each well. These values can be exported via the metrics function in a .csv format and further analyzed in Microsoft Excel.
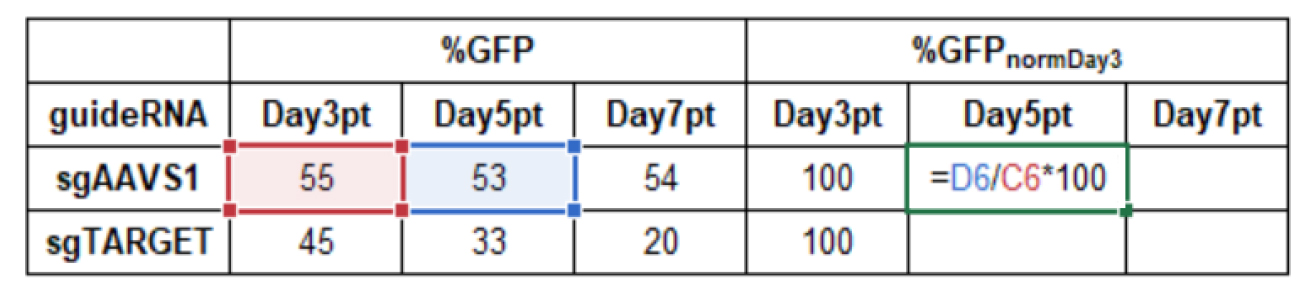
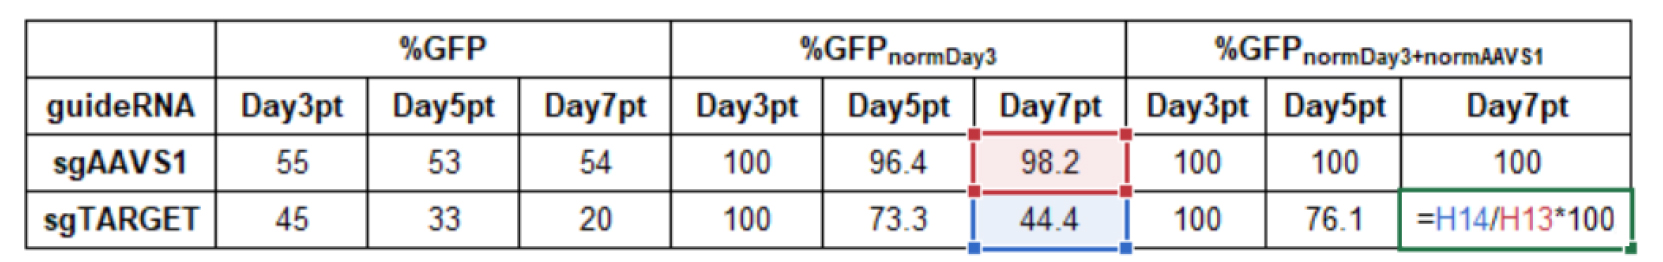
In Microsoft Excel, normalize all data to the first measurement, e.g., at day 3 post-transduction (Day3pt) and to a negative control (sgAAVS1).
Note: It can happen that the percentage of GFP-positive cells still rises after Day3pt. If this is the case, normalize to a later time point, e.g., Day5pt or Day7pt.
Normalization to measurement start Day3pt (normDay3):
Formula:
%GFPnormDay3= %GFPDayXpt/%GFPDay3pt *100Example calculation in Microsoft Excel:
Normalization to control sgAAVS1 (normAAVS1):
Formula:
%GFP(Sample, normDay3 + normAAVS1)= %GFP(Sample,normDay3)/%GFP(sgAAVS1,normDay3) *100Example calculation in Microsoft Excel:
Data from a limited number of samples can be presented in bar charts (Figure 8). Targeting a gene essential for cell proliferation will result in a decrease of the percentage of GFP-positive cells over time. Targeting of a non-essential gene will result in unchanged percentages of GFP-positive cells.
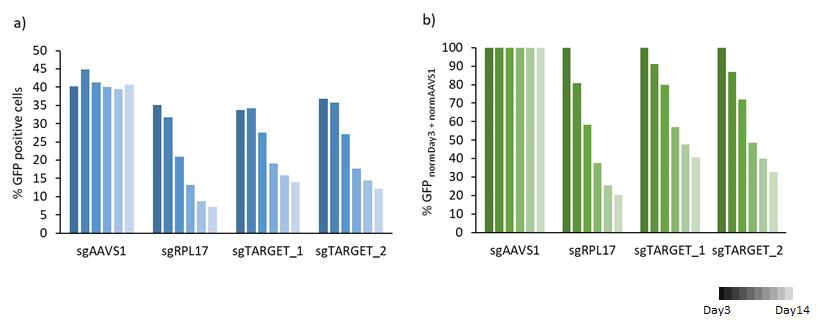
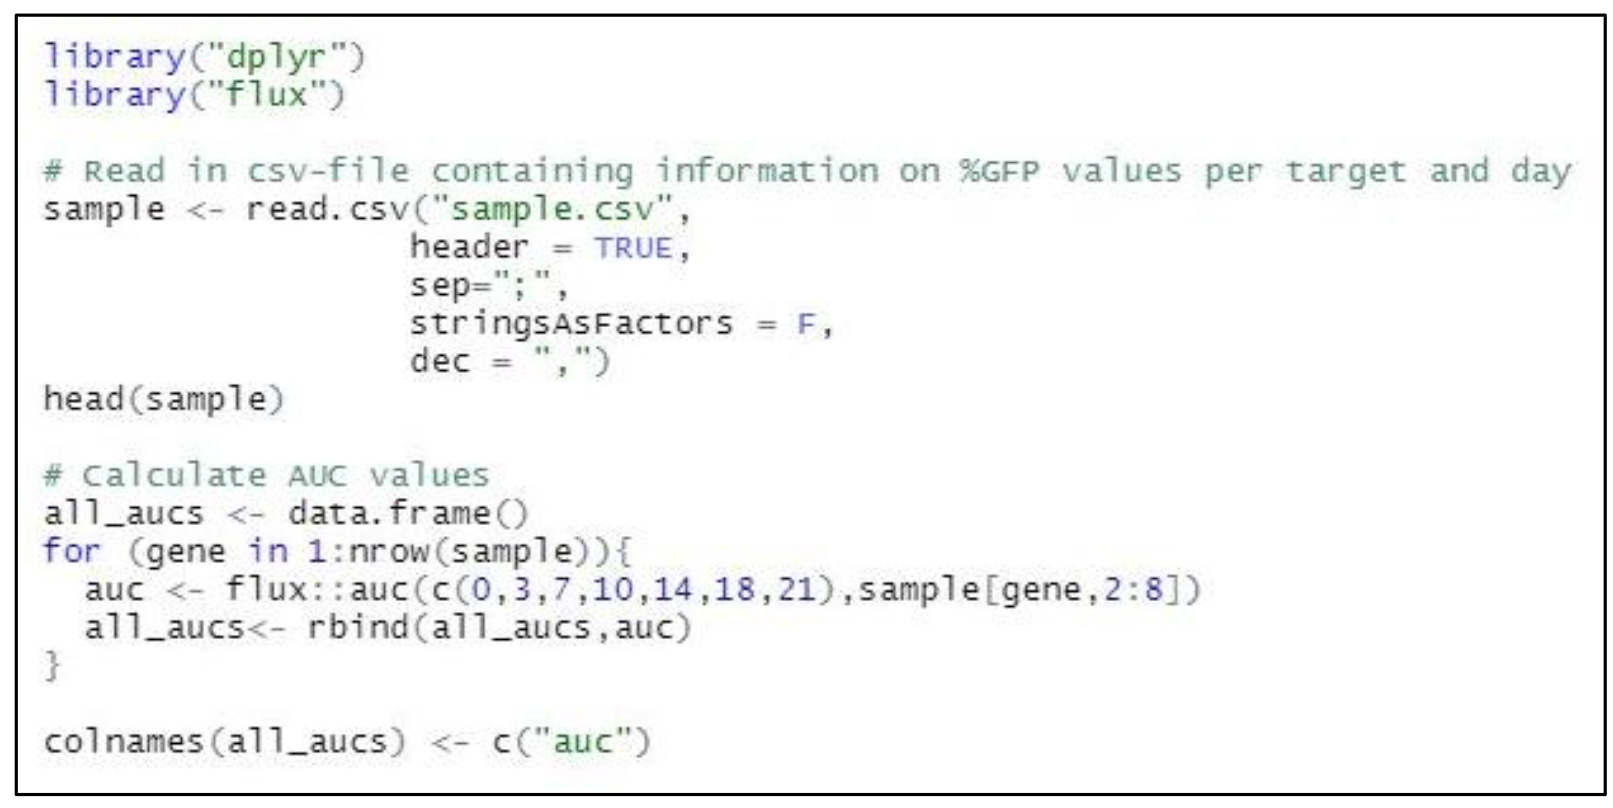
Figure 8. Bar chart diagram of a) raw data of % GFP-positive cells over time and b) normalized to Day3 post-transduction and to sgAAVS1 (negative control)A heat map format can be used to present the results of a big data set in a comprehensible way (Figure 9a). To further condense the results, it is possible to calculate the area under the curve (AUC) for each gRNA using the following R script.
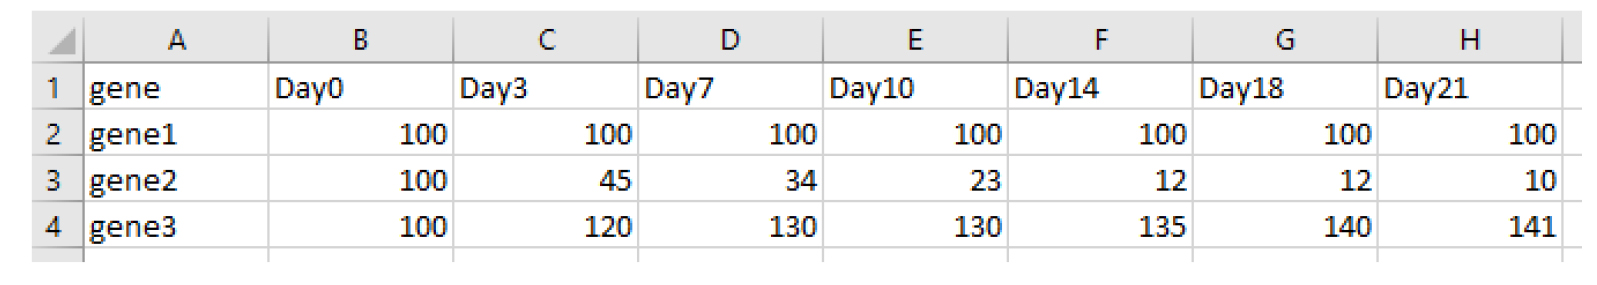
Create an excel file containing percentages of GFP values normalized to the measurement start point and a negative control (e.g., sgAAVS1) with the following structure and save it as a .csv file.
In R studio, apply the following code to calculate AUC values for each gene/target. Adjust file name, day numbers, and column numbers according to your data.
Example of a heat map with AUC values is shown inFigure 9b.
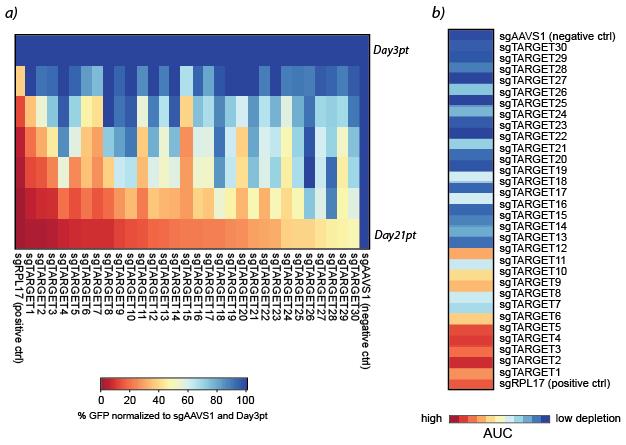
Figure 9. Heat maps representing a) %GFP normalized to sgAAVS1 and Day3pt for each target and b) area under the curve (AUC) values for each target
Acknowledgments
This protocol was adapted from previous work (Schmidt et al., 2019; Heyes et al., 2021). We thank all members of the Grebien laboratory for discussions. This project has received funding from the European Union’s Horizon 2020 research and innovation program (Marie Sklodowska-Curie grant agreement No 813091), the Austrian Science Fund (projects P-35628 and TAI-490 to FG), and a grant from the Fellinger Krebsforschungsverein. ST is a recipient of a DOC Fellowship of the Austrian Academy of Sciences.
Competing interests
The authors declare no competing interests.
References
- Arroyo, J. D., Jourdain, A. A., Calvo, S. E., Ballarano, C. A., Doench, J. G., Root, D. E., Mootha, V. K. (2016). A genome-wide CRISPR death screen identifies genes essential for oxidative phosphorylation. Cell Metab 24(6):875-885.
- Bajaj, J., Hamilton, M., Shima, Y., Chambers, K., Spinler, K., Van Nostrand, E. L., Yee, B. A., Blue, S. M., Chen, M., Rizzeri, D., et al. (2020). An in vivo genome-wide CRISPR screen identifies the RNA-binding protein Staufen2 as a key regulator of myeloid leukemia. Nat Cancer 1(4): 410-422.
- Behan, F. M., Iorio, F., Picco, G., Gonçalves, E., Beaver, C. M., Migliardi, G., Santos, R., Rao, Y., Sassi, F., Pinnelli, M., et al. (2019). Prioritization of cancer therapeutic targets using CRISPR-Cas9 screens. Nature 568(7753): 511-516.
- Cao, Z., Budinich, K. A., Huang, H., Ren, D., Lu, B., Zhang, Z., Chen, Q., Zhou, Y., Huang, Y. H., Alikarami, F., et al. (2021). ZMYND8-regulated IRF8 transcription axis is an acute myeloid leukemia dependency. Mol Cell 81(17): 3604-3622 e3610.
- Chan, E. M. , Shibue, T., McFarland, J. M., Gaeta, B., Ghandi, M., Dumont, N., Gonzalez, A., McPartlan, J. S., Li, T., Zhang, Y., et al. (2019). WRN helicase is a synthetic lethal target in microsatellite unstable cancers. Nature 568(7753): 551-556.
- Dong, C., Fu, S., Karvas, R. M., Chew, B., Fischer, L. A., Xing, X., Harrison, J. K., Popli, P., Kommagani, R., Wang, T., et al. (2022). A genome-wide CRISPR-Cas9 knockout screen identifies essential and growth-restricting genes in human trophoblast stem cells. Nat Commun 13(1): 2548.
- Einstein, J. M., Perelis, M., Chaim, I. A., Meena, J. K., Nussbacher, J. K., Tankka, A. T., Yee, B. A., Li, H., Madrigal, A. A., Neill, N. J., et al. (2021) Inhibition of YTHDF2 triggers proteotoxic cell death in MYC-driven breast cancer. Mol Cell 81(15):3048-3064.e9.
- Heyes, E., Schmidt, L., Manhart, G., Eder, T., Proietti, L. and Grebien, F. (2021). Identification of gene targets of mutant C/EBPalpha reveals a critical role for MSI2 in CEBPA-mutated AML. Leukemia 35(9): 2526-2538.
- Lin, A. and Sheltzer, J. M. (2020). Discovering and validating cancer genetic dependencies: approaches and pitfalls. Nat Rev Genet 21(11): 671-682.
- Michlits, G., Jude, J., Hinterndorfer, M., de Almeida, M., Vainorius, G., Hubmann, M., Neumann, T., Schleiffer, A., Burkard, T. R., Fellner, M., et al. (2020). Multilayered VBC score predicts sgRNAs that efficiently generate loss-of-function alleles. Nat Methods 17(7): 708-716.
- Panda, S. K., Wigerblad, G., Jiang, L., Jimenez-Andrade, Y., Iyer, V. S., Shen, Y., Boddul, S. V., Guerreiro-Cacais, A. O., Raposo, B., Kasza, Z., et al. (2020). IL-4 controls activated neutrophil FcgammaR2b expression and migration into inflamed joints. Proc Natl Acad Sci U S A 117(6): 3103-3113.
- Schmidt, L., Heyes, E., Scheiblecker, L., Eder, T., Volpe, G., Frampton, J., Nerlov, C., Valent, P., Grembecka, J. and Grebien, F. (2019). CEBPA-mutated leukemia is sensitive to genetic and pharmacological targeting of the MLL1 complex. Leukemia 33(7): 1608-1619.
- Schmoellerl, J., Barbosa, I. A. M., Minnich, M., Andersch, F., Smeenk, L., Havermans, M., Eder, T., Neumann, T., Jude, J., Fellner, M., et al. (2022). EVI1 drives leukemogenesis through aberrant ERG activation. Blood. doi: 10.1182/blood.2022016592.
- Seong, B. K. A., Dharia, N. V., Lin, S., Donovan, K. A., Chong, S., Robichaud, A., Conway, A., Hamze, A., Ross, L., Alexe, G., et al. (2021). TRIM8 modulates the EWS/FLI oncoprotein to promote survival in Ewing sarcoma. Cancer Cell 39(9): 1262-1278.e7.
- Yu, J. S. L. and Yusa, K. (2019). Genome-wide CRISPR-Cas9 screening in mammalian cells. Methods 164-165: 29-35.
- Zhang, Y., Wang, J., Ruan, Y., Yang, Y., Cheng, Y., Wang, F., Zhang, C., Xu, Y., Liu, L., Yu, M., et al. (2022). Genome-Wide CRISPR Screen Identifies Puf60 as a Novel Stemness Gene of Mouse Embryonic Stem Cells. Stem Cells Dev 31(5-6): 132-142.
- Zhu, X. G., Chudnovskiy, A., Baudrier, L., Prizer, B., Liu, Y., Ostendorf, B. N., Yamaguchi, N., Arab, A., Tavora, B., Timson, R., et al. (2021). Functional Genomics In Vivo Reveal Metabolic Dependencies of Pancreatic Cancer Cells. Cell Metab 33(1): 211-221 e216.
- Zhu, Y., Feng, F., Hu, G., Wang, Y., Yu, Y., Zhu, Y., Xu, W., Cai, X., Sun, Z., Han, W., Ye, R., Qu, D., Ding, Q., Huang, X., Chen, H., Xu, W., Xie, Y., Cai, Q., Yuan, Z. and Zhang, R. (2021). A genome-wide CRISPR screen identifies host factors that regulate SARS-CoV-2 entry. Nat Commun 12(1): 961.
Article Information
Copyright
© 2022 The Authors; exclusive licensee Bio-protocol LLC.
How to cite
Proietti, L., Manhart, G., Heyes, E., Troester, S. and Grebien, F. (2022). Arrayed CRISPR/Cas9 Screening for the Functional Validation of Cancer Genetic Dependencies. Bio-protocol 12(24): e4577. DOI: 10.21769/BioProtoc.4577.
Category
Cancer Biology > General technique > Molecular biology technique
Bioinformatics and Computational Biology
Molecular Biology > DNA > DNA cloning
Do you have any questions about this protocol?
Post your question to gather feedback from the community. We will also invite the authors of this article to respond.