- Protocols

- Articles and Issues
- For Authors
- About
- Become a Reviewer

Cell-derived Matrix Assays to Assess Extracellular Matrix Architecture and Track Cell Movement
Published: Vol 12, Iss 24, Dec 20, 2022 DOI: 10.21769/BioProtoc.4570 Views: 3422
Reviewed by: Yoshihiro AdachiSalah BoudjadiAnonymous reviewer(s)
Original research article
The authors used this protocol in:

Oct 2021
Advertisement


Protocol Collections
Comprehensive collections of detailed, peer-reviewed protocols focusing on specific topics


Abstract
The extracellular matrix (ECM) is a non-cellular network of macromolecules, which provides cells and tissues with structural support and biomechanical feedback to regulate cellular function, tissue tension, and homeostasis. Even subtle changes to ECM abundance, architecture, and organization can affect downstream biological pathways, thereby influencing normal cell and tissue function and also driving disease conditions. For example, in cancer, the ECM is well known to provide both biophysical and biochemical cues that influence cancer initiation, progression, and metastasis, highlighting the need to better understand cell–ECM interactions in cancer and other ECM-enriched diseases. Initial cell-derived matrix (CDM) models were used as an in vitro system to mimic and assess the physiologically relevant three-dimensional (3D) cell–ECM interactions. Here, we describe an expansion to these initial CDM models generated by fibroblasts to assess the effect of genetic or pharmacological intervention on fibroblast-mediated matrix production and organization. Additionally, we highlight current methodologies to quantify changes in the ultrastructure and isotropy of the resulting ECM and also provide protocols for assessing cancer cell interaction with CDMs. Understanding the nature and influence of these complex and heterogeneous processes can offer insights into the biomechanical and biochemical mechanisms, which drive cancer development and metastasis, and how we can target them to improve cancer outcomes.
Background
The extracellular matrix (ECM) is the non-cellular compartment of all tissues; it is fundamental for cellular processes, providing biomechanical and biochemical cues, which can be sensed by cells activating downstream signaling pathways that can affect cell behavior (Vennin et al., 2017; Cox, 2021; Romani et al., 2021). The ECM is a highly regulated scaffold whose function is dependent on its precise molecular composition and assembly of fibrillar tissue. The highly regulated ECM is an adaptive network of fibers that respond to external forces and tensional strains, whilst also providing cells with biomechanical feedback regulating homeostasis and normal tissue function (Cox, 2021). However, in cancer, the co-option of this tightly organized infrastructure, including ECM deposition and remodeling, can trigger oncogenic signaling, leading to increased cell motility, proliferation, survival, and metastasis (Nicolle et al., 2017; Neesse et al., 2019;Cox, 2021).
Although the cancer stroma was initially thought to predominantly stimulate tumor progression, recently it was shown to also restrain cancer cells (Rhim et al., 2014; Özdemir et al., 2014). Therefore, a fine-tuned approach to target the pro-tumorigenic functions of the stroma while maintaining its anti-tumorigenic roles may provide potential for anti-cancer therapies. Cancer associated fibroblasts (CAFs) are a prominent stromal cell type, which can be activated and educated by cancer cells (Pereira et al., 2019; Sahai et al., 2020). Their ability to synthesize and remodel ECM is a key driver of tumor progression. As such, there is a clear need to study the influence of the ECM on cancer cell behavior and assess the potential of ECM-targeted therapies to alter cellular locomotion and chemosensitivity.
Initial methodologies and protocols to generate cell-derived matrices (CDMs) were designed to better understand the complexity of cell-matrix adhesion and cell surface structures in a 2.5D to 3D context (Cukierman et al., 2001; Cukierman, 2002; Erami et al., 2016; Franco-Barraza et al., 2016). To decipher the multifaceted influence of the ECM on cancer progression and therapeutic response, CDMs can be used to characterize the effect that genetic or pharmacological manipulation have on ECM ultrastructure. Here, we provide a step-by-step protocol for the generation of CDMs and subsequent quantification of matrix abundance, architecture, and organization (Figure 1). This protocol was utilized in our recent publication to assess fine-tuned manipulation of the matrix following focal-adhesion kinase inhibition, to reduce cancer cell locomotion and improve the efficiency of chemotherapy (Murphy et al., 2021). The protocols presented below contain steps that can be modified in a cell type–specific manner, for normal fibroblasts as well as CAFs. We also highlight the utility of CDMs to assess the potential of anti-fibrotic agents to alter ECM production and remodeling, which has recently shown promise to reduce metastasis and improve chemotherapy performance in a range of cancer types (Miller et al., 2015; Rath et al., 2018; Vennin et al., 2017, 2019; Boyle et al., 2020; Wu et al., 2020; Murphy et al., 2021). Furthermore, we provide protocols for assessing cancer cell behavior when seeded on CDMs, which can provide insight into cancer cell proliferation, survival, and single vs. collective cell migration in an ECM-rich environment (Figure 2). Here, CDMs can provide a rapid and pliable readout of stromal and cancer response to genetic and pharmacological intervention in vitro, which can be used to inform subsequent in vivo studies.

Figure 1. Schematic representation of cell-derived matrix (CDM) production and cancer cell seeding on top of CDMs following fibroblast decellularization. Here, fibroblasts are seeded and allowed to grow to confluence (a.) prior to supplementation with ascorbic acid to enhance matrix production (b.). Following matrix production, fibroblasts are decellularized from the matrix (c.) and cancer cells may be seeded on top (d.). As an example timeline (e.), telomerase-immortalized fibroblasts (TIFs) are provided with ascorbic acid 24 h after cell seeding to allow matrix production for six days, prior to decellularization on day 7, followed by matrix analysis or cancer cell seeding and tracking [here shown as the example of pancreatic cancer cells isolated from the KPC ( Kras G12D/+ ; p53 R172H/+ ; Pdx-1Cre ) mouse model of pancreatic cancer (Morton et al., 2010; Murphy et al., 2021)]. Parts a-d are adapted from Murphy et al. (2021), CC BY 4.0 ( https://creativecommons.org/licenses/by/4.0/ ).
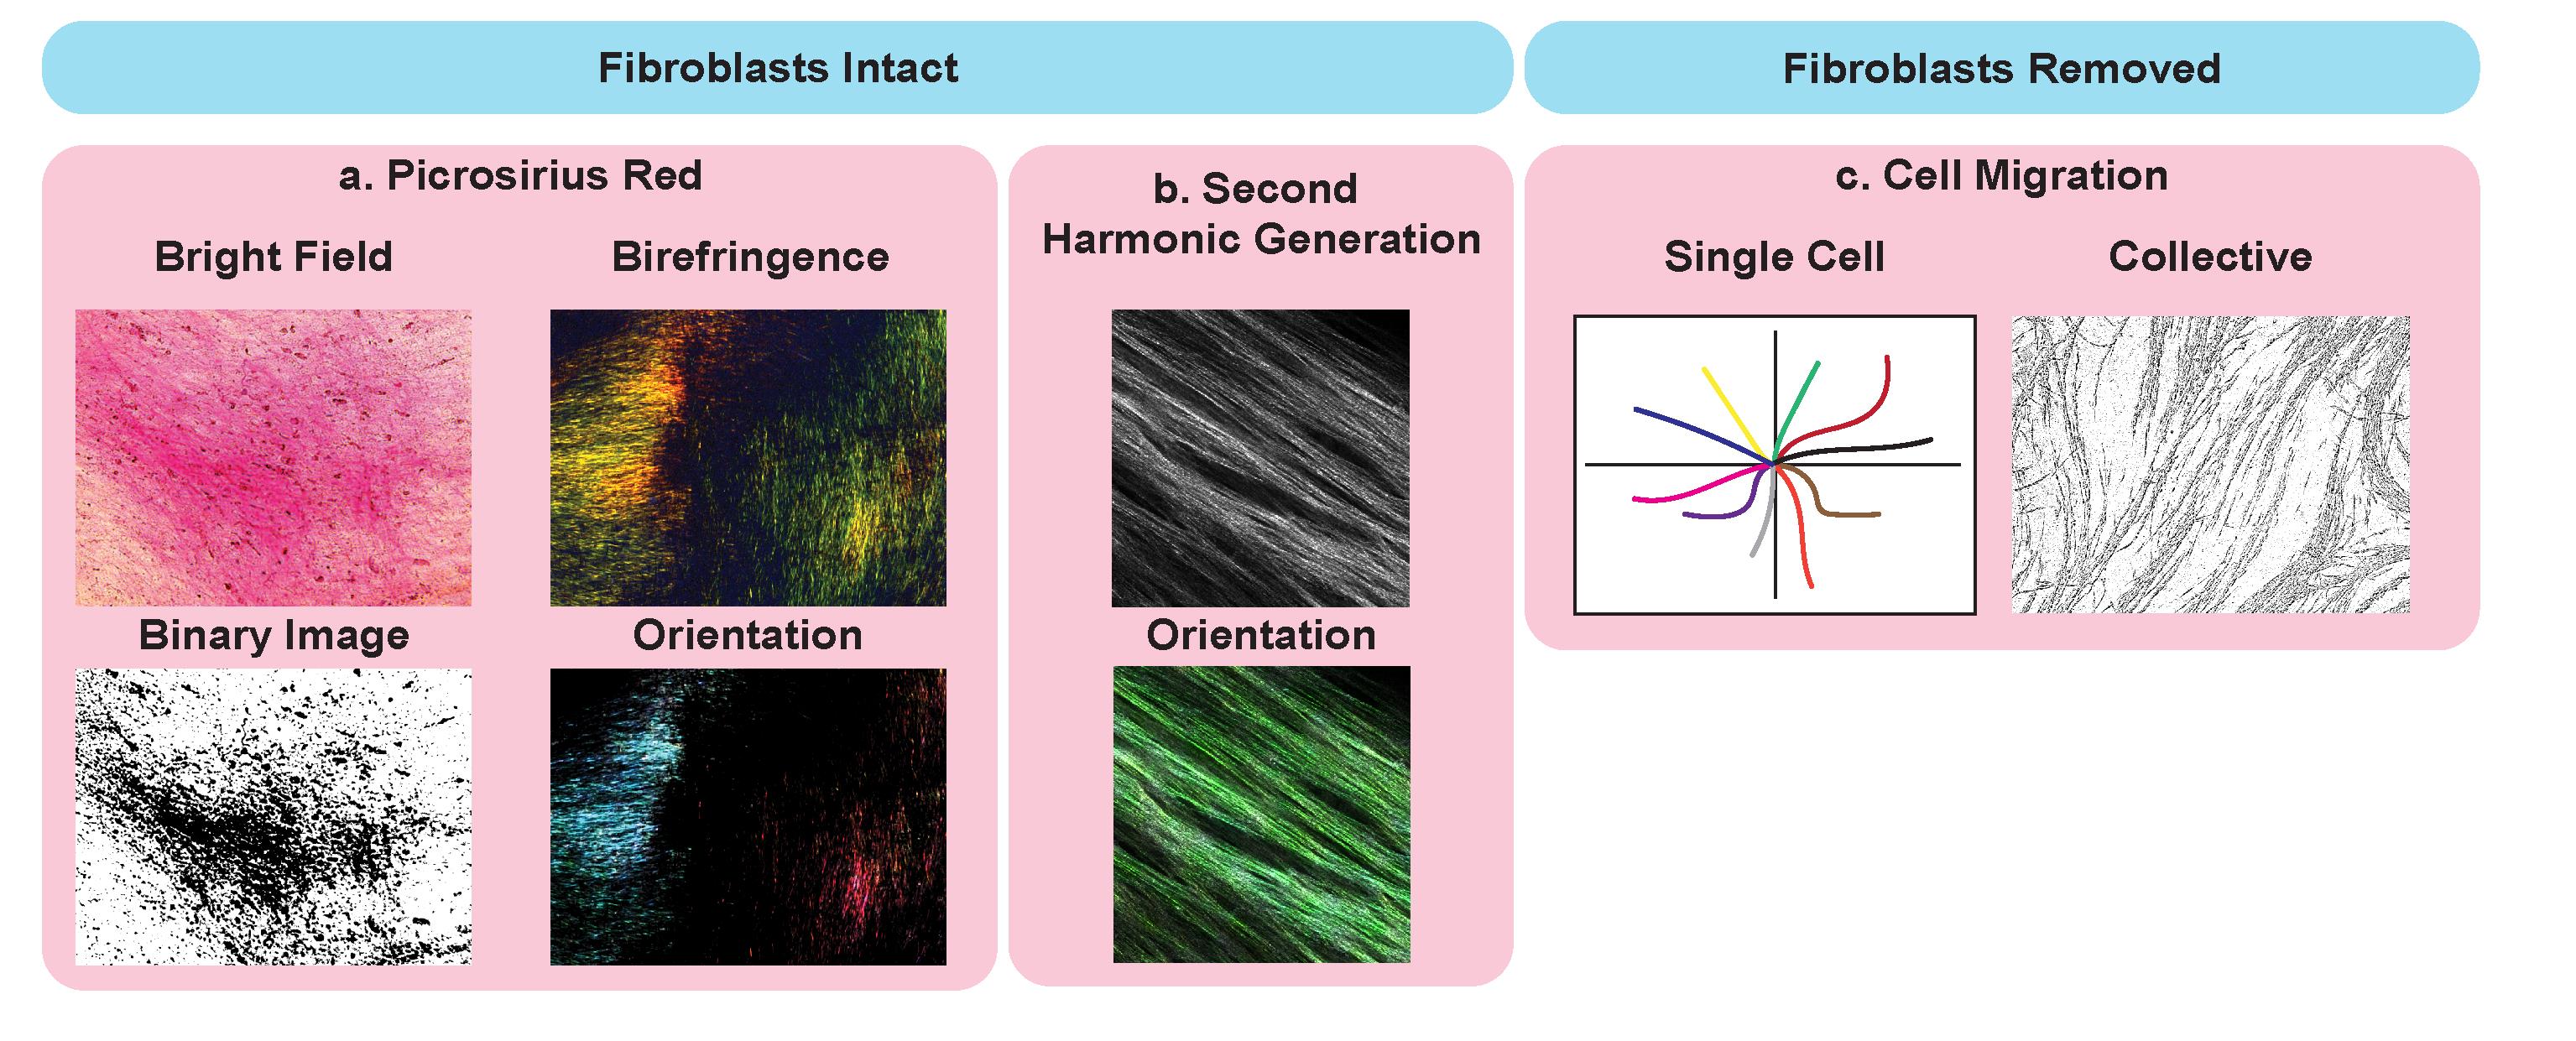
Figure 2. Potential application of cell-derived matrices for analysis of matrix ultrastructure. Examples with intact fibroblasts, including picrosirius red staining (a.) imaged using bright field microscopy (top left), binary overlay (bottom left), and by polarized light (birefringence, top right) to assess collagen I and III abundance and orientation (bottom right). Second-harmonic generation (SHG) (b.) imaging (top) and analysis of fiber orientation (bottom). Applications of CDMs with fibroblast removed and cancer cells seeded on top to assess single cancer cell migration (left) and collective migration (right).
Materials and Reagents
For CDMs
12-well plate
Cultured fibroblasts [e.g., telomerase-immortalized fibroblasts (TIFs) or CAFs]
Trypsin/EDTA solution (Life Technologies, catalog number: 15400)
Fibroblast growth medium [specific to fibroblast line; e.g., for TIFs: DMEM (Thermo Fisher Scientific, catalog number: 11995065) supplemented with 10% FBS]
Phosphate-buffered saline (PBS) (Life Technologies, catalog number: 14190)
Gelatin (Sigma-Aldrich, catalog number: G1393), store at 4 °C
10% neutral buffered formalin (Australian Biostain P/L, catalog number: ANBFC.10L)
Glycine (Sigma-Aldrich, catalog number: G7126)
(+)-Sodium L-ascorbate (Sigma-Aldrich, catalog number: A7631), make fresh
DNase I (Roche, catalog number: 05025), aliquot and store at -20 °C (do not freeze-thaw)
Fungizone (Amphotericin B, Life Technologies, catalog number: 15290)
Penicillin/streptomycin (pen/strep) (Thermo Fisher Scientific, catalog number: 15070-063)
70% ethanol
0.2% sterile gelatin (see Recipes)
1 M sterile glycine (see Recipes)
Ascorbic acid (1,000×), prepare fresh (see Recipes)
Extraction buffer (see Recipes)
Triton X-100 (Sigma-Aldrich, catalog number: 9284)
Ammonium hydroxide
Sodium deoxycholate (Sigma-Aldrich, catalog number: D6750)
Supplemented PBS (see Recipes)
Calcium chloride (Chem Supply, catalog number: CA033)
Magnesium sulfate (Chem Supply, catalog number: MA048)
Supplemented PBS with antibiotics and antifungals (see Recipes)
For picrosirius red staining
0.1% picrosirius red stain (Abcam, catalog number: ab150681)
Phosphomolybdic acid hydrate (Sigma-Aldrich, catalog number: 221856)
Glacial acetic acid (Chem Supply, catalog number: AA009-2.5L-P)
Reverse Osmosis (RO) water
0.02% phosphomolybdic acid (see Recipes)
10% phosphomolybdic acid stock (see Recipes)
Acidified water (see Recipes)
Equipment
12-well glass bottom dishes (Celvis, catalog number: D35-20/4.5N)
Sterile glass bottles (for storage of gelatin, extraction buffer, and glycine)
Picrosirius red staining kit (Australian Biostain, APSRA, 500 mL)
Software
TWOMBLI (Wershof et al., 2021): https://github.com/wershofe/TWOMBLI
FibrilTool (Boudaoud et al., 2014): https://www.quantitative-plant.org/software/fibriltool
Automated ECM fiber orientation and alignment (Mayorca-Guiliani et al., 2017): https://github.com/TCox-Lab/Collagen_Orientation
Automated picrosirius red and collagen birefringence analysis using polarized light (Vennin et al., 2019): https://github.com/TCox-Lab/PicRed_Biref
Cell Tracker (not only) for Dummies (Piccinini et al., 2016): http://celltracker.website/about-celltracker.htmL
Procedure
Under sterile tissue culture conditions, prepare tissue culture glass bottom dishes
Note: Although this step is not strictly necessary, it is recommended to stabilize the anchoring of the matrices to the glass surface of the dish.
Coat glass bottom dishes (in a 12-well plate) with 1 mL of 0.2% sterile gelatin and incubate for 60 min at 37 °C.
Wash dishes twice with warm (37 °C) PBS.
Crosslink gelatin layer with 1 mL of 10% neutral buffered formalin and incubate for 30 min at room temperature.
Wash twice with warm (37 °C) PBS.
Quench the formalin crosslinker by the addition of 1 M sterile glycine and incubation for 20 min at room temperature.
Wash twice with warm (37 °C) PBS.
Add growth media to the dishes and incubate for 30 min at 37 °C.
Use immediately or store in supplemented PBS with 2.5 µg/mL fungizone and 5% pen/strep sealed with parafilm to prevent evaporation for up to four weeks.
After storing the coated dishes:
Wash twice with warm (37 °C) PBS.
Add growth media to the dishes and incubate for 30 min at 37 °C before proceeding to Procedure B.
Plating fibroblasts and matrix production
Note: This will vary depending on cell type.
Detach and harvest fibroblasts as per established protocols for the specific cell line.
Dilute fibroblasts and plate as appropriate:
This will vary depending upon fibroblast type and if the cell line has overcome contact inhibition of proliferation. For lines that stop growing upon contact, such as TIFs, appropriate cell numbers should be plated to reach 90%–100% confluence in 12–24 h. For lines that continue to grow upon contact, such as pancreatic cancer CAFs (Vennin et al., 2019), appropriate cell numbers should be plated to reach 30%–40% confluence in 12–24 h. This should be determined prior to the experiment for each fibroblast cell line. For example, TIFs should be seeded at 2.5 × 10⁵ cells per well of a 12-well plate the day prior to ascorbic acid supplementation to then obtain a CDM after six days (please also seeFigure 1e).
Culture fibroblasts overnight at 37 °C. The oxygen content is dependent on the specific cell line being used.
Replace media with fresh growth media supplemented with 50 µg/mL ascorbic acid and appropriate drug if applicable.
Treatment timing will vary depending on fibroblast type: for lines that stop growing upon contact, wait until the cells are confluent to begin treatment. If cells continue to grow upon contact, then commence treatment when cells are 30%–40% confluent. This should be determined for each fibroblast cell line.
For some fibroblast cell lines, it is beneficial to treat with 100–500 µg/mL of ascorbic acid on Day 1 of supplementation, switching to 50 µg/mL to increase matrix thickness. This should be determined individually for each cell line prior to the experiment.
Change ascorbic acid media every second day. If treating cells with a pharmacological agent, refresh both drug and ascorbic acid at the same time.
For cell lines that require conditioned media, remove and replenish half of the media volume with fresh media supplemented with 100 µg/mL of ascorbic acid to achieve a final concentration of 50 µg/mL.
Culture for 6–10 days depending on the rate of matrix production.
The longer matrices are left to develop the more likely they are to detach. The ideal culturing and matrix production should be determined for each independent fibroblast cell line prior to the experiment. Time course assays are recommended to determine this timeframe.
From here, CDMs can either be used for the analysis of ECM ultrastructure (see Data analysis for further detail) or denuded to remove fibroblasts (Figures 1, 2). ECM ultrastructure analysis is discussed in step B7. We recommend leaving the fibroblasts intact to ensure that cell–matrix interactions of both fibroblasts and matrix are upheld.
For analysis of the ECM by imaging or histological staining:
Second-harmonic generation (SHG) imaging: perform on unfixed matrices with fibroblasts intact to visualize fibrillar collagen I.
Picrosirius red staining/birefringence imaging: fix matrices with intact fibroblasts overnight in 10% neutral buffered formalin, then change to 70% ethanol prior to picrosirius red staining (as per manufacturer’s instructions, see steps i.–v. below) and imaging. CDMs should be imaged immediately.
Incubate CDMS in 0.02% phosphomolybdic acid for 2 min.
Rinse three times with Reverse Osmosis (RO) water.
Stain CDMs with 0.1% picrosirius red solution for 1 h.
Rinse twice with acidified water (10 s for wash 1 and 2 min for wash 2).
Rinse three times with 70% ethanol (store in 70% ethanol for imaging and do not let the CDMs dry out).
For analysis of cancer cell interactions with CDMs, proceed to Procedure C and D .
Denuding fibroblasts
Aspirate media and wash cells twice with PBS.
Gently add pre-warmed extraction buffer, sufficient to cover the cell/matrix layer.
Lyse for roughly 2 min.
Cell lysis is virtually instantaneous but can vary depending on matrix thickness. Leave the extraction buffer on until no intact cells are visible by transmitted light microscopy.
It is not recommended to lyse for more than 5 min as the CDM is delicate and extended incubation time in extraction buffer can cause detachment. From this point onwards, it is also recommended not to use suction for media and buffer changes anymore.
Aspirate extraction buffer and wash twice with supplemented PBS (see Recipes).
Incubate in supplemented PBS with 10 mg/mL DNase I to minimize DNA debris in the CDMs.
Aspirate DNase and wash twice with supplemented PBS.
Use immediately or store at 4 °C in supplemented PBS with antibiotics and antifungals (pen/strep 5% and 0.25 µg/mL fungizone) sealed with parafilm to prevent evaporation for up to two weeks.
Preparation of denuded matrix for plating of cancer cells
If matrices have been stored, allow them to acclimatize to room temperature before washing twice with supplemented PBS. Otherwise, continue directly to step D3.
As per instructions from Franco-Barraza et al. (2016), if you are performing antibody staining following the seeding of cancer cells, it is recommended to block the matrices with BSA. Otherwise, continue to step D3.
Incubate matrices in appropriate growth media for the cancer cells for 30 min at 37 °C.
Remove media and seed cancer cells at the appropriate density:
For example, using KPC pancreatic cancer cells from the KPC (Kras G12D/+; p53 R172H/+; Pdx-1Cre) mouse model of pancreatic cancer, seed at a density of 2.5 × 10⁴ for migration assays or 1 × 10⁵ for biochemical assays per well of a 12-well plate.
For analysis of cell migration, seeding density may have to be further optimized to track single cell or collective cell migration; we recommend tracking cells for 72 h.
Data analysis
For analysis of the ECM by imaging or histological staining:
SHG imaging to visualize fibrillar collagen I (Figure 2b):
Perform SHG imaging using a multiphoton microscope [excitation tuned to a wavelength of 880 nm with detection at 440 nm, as previously performed (Vennin et al., 2017;Wu et al., 2020;Murphy et al., 2021)] equipped with precise z-control capacity, ensuring to acquire:
z-stacks (we recommend 2.52 µm steps, with 512 µm × 512 µm representative fields of view, acquired at 25× magnification and a line average of 4) for intensity-based analysis;
High-resolution single plane images for analysis of the matrix ultrastructure (1,024 µm × 1,024 µm representative fields of view, acquired at 25× magnification and a line average of 64).
Analyze SHG intensity of z-stacks to determine the amount of cross-linked collagen I present in the samples over depth, with z-stack imaging allowing the maximum SHG signal to be obtained.
High-resolution images can then be processed through:
TWOMBLI, as per protocol instructions (Wershof et al., 2021, see Software).
Automated ECM fiber orientation and alignment analysis, to assess the distribution and orientation of collagen fibers (Mayorca-Guiliani et al., 2017).
CDMs can then be formalin-fixed and stained with picrosirius red.
Picrosirius red staining (Figure 2a; this can be performed on CDMs with intact fibroblasts or denuded to reduce background):
Perform polarized light imaging at a high resolution (we recommend 1,024 × 1,024) at 20× zoom (brightfield images can also be acquired but polarized light reduces background noise and provides fibrillar images for further analysis).
Analyze images using:
TWOMBLI, as per protocol instructions (Wershof et al., 2021, see Software).
Potential readouts: High-density matrix, endpoints, curvature, fractal dimension, and branchpoints.
Automated ECM fiber orientation and alignment (Mayorca-Guiliani et al., 2017).
Potential readouts: Fiber orientation and alignment.
Automated picrosirius red and birefringence analysis of collagen I/III using polarized light (Vennin et al., 2019).
Potential readouts: Collagen deposition and maturity of fibrillar bundles; further analysis can be performed using TWOMBLI.
FibrilTool plug-in on ImageJ (Boudaoud et al., 2014). For this tool, it is best to segment the image into separate regions of interest and analyze each region, followed by averaging the results for each image.
Potential readouts: Image anisotropy (organization) and analysis of collagen fibers.
For analysis of cancer cell migration:
Tracking of single cancer cell migration:
Following denuding of the CDM and seeding of cancer cells, collect videos of cellular migratory patterns over time, imaged at 15 min intervals (Video 1). For tracking single cancer cell migration, we recommend having a low density of cells (starting at roughly 5% confluence to ensure single cells can be identified and tracked over time).
Analyze single cell migration using Cell Tracker (not only for) Dummies (Piccinini et al., 2016) and plot polar plots of cell migration (we recommend using the in-built Matlab application to pertain readouts of cell speed, direction, persistence, and total distance).
 Video 1. KPC cell migration across TIF-generated CDMs
Tracking of collective cancer cell migration:
Following denuding of the CDM and seeding of cancer cells, collect videos of cellular migratory patterns over time at 2 h intervals (Video 2). We recommend having a medium density of cells (starting at roughly 30% confluence to ensure that collective cellular patterns can be identified).
Analyze collective cell migration by converting greyscale images to binary images in ImageJ.
Analyze binary images using FibrilTool (Boudaoud et al., 2014). For this tool, it is best to segment the image into separate regions of interest and analyze each individual region, followed by averaging the results for each image to provide an overall analysis of collective cell migration.
Video 2. KPC cell streaming across TIF-generated CDMs
Notes
CDMs are best used immediately rather than after long-term storage: in our hands, SHG signal intensity is stable for up to three days and then reduces over time.
Continued cell proliferation during CDM production can result in the CDM detaching from the surface. For CDM production by fibroblasts that have not overcome contact inhibition, it is recommended to start ascorbic acid supplementation at 30%–40% confluence.
When seeding fibroblasts onto the gelatin-coated dishes, some primary fibroblast lines are sensitive to the gelatin coating process. Here, we recommend an extended incubation at step A7 with twice the normal concentration of FBS to ensure that cells can adhere properly to the base.
For further analysis and methodologies, such as immunofluorescence, please also refer to Franco-Barraza et al. (2016).
Recipes
0.2% sterile gelatin
Reagent Final concentration Amount Gelatin 0.2% (w/v) 8 mL PBS n/a 72 mL Total n/a 80 mL *Filter-sterilize prior to use
1 M sterile glycine
Reagent Final concentration Amount Glycine 1 M 6 g PBS n/a 80 mL Total n/a 80 mL *Filter-sterilize prior to use
Ascorbic acid (1,000×): prepare fresh
Reagent Final concentration Amount (+)-Sodium L-ascorbate 50 mg/mL 0.05 mg PBS n/a 1 mL Total n/a 1 mL *Filter-sterilize prior to use
Extraction buffer
Reagent Final concentration Amount Triton X-100 0.5% (v/v) 400 µL NH4 OH 20 mM 1.6 mL Sodium deoxycholate 1% (v/v) 800 µL PBS n/a 77.2 mL Total n/a 80 mL *Filter-sterilize prior to use
Supplemented PBS
Reagent Final concentration Amount Calcium chloride (CaCL2 ) 1 mM 500 µL Magnesium sulfate (MgSO4 ) 1 mM 500 µL PBS n/a 499 mL Total n/a 500 mL *Filter-sterilize prior to use
Supplemented PBS with antibiotics and antifungals
Reagent Final concentration Amount Pen/strep 100 U/100 µg/mL 5 mL Fungizone 0.25 µg/mL PBS n/a 495 mL Total n/a 500 mL *Filter-sterilize prior to use
10% phosphomolybdic acid stock
Reagent Final concentration Amount Phosphomolybdic acid hydrate 10% 10 g Distilled water n/a 100 mL Total n/a 100 mL 0.02% phosphomolybdic acid stock
Reagent Final concentration Amount Phosphomolybdic acid 10% stock 0.02% 4 mL Distilled water n/a 196 mL Total n/a 200 mL Acidified water
Reagent Final concentration Amount Glacial acetic acid (17.4 M) 87.1 mM/0.5% 5 mL Distilled water n/a 995 mL Total n/a 1,000 mL
Acknowledgments
This study was supported by the National Health and Medical Research Council (NHMRC), Australian Research Council (ARC), Cancer Council NSW, Cancer Institute NSW (CINSW), Cancer Australia, Tour de Cure, St. Vincent’s Clinic Foundation, Australian Government Research Training Program Stipend, Baxter Family Postgraduate Scholarship and Suttons. This work was made possible by an Avner Pancreatic Cancer Foundation (now PanKind) Grant and the ACRF INCITe Centre. P.T. is supported by the Len Ainsworth Fellowship in Pancreatic Cancer Research and is a National Health and Medical Research Council (NHMRC). K.J.M, B.A.P, and D.H. are supported by CINSW Early Career Research Fellowship.
This protocol is largely derived from the original works (Cukierman et al., 2001; Franco-Barraza et al., 2016; Murphy et al., 2021).
Competing interests
P.T. receives reagents from Kadmon Inc., InxMed (consultant), Redx Pharma, Équilibre Biopharmaceuticals, and Amplia Therapeutics. Under a licensing agreement between Amplia Therapeutics and Garvan Institute of Medical Research, K.J.M., D.H., and P.T. (consultant) are entitled to milestone payments.
References
- Boudaoud, A., Burian, A., Borowska-Wykret, D., Uyttewaal, M., Wrzalik, R., Kwiatkowska, D. and Hamant, O. (2014). FibrilTool, an ImageJ plug-in to quantify fibrillar structures in raw microscopy images. Nat Protoc 9(2): 457-463.
- Boyle, S. T., Poltavets, V., Kular, J., Pyne, N. T., Sandow, J. J., Lewis, A. C., Murphy, K. J., Kolesnikoff, N., Moretti, P. A. B., Tea, M. N., et al. (2020). ROCK-mediated selective activation of PERK signalling causes fibroblast reprogramming and tumour progression through a CRELD2-dependent mechanism. Nat Cell Biol 22(7): 882-895.
- Cox, T. R. (2021). The matrix in cancer. Nat Rev Cancer 21(4): 217-238.
- Cukierman, E. (2002). Preparation of Extracellular Matrices Produced by Cultured Fibroblasts. Curr Protoc Cell Biol 16(1): 10.19.11-10.19.15.
- Erami, Z., Herrmann, D., Warren, S. C., Nobis, M., McGhee, E. J., Lucas, M. C., Leung, W., Reischmann, N., Mrowinska, A., Schwarz, J. P., et al. (2016). Intravital FRAP Imaging using an E-cadherin-GFP Mouse Reveals Disease- and Drug-Dependent Dynamic Regulation of Cell-Cell Junctions in Live Tissue. Cell Rep 14(1): 152-167.
- Franco-Barraza, J., Beacham, D. A., Amatangelo, M. D. and Cukierman, E. (2016). Preparation of Extracellular Matrices Produced by Cultured and Primary Fibroblasts. Curr Protoc Cell Biol 71(1): 10.19.11-10.19.34.
- Mayorca-Guiliani, A. E., Madsen, C. D., Cox, T. R., Horton, E. R., Venning, F. A. and Erler, J. T. (2017). ISDoT: in situ decellularization of tissues for high-resolution imaging and proteomic analysis of native extracellular matrix. Nat Med 23(7): 890-898.
- Miller, B. W., Morton, J. P., Pinese, M., Saturno, G., Jamieson, N. B., McGhee, E., Timpson, P., Leach, J., McGarry, L., Shanks, E., et al. (2015). Targeting the LOX/hypoxia axis reverses many of the features that make pancreatic cancer deadly: inhibition of LOX abrogates metastasis and enhances drug efficacy. EMBO Mol Med 7(8): 1063-1076.
- Morton, J. P., Timpson, P., Karim, S. A., Ridgway, R. A., Athineos, D., Doyle, B., Jamieson, N. B., Oien, K. A., Lowy, A. M., Brunton, V. G., et al. (2010). Mutant p53 drives metastasis and overcomes growth arrest/senescence in pancreatic cancer. Proc Natl Acad Sci U S A 107(1): 246-51.
- Murphy, K. J., Reed, D. A., Vennin, C., Conway, J. R. W., Nobis, M., Yin, J. X., Chambers, C. R., Pereira, B. A., Lee, V., Filipe, E. C., et al. (2021). Intravital imaging technology guides FAK-mediated priming in pancreatic cancer precision medicine according to Merlin status. Sci Adv 7(40): eabh0363.
- Neesse, A., Bauer, C. A., Ohlund, D., Lauth, M., Buchholz, M., Michl, P., Tuveson, D. A. and Gress, T. M. (2019). Stromal biology and therapy in pancreatic cancer: ready for clinical translation? Gut 68(1): 159-171.
- Nicolle, R., Blum, Y., Marisa, L., Loncle, C., Gayet, O., Moutardier, V., Turrini, O., Giovannini, M., Bian, B., Bigonnet, M., et al. (2017). Pancreatic Adenocarcinoma Therapeutic Targets Revealed by Tumor-Stroma Cross-Talk Analyses in Patient-Derived Xenografts. Cell Rep 21(9): 2458-2470.
- Özdemir, B. C., Pentcheva-Hoang, T., Carstens, J. L., Zheng, X., Wu, C. C., Simpson, T. R., Laklai, H., Sugimoto, H., Kahlert, C., Novitskiy, S. V., et al. (2014). Depletion of carcinoma-associated fibroblasts and fibrosis induces immunosuppression and accelerates pancreas cancer with reduced survival. Cancer Cell 25(6): 719-734.
- Cukierman, E., Pankov, R., Stevens, D. R. and Yamada, K. M. (2001). Taking cell-matrix adhesions to the third dimension. Science 294(5547): 1708-1712.
- Pereira, B. A., Vennin, C., Papanicolaou, M., Chambers, C. R., Herrmann, D., Morton, J. P., Cox, T. R. and Timpson, P. (2019). CAF Subpopulations: A New Reservoir of Stromal Targets in Pancreatic Cancer. Trends Cancer 5(11): 724-741.
- Piccinini, F., Kiss, A. and Horvath, P. (2016). CellTracker (not only) for dummies. Bioinformatics 32(6): 955-957.
- Rath, N., Munro, J., Cutiongco, M. F., Jagiello, A., Gadegaard, N., McGarry, L., Unbekandt, M., Michalopoulou, E., Kamphorst, J. J., Sumpton, D., et al. (2018). Rho Kinase Inhibition by AT13148 Blocks Pancreatic Ductal Adenocarcinoma Invasion and Tumor Growth. Cancer Res 78(12): 3321-3336.
- Rhim, A. D., Oberstein, P. E., Thomas, D. H., Mirek, E. T., Palermo, C. F., Sastra, S. A., Dekleva, E. N., Saunders, T., Becerra, C. P., Tattersall, I. W., et al. (2014). Stromal elements act to restrain, rather than support, pancreatic ductal adenocarcinoma. Cancer Cell 25(6): 735-747.
- Romani, P., Valcarcel-Jimenez, L., Frezza, C. and Dupont, S. (2021). Crosstalk between mechanotransduction and metabolism. Nat Rev Mol Cell Biol 22(1): 22-38.
- Sahai, E., Astsaturov, I., Cukierman, E., DeNardo, D. G., Egeblad, M., Evans, R. M., Fearon, D., Greten, F. R., Hingorani, S. R., Hunter, T., et al. (2020). A framework for advancing our understanding of cancer-associated fibroblasts. Nat Rev Cancer 20(3): 174-186.
- Vennin, C., Chin, V. T., Warren, S. C., Lucas, M. C., Herrmann, D., Magenau, A., Melenec, P., Walters, S. N., Del Monte-Nieto, G., Conway, J. R., et al. (2017). Transient tissue priming via ROCK inhibition uncouples pancreatic cancer progression, sensitivity to chemotherapy, and metastasis. Sci Transl Med 9(384).
- Vennin, C., Melenec, P., Rouet, R., Nobis, M., Cazet, A. S., Murphy, K. J., Herrmann, D., Reed, D. A., Lucas, M. C., Warren, S. C., et al. (2019). CAF hierarchy driven by pancreatic cancer cell p53-status creates a pro-metastatic and chemoresistant environment via perlecan. Nat Commun 10(1): 3637.
- Wershof, E., Park, D., Barry, D. J., Jenkins, R. P., Rullan, A., Wilkins, A., Schlegelmilch, K., Roxanis, I., Anderson, K. I., Bates, P. A. and Sahai, E. (2021). A FIJI macro for quantifying pattern in extracellular matrix. Life Sci Alliance 4(3).
- Wu, S. Z., Roden, D. L., Wang, C., Holliday, H., Harvey, K., Cazet, A. S., Murphy, K. J., Pereira, B., Al-Eryani, G., Bartonicek, N., et al. (2020). Stromal cell diversity associated with immune evasion in human triple-negative breast cancer. EMBO J 39(19): e104063.
Article Information
Copyright
© 2022 The Authors; exclusive licensee Bio-protocol LLC.
How to cite
Readers should cite both the Bio-protocol article and the original research article where this protocol was used:
- Murphy, K. J., Reed, D. A., Chambers, C. R., Zhu, J., Magenau, A., Pereira, B. A., Timpson, P. and Herrmann, D. (2022). Cell-derived Matrix Assays to Assess Extracellular Matrix Architecture and Track Cell Movement . Bio-protocol 12(24): e4570. DOI: 10.21769/BioProtoc.4570.
- Murphy, K. J., Reed, D. A., Vennin, C., Conway, J. R. W., Nobis, M., Yin, J. X., Chambers, C. R., Pereira, B. A., Lee, V., Filipe, E. C., et al. (2021). Intravital imaging technology guides FAK-mediated priming in pancreatic cancer precision medicine according to Merlin status. Sci Adv 7(40): eabh0363.
Category
Cancer Biology > Microenvironment
Cancer Biology > Invasion & metastasis > Tumor microenvironment
Cell Biology > Cell movement > Cell migration
Do you have any questions about this protocol?
Post your question to gather feedback from the community. We will also invite the authors of this article to respond.