- Protocols

- Articles and Issues
- For Authors
- About
- Become a Reviewer

Measurement of Transgenes Copy Number in Wheat Plants Using Droplet Digital PCR
Published: Vol 12, Iss 23, Dec 5, 2022 DOI: 10.21769/BioProtoc.4567 Views: 1694
Reviewed by: Ansul LokdarshiPriyanka DuttaRaviraj Mahadeo Kalunke
Original research article
The authors used this protocol in:
Jul 2021
Advertisement


Protocol Collections
Comprehensive collections of detailed, peer-reviewed protocols focusing on specific topics


Abstract
Genetic transformation is a powerful method for the investigation of gene function and improvement of crop plants. The transgenes copy number in the transgenic line is involved in gene expression level and phenotypes. Additionally, identification of transgene zygosity is important for quantitative assessment of phenotype and for tracking the inheritance of transgenes in progeny generations. Several methods have been developed for estimating the transgene copy number, including southern blot assay and quantitative polymerase chain reaction (qPCR) experiments. Southern hybridization, although convincing and reliable, is a time-consuming method through which the examination of the copy number is challenging in species with large genomes like wheat plants. Although qPCR is potentially simpler to perform, its results lack accuracy and precision, especially to distinguish between one and two copy events in transgenic plants with large genomes. The droplet digital PCR (ddPCR)–based method for investigation of transgenes copy number has been widely used in an array of crops. In this method, the specific primers to amplify target transgenes and reference genes are used as a single duplexed reaction, which is divided into tens of thousands of nanodroplets. The copy number in independent transgenic lines is determined by detection and quantification of droplets using sequence-specific fluorescently labeled probes. This method offers superior accuracy and reliability with a low cost and scalability as other PCR techniques in the investigation of transgenes copy number.
Graphical abstract

Flow chart for the ddPCR protocol
Background
Plant genetic transformation has been widely used for investigating gene function in wheat as well as the production of environmentally friendly and disease-resistant wheat varieties (Vasil, 2007). During genetic transformation in wheat embryos, the delivery number of transgenes into the plant genome cannot be controlled. Moreover, the expression level of transgenes and, consequently, the phenotype can be influenced by copy numbers. Thus, the validation of the copy number of transgenes is essential for research projects involving transgenic plants (Hobbs et al., 1993; Sivamani et al., 2015). The transgenic wheat plants with a single, full-length copy of a gene at a single locus is the most desirable event because the transgenes typically segregate in a predictable Mendelian fashion (Srivastava et al., 1996). Additionally, copy number determination can also be used to track inheritance and zygosity (Wu et al., 2017).
Gene copy number analysis could be determined by southern blot analysis (Southern, 1975), quantitative polymerase chain reaction (qPCR) (Higuchi et al., 2013), thermal asymmetric interlaced PCR (TAIL-PCR) (Y. G. Liu et al., 1995) and, most recently, digital droplet PCR (ddPCR). However, these methods vastly differ in precision, reproducibility, and potential to scale up. Among these, southern blot analysis was regarded as a powerful method for estimating copy number and loci complexity in transgenic plants. In this assay, genomic DNA was digested, separated by electrophoresis, blotted onto a membrane, and then detected with a radioactive, fluorescent, or chemiluminescent-labelled probe. However, it is hard to detect the copy number of transgenes using this method, which are inserted at a single locus. Moreover, the southern blot assay is impractical for examining large populations of transgenic plants because it is unable to automate and requires substantial skills, especially in species with large genomes like wheat plants. In qPCR, the concentration of the transgene in each sample is compared with either a standard curve or an endogenous gene of a known copy number, to estimate the copy number and zygosity of the transgenic allele(s) (Higuchi et al., 2013). Estimation of copy number by qPCR is very sensitive to PCR efficiency because of direct coupling between the PCR amplification and quantification. TAIL-PCR has also been used to establish the copy numbers of transgenes by amplifying the flanking sequence of the transgenic allele(s) (Y. G. Liu et al., 1995; Hanhineva and Krenlampi, 2007).
The ddPCR method has been used to detect the copy number of transgenes with high accuracy (Gowacka et al., 2015). Similar to qPCR, the detection principle of ddPCR is based on a fluorescent dye or probe and requires an endogenous reference gene with a known copy number (Collier et al., 2017). In ddPCR, the PCR reaction partitions individual into separate compartments, such as oil-bounded droplets, and then detects their endpoint amplification products. Poisson probability distribution is also used to derive the template concentration. Accordingly, the ddPCR method enables a more effective calculation of gene target enumeration and accurate quantification of nucleic acid targets. In qPCR, logarithmic PCR template quantification may limit the ability to identify small copy number differences (Bubner and Baldwin, 2004). However, in ddPCR, the decoupling of amplification and quantification with the linearity of the quantification scale allows the detection of small copy differences (Hindson et al., 2013; Bharuthram et al., 2014). In recent years, ddPCR has been successfully applied for the accurate determination of transgene copy number in different plant species. Here, we summarize the protocol of ddPCR used to determine the transgene copy number in wheat plants (P. Liu et al., 2021).
Materials and Reagents
2 mL safe-lock microcentrifuge tubes (Axygen, catalog number: MCT-200-C)
PCR plate heat seal, foil, pierceable (Bio-Rad, catalog number: 1814040)
ddPCR plates, 96-well, semi-skirted (Bio-Rad, catalog number: 12001925)
DG8TM cartridge for QX200TM/QX100TM droplet generator (Bio-Rad, catalog number: 1864008)
Droplet generator DG8TM gasket (Bio-Rad, catalog number: 1863009)
Restriction enzyme EcoRI (ThermoFisher, catalog number: FD0274)
RNase A (Sigma, CAS: 9001-99-4)
Nuclease-free water (ThermoFisher, catalog number: 10977015)
QubitTM dsDNA HS assay kit (ThermoFisher Scientific, catalog number: Q32851)
QX200TM ddPCRTM EvaGreen supermix (Bio-Rad, catalog number: 1864033)
QX200 droplet generation oil for EvaGreen® (Bio-Rad, catalog number: 1864005)
5' FAMTM (6-Carboxyfluorescein) (ThermoFisher Scientific, catalog number: C1360)
5' VICTM (6-VIC) (AAT Bioquest, catalog number: 212)
Equipment
QubitTM 4 fluorometer (ThermoFisher Scientific, catalog number: Q33238)
QX200TM droplet generator (Bio-Rad, catalog number: 1864002)
Thermal cycler (e.g., Bio-Rad C1000 Touch thermal cycler, catalog number: 1851148)
Pipettes (10 µL, 20 µL, 100 µL)
Heat sealer (e.g., Eppendorf S100, catalog number: 5391000036)
DG8 cartridge holder (Bio-Rad, catalog number: 1863051)
QX200 droplet reader (Bio-Rad, catalog number: 1864003)
Droplet reader plate holder (Bio-Rad, catalog number: 12006834)
Software
Primer design software: Primer5
Sequence analysis software: DNAstar (https://www.dnastar.com/)
QuantaSoftTM software (Bio-Rad, catalog number: 1863007) (https://www.bio-rad.com/)
Software capable of reading comma-separated values (.csv) files: Microsoft Excel
Droplet DigitalTM PCR Applications Guide: http://www.bio-rad.com/webroot/web/pdf/lsr/literature/Bulletin_6407.pdf
Procedure
Preparation of wheat materials
Grow plants in a chamber/greenhouse with the corresponding conditions.
Note: Here, wheat plants were grown in a growth chamber maintained at 16 °C ± 2 °C with a 16 h light and 8 h dark photoperiod and 70% relative humidity.
Collect approximately 100 mg of leaf samples from two-weeks-old wheat plants in a 2 mL safe-lock microcentrifuge tube for genomic DNA extraction.
Isolate total genomic DNA from wheat plant leaves using the CTAB method (Chen et al., 2014).
Digest each sample of genomic DNA using the restriction enzyme EcoRI followed by RNase A treatment. An example restriction digestion reaction is shown in Table 1.
Table 1. Example reaction for restriction endonuclease digestion of genomic DNA
Components Volume 10× restriction enzyme buffer 5 μL EcoRI (10–20 U/μL) 2 μL Genomic DNA 1 μg Nuclease-free water Up to 50 μL Total 50 μL Incubate the restriction reaction mixture at 37 °C for 1 h and then add 1 μL of RNase A. After incubation at 37 °C for 30 min, inactivate the mixture by heating at 95 °C for 10 min. Following inactivation, the digested genomic DNA can be used directly in the next step without further cleanup.
Primers selection
The wheat puroindoline-b (PINb) gene with a single copy was used as a reference gene to estimate transgene copy number (Collier et al., 2017). The primers of target genes were designed using a primer design software (e.g., Primer 5), which amplifies a 100–120 base pair region of both transgene targets. An example of target genes primers and wheat PINb gene primers are shown in Table 2.
Table 2. Primers used in ddPCR
Name Sequence Length Targets TaPINb-F AGTTGGCGGCTGGTACAATG 20 Wheat PINb gene TaPINb-R ACATCGCTCCATCACGTAATCC 23 TaPINb-prove FAM-TCAACAATGTCCGCAGGAGCG-VIC 23 pUbi-F GTAGATAATGCCAGCCTGTTAAAC 24 Ubi promoter pUbi-R GACGCGACGCTGCTGGTT 18 pUbi-prove FAM-CGTCGACGAGTCTAACGGACACCAAC-VIC 29 Each primer pair needs to be checked first in a test PCR reaction. Use the reaction with genomic DNA from non-transgenic wheat plants or H2O as negative control. Assemble the reaction as shown in Table 3.
Table 3. PCR reaction for testing ddPCR primer pairs
Components Stock concentration Final concentration Volume 2×QX200TM ddPCRTM EvaGreen® supermix 2× 1× 5 μL Forward primer 2 μM 250 nM 1.25 μL Reverse primer 2 μM 250 nM 1.25 μL Genomic DNA 50 ng Nuclease-free water Up to 10 μL Total 10 μL Label the reference gene probes with 5' FAMTM (6-Carboxyfluorescein) and the transgene probes with 5' VICTM (6-VIC).
The cycling conditions of the PCR reaction are shown in Table 4.
Table 4. PCR cycling conditions for testing ddPCR primer pairs
Step Temperature (°C) Time Number of cycles Enzyme activation 95 5 min 1 Denaturation 95 30 s 40 Annealing 60 30 s Extension 72 30 s Signal stabilization 72 5 min 1 Hold 10 ∞ 1 Separate the PCR product by agarose gel electrophoresis. Obtain the single clear bands with the expected sizes for reference and target primers (Figure 1).
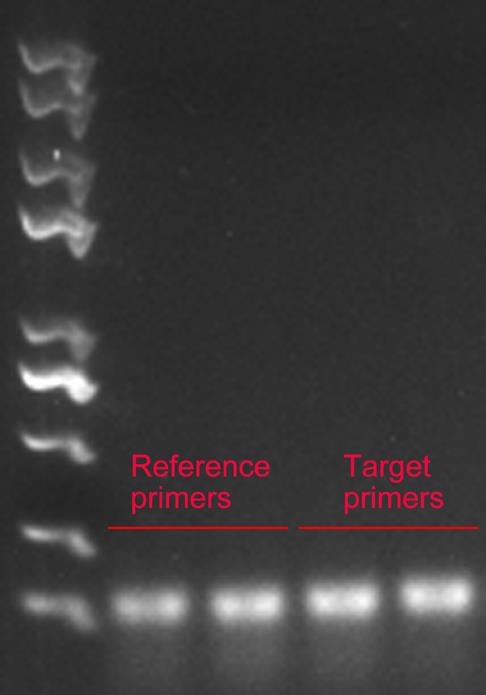
Figure 1. Example of PCR product showing the expected sizes obtained for reference and target primersddPCR setup
Assemble the PCR reactions as shown in Table 5. The genomic DNA from non-transgenic wheat plants or H2O were used as template as negative controls and added into the reaction. The primers of reference gene and transgenic genes were mixed in one reaction for each sample. It is critical that the assayed ddPCR reactions are well mixed prior to proceeding to droplet generation. The concentration of each component must be the same in every droplet.
Table 5. Example ddPCR reaction
Components Stock concentration Final concentration Volume 2× QX200TM ddPCRTM EvaGreen® supermix 2× 1× 10 μL Forward primer of reference gene 2 μM 250 nM 2.5 μL Reverse primer of reference gene 2 μM 250 nM 2.5 μL Forward primer of reference gene 2 μM 250 nM 2.5 μL Reverse primer of reference gene 2 μM 250 nM 2.5 μL Genomic DNA 50 ng Nuclease-free water Up to 20 μL Total 20 μL
Droplet generation
Load the cartridge into the QX200 droplet generator.
Load 20 μL of the ddPCR reaction into individual sample wells of the DG8TM droplet generator cartridge.
Add 70 μL of QX200 droplet generation oil for EvaGreen® into the oil wells.
Cover the cartridge with the DG8TM gasket (Figure 2).
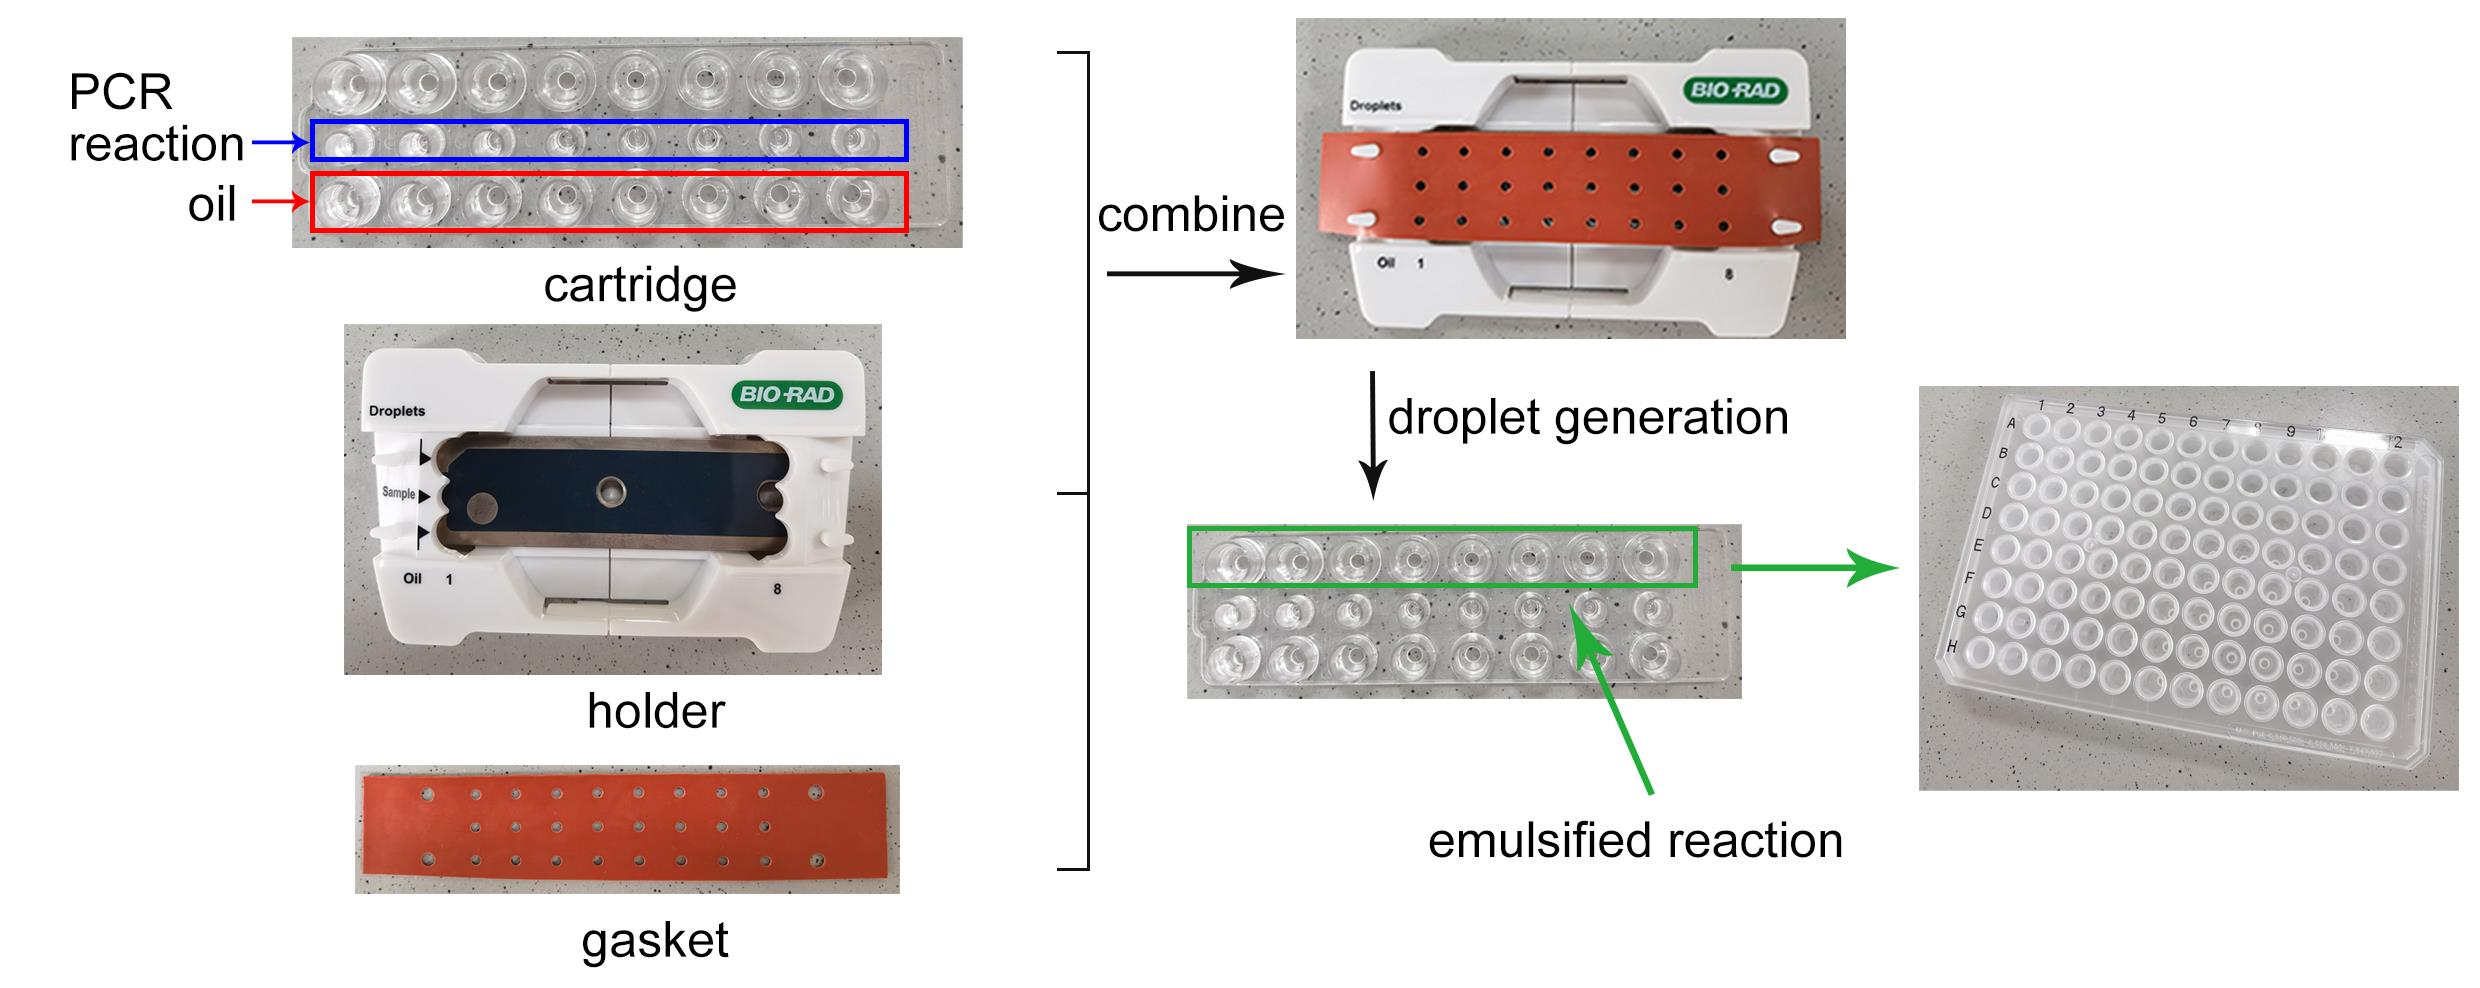
Figure 2. Workflow of droplet generationThe QX200 droplet generator uses microfluidics to combine oil and aqueous samples to generate the nanoliter-sized droplets required for ddPCR analysis. It processes up to eight samples at a time in approximately 2 min.
Transfer the entire volume of the droplet emulsion (typically 70 μL) to the desired wells of a semi-skirted 96-well ddPCR plate.
Cover the 96-well ddPCR plate with a pierceable foil plate heat seal using a heat sealer according to the manufacturer’s instructions.
Note: Take care to pipette very slowly to avoid disrupting the emulsified droplets.
Place the 96-well ddPCR plate containing the PCR products into a thermal cycler and use cycling conditions as shown in Table 6. The annealing temperature was decided by the Tm value of the primers (normally < 5 °C than Tm value).
Table 6. PCR cycling conditions for ddPCR. Use a 2 °C/s ramping rate for all steps.
Step Temperature (°C) Time Number of cycles Enzyme activation 95 10 min 1 Denaturation 94 30 s 40 Annealing 58 1 min Signal stabilization 98 10 min 1 Hold 10 ∞ 1
Droplet counting
Switch on the QX200TM droplet reader and open the QuantaSoftTM software after the PCR cycle is finished.
Turn on the new experiment in the QuantaSoftTM software.
Select the wells that need detection, enter the sample names, and record the well positions for target and reference genes for each sample.
Select the key parameters in the wells that need detection as follows:
Experiment: ABS (absolute quantitation).
Supermix: QX200TM ddPCR EvaGreen supermix.
Target 1 type: Ch1 unknown.
Target 2 type: Ch2 unknown.
Enter the sample name to distinguish transgenes and reference genes.
Apply the chosen parameters to the selected wells by clicking OK.
Place the 96-well PCR plate into the plate holder as follows (Figure 3):
Place the 96-well PCR plate containing the amplified droplets into the base of the plate holder. Well A1 of the PCR plate must be in the top-left position.
Move the release tabs of the top of the plate holder to the “up” position and place the top on the PCR plate. Firmly press down both release tabs to secure the PCR plate in the holder.
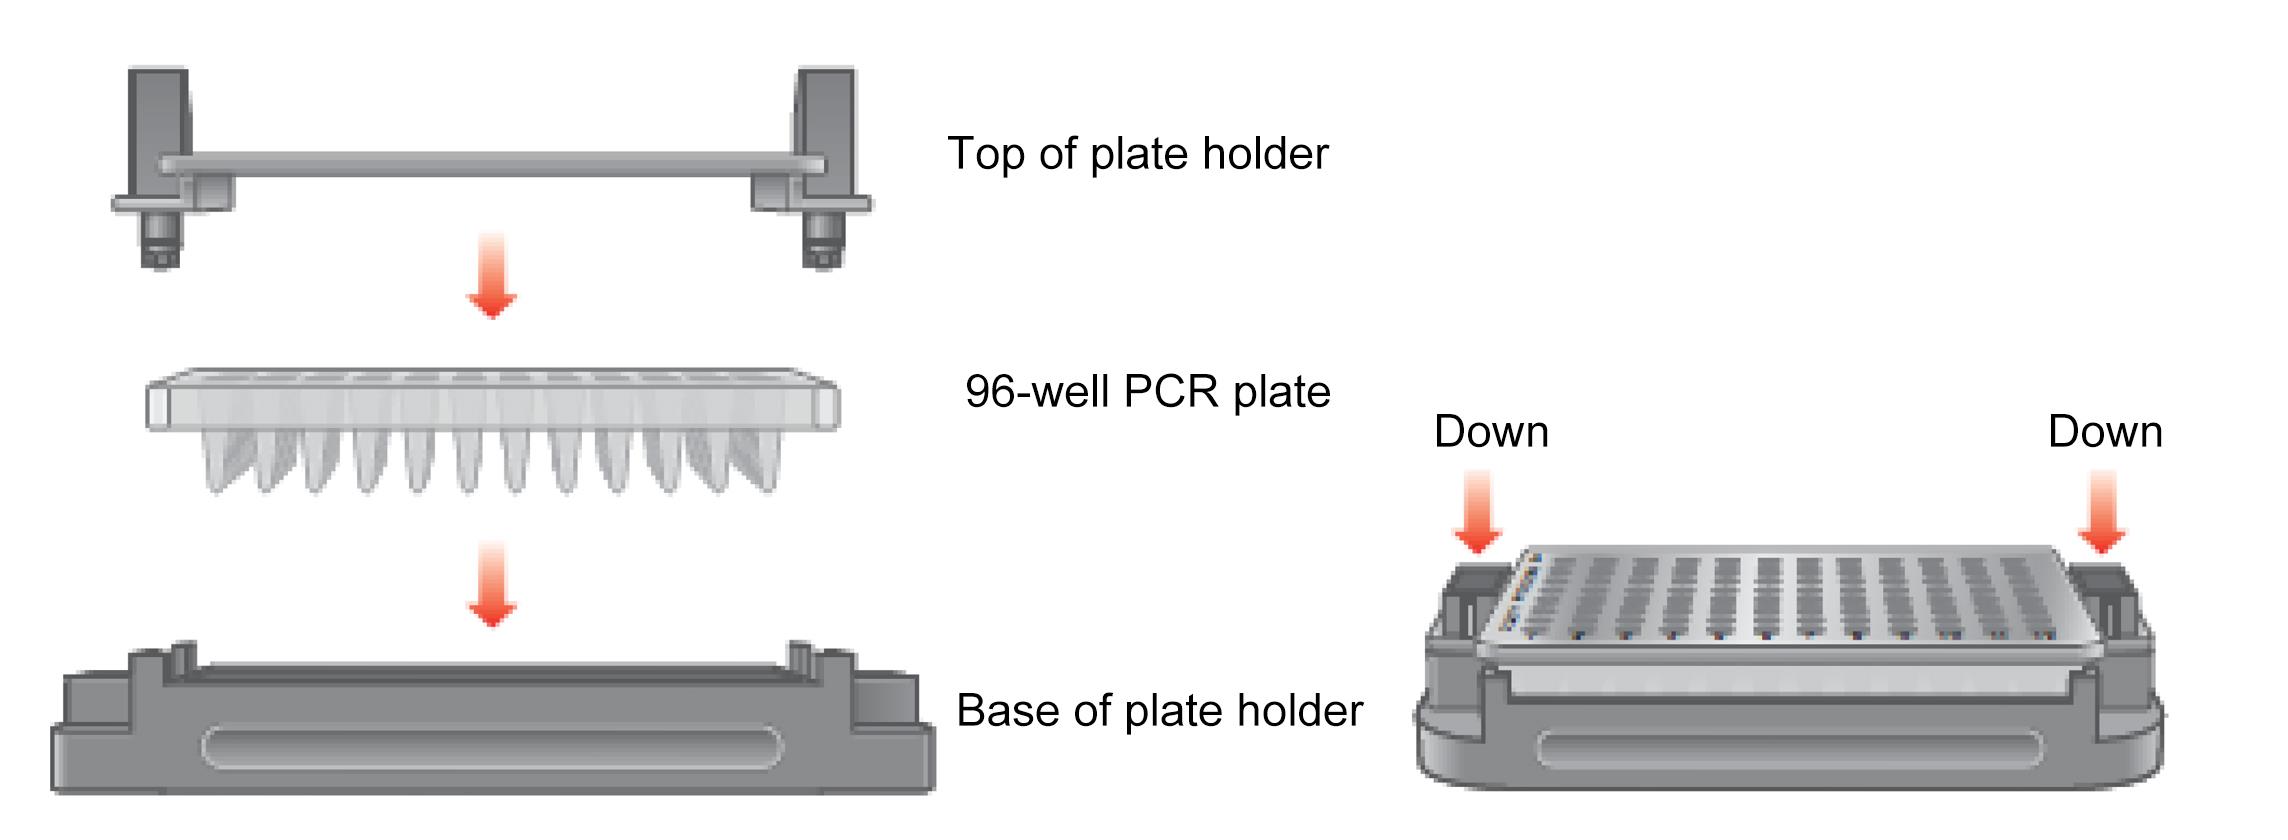
Figure 3. Placing the 96-well plate into the plate holderAfter closing the lid, check if the indicator lights for “power,” “bottle level,” and “plate in place” are green.
Click Run in the left navigation bar to start the run.
In the Run Options window, select the detection chemistry.
Note: If a probe supermix is selected in the well editor, the probe dye setting appears; select FAM/HEX or FAM/VIC. If an EvaGreen supermix is selected, the EvaGreen dye setting appears, and the screen confirms the number of EvaGreen wells configured on the plate.
Data analysis
Click the Analysis button to analyze the data after reading is complete.
Click the 1D Amplitude button to analyze the data collected from each channel of selected wells. The radio button is used to select the channels and provides options for adjusting the thresholds used in assigning positives and negatives for each channel. An example distribution is shown in Figure 4.
Note: A single reaction should produce 12,000–20,000 droplets. The calculation of copy number relies on the ratio of positive to negative droplets.
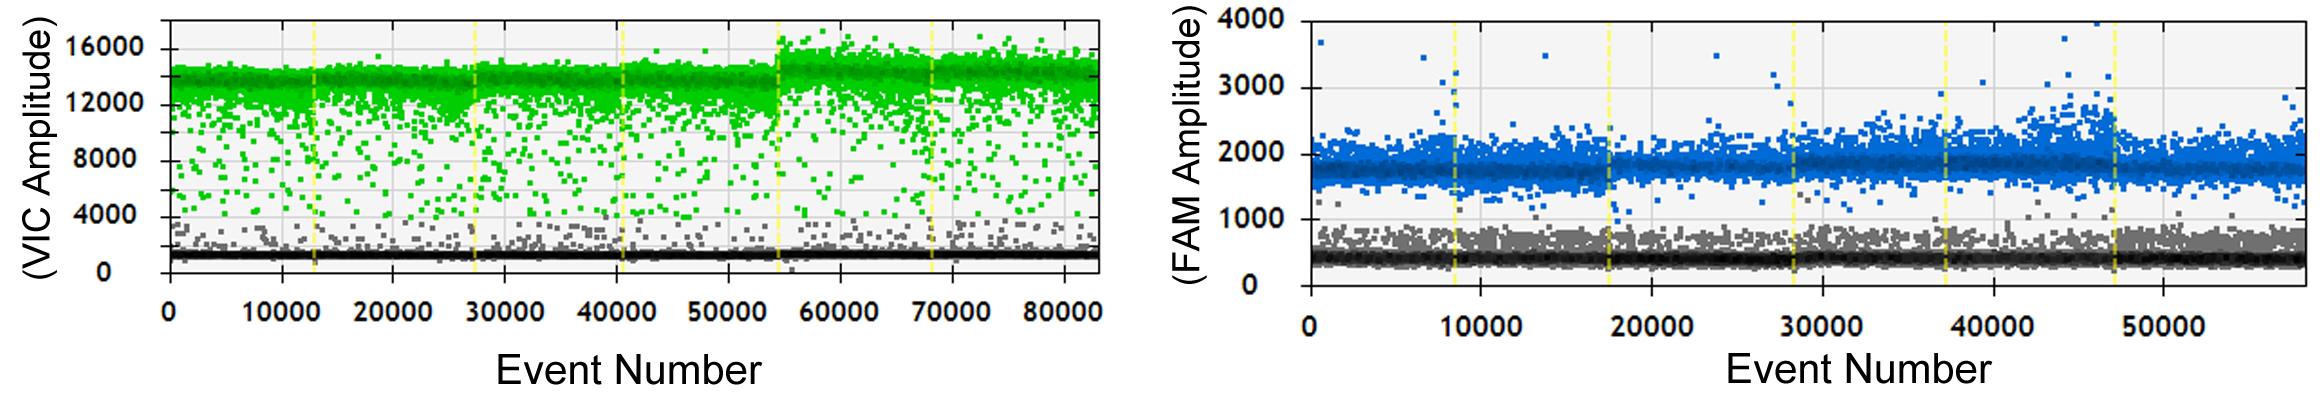
Figure 4. Example plot showing positive droplets for six samples. Green and blue droplets indicate VIC and FAM probes. The x-axis (event number) indicates the number of droplets measured across the total experiment and the y-axis shows the amplitude of fluorescence. The image of these samples was published in a previous study (P. Liu et al., 2021).Click the 2D Amplitude button to view the channel 1 vs. channel 2 scatter plot and enable options for manually or automatically adjusting the thresholds used in assigning positives and negatives for each channel (Figure 5).
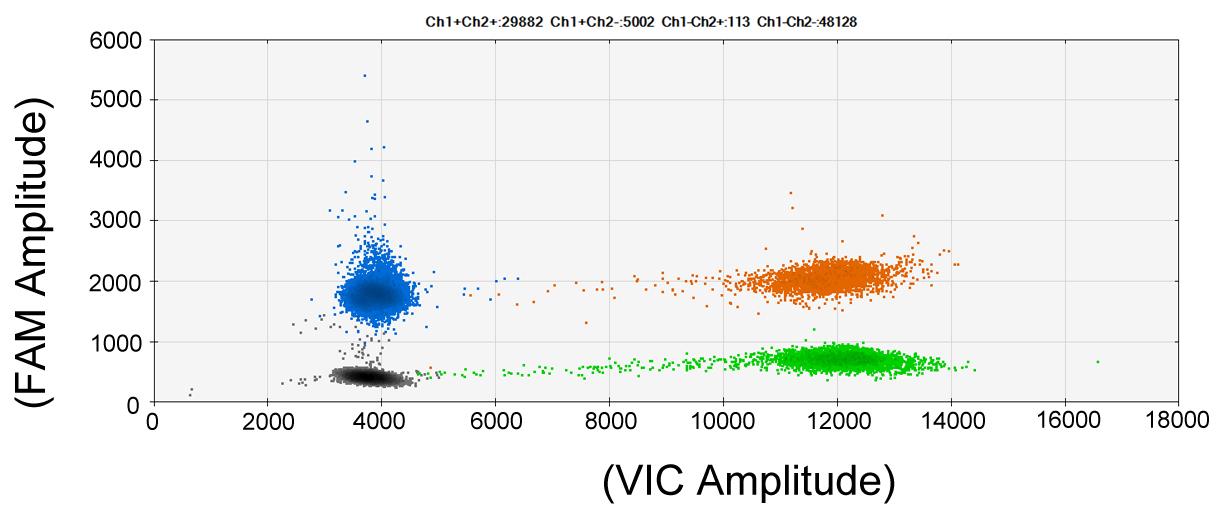
Figure 5. Droplets of six examples visualized in two dimensions. The image of this sample was published in a previous study (P. Liu et al., 2021).Click the concentration button to visualize data in concentration plots. Export the concentration data as a comma-separated values (.csv) file.
Note: The “copies/μL well” column displays the total amount of starting material in the ddPCR sample.
Click Copy Number to view copy number for selected well/samples (Figure 6).
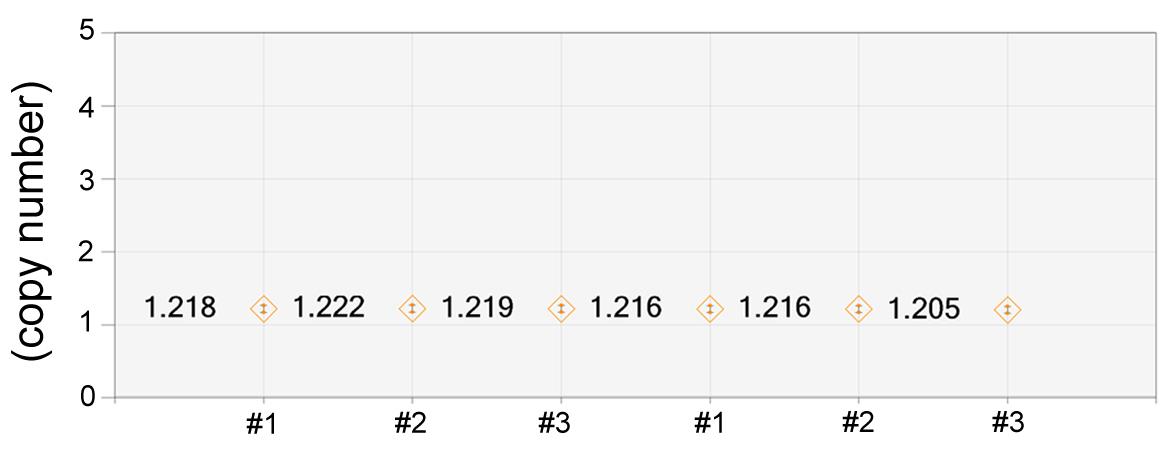
Figure 6. Display of the calculated transgene copy number values of six examples. The image of these samples was published in a previous study (P. Liu et al., 2021).Click Ratio button to view ratio data for selected well/samples. Use the ratio buttons to select a plot of the Ratio (unknown: reference) or Fractional Abundance (% of sample).
Click Events to view the number of droplet events counted for selected well/samples.
Acknowledgments
We acknowledge financial support from China Agriculture Research System from the Ministry of Agriculture of the P.R. China (CARS-03), National Natural Science Foundation of China (32100126, 31901954), Ningbo Science and Technology Innovation 2025 Major Project, China (Q21C140013), Natural Science Foundation of Zhejiang Province, China (LQ20C140002), and K.C. Wong Magna Funding Ningbo University. This protocol was developed to generate the transgene copy number in a previous study (P. Liu et al., 2021).
Competing interests
No competing interests to declare.
References
- Bharuthram, A., Paximadis, M., Picton, A. C. P. and Tiemessen, C. T. (2014). Comparison of a quantitative Real-Time PCR assay and droplet digital PCR for copy number analysis of the CCL4L genes. Infect Genet Evol 25: 28-35.
- Bubner, B. and Baldwin, I. T. (2004). Use of real-time PCR for determining copy number and zygosity in transgenic plants. Plant Cell Rep 23(5): 263-271.
- Collier, R., Dasgupta, K., Xing, Y. P., Hernandez, B. T., Shao, M., Rohozinski, D., Kovak, E., Lin, J., de Oliveira, M. L. P., Stover, E., et al. (2017). Accurate measurement of transgene copy number in crop plants using droplet digital PCR. Plant J 90(5): 1014-1025.
- Chen, M., Sun, L., Wu H, Chen, J., Ma, Y., Zhang, X., Du, L., Cheng, S., Zhang, B., Ye, X., et al. (2014). Durable field resistance to wheat yellow mosaic virus in transgenic wheat containing the antisense virus polymerase gene. Plant Biotechnol J 12(4): 447-456.
- Gowacka, K., Kromdijk, J., Leonelli, L., Niyogi, K. K. and Long, S. P. (2015). An evaluation of New and established methods to determine T-DNA copy number and homozygosity in transgenic plants. Plant Cell Environ 39(4): 908-917.
- Hanhineva, K. J. and Krenlampi, S. O. (2007). Production of transgenic strawberries by temporary immersion bioreactor system and verification by TAIL-PCR. Bmc Biotechnol 7(1): 11.
- Hindson, C. M., Chevillet, J. R., Briggs, H. A., Gallichotte, E. N. and Tewari, M. (2013). Absolute quantification by droplet digital PCR versus analog real-time PCR. Nat Methods 10(10): 1003-1005.
- Higuchi, R., Fockler, C., Dolinger, G. and Watson, R. (2013). Kinetic PCR: Real time monitoring of DNA ampli cation reactions. Biotechnol 11(9): 1026-1030.
- Hobbs, S., Warkentin, T. D. and Delong, C. (1993). Transgene copy number can be positively or negatively associated with transgene expression. Plant Mol Biol 21(1): 17-26.
- Liu, P., Zhang, X., Zhang, F., Xu, M., Ye, Z., Wang, K., Liu, S., Han, X., Cheng, Y. and Zhong, K. (2021). A virus-derived siRNA activates plant immunity by interfering with ROS scavenging. Mol Plant 14(7): 1088-1103.
- Liu, Y. G., Mitsukawa, N., Oosumi, T. and Whittier, R. F. (1995). Efficient isolation and mapping of Arabidopsis thealiana T-DNA insert junctions by thermal asymmetric interlaced PCR. Plant J 8(3): 457-463.
- Sivamani, E., Li, X., Nalapalli, S., Barron, Y. and Que, Q. (2015). Strategies to improve low copy transgenic events in Agrobacterium-mediated transformation of maize. Transgenic Res 24(6): 1-11.
- Southern, E. M. (1975). Detection of specific sequences among DNA fragments separated by gel electrophoresis. J Mol Biol 98(3): 503-517.
- Srivastava, V., Vasil, V. and Vasil, I. K. (1996). Molecular characterization of the fate of transgenes in transformed wheat (Triticum aestivum L.). Theor Appl Genet 92(8): 1031-1037.
- Wu, Y., Li, J., Li, X., Liang, J., Zeng, X. and Wu, G. (2017). Copy number and zygosity determination of transgenic rapeseed by droplet digital PCR. Oil Crop Science 2: 84-94.
- Vasil, I. K. (2007). Molecular genetic improvement of cereals: transgenic wheat (Triticum aestivum L.). Plant Cell Rep 26(8): 1133-1154.
Article Information
Copyright
© 2022 The Authors; exclusive licensee Bio-protocol LLC.
How to cite
Liu, P., Liu, S., Lei, J., Chen, J. and Yang, J. (2022). Measurement of Transgenes Copy Number in Wheat Plants Using Droplet Digital PCR. Bio-protocol 12(23): e4567. DOI: 10.21769/BioProtoc.4567.
Category
Plant Science > Plant molecular biology
Molecular Biology
Do you have any questions about this protocol?
Post your question to gather feedback from the community. We will also invite the authors of this article to respond.