- Submit a Protocol
- Receive Our Alerts
- Log in
- /
- Sign up
- My Bio Page
- Edit My Profile
- Change Password
- Log Out
- EN
- EN - English
- CN - 中文
- Protocols
- Articles and Issues
- For Authors
- About
- Become a Reviewer
- EN - English
- CN - 中文
- Home
- Protocols
- Articles and Issues
- For Authors
- About
- Become a Reviewer
Fluorescence Time-lapse Imaging of Entosis Using Tetramethylrhodamine Methyl Ester Staining
Published: Vol 12, Iss 23, Dec 5, 2022 DOI: 10.21769/BioProtoc.4564 Views: 1883
Reviewed by: Ralph Thomas BoettcherRakesh BamOlga Kopach

Protocol Collections
Comprehensive collections of detailed, peer-reviewed protocols focusing on specific topics
Related protocols
Rapid and Uniform NHS-Ester-Based Membrane Protein Labeling of Live Mammalian Cells
Alyssa Burgess [...] Ying S. Hu
Oct 5, 2025 2174 Views
Lipid-Mediated Sequential Recruitment of Proteins Via Dual SLIPT and Dual SLIPTNVOC in Live Cells
Kristina V. Bayer and Richard Wombacher
Nov 5, 2025 1598 Views
Abstract
Entosis is a process where a living cell launches an invasion into another living cell’s cytoplasm. These inner cells can survive inside outer cells for a long period of time, can undergo cell division, or can be released. However, the fate of most inner cells is lysosomal degradation by entotic cell death. Entosis can be detected by imaging a combination of membrane, cytoplasmic, nuclear, and lysosomal staining in the cells. Here, we provide a protocol for detecting entosis events and measuring the kinetics of entotic cell death by time-lapse imaging using tetramethylrhodamine methyl ester (TMRM) staining.
Keywords: Entosis
Background
Entosis is a form of cell–cell interaction in which a living cell (inner cell) orchestrates its invasion into another cell (outer cell) by a Rho/ROCK signaling–dependent mechanism (Overholtzer et al., 2007). Entosis results in the formation of a unique morphological microscopic structure, also known as cell-in-cell structure or bird’s eye structure, which is characterized by evidence of an inner cell, a visible entotic vacuole between inner and outer cells, and an outer cell with a crescent-shaped nucleus as it is pushed towards the periphery (Fais and Overholtzer, 2018). Entosis spontaneously—but rarely—occurs in cultured cells in vitro; nevertheless, it has important consequences for both inner and outer cells. From one perspective, entosis seems to be an assisted-suicide mechanism for the inner cells, as the vast majority of these undergo lysosomal degradation by a mechanism known as entotic cell death (Florey et al., 2011). However, inner cells can also survive and be released, and even complete full cell division inside outer cells. Intriguingly, outer cells also benefit from this invasion as they gain survival advantage under stress conditions (Hamann et al., 2017) or become resistant to apoptosis (Bozkurt et al., 2021). Entosis-like structures are more frequently observed in cancers compared to normal tissues, and the presence of these structures is associated with poor outcome and disease recurrence in cancer (Mackay et al., 2018; Bozkurt et al., 2021).
Quantification of entosis relies on morphological detection of the events using microscopy images. Currently, it is not possible to automatically quantify entosis events when both inner and outer cells are alive. Thus, events are first detected with the aid of nuclear, cytoplasmic, and/or membrane staining, and then manually quantified (Overholtzer et al., 2007). When inner cells undergo entotic cell death, however, quantifying entosis events is relatively easy due to lysosomal acidification of inner cells. Lysosomal marker Lamp1 or autophagic marker LC3 can be fluorescently expressed in the cells to quantify the dynamics of entotic cell death (Florey et al., 2011; Overholtzer et al., 2007). However, overexpression of artificially produced proteins might also affect the rate of entosis events. Probably the most practical method to label entotic cell death is using lysosomal dyes such as LysoTracker, which freely passes the cell membrane and is sequestered inside acidic organelles. Alternatively, fluorogenic cathepsin substrates or acridine orange have been used to detect entosis and entotic cell death (Overholtzer et al., 2007; Garanina et al., 2017).
Recently, we reported a novel alternative approach for detecting entosis events and measuring the dynamics of entotic cell death by using tetramethylrhodamine methyl ester (TMRM) (Bozkurt et al., 2021). This cationic cell-permeable dye is sequestered by active mitochondria and has been widely used to analyze real-time changes in mitochondrial events such as loss of mitochondrial membrane potential during apoptosis as well as fusion/fission (Dußmann et al., 2003; Cho et al., 2019). Here, we provide a detailed protocol for performing time-lapse microscopy in any cell line to detect entosis events and entotic cell death by using TMRM staining. Our approach allows simultaneous detection of mitochondrial and entotic events as well as quantification of the real-time kinetics in living cells at the single-cell level.
Materials and Reagents
WillCo-dish® 12 mm glass bottom dishes (WillCo Wells B.V., catalog number: HBST-3512)
Cell culture flask, T-75, surface: standard, filter cap (Sarstedt, catalog number: 83.3911.002)
Living cells (in this protocol, HCT116-Venus cells (Bozkurt et al., 2021) were used; however, this method is applicable to any living cell)
Fetal bovine serum (FBS) (Sigma-Aldrich, catalog number: F7525), store at -20 °C.
L-glutamine (Sigma-Aldrich, catalog number: G7513), store at -20 °C
Mineral oil, suitable for mouse embryo cell culture (Sigma-Aldrich, catalog number: M5310), store at room temperature
Penicillin–streptomycin (Sigma-Aldrich, catalog number: P0781), store at -20 °C
Roswell Park Memorial Institute 1640 medium (RPMI medium) (Sigma-Aldrich, catalog number: R0883), store at 4 °C
Tetramethylrhodamine, methyl ester, perchlorate (TMRM) (Thermo Fisher Scientific, catalog number: T668), store at 4 °C
Equipment
Inverted confocal laser scanning microscope (Carl Zeiss Ltd, LSM 710) equipped with a 40×/1.3 NA plan apochromat oil immersion objective, a microscope incubator chamber (37 °C with 5% CO2), and a motorized stage
Cell culture hood (Heraeus, HERAsafe, Type HS12)
Centrifuge (Eppendorf, 5810, catalog number: 5810000060)
Water bath (GFL Type 1004)
Humidified CO2 incubator (New Brunswick/Eppendorf, Galaxy 170S)
Software
ZEN 2009 version 6,0,0,303 configuration 5, with MTS 2009-2010 version 32.007
Fiji/ImageJ (National Institutes of Health, https://imagej.nih.gov/ij/)
PlotTwist, a web app for plotting continuous data (https://huygens.science.uva.nl/PlotTwist/) (Goedhart, 2020)
Procedure
Cell seeding and staining
Prepare complete cell culture RPMI (use 4 mL per WillCo-dish for calculations) by adding 10% FBS, 2 mM L-glutamine, 100 U/mL penicillin, and 100 μg/mL streptomycin.
Preheat the complete cell culture media in a 37 °C water bath.
Prepare staining solution by adding 30 nM TMRM to 2 mL of complete cell culture RPMI. Keep the staining solution warm in a 37 °C water bath.
Seed 7,500 cells in 1.5 mL of staining solution on sterile 12 mm glass bottom WillCo dishes and let them adhere overnight at 37 °C with 5% CO2.
Note: Staining should be added at the seeding stage and left in the media throughout the experiment.
Cover the WillCo-dish with embryo-tested sterile mineral oil.
Note: Do not put the lid of the WillCo-dish after adding mineral oil.
Image acquisition
Carefully mount the WillCo-dish on an LSM 710 confocal laser scanning microscope.
Note: Make sure that there is no dirt or air bubbles in the immersion medium between objective lens and coverslip as it would interfere with the image acquisition and the function of the definite focus.
Start ZEN software.
Select 40× 1.3 NA oil objective using touchscreen.
Randomly select multiple positions with Definite Focus active.
Choose 488 nm laser, adjust to <5%, and select detection range of 490–544 nm or 505–560 nm for imaging Venus; use 561 nm laser, adjust to <0.5%, and select detection range of 590–644 nm for imaging TMRM. Set digital gain to 1 and the offset to 0 for both. Activate the transmitted light detector and make sure to have the required prism and analyzer in the beam path. The % transmission of the acousto-optic tunable filter is based on the 488 nm line of an argon laser, which is <10 mW; the 0.5% is based on a 561 nm diode-pumped solid-state laser, which is 40 mW when the lasers are new. These settings should be tested on the cells chosen for the experiment. Tolerance to laser irradiation can vary and the calibration of the confocal microscope and the age of lasers are major factors that contribute to the power in the object plane, hence, photo-damage to the cells. Here, proliferation of cells and no change in mitochondrial membrane potential (as detected with TMRM) was observed for 24 h under control conditions.
Set the zoom to 1 and use 1024 × 1024 pixel resolution for a field of view of 212 μm2. Set the optical slice thickness to 1.5–2 μm, use bidirectional scan, and make sure bidirectional scan and pinhole are calibrated. Then, save this configuration for the use with the Multiple Time Series Macro. Lateral and axial resolution is set at a compromise between optimal resolution and imaging conditions for cells. If the signal-to-noise ratio (S/N) is too low, it might be required to open the pinhole further.
Start Multiple Time Series Macro.
Make sure the locations are transferred and select the proper configuration for each location.
Run the autofocus test for each location and adjust the offset accordingly.
Define the storage name and location on the hard disk drive (HDD) and make sure to have at least 30% free defragmented HDD. Also, make sure to have enough available storage to end the experiment with at least 25% free HDD capacity.
Select the time interval between repetition of imaging. This is usually around 5 to 10 min depending on the number of locations (keep number of locations less than 12). Also, select the number of experiment repetitions. Acquire images for at least 12 h. Keep in mind that a shorter time interval will also increase the photo-damage to the cells; the time interval should be short enough to see the order of events you are interested in and to track the objects.
After finishing the experiment, remove the dish, clean the objective, and follow the switching off procedure of the LSM 710.
Copy the data to a server or mobile HDD and generate a second confirmed copy before deleting the data from the image acquisition PC.
Image processing
Download and install Fiji/ImageJ software.
Start Fiji/ImageJ.
Watch “Step-by-step video guide for image processing” (Video 1).
Video 1. Step-by-step video guide for image processingOpen the file with LSM extension by clicking File – Open.
Note: You can simply drag and drop the file into Fiji/ImageJ software.
Open Brightness/Contrast (B&C) panel by clicking Image – Adjust – Brightness/Contrast (or simply use shortcut Ctrl + Shift + C).
Open Channels Tool by clicking Image – Color – Channels Tool (or simply use shortcut Ctrl + Shift + Z).
Change Lookup Tables by clicking Image – Lookup Tables and set TMRM as red and Venus as green.
Note: Setting Lookup tables is just for visualization of the events; any color combination can be chosen as it will not affect the results.
Adjust B&C as desired.
Note: Adjusting B&C to auto usually gives a very good result.
Unmark DIC channel on Channels Tool and slowly scroll throughout the fields to locate entotic events. In case of an event of entotic cell death, a big circular structure displaying TMRM accumulation over time, in parallel with reduction in Venus fluorescence, will appear in the field (see Figure 1 and Video 2).
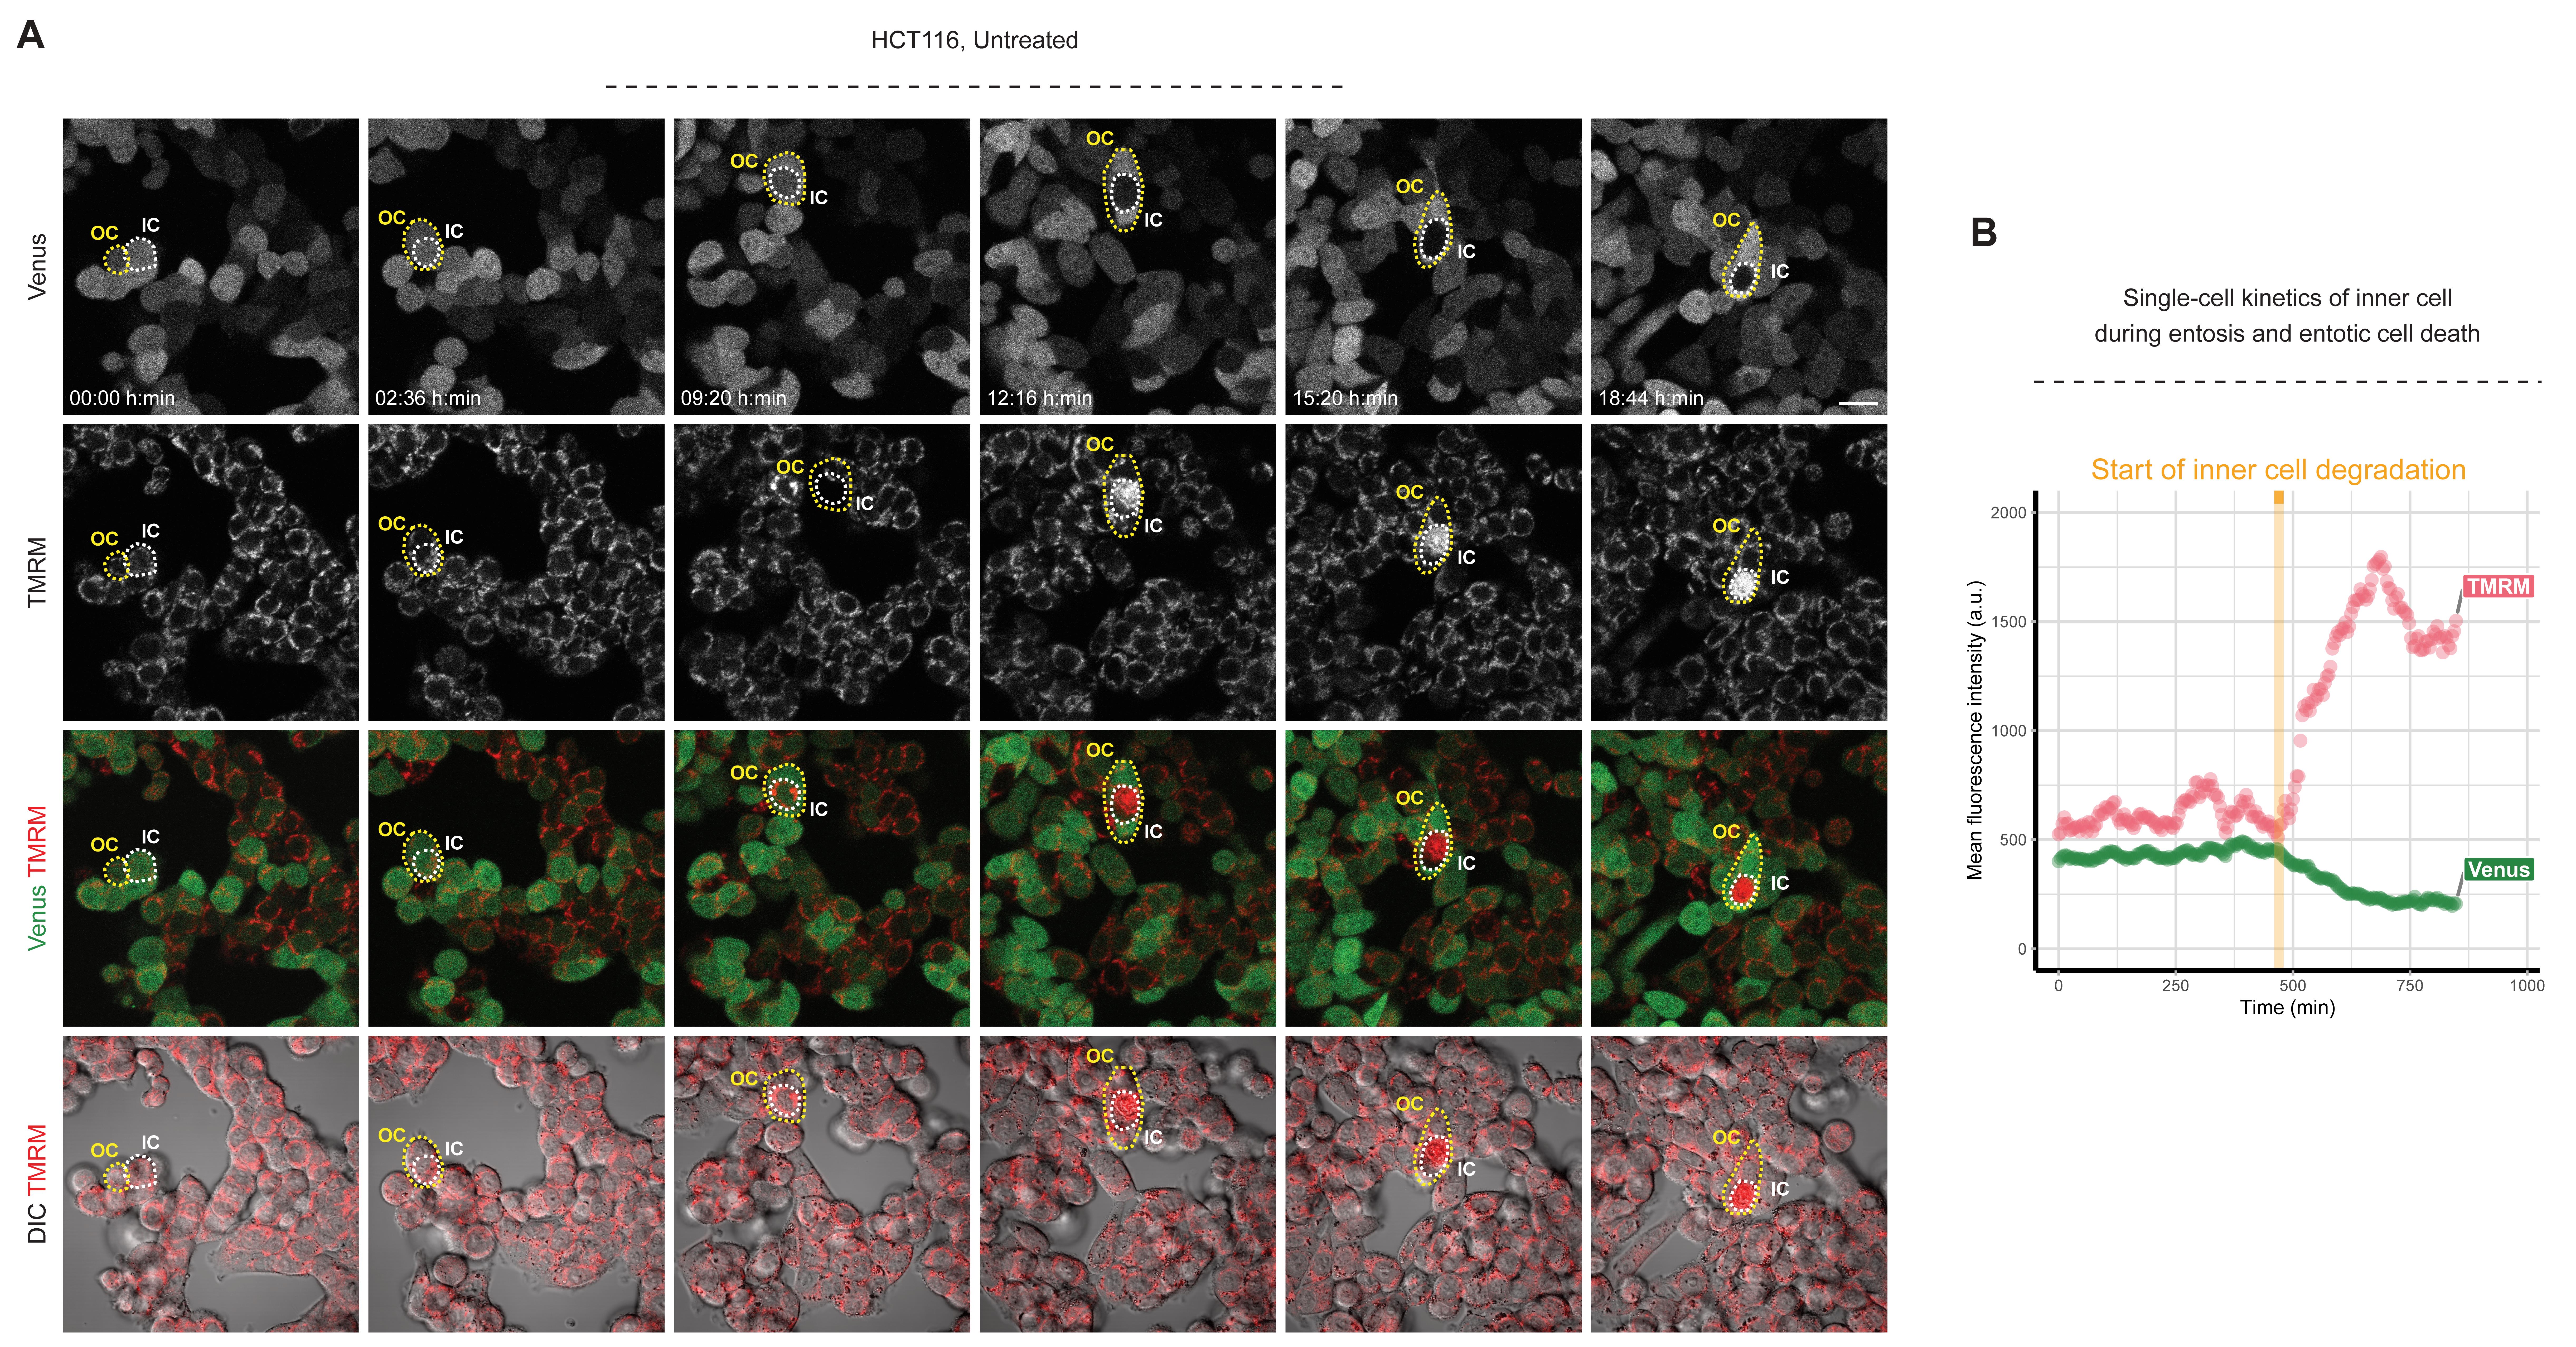
Figure 1. Representative field of view and kinetics of an entosis event in untreated HCT116 cells. (A) Representative time-lapse microscopy images of an entosis event in HCT116-Venus cells. DIC, Venus (green), and TMRM (red) are shown. White-dashed and yellow-dashed lines indicate an inner cell (IC) and outer cell (OC), respectively. (B) Quantification of single-cell kinetics of TMRM and Venus fluorescence intensity in an inner cell during entosis and entotic cell death.Video 2. Representative time-lapse video showing an entosis event in untreated HCT116 cells.
DIC, Venus (green), and TMRM (red) are shown. Frame rate: 20 frames per second; the interval between two frames is 4 min. White arrow depicts an entosis event.Once an event is found, carefully follow the event by scrolling back to confirm that a cell is invading into another cell.
Open ROI (Region of Interest) Manager by clicking Analyze – Tools – ROI Manager.
Carefully draw a region around the inner cell by using polygon selections. Use the magnifying glass tool to correct the edges. Use right click to connect the first and the last point of the selections.
Note: Instead of using the magnifying glass tool, simple press Shift and use the mouse scroll to zoom in and out and press Space, and use left click on the field to move freely.
Optional: At this stage, working on a smaller field of view is easier and uses less computer power. To create a smaller field of view, click rectangle tool, draw a region that covers the event, and click Image - Duplicate, then click OK.
Notes:
Holding Shift while drawing a region will create a square field.
Simply use the shortcut Shift + D to duplicate the region. Save this region by clicking File - Save (or use shortcut Ctrl + S) for further analysis.
Click Add on ROI manager (or use shortcut t) to add selection, click to the next slice, modify the selection (or draw a new one), and then click Add on ROI manager. Repeat this step until all steps of the entosis event are recorded. (Pressing Alt + mouse scroll will move to the next slice.)
Select all regions by pressing Ctrl + A on ROI Manager, then save the regions by clicking More – Save on ROI Manager.
Note: Regions can be updated anytime by clicking on a region first, then clicking update after modifying the region. Regions can also be opened later by clicking More – Open on ROI Manager.
Click Analyze – Set Measurements and mark mean gray value.
To measure mean fluorescence intensity (MFI), select TMRM channel on the image, select all regions by pressing Ctrl + A on ROI Manager, and click Measure. Rename and save the results file as TMRM. Repeat this step to measure Venus and rename the file as Venus.
Optional: It is possible to create a time-lapse video using Fiji/ImageJ. Before generating the video format, we suggest putting a time stamp by clicking Image – Stacks – Time Stamper. Also make sure to add any annotation or label before generating the video. To create a time-lapse video from the experiment, click File – Save As – AVI, select Compression format and frame rate, and click OK.
Optional: It is possible to create a montage from time-lapse images. Click Image – Stacks – Make Montage, complete the new setting window as desired, and click OK.
Data visualization and analysis
Open PlotTwist, click Data Upload, and click Download (tidy) data (.csv).
Carefully copy and paste the results of TMRM and Venus into the template.
Click Plot under Data and select Data as Dots. Mark the Plot thickness; set Visibility of the data as 0.4 and set Visibility of the statistics as 0.0; mark Change scale, set Range x-axis (min,max) scale as 0,850 and Range y-axis (min,max) as 0,2000; mark Use color for the data and click color palette Tol; bright; set Height (catalog number: pixels) as 480 and Width (catalog number: pixels) as 480; under Labels mark Add treatment/condition and Bar&Box; set Range of grey box (from,to) to the time at which TMRM intensity starts increasing and Venus intensity starts decreasing; add text as Start of inner cell degradation and mark add Title; mark Change axis labels and Change x-axis as Time (min) and y-axis as Mean fluorescence intensity (a.u.); mark add labels to objects.
To reuse the same settings in the future, click on Clone current setting tab, copy the link, and paste it to a file as PlotTwist _Settings.
Notes
Raw data for Figure 1A can be found in Supplementary_File 1.
PlotTwist settings for the graph shown in Figure 1B can be found in Supplementary_File 2. This link can be directly copied and pasted to any web browser to generate the same graph.
Acknowledgments
This work was supported by Science Foundation Ireland (16/RI/3740, 16/US/3301, 18/RI/5792) and the Health Research Board (16/US/330, TRA/2007/26). This research was funded in whole or in part by Science Foundation Ireland.
This protocol is related to our previous published study in Journal of Cell Biology (Bozkurt et al., 2021, doi:10.1083/jcb.202010030).
Competing interests
The authors declare no competing interests.
References
- Bozkurt, E., Düssmann, H., Salvucci, M., Cavanagh, B. L., Van Schaeybroeck, S., Longley, D. B., Martin, S. J. and Prehn, J. H. (2021). TRAIL signaling promotes entosis in colorectal cancer. J Cell Biol 220(11): e202010030.
- Cho, H. M., Ryu, J. R., Jo, Y., Seo, T. W., Choi, Y. N., Kim, J. H., Chung, J. M., Cho, B., Kang, H. C. and Yu, S.-W. (2019). Drp1-Zip1 interaction regulates mitochondrial quality surveillance system. Mol Cell 73(2): 364-376. e368.
- Düßmann, H., Rehm, M., Kögel, D. and Prehn, J. H. (2003). Outer mitochondrial membrane permeabilization during apoptosis triggers caspase-independent mitochondrial and caspase-dependent plasma membrane potential depolarization: a single-cell analysis. J Cell Sci 116(3): 525-536.
- Fais, S. and Overholtzer, M. (2018). Cell-in-cell phenomena in cancer. Nat Rev Cancer 18(12): 758-766.
- Florey, O., Kim, S. E., Sandoval, C. P., Haynes, C. M. and Overholtzer, M. (2011). Autophagy machinery mediates macroendocytic processing and entotic cell death by targeting single membranes. Nat Cell Biol 13(11): 1335-1343.
- Garanina, A. S., Kisurina-Evgenieva, O. P., Erokhina, M. V., Smirnova, E. A., Factor, V. M. and Onishchenko, G. E. (2017). Consecutive entosis stages in human substrate-dependent cultured cells. Sci Rep 7(1): 1-12.
- Goedhart, J. (2020). PlotTwist: A web app for plotting and annotating continuous data. PLoS Biol 13;18(1): e3000581.
- Hamann, J. C., Surcel, A., Chen, R., Teragawa, C., Albeck, J. G., Robinson, D. N. and Overholtzer, M. (2017). Entosis is induced by glucose starvation. Cell Rep 20(1): 201-210.
- Mackay, H. L., Moore, D., Hall, C., Birkbak, N. J., Jamal-Hanjani, M., Karim, S. A., Phatak, V. M., Piñon, L., Morton, J. P. and Swanton, C. (2018). Genomic instability in mutant p53 cancer cells upon entotic engulfment. Nat Commun 9(1): 1-15.
- Overholtzer, M., Mailleux, A. A., Mouneimne, G., Normand, G., Schnitt, S. J., King, R. W., Cibas, E. S. and Brugge, J. S. (2007). A nonapoptotic cell death process, entosis, that occurs by cell-in-cell invasion. Cell 131(5): 966-979.
Article Information
Copyright
© 2022 The Authors; exclusive licensee Bio-protocol LLC.
How to cite
Readers should cite both the Bio-protocol article and the original research article where this protocol was used:
- Bozkurt, E., Düssmann, H. and Prehn, J. H. M. (2022). Fluorescence Time-lapse Imaging of Entosis Using Tetramethylrhodamine Methyl Ester Staining. Bio-protocol 12(23): e4564. DOI: 10.21769/BioProtoc.4564.
- Bozkurt, E., Düssmann, H., Salvucci, M., Cavanagh, B. L., Van Schaeybroeck, S., Longley, D. B., Martin, S. J. and Prehn, J. H. (2021). TRAIL signaling promotes entosis in colorectal cancer. J Cell Biol 220(11): e202010030.
Category
Cancer Biology > Cell death > Cell biology assays
Cell Biology > Cell isolation and culture > Monolayer culture
Cell Biology > Cell imaging > Live-cell imaging
Do you have any questions about this protocol?
Post your question to gather feedback from the community. We will also invite the authors of this article to respond.
Share
Bluesky
X
Copy link


