- Protocols

- Articles and Issues
- For Authors
- About
- Become a Reviewer

Assessing the in vitro Binding Affinity of Protein–RNA Interactions Using an RNA Pull-down Technique
Published: Vol 12, Iss 23, Dec 5, 2022 DOI: 10.21769/BioProtoc.4560 Views: 4185
Reviewed by: Gal HaimovichMarion HoggJian Chen
Original research article
The authors used this protocol in:
Apr 2020
Advertisement


Protocol Collections
Comprehensive collections of detailed, peer-reviewed protocols focusing on specific topics


Related protocols
Abstract
RNA is a vital component of the cell and is involved in a diverse range of cellular processes through a variety of functions. However, many of these functions cannot be performed without interactions with proteins. There are currently several techniques used to study protein–RNA interactions, such as electrophoretic mobility shift assay, fluorescence anisotropy, and filter binding. RNA-pulldown is a technique that uses biotinylated RNA probes to capture protein–RNA complexes of interest. First, the RNA probe and a recombinant protein are incubated to allow the in vitro interaction to occur. The fraction of bound protein is then captured by a biotin pull-down using streptavidin-agarose beads, followed by elution and immunoblotting for the recombinant protein with a His-tag–reactive probe. Overall, this method does not require specialized equipment outside what is typically found in a modern molecular laboratory and easily facilitates the maintenance of an RNase-free environment.
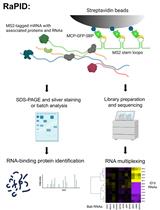
Graphical abstract

Background
DNA is the fundamental molecule containing the genetic information of the cell. However, RNA and its interactions with proteins play an essential functional role in using this genetic information and translating it to biological implication(s). RNA is less stable than DNA, is often single-stranded, and forms secondary and tertiary structures such as hairpins, helices, stem-loops, and others. The structure and sequence of an RNA molecule are essential for the formation of specific protein–RNA complexes (Singh et al., 2019). Further, there are thousands of proteins in the cell responsible for recognizing specific RNAs, and these interactions may be critical for carrying out their role: they may promote or repress RNA degradation, as well as regulate the splicing, transport, and translation of mRNA strands (Corley et al., 2020).
Many proteins are subjected to dynamic post-translational modifications (PTMs), which impact the structure and function of the proteins being modified (Ramazi and Zahiri, 2021). These PTMs include, but are not limited to, phosphorylation, acetylation, ubiquitination, and methylation. Further, any mutation in protein sequence may block PTMs and prevent protein–RNA interactions (Zhang et al., 2020). Similarly, RNA may be subjected to chemical modifications that impact its structure. These RNA modifications include methylation of adenosine (N6-methyladenosine), guanine carbonyl addition (8-oxo-7,8-dihydroguanosine), and acetylation of cytidine (N4-acetylcytidine), among others (Boo and Kim, 2020). For these reasons, the study of protein–RNA interactions is necessary for improving our understanding of how RNA plays a role in vital cellular processes.
Traditionally, electrophoretic mobility shift assays (EMSA), fluorescence anisotropy, and filter binding have been used to study protein–RNA interactions (Majumder and Palanisamy, 2021). In contrast to traditional techniques, the proposed RNA pull-down method obtains in vitro binding affinity measurements (i.e., KD) for protein–RNA interactions (Figure 1A and 1B). Furthermore, RNA pull-down offers an approach in which an RNase-free environment is easy to maintain and uses standard immunoblotting for detection of bound protein. This contrasts with other protocols such as fluorescence anisotropy, which depend on specialized equipment, or other techniques, which are difficult to maintain an RNase-free environment. RNA pull-down can provide valuable information regarding protein–RNA binding affinities and analyze the effect of chemical modifications on these interactions. We have successfully applied this protocol to study the binding of nuclear polyadenylated RNA-binding (Nab) 3 protein RNA-recognition motif (RRM) with RNA and how point mutations to the lysine-363 residue affect this protein–RNA interaction (Lee et al., 2020).
Materials and Reagents
PCR tubes (Bio Basic Canada Inc., catalog number: BP541-S100)
P200 tip (Bio Basic Canada Inc., catalog number: BT224-YS)
Eppendorf tube (UltiDent Scientific, catalog number: 87-B150-C)
96-well microplate (Corning, catalog number: 351172)
PVDF membrane (GE Healthcare, catalog number: 10600023)
15 mL Falcon tube
Streptavidin agarose (Millipore Sigma, catalog number: 69203)
Bovine serum albumin (BSA) (Bioshop, catalog number: ALB001.100)
RNA probe (Sigma, sequence: 5’-[Btn]UUUCUUUUUUCUUAUUCUUAUU-3’; see Note 1)
DEPC (Bio Basic, catalog number: 1609-47-8)
Nonfat dry milk (Carnation, catalog number: n/a)
Clarity Western ECL substrate (Bio-Rad, catalog number: 170-5060)
Tris (Bioshop, catalog number: 77-86-1)
Tris-HCl (Bioshop, catalog number: 1185-53-1)
Hydrochloric acid (HCl) (Anachemia, catalog number: CA11020-884)
Sodium hydroxide pellets (Bioshop, catalog number: SHY700.2)
NaCl (Bioshop, catalog number: SOD002.1)
DTT (Bioshop, catalog number: DTT001.25)
EDTA, disodium dihydrate (Bioshop, catalog number: EDT001.500)
Glycerol (Bioshop, catalog number: 56-81-5)
SDS (BioShop, catalog number: SDS001)
Tween-20 (Bioshop, catalog number: TWN510.500)
Bromophenol blue (Sigma, catalog number: B-6896)
2-Mercaptoethanol (Sigma, catalog number: M3148)
HisProbe-HRP conjugate (Thermo Fisher Scientific, catalog number: 15165)
Protein assay dye reagent concentrate (Bio-Rad, catalog number: 5000006)
Stock solutions (see Recipes)
Pull-down buffers & solutions (see Recipes)
Western blotting & other buffers (see Recipes)
Equipment
100 mL beaker
500 mL beaker
Magnetic stirrer
Sorvall Legend Micro 21 centrifuge (Thermo Scientific, catalog number: 75772436)
Mini centrifuge (Fisher Scientific, catalog number: 05-090-100)
Gel Doc XR+ imaging system (Bio-Rad, model: Universal Hood II)
Thermocycler (Bio-Rad, model: ICycler Thermal Cycler)
Rotator (Kylin-Bell Lab Instruments, model: BE-1100)
-80 °C freezer (Thermo Scientific, model: 990)
Software
ImageJ 1.50c software
GraphPad Prism v7.00
Procedure
The procedure below outlines three main steps: (A) bead preparation, (B) protein–RNA binding reactions, and (C) streptavidin–biotin pull-down and detection. This procedure was originally applied to study the binding affinity of the interaction between Nab3 RRM and a biotinylated small nucleolar RNA (e.g., snR47) probe (Lee et al., 2020). If this procedure is to be used with other protein–RNA interactions, then we recommend taking into consideration how variables (e.g., RNA probe length, RNA structure, buffer conditions, temperature, etc.) may affect the RNA–protein interaction and adjust accordingly (see Notes 2 and 4). Further, the protein source here is the recombinant His-tagged Nab3 RRM, expressed and purified from E. coli. A pure protein source is preferred if obtaining binding affinity measurements is desired (see Note 2).
Bead preparation
Cut off the end (2–3 mm on average) of a P200 tip and transfer 150 μL (i.e., 75 μL dry bead volume) of streptavidin-agarose to an Eppendorf tube (see Note 3).
Centrifuge beads at 500 × g for 2 min and discard the supernatant (see Note 5).
Wash with 1 mL of wash buffer for 5 min with end-to-end rotation.
Spin down beads at 500 × g for 2 min and discard the supernatant.
Repeat steps A3–A4 twice.
Add 300 μL of wash buffer containing 5% BSA to the beads and incubate for 4 h with end-to-end rotation.
Spin down beads at 500 × g for 2 min and discard supernatant.
Wash with 500 μL of wash buffer for 5 min with end-to-end rotation.
Spin down beads at 500 × g for 2 min and discard supernatant.
Repeat steps A8–A9 five times but retain the supernatant of the fifth wash for a Bradford assay.
In triplicates, add 10 μL of wash buffer (as a blank) or the supernatant retained in the previous step to 190 μL of diluted Bradford reagent in a 96-well microplate and measure absorbance at 595 nm.
Proceed to step A13 if the supernatant is indistinguishable from the blank. If not, repeat steps A8–A9 until this result is obtained.
Resuspend beads in 260 μL of wash buffer.
Distribute 20 μL of beads (approximately 5 μL dry bead volume) into individual PCR tubes using a P200 tip with the end cut off.
Keep the prepared bead suspension at 4 °C or on ice until needed.
Protein–RNA binding reactions
Remove RNA probe, protein stock, and protein storage buffer from -80 °C and leave to thaw on ice.
Prepare binding reactions in PCR tubes as 10 μL reactions according to Table 1. Adjust volumes to achieve desired protein or RNA concentrations.
Table 1. Protein–RNA binding reactions.
The example below shows an initial experimental setup for preparing binding reactions with a fixed RNA probe concentration of 25 μM, varying protein concentration from 1 to 50 μM, and reaction controls.
5× binding buffer (μL) Final protein concentration (μM) 100 μM protein stock (μL) Protein storage buffer (μL) Final RNA probe concentration (μM) 250 μM RNA probe (μL) DEPC water Control 1 2 0 0 7 25 1 0 Control 2 2 50 5 2 0 0 1 Reaction 2 1–50 0.1–5 2–6.9 25 1 0 Incubate in a thermocycler for 30 min at 15 °C.
Place the reactions on ice and immediately proceed to Section C.
Streptavidin–biotin pull-down and detection
Note: Unless otherwise stated, all centrifugations should occur on the mini centrifuge (2,200 × g) at room temperature.
Transfer each binding reaction or control to a separate PCR tube containing prepared beads.
Incubate at 4 °C for 2 h with end-to-end rotation.
Spin down beads for 2 min and discard the supernatant.
Wash beads with 100 μL of wash buffer for 5 min with end-to-end rotation.
Repeat step C3.
Repeat steps C4–C5 four times.
Add 20 μL of Laemmli buffer with 2-mercaptoethanol to elute the bound protein.
Mix and heat tubes in a thermocycler at 95 °C for 5 min.
Spin down beads for 2 min.
Load the entire sample (supernatant) on a standard SDS-PAGE gel (here, a 17% gel was used, which is specific for the recombinant protein of interest due to its small size; see Notes 6 and 7).
Run the gel at 120 V for approximately 2 h (until the dye front reaches the bottom).
Transfer proteins onto a PVDF membrane at 180 mA for 2 h.
Block membrane in blocking buffer for 1 h.
Wash membrane five times for 5 min with TBST (see Recipes).
Incubate membrane with appropriate antibody or probe (HRP-conjugated HisProbe) for 4 h or overnight at 4 °C.
Wash membrane five times for 5 min with TBST.
Image membrane by standard chemiluminescent detection with ECL substrate.
Representative data
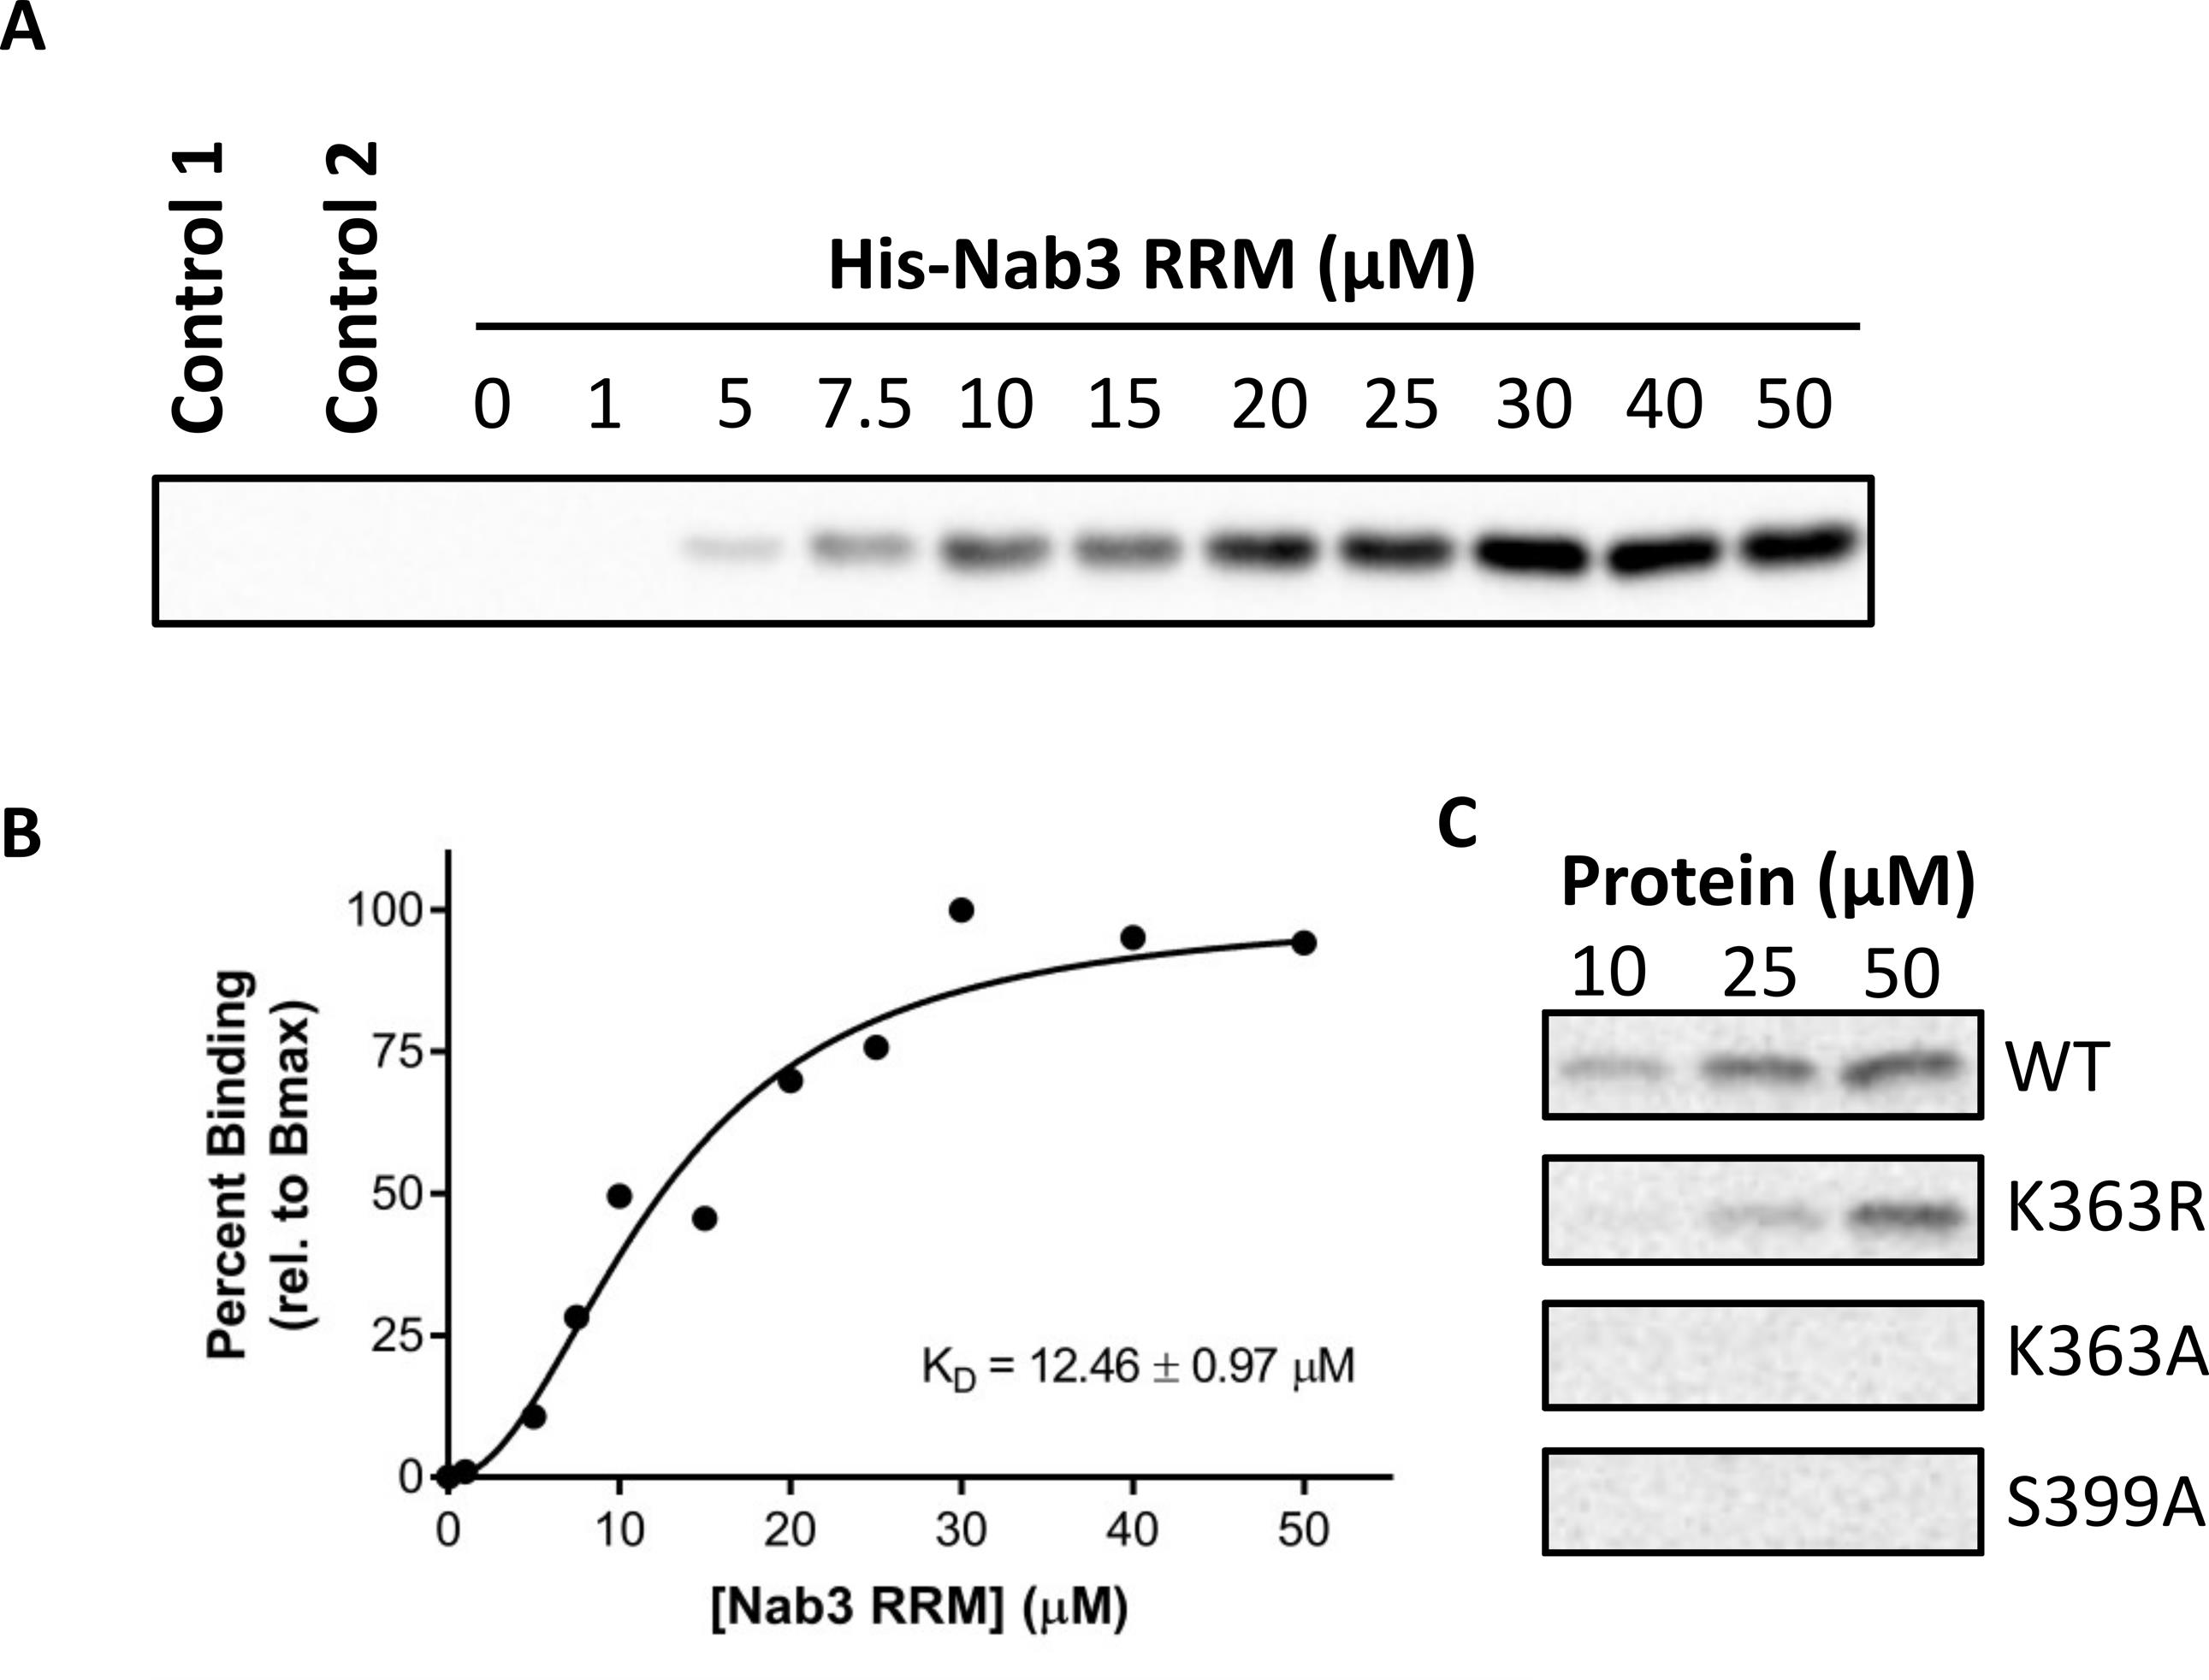
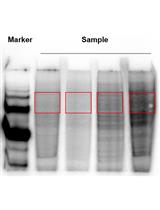
Figure 1. Assessing the binding of His-Nab3 RRM (329–419) to biotinylated snR47 RNA probe. (A) Chemiluminescent detection of bound His-tagged recombinant protein (1–50 μM) to 25 μM RNA probe using HRP-conjugated HisProbe. (B) Dose-responsive binding curve of variable His-Nab3 RRM (329–419) to the biotinylated snR47 RNA probe. KD is shown in the figure panel. (C) Chemiluminescent detection of bound His-Nab3 RRM wildtype and mutant proteins (10, 25, 50 μM) to 25 μM RNA probe using HRP-conjugated HisProbe.
Data analysis
Densitometry
Start ImageJ and open the file containing the raw blot image.
Convert the image to 8 bit grayscale by selecting “Image,” “Type,” then “8-bit.”
Set the measurement criteria by selecting “Analyze” and then “Set Measurements.” In the pop-up window, ensure that only “Mean gray value” is checked and click “OK.”
Draw a rectangle around the largest band on the blot.
Click “Analyze,” then “Measure” (or Ctrl+M), then record the value.
Without adjusting the size of the rectangle, move the rectangle to the next band and repeat step A5.
Continue measuring the density of the protein band for each sample lane, including the lane for the zero protein condition (this will serve as a background measurement).
Subtract the background value from all other values.
Normalize each condition to the maximum binding signal (i.e., Bmax).
Curve fitting and KD estimation
Start GraphPad Prism.
In the pop-up window under “New table & graph” select “XY.” Under “Enter/import data,” for “X” select “Numbers” and for “Y” select “Enter and plot a single Y value for each point.” Then click “Create.”
In “Data Tables” enter the protein concentrations and the corresponding normalized binding values.
In “Graphs” visualize the binding curve and ensure that the binding profile reaches saturation.
Under “Analysis” select “Fit a curve with nonlinear regression.”
In the pop-up window under “Dose-response–Stimulation” choose the “[Agonist] vs. normalized response–Variable slope” equation.
Navigate to the “Results” sheet and locate the EC50 value (in this case, where background has been subtracted off, the EC50 represents the KD).
Notes
Several variables must be taken into consideration when designing the RNA probe. The snR47 RNA probe sequence used in the procedure outlined herein was previously used to characterize the protein–RNA interaction between the Nab3 RRM and snRNAs (Hobor et al., 2011). The probe sequence was originally used for fluorescence anisotropy and was 5’-labelled with fluorescent markers. Here, we replaced the fluorophore with biotin to enable the pull-down with streptavidin-coated beads. If aiming to assess the binding affinity between protein–RNA interactions that were previously characterized with fluorescence anisotropy by using this RNA pull-down, then we recommend using the same probe sequence and replacing the fluorophore with biotin on the same end of the RNA. For less characterized RNA–protein interactions, we recommend experimenting with using 5’-biotin or 3’-biotin labels, as well as experimenting with sequence length and the number of binding sites within probe sequence.
We have only performed this procedure using pure recombinant protein prepared from E. coli. Pure sources of native protein can be obtained from other sources [such as recombinants from Sf9 cells or immunoprecipitation from cells (with native elution)]. If aiming to obtain binding affinity measurements (KD) by performing experiments shown in Figure 1A and 1B, then a relatively pure quantifiable source of protein is needed. If aiming to simply assess relative RNA binding of a protein, as shown in Figure 1C, then it is theoretically possible to use other more impure protein sources such as a cell lysate or in vitro translated protein. As an initial experiment, we recommend performing a titration of the sample, given that expression level of the protein of interest may vary.
The bead preparation section outlines a standard procedure for equilibration and blocking of beads. For the volume of beads used, we recommend adjusting this parameter based on the volume of beads needed and the amount of biotinylated RNA probe used. Generally, we aim to use approximately 5 μL of dry bead volume per binding reaction. At a binding capacity of >85 nmol biotin/mL, 5 μL of dry beads is sufficient to capture >425 pmol biotin. At a biotinylated RNA probe concentration of 25 μM in a 10 μL reaction, 250 pmol of probe is present and thus the number of beads used is sufficient to capture all probe molecules.
The binding reaction conditions provided in this protocol are amenable to assessing the binding of Nab3 RRM (329–419) to the snR47 RNA probe. If another interaction is of interest, we recommend using buffer conditions that have been used previously in literature. The probe and protein concentration ranges used here are a good starting point for assessing biological interactions; however, these variables may need to be optimized. If increasing the concentration of biotinylated RNA probe, ensure that enough streptavidin-agarose beads are being used, so that the amount of RNA captured is not limited by the binding capacity of the beads. Other variables such as binding reaction temperature and time should be taken into consideration, as these may influence degradation of the RNA probe used. We and others have used the snR47 probe sequence in Nab3-RNA binding reactions at 15 °C and 25 °C (Hobor et al., 2011), respectively. Finally, temperature and certain buffer components, such as DTT, may influence secondary and tertiary structures formed. The Nab3 RRM binding to snR47 does not involve secondary or tertiary RNA structures; however, if such structures are required for the protein of interest, then we suggest adjusting temperature and binding reactions accordingly.
To ensure that no beads are lost during the removal of the supernatant, a needle can be used to remove the supernatant.
The parameters of SDS-PAGE (e.g., gel percentage) and transfer (e.g., time) may need to be changed depending on the size of the protein of interest.
To ensure that the method of detection performs as expected, an additional lane can be loaded containing the recombinant protein of interest. Generally, loading 10% of the inputted protein should be sufficient for detection by immunoblotting.
Dry SDS in powdered form is very dangerous to work with; it is recommended to wear appropriate personal protective equipment such as face mask and safety goggles when weighing the powder. As an alternative, it is preferred to purchase ready-made 10% and 20% SDS solutions.
Recipes
Stock solutions
Tris, 1 M pH 8.0
Add 121.14 g of Tris to a 1 L beaker
Add 800 mL of distilled water
Stir with a magnetic stirrer until dissolved
Adjust pH to 8.0 with HCl
Top up volume to 1 L in a graduated cylinder
Autoclave at 121 °C for 20 min
Store at room temperature
Tris, 1 M pH 6.8
Add 121.14 g of Tris to a 1 L beaker
Add 800 mL of distilled water
Stir with a magnetic stirrer until dissolved
Adjust pH to 6.8 with HCl
Top up volume to 1 L in a graduated cylinder
Autoclave at 121 °C for 20 min
Store at room temperature
SDS, 10% w/v
Add 10 g of SDS to a 100 mL beaker (see Note 8)
Add 100 mL of distilled water
Stir with a magnetic stirrer until dissolved
Store at room temperature
Tris-HCl, 1 M pH 7.8
Add 157.6 g of Tris-HCl to a 1 L beaker
Add 800 mL of distilled water
Stir with a magnetic stirrer until dissolved
Adjust pH to 7.8 with HCl
Top up volume to 1 L in a graduated cylinder
Autoclave at 121 °C for 20 min
Store at room temperature
NaCl, 4 M
Add 116.88 g of NaCl to a 500 mL beaker
Add 350 mL of distilled water
Stir with a magnetic stirrer until dissolved
Top up volume to 500 mL in a graduated cylinder
Autoclave at 121 °C for 20 min
Store at room temperature
DTT, 1 M
Add 1.54 g of DTT to a 15 mL Falcon tube
Add 7.5 mL of distilled water
Invert or vortex until dissolved
Top up volume to 10 mL
Make 0.5–1 mL aliquots in Eppendorf tubes and store at -20 °C
EDTA, 0.5 M pH 8
Add 93.06 g of EDTA to a 500 mL beaker
Add 300 mL of distilled water
Stir with a magnetic stirrer and slowly add approximately 20 g of sodium hydroxide pellets to dissolve
Adjust pH to 8
Top up volume to 500 mL in a graduated cylinder
Autoclave at 121 °C for 20 min
Store at room temperature
DEPC H2O
Add 1 mL of DEPC to 999 mL of distilled water
Stir overnight at room temperature on a magnetic stir plate
Autoclave at 121 °C for 20 min
Store at room temperature
Pull-down buffers & solutions
Protein storage buffer
Reagent Final concentration Amount Tris (1 M, pH 8.0) 20 mM 20 mL NaCl (4 M) 250 mM 62.5 mL Glycerol 5% (v/v) 50 mL DTT (1 M) 1 mM 1 mL H2O n/a 866.5 mL Total n/a 1 L 5× binding buffer
Reagent Final concentration Amount Tris-HCl (1 M, pH 7.8) 50 mM 0.5 mL NaCl (4 M) 250 mM 0.625 mL EDTA (0.5 M) 5 mM 0.1 mL Glycerol 25% (v/v) 2.5 mL DTT (1 M) 12.5 mM 0.125 mL DEPC H2O n/a 6.15 mL Total n/a 10 mL Wash buffer
Reagent Final concentration Amount Binding buffer (5×) 1× 2 mL Tween-20 0.1% 10 μL DEPC H2O n/a 8 mL Total n/a 10 mL RNA probe
Depending on the amount of RNA probe received, dissolve in enough volume of DEPC water to a final concentration of 250 μM.
Quickly aliquot and store at -80 °C until use.
Protein stock
Depending on the concentration of pure recombinant protein, dilute the protein to a final concentration of 100 μM using protein storage buffer (see Note 2).
Western blotting & other buffers
Diluted Bradford reagent
Note: Prepare just before use.
Add 1 mL of protein assay dye reagent concentrate to a 15 mL Falcon tube.
Add 4 mL of distilled water and invert to mix.
TBST, pH 7.6
Dissolve 3.152 g of Tris-HCl and 8.006 g of NaCl in 800 mL of distilled water
Adjust the pH to 7.6 with sodium hydroxide
Add 1 mL of Tween-20 and mix
Top up the volume to 1 L with distilled water
Store at room temperature
Blocking buffer
Note: Prepare just before use.
Dissolve 1 g of nonfat dry milk in 10 mL of TBST
Invert or vortex to dissolve
Diluted HisProbe-HRP conjugate in TBST
Note: Prepare just before use.
In a 15 mL Falcon tube, dilute 1 μL of HisProbe-HRP conjugate in 5 mL of TBST
Store at 4 °C or on ice until just before use
Store the used solution at 4 °C
Laemmli buffer, 2×
Reagent Final concentration Amount Tris (1 M, pH 6.8) 120 mM 1.2 mL Glycerol 20% v/v 2 mL SDS (10% w/v) 4% w/v 4 mL Water n/a 2.8 mL Bromophenol blue 0.02% w/v 2 mg Total n/a 10 mL Laemmli buffer with 2-mercaptoethanol
In a 1.5 mL Eppendorf tube, mix 50 μL of 2-mercaptoethanol and 950 μL of Laemmli buffer, 2×
Store at room temperature
Acknowledgments
This research was supported by Discovery Grants from the Natural Science and Engineering Council (NSERC) of Canada to K.K.B (grant no. RGPIN-2016-06151). Anand Chopra held a Canada Graduate Scholarship-Doctoral (CGS-D), from the NSERC of Canada. Feras Balbous held an Undergraduate Student Research Award from the NSERC of Canada. This protocol was used in Lee et al. (2020).
Competing interests
The authors declare no competing interests.
References
- Boo, S. H. and Kim, Y. K. (2020). The emerging role of RNA modifications in the regulation of mRNA stability. Exp Mol Med 52(3): 400-408.
- Corley, M., Burns, M. C. and Yeo, G. W. (2020). How RNA-Binding Proteins Interact with RNA: Molecules and Mechanisms. Mol Cell 78(1): 9-29.
- Hobor, F., Pergoli, R., Kubicek, K., Hrossova, D., Bacikova, V., Zimmermann, M., Pasulka, J., Hofr, C., Vanacova, S., Stefl, R. (2011). Recognition of transcription termination signal by the nuclear polyadenylated RNA-binding (NAB) 3 protein. J Biol Chem 286(5): 3645-3657.
- Lee, K.Y., Chopra, A., Burke, G.L., Chen, Z., Greenblatt, J.F., Biggar, K.K., Meneghini, M.D. (2020) A crucial RNA-binding lysine residue in the Nab3 RRM domain undergoes SET1 and SET3-responsive methylation. Nucleic Acids Res. 48(6): 2897-2911.
- Majumder, M. and Palanisamy, V. (2021). Compendium of Methods to Uncover RNA-Protein Interactions In Vivo. Methods Protoc 4(1): 22.
- Ramazi, S. and Zahiri, J. (2021). Posttranslational modifications in proteins: resources, tools and prediction methods. Database (Oxford) 2021.
- Singh, J., Hanson, J., Paliwal, K. and Zhou, Y. (2019). RNA secondary structure prediction using an ensemble of two-dimensional deep neural networks and transfer learning. Nat Commun 10(1): 5407.
- Zhang, N., Lu, H., Chen, Y., Zhu, Z., Yang, Q., Wang, S. and Li, M. (2020). PremPRI: Predicting the Effects of Missense Mutations on Protein-RNA Interactions. Int J Mol Sci 21(15): 5560.
Article Information
Copyright
© 2022 The Authors; exclusive licensee Bio-protocol LLC.
How to cite
Chopra, A., Balbous, F. and Biggar, K. K. (2022). Assessing the in vitro Binding Affinity of Protein–RNA Interactions Using an RNA Pull-down Technique. Bio-protocol 12(23): e4560. DOI: 10.21769/BioProtoc.4560.
Category
Biochemistry > RNA > RNA-protein interaction
Molecular Biology > RNA > RNA-protein interaction
Do you have any questions about this protocol?
Post your question to gather feedback from the community. We will also invite the authors of this article to respond.