- Protocols

- Articles and Issues
- For Authors
- About
- Become a Reviewer

Binding Affinity Measurements Between DNA Aptamers and their Virus Targets Using ELONA and MST
Published: Vol 12, Iss 21, Nov 5, 2022 DOI: 10.21769/BioProtoc.4548 Views: 3451
Reviewed by: Alka MehraAbhilash PadavannilAnonymous reviewer(s)
Original research article
The authors used this protocol in:

Sep 2021
Advertisement


Protocol Collections
Comprehensive collections of detailed, peer-reviewed protocols focusing on specific topics


Abstract
Aptamers have been selected with strong affinity and high selectivity for a wide range of targets, as recently highlighted by the development of aptamer-based sensors that can differentiate infectious from non-infectious viruses, including human adenovirus and SARS-CoV-2. Accurate determination of the binding affinity between the DNA aptamers and their viral targets is the first step to understanding the molecular recognition of viral particles and the potential uses of aptamers in various diagnostics and therapeutic applications. Here, we describe protocols to obtain the binding curve of the DNA aptamers to SARS-CoV-2 using Enzyme-Linked Oligonucleotide Assay (ELONA) and MicroScale Thermophoresis (MST). These methods allow for the determination of the binding affinity of the aptamer to the infectious SARS-CoV-2 and the selectivity of this aptamer against the same SARS-CoV-2 that has been rendered non-infectious by UV inactivation, and other viruses. Compared to other techniques like Electrophoretic Mobility Shift Assay (EMSA), Surface Plasmon Resonance (SPR), and Isothermal Titration Calorimetry (ITC), these methods have advantages for working with larger particles like viruses and with samples that require biosafety level 2 facilities.
Keywords: AptamerBackground
Infectious diseases remain one of the biggest challenges for human health, with the current COVID-19 pandemic as a primary example. Accurate and early detection of viruses is crucial for transmission control through clinical diagnosis and therapy. To achieve this goal, DNA aptamers have emerged as a promising approach to develop sensors for on-site and real-time detection and quantitation. DNA aptamers are short single-strand DNA molecules with a specific sequence that allow them to form a specific three-dimensional conformation to recognize a certain target with high affinity and selectivity (Huizenga 1997; Cho et al., 2009; Liu et al., 2009; Xiang and Lu 2014; Xing et al., 2014; Li et al., 2019; Ma et al., 2021; Xie et al., 2021). They have been shown to be highly specific for binding viruses (Balogh et al., 2010; González et al., 2016; Zou et al., 2019; Kukushkin et al., 2019; Peinetti et al., 2021), rivaling antibodies. Furthermore, DNA aptamers have gained considerable attention because they are cost-effective, have easy chemical modifications, and have high chemical stability, binding affinity, repeatability, and reusability (Liu et al., 2009; Fang and Tan 2010; Dunn et al., 2017; Hong et al., 2020). All these features make them ideal candidates for developing affordable, rapid, sensitive methods able to identify new or emerging viruses, including virus variants (Xing et al., 2014; Zou et al., 2019; Li et al., 2021; Peinetti et al., 2021; Chakraborty et al., 2022). Aptamers are obtained from a random DNA library by an iterative procedure called Systematic Evolution of Ligands by EXponential enrichment (SELEX), which is carried out in test tubes with large sampling libraries (~1015) and is performed in a much shorter time with less cost than the generation of antibodies, peptides, and small molecule agents (Ellington and Szostak 1990; Tuerk and Gold 1990). More importantly, counter selection during SELEX to remove the DNA molecules that bind similar competing species can enhance the selectivity of aptamers and give them unique properties (Bruesehoff et al., 2002; Shen et al., 2016), such as differentiating an intact infectious virus from its non-infectious version (Peinetti et al., 2021).
Given the success of SELEX in obtaining aptamers for a wide variety of targets, including infectious viruses, it is important to measure their binding affinity to the targets and to similar competing species to understand the interactions of the aptamer with their targets (Sun et al., 2021; Zhang et al., 2021). In addition to validating the capability of the aptamers to bind their intended targets but not other targets, the results provide quantitative measures on how strong and how selective the binding is and thus play a vital role in optimizing their performance as sensors, imaging tools, or therapeutic agents.
Viruses generally present several proteins in high copy number on their surfaces that are potential targets for aptamer recognition (Kwon et al., 2020; Li et al., 2022). Considering the high copy number and possibility of higher-ordered structures and arrangements of the proteins on the virus surface, it is more reasonable to determine the binding affinity of aptamers using the whole virus, rather than using the viral protein or a domain of the protein in solution. There are several sources of discrepancies between using the whole virus or just the purified protein. One of the most critical differences is that surface proteins exist in their native state on the surface of the virus. For example, the spike protein of SARS-CoV-2 is in trimeric form on the virus surface, and thus it is very challenging to purify the protein in its native-like environments that preserve their conformation (Cai et al., 2020; Tai et al., 2020; Juraszek et al., 2021). Moreover, as there are multiple copies of the same protein in each virion, the avidity effect jointly with multivalent effects may significantly affect the binding capability (Kwon et al., 2020; Kim et al., 2022). An aptamer that would bind to a single protein may have a significantly different binding affinity or may not even bind at all to the protein when expressed on the surface of a virion, and vice versa. Therefore, to allow direct detection of the virus, it is best to determine the binding affinity between the aptamer and the intact virus.
To perform binding assays between aptamers and intact viruses, there are some aspects and challenges that need to be considered. First, the DNA aptamer structures depend on the experiment conditions more than other recognition macromolecules such as antibodies or other folded proteins (Liu et al., 2009; Xia et al., 2013). Therefore, determining the affinity constant of an aptamer requires rigorous control of the experimental conditions to obtain reproducible results. Second, the available techniques for binding assays that can be performed with the intact virus are limited compared to proteins. For instance, viruses are larger than proteins, and a common binding assay like Electrophoretic Mobility Shift Assay (EMSA) cannot be performed. Furthermore, handling the whole intact virus or intact pseudoviruses (when working with BSL3 viruses such as SARS-CoV-2) could require a biosafety level 2 (BSL2) facility or even more stringent safety considerations. As a result, the equipment for the measurement needs to be housed in a BSL2 lab and requires regular decontamination with solutions like bleach that can be damaging to instruments if there are not available disposable options to introduce the viral sample. Because of these requirements, it is difficult to use some techniques such as Surface Plasmon Resonance (SPR) or Isothermal Titration Calorimetry (ITC) that have been successfully applied to characterize other aptamer-target bindings (Ramakrishnan et al., 2012; Chen et al., 2015; Harazi et al., 2017).
Here, we describe two different techniques that can be used to obtain binding affinity of aptamers to viruses. First, Enzyme-Linked Oligonucleotide Assay (ELONA), which has been more extensively used for studying the binding between aptamers and viruses (Drolet et al., 1996; Balogh et al., 2010; Bai et al., 2018). This method immobilizes the virus on a surface and uses biotin-labeled aptamers and streptavidin-labeled horseradish peroxidase (HRP) to carry out colorimetric assays through oxidation of 3,3′,5,5′-tetramethylbenzidine (TMB) substrate to 3,3',5,5'-tetramethylbenzidine diamine. By changing the concentration of the aptamer relative to the virus and measuring the amount of bound aptamer, it is possible to determine the binding affinity as a dissociation constant (KD). Second, a more recent method, MicroScale Thermophoresis (MST), which monitors thermophoretic mobility change in a fluorescent DNA aptamer as a function of the concentration of virus to determine the binding affinity (Duhr et al., 2004; Plach et al., 2017). MST is a simpler assay to set up and offers the possibility to determine binding affinity, binding stoichiometry, and interaction thermodynamics (Baaske et al., 2010; Jerabek-Willemsen et al., 2011). In this work, we used both protocols to measure the binding of DNA aptamers and SARS-CoV-2 pseudoviruses (Peinetti et al., 2021). It is important to mention that pseudoviruses are used for SARS-CoV-2 to reduce the biosafety level required for SARS-CoV-2 viruses from BSL3 to BSL2. However, these methods can be used for other viruses, including different types of viruses, from enveloped RNA viruses like the one shown here, to non-enveloped DNA viruses, as demonstrated in our recent paper (Peinetti et al., 2021).
Materials and Reagents
Materials
PCR tubes (USA Scientific, catalog number: AB1183)
Eppendorf tubes (1.5 mL) (Sigma-Aldrich, catalog number: T9661)
Pipette tips (10 μL, 200 μL, 1,000 μL) (Thomas Scientific, catalog numbers: 1158U43, 1159M44, 1158U40)
NanoTemper capillary tubes (NanoTemper, catalog number: MO-K022)
Corning® 96-Well Half-Area Clear Flat Bottom Polystyrene High Bind Microplate, without lid, nonsterile (Sigma-Aldrich, catalog number: CLS3690)
Paraffin wax (CAS number: 8002-74-2) (Sigma-Aldrich, catalog number: 327204)
Reagents
PBS 1× without calcium & magnesium (Corning catalog number: 21-040-CV)
Tris(hydroxymethyl)aminomethane (Tris, CAS number: 77-86-1) (Sigma-Aldrich, catalog number: T1503)
Sodium chloride (NaCl, CAS number: 7647-14-5) (Sigma-Aldrich, catalog number: S7653)
Magnesium chloride (MgCl2, CAS number: 7786-30-3) (Sigma-Aldrich, catalog number: M8266)
Calcium chloride (CaCl2, CAS number: 10043-52-4) (Sigma-Aldrich, catalog number: C4901)
Tween® 20 (CAS number: 9005-64-5) (Sigma-Aldrich, catalog number: P1379)
Bovine Serum Albumin (BSA, CAS number: 9048-46-8) (Sigma-Aldrich, catalog number: A7030)
Sodium acetate (CH3COONa, CAS number: 127-09-3) (Sigma-Aldrich, catalog number: S2889)
3,3′,5,5′-Tetramethylbenzidine (TMB, CAS number: 54827-17-7) (Sigma-Aldrich, catalog number: 860336)
100% Ethanol (CH3CH2OH, CAS number: 64-17-5) (Sigma-Aldrich, catalog number: E7023)
30% Hydrogen peroxide (H2O2, CAS number: 7722-84-1) (Sigma-Aldrich, catalog number: 216763)
Concentrated sulfuric acid (H2SO4, CAS number: 7664-93-9) (Sigma-Aldrich, catalog number: 339741)
Horseradish Peroxidase-Streptavidin (HRP-S) (Sigma-Aldrich, catalog number: OR03L)
SARS-CoV-2, SARS-CoV-1, and H1N5 pseudoviruses were provided by Prof. Rong’s lab (UIC) in PBS buffer (Guo et al., 2009; Wang et al., 2014; Peinetti et al., 2021). The titer of the stock solution was 1 × 10¹¹ copies/mL. The stock solution was aliquoted in tubes containing 20 μL each and kept at -80 °C. Before each experiment, a new aliquot was thawed.
SARS2-AR10 aptamer DNA (Integrated DNA technologies)
FAM-labeled:
5’/56-FAM/CCCGACCAGCCACCATCAGCAACTCTTCCGCGTCCATCCCTGCTG’3
Biotinylated:
5’/5Biosg/CCCGACCAGCCACCATCAGCAACTCTTCCGCGTCCATCCCTGCTG’3
SARS-CoV-2 Pseudoviruses (see Recipes)
SELEX buffer (see Recipes)
PBS-T (see Recipes)
PBS-T-BSA (see Recipes)
Acetate buffer (see Recipes)
Stop solution (see Recipes)
Equipment
Biosafety Cabinet (Labconco Purifier Logic+ Class II, Type A2)
Pipettes (Eppendorf Reference® 20, 100, 200, 1,000) (Eppendorf, catalog numbers: 4920000032, 4920000059, 4920000067, 4920000083)
BioTek H1 Synergy Hybrid Reader (Winooski, VT)
NanoTemper Monolith NT.115 (NanoTemper Technologies, Munich, Germany)
Procedure
Enzyme-linked oligonucleotide assay (ELONA)
Working principles.
ELONA works by measuring the activity of an enzyme that is present only upon aptamer’s binding to the target.
First, the target virus is incubated in a 96-well microplate with high-binding polymer wells, which allow the virus to stick to the well through non-specific binding.
Biotinylated DNA aptamer is added to each well, which binds to the target virus but not other viruses. Overdosed or unbound DNA is washed away.
A reporter enzyme, labeled with a streptavidin, is then added to bind to the biotin end of the aptamer. Then, the enzyme catalyzes a colorimetric reaction. The amount of color product will be proportional to the amount of enzyme that is correlated to aptamer binding events.
The enzyme used here is Horseradish Peroxidase (HRP).
In the presence of H2O2, HRP oxidizes TMB, which produces a blue color.
After quenching the reaction with H2SO4, the blue color turns yellow, and the measured absorbance of the yellow color correlates to the amount of HRP.
In a biosafety cabinet (all procedures from here need to be inside of the biosafety cabinet), dilute the pseudovirus in SELEX buffer to 5 × 10⁸ copies/mL. Mix by flipping the tube. Do NOT vortex. Incubate 50 μL of pseudovirus in each well of a 96-well microplate (Figure 1.1A) at room temperature for 2 h. During this time, the virus will bind to the walls of the well (Figure 1.1B). The plate needs to be covered by parafilm during all the incubation steps.
Note: The pseudovirus can be destroyed by intense mechanical forces. Vortexing is likely to destroy the structure and render it ineffective for this experiment. Similarly, excess pipetting to mix could also be problematic, but it is difficult to say how much is too much pipetting for stability. Instead, we recommend using a gentler method of mixing whenever possible.
Wash each well three times with PBS-T buffer.
Flip the plate and drain the virus solution into a prepared container with bleach (10% v/v) inside. Try to remove the liquid as much as possible by tapping.
Note: There are many ways to remove the liquid from solution. Flipping over a bucket of 10% bleach is our recommendation due to its speed and simplicity of decontaminating. For example, the 96-well plate could also be tapped on an absorbing sheet, but then the sheet must be decontaminated and treated as hazardous waste. Any similar method, including pipetting, would be acceptable; however, flipping and tapping the solution into a bleached waste container is safe, quick, easy, and effective.
Add 100 μL of buffer to each well.
Invert over waste bucket, tapping forcefully if necessary to remove all solution.
Add 50 μL of PBS-T-BSA buffer to each well and incubate at room temperature for 1 h in order to avoid non-specific binding to reduce the background signal (Figure 1.1C).
Wash three times with PBS-T as before.
Prepare array of 11 different biotinylated-ssDNA aptamer concentrations.
Serial dilute to prepare the ssDNA aptamer at the concentration of 1 μM, 500 nM, 250 nM, 100 nM, 50 nM, 25 nM, 10 nM, 2.5 nM, 1 nM, 0.25 nM, 0.1 nM, 0 nM in SELEX buffer. The total volume of each solution should be sufficient to add 40 μL for each replicate, plus a little to account for losses during pipetting. In this case, use three replicates of two different virus conditions (intact and UV-inactivated pseudovirus), for a total of six. To do this effectively, make at least 240 μL of each DNA solution.
Add 40 μL of ssDNA aptamer at different concentrations to each well of the corresponding column (Figure 1.1D), and just SELEX buffer to the first column as a blank (consider loading the plate as shown Figure 1.2). Incubate at room temperature for 1 h.
Wash three times with PBS-T as before.
Add 40 μL of freshly made 1:500 dilution of HRP-S in PBS-T buffer to each well. Incubate for 1 h (Figure 1.1E).
Prepare TMB solutions.
TMB stock solution (should always be made fresh during experiment)
Dissolve 5 mg of TMB in 5 mL of 100% ethanol.
TMB working solution (Should always be made fresh during experiment)
Add 1 mL of TMB stock solution to 4 mL of acetate buffer.
Add 3 μL of 30% hydrogen peroxide.
Wash three times with PBS-T as before.
Add 50 μL of TMB working solution to each well (Figure 1.1F).
Incubate in the dark until the light blue color builds up for high concentration groups (approximately 20–30 min).
Quench the reaction by adding 10 μL of stop solution. After quenching, the blue product turns yellow in the acid solution (Figure 1.1G).
Measure the yellow product, which has an absorption peak at 450 nm (OD450), using the BioTek microplate reader (Figure 1.3).

Figure 1. Scheme and example of sample loading of the Enzyme-Linked Oligonucleotide Assay (ELONA). 1A) Empty well of 96-well microplate. 1B) Add pseudovirus (step A2). 1C) Add BSA to block non-specific binding (step A4). 1D) Add biotinylated aptamer according to the concentrations in Figure 1.2 (steps A6–7). 1E) Add Avidin-HRP (step A9). 1F) Add TMB (step A12). 1G) Add stop solution (step A14). 2) A plate layout of the 96-well plate. All the wells contain the same amount of virus, either SARS-CoV-2 or UV-inactivated SARS-CoV-2, as indicated in the layout. Concentrations in the scheme correspond to biotinylated aptamer concentrations. 3) A picture of the instrument used.
Microscale Thermophoresis (MST)
Working principles
The physical phenomenon ‘‘thermophoresis” describes molecules’ movement in temperature gradients dependent on their size, charge, and hydration shell.
MST works by heating a small spot in the middle of a capillary such that the molecules inside move faster.
Smaller molecules move faster than larger ones.
Fluorescence is measured in the heated area.
The fluorescent DNA aptamer is a relatively small molecule, which becomes much larger and slower when binding to the virus.
After aptamers bind to the virus, the fluorescent molecule will leave the tracked area slower, thereby producing a change in the fluorescence intensity.
Preparation
In a biosafety cabinet, create a 1:2 serial dilution of 16 pseudovirus solutions in SELEX buffer from 3.9 × 10⁸ copies/mL maximum to 1.2 × 10⁵ copies/mL (Figure 2).
Start by making 20 μL of the maximum concentration (3.9 × 10⁸ copies/mL) in SELEX buffer in a PCR tube (tube 1).
Arrange 15 PCR tubes in a line and add 10 μL of SELEX buffer to each (tubes 2–16).
Remove 10 μL from tube 1 and mix thoroughly with tube 2 by pipetting up and down.
Remove 10 μL from tube 2 and mix thoroughly with tube 3 by pipetting up and down.
Repeat to end of the line, remove 10 μL from tube 16 and discard.
To cover a wider concentration range, use a 1:3 serial dilution.
Prepare aptamer solution.
Dissolve FAM-functionalized DNA aptamer in SELEX buffer to a final concentration of 500 nM.
Heat the aptamer solution at 95 °C for 5 min, then cool on ice for 3 min.
Add 10 μL of 500 nM FAM-functionalized DNA aptamer to each tube from step B2a, pipette up and down, and incubate for 10 min at room temperature.
Heat wax until melted (Figure 2.5.).
Insert a MO-K022capillary tube into each PCR tube and tap gently to load solution into tube. The liquid should be loaded approximately two thirds full. The measurement takes place in the middle of the length of the capillary, so the solution must be safely past the midpoint.
Dip each end of the tube in melted wax and allow to dry to seal tube (Figure 2.5.).
Note: This is a safety recommendation for removing the pseudovirus samples from the biosafety cabinet. Moreover, sealing the tube can prevent solution evaporation during an MST experiment.
The wax layer should be thick enough to be robust but not so thick to create bulbous ends that raise the capillary out of the instrument tray.
Do not touch the central testing region of the capillary tube, as this may significantly affect the result. Always grab capillary tubes at the ends.
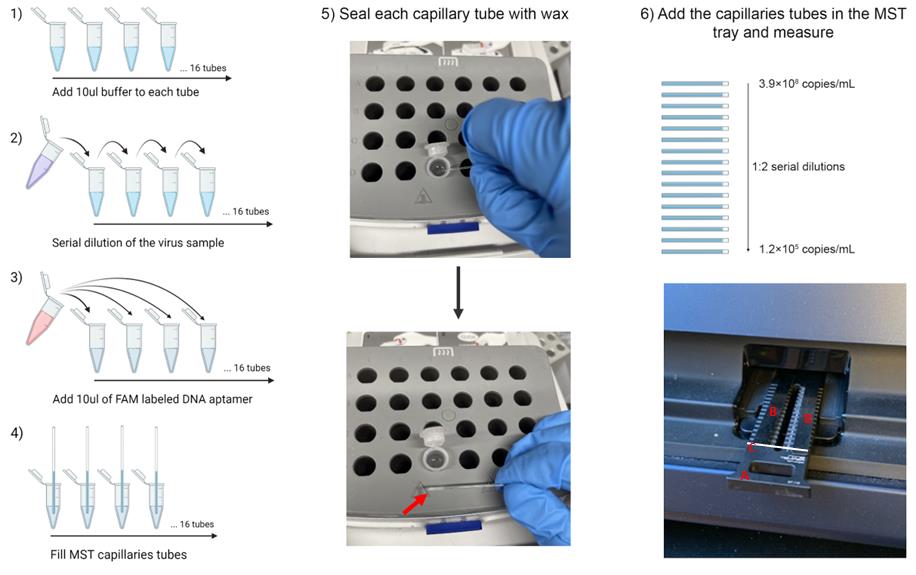
Figure 2. Schematic of the MicroScale Thermophoresis (MST) experiment. 1 to 4) Scheme of MST sample preparation and capillary tube loading. 5) Sealing the capillary in wax. First, dip the end of the capillary in the melted wax. Then, allow to cool and solidify. Repeat for both ends. 6) Layout of samples loaded to the MST tray with components labeled A) the tray, B) magnetic bars to clamp down capillaries, and C) white bar illustrating where capillaries are placed.Measurement
Arrange the tubes 1–16 in the NanoTemper Monolith NT.115 tray and clamp down using the magnetic bars (Figure 2.6.).
Start the instrument, insert the tray, and close the instrument door.
Set the Instrument control temperature to 25 °C.
Select the LED channel. For fluorescein-modified DNA, select the blue channel.
Select the option to perform an MST experiment.
Set the LED power to 20%.
Set MST power to Medium.
This setting controls the power of the IR laser, which heats the solution during the measurement. If the signal change is too large or too small, it can be adjusted down to lower or to higher settings, respectively.
Set the time sequence to 5 s cold, 30 s hot (on), followed by 5 s cold.
This time sequence corresponds to the time for each phase of measurement. The initial “cold” time establishes a baseline equilibrium fluorescence.
The 30 s “hot” period is the time in which the IR laser is heating the solution, causing a temperature gradient, and making the molecules move faster. The hot period may or may not establish a new equilibrium, but the rate at which the measured fluorescence changes will vary related to the amount of virus in the tube. At some time during the hot period, there will be a region that presents a binding curve in the final data.
The final 5 s “cold” time is to return towards the initial equilibrium.
Enter the maximum concentration (3.9 × 10⁸ copies/mL) and then select 1:2 serial dilution. The instrument will autofill the concentrations of tubes 2–16 according to this dilution factor.
Note: The instrument will expect a nanomolar amount as a concentration. It is not advised to try to convert the concentration of the pseudovirus from particles/mL to molarity, but to keep track of the units manually. We recommend just inputting “3.9 × 10⁸ nM” in the unit of nM instead of the correct unit of copies/mL and then correcting the unit back to copies/mL at the end of the analysis. The reason is that converting to 3.9 × 10⁸ copies/mL to its actual nM would result in extremely low concentrations (6.5 × 10⁻⁷–2.0 × 10⁻¹¹ nM), which can cause computational round-off errors in the equipment software when fitting a curve.
Make sure all fields are properly filled in, including the concentration of the fluorescent DNA ligand.
Provide a filename for the .ntp file that will be created and can be opened with the analysis software of the equipment. An ntp-file can contain several MST experiments that are listed accordingly to their name and the date & time when they were recorded. An MST experiment can contain several runs that are listed according to the “Table of Runs” that you defined for your assay (e.g., different MST powers).
Start the measurement.
Repeat two more times from step B2a to obtain all data in triplicate.
Data analysis
ELONA
The BioTek plate reader data will be in the form of a grid with one value for each well in the 96-well grid. Each column representing one concentration of DNA.
Average the values in each column and calculate the standard deviation. This will create a 1×12 grid.
Subtract the absorbance at 450 nm of the blank (A0, column 12) from each value in the grid (denoted as A).
Normalize the data for the entire plate by then dividing by A0.
Plot (A-A0)/A0 against the concentration of aptamer used in each column.
To determine the KD fit the data to Equation A, which is derived from Jaroskaite et al. (2020), where PF is the measured value of free DNA (fit min), PB is the measured value of bound DNA (fit max), LT is the concentration of pseudovirus (known constant), KD is the binding coefficient (fit), and c is the concentration of DNA ligand (known variable). PF and PB are included to set a numeric range for the fitting equation.

Use any software that can plot (A-A0)/A0 vs. the concentration of aptamer, as well as calculate statistical parameters and fit nonlinear curves. The following steps are further explained assuming Origin Inc is used.
In a new sheet, add one column containing the concentration of aptamer, and in the following columns, the (A-A0)/A0 values calculated for each replicate, typically triplicates.
Select the three columns containing the values for the triplicates and click on Origin: Statistics → Descriptive statistics → Statistics on rows, to obtain the mean and standard deviation for each value corresponding to each concentration.
Plot the concentration of aptamer against the mean of (A-A0)/A0. Set the standard deviation as the error in Y.
Select the following fitting option in Origin: Analysis → Fitting → Nonlinear fitting.
Choose the KD function if you already have the function available or create the KD function (eq. A) with the Fitting Function Builder.
Note: If in the experimental conditions the target concentration is in excess related to the aptamer concentration, it is possible to simplify the eq. A to eq. B:

In this case, choose the Hyperbola function already available in the function options of Origin. The Hyperbola function has the same expression as equation B, where P2 is the KD, and P1 is PB.
Example data of this experiment from our publication is shown below in Figure 3.
The SARS2-AR10 aptamer is shown to bind to the SARS-CoV-2 pseudovirus with a KD of 79 ± 28 nM (red).
The same aptamer shows no significant binding to the same pseudovirus, which has been rendered non-infectious by UV light (blue).

Figure 3. Binding curves obtained from the ELONA assay after the immobilization of 5 × 10⁸ copies/mL pseudotyped SARS-CoV-2 on a 96-wells plate. The dissociation constant ( Kd) of the SARS2-AR10 sequence for the infectious pseudotyped SARS-CoV-2 is 79 nM, while no changes in the absorbance at 450 nm are observed for the non-infectious pseudotyped SARS-CoV-2. n = 3 technical replicates (mean ± SD). This figure has been reprinted with permission from Peinetti et al. (2021).
MST
Open the NanoTemper MST analysis software MO.Affinity Analysis (Supplementary Material). A User Manual is available for the instrument online.
Load the dataset(s) from the .ntp file saved by the instrument.
Choose the MST analysis type.
Combine any replicate datasets to be analyzed together by using the + icon.
By clicking next, the software will automatically analyze the data.
The raw data is in the form of data traces comparing the fluorescence (Y-axis) to time (x-axis). Figure 4 includes 42 data traces (14 concentrations × 3 replicates each).
Each data trace will begin with an equilibrium “cold” region of 5 s followed by a gentle arc to approach a new apparent equilibrium during the 30 s “hot” region while the IR laser is on.
In the standard evaluation mode of the instrument, it will generate the Fcold and FHot (The fluorescence with the IR laser off and on, respectively) automatically, but it is possible to manually adjust them to find better signal-to-noise and an improved binding curve. All datasets being compared should be treated uniformly.
Note: The data is converted by calculating the average value within each region. Fcold is the average value in the blue region of Figure 4. Fhot is the average value in the red region of Figure 4. The second cold region is not labeled but is shown as the downturn in the data at the end of the plot. These calculations are made by the Analysis software and reported.
Because each capillary tube may have slightly different overall fluorescence, Fcold is normalized to be 1.
The amount that the fluorescence has changed from Fcold to Fhot (denoted as Fnorm) is recorded at the same time point for each capillary tube and plotted against the concentrations provided during setup. The Fnorm is calculated for each concentration as an average and standard deviation of each replicate.
Note: Fnorm, as well as (A-A0)/A values in ELONA assay, are two different variables that represent the fraction of the aptamer that binds to the virus.
At this point, there are two available options currently implemented in the MO.Affinity Analysis software for models to fit to the data: KD model and Hill model. The SARS-CoV-2 pseudovirus contains multiple copies of the spike protein on the surface. As the DNA aptamer binds to this protein, multiples aptamers can bind to each virus.
Select the KD model.
The KD model corresponds to a single site model, which can be adapted also to multiple identical and independent sites, meaning there are many binding sites that have the same binding affinity and are unaffected by cooperativity. It is defined as follows, where PF is the measured value of free DNA (fit min), PB is the measured value of bound DNA (fit max), LT is the concentration of DNA (known constant), KD is the apparent binding constant (fit), and c is the concentration of pseudovirus (known variable). A derivation of the equation with stated assumptions can be found elsewhere (Jarmoskaite et al., 2020). The equation is modified for our terms.

Note: Sometimes the model will fail to fit the data. This happens when either there is no trend, indicating no specific interaction, or if the binding curve is incomplete and does not reach maximum/minimum at either end of the data. If this happens, adjust the maximum/minimum concentrations used and try the whole experiment again, or export the values and do the fitting manually according to the fitting model in any data processing software like MS Excel or Origin.
Example data of this experiment from our paper is shown below:
This experiment was carried out with four different pseudotyped viruses and 229E coronavirus in order to show aptamer selectivity.
All pseudoviruses (pSARS-CoV-2, UV-inactivated pSARS-CoV-2, pSARS-CoV-1, and pH5N1) and 229E coronavirus were obtained from Prof. Rong lab (University of Illinois Chicago).
Figure 5a shows the average Fnorm and standard deviation (error bar in Y axis) of each replicate. At low concentrations of virus a low Fnorm is observed, and a nice curve to higher Fnorm at higher concentrations. The Fnorm observed with the lower and higher concentration of virus in Figure 5a are significantly different with a 99% confidence.
The KD model could be accurately fitted and resulted in KD = 4.8 × 10⁵ copies/mL.
Note: The KD is reported in different units in the MST experiment compared with the ELONA experiment. This is because in the ELONA experiment, the DNA concentration (denoted in nM) is varied, but in the MST the DNA concentration is constant, and the virus concentration (denoted in copies/mL) is varied.
The sensitivity of this assay would vary for each biochemical system being measured and for this specific assay in the above figure, the LOD = 2.7 × 10⁵ copies/mL. The specificity of this assay is shown in Figure 5b–c. Figure 5b and 5c show MST datasets where no binding is observed, which shows selectivity of the aptamer for the pSARS-CoV-2.
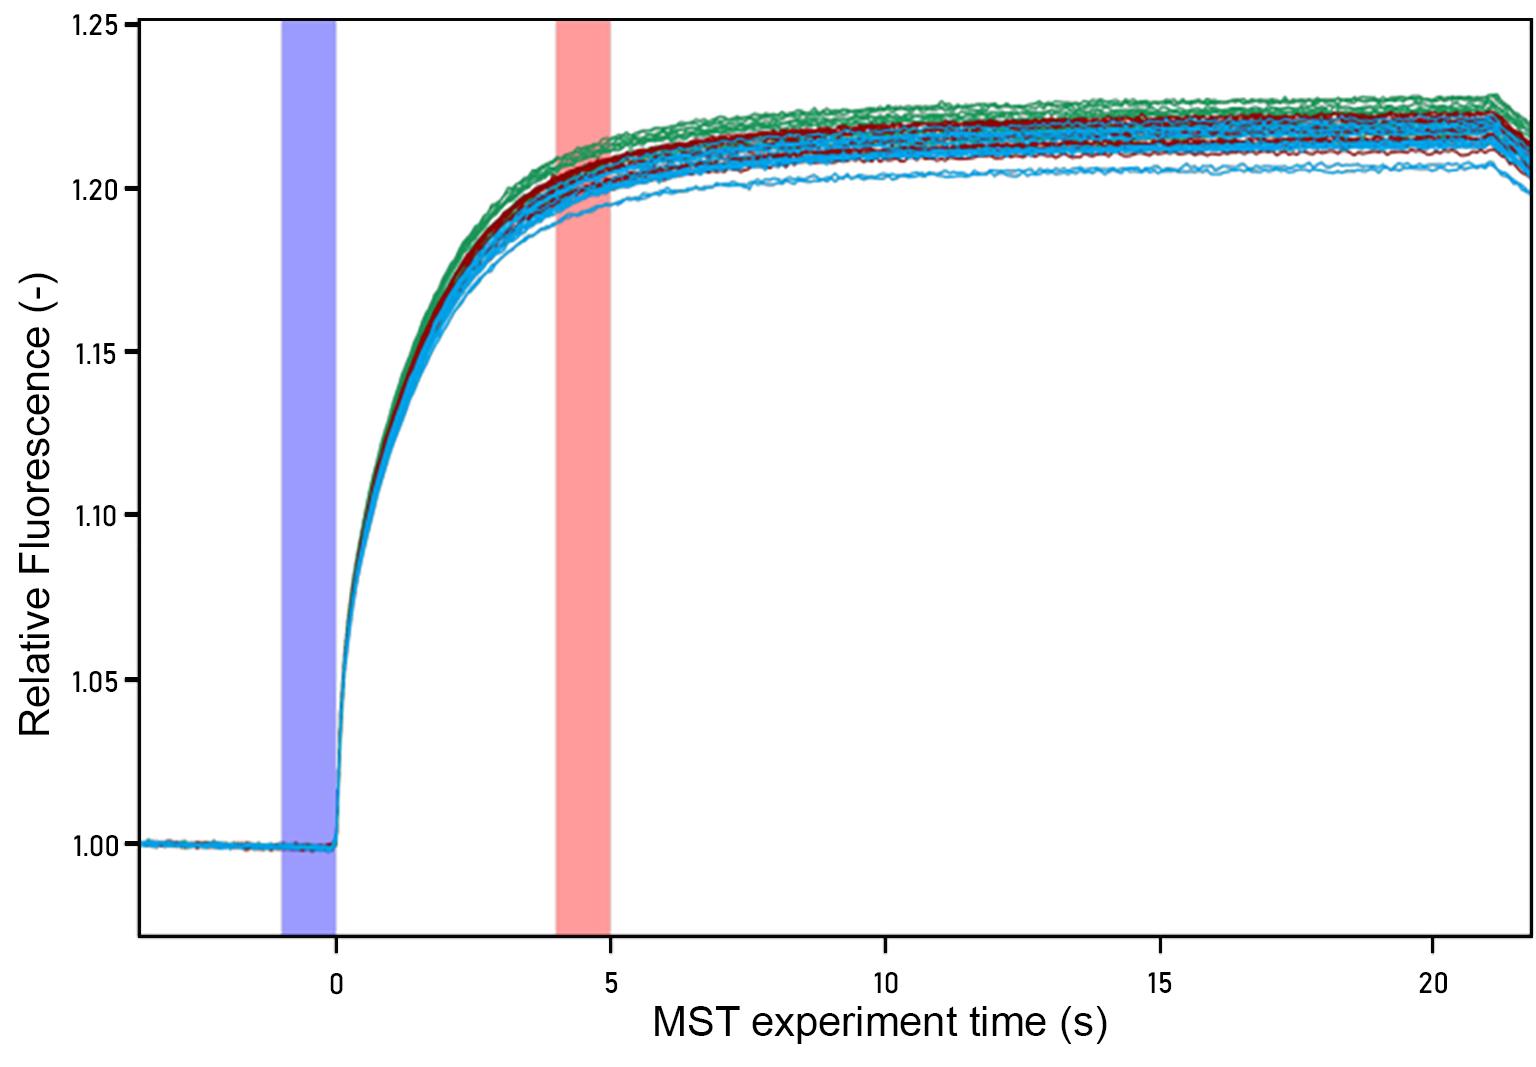
Figure 4. MST raw data trace for infectious SARS-CoV-2. Each color data trace represents one replicate data series. The subset of the hot region used for analysis is highlighted in red, and the cold region is highlighted in blue.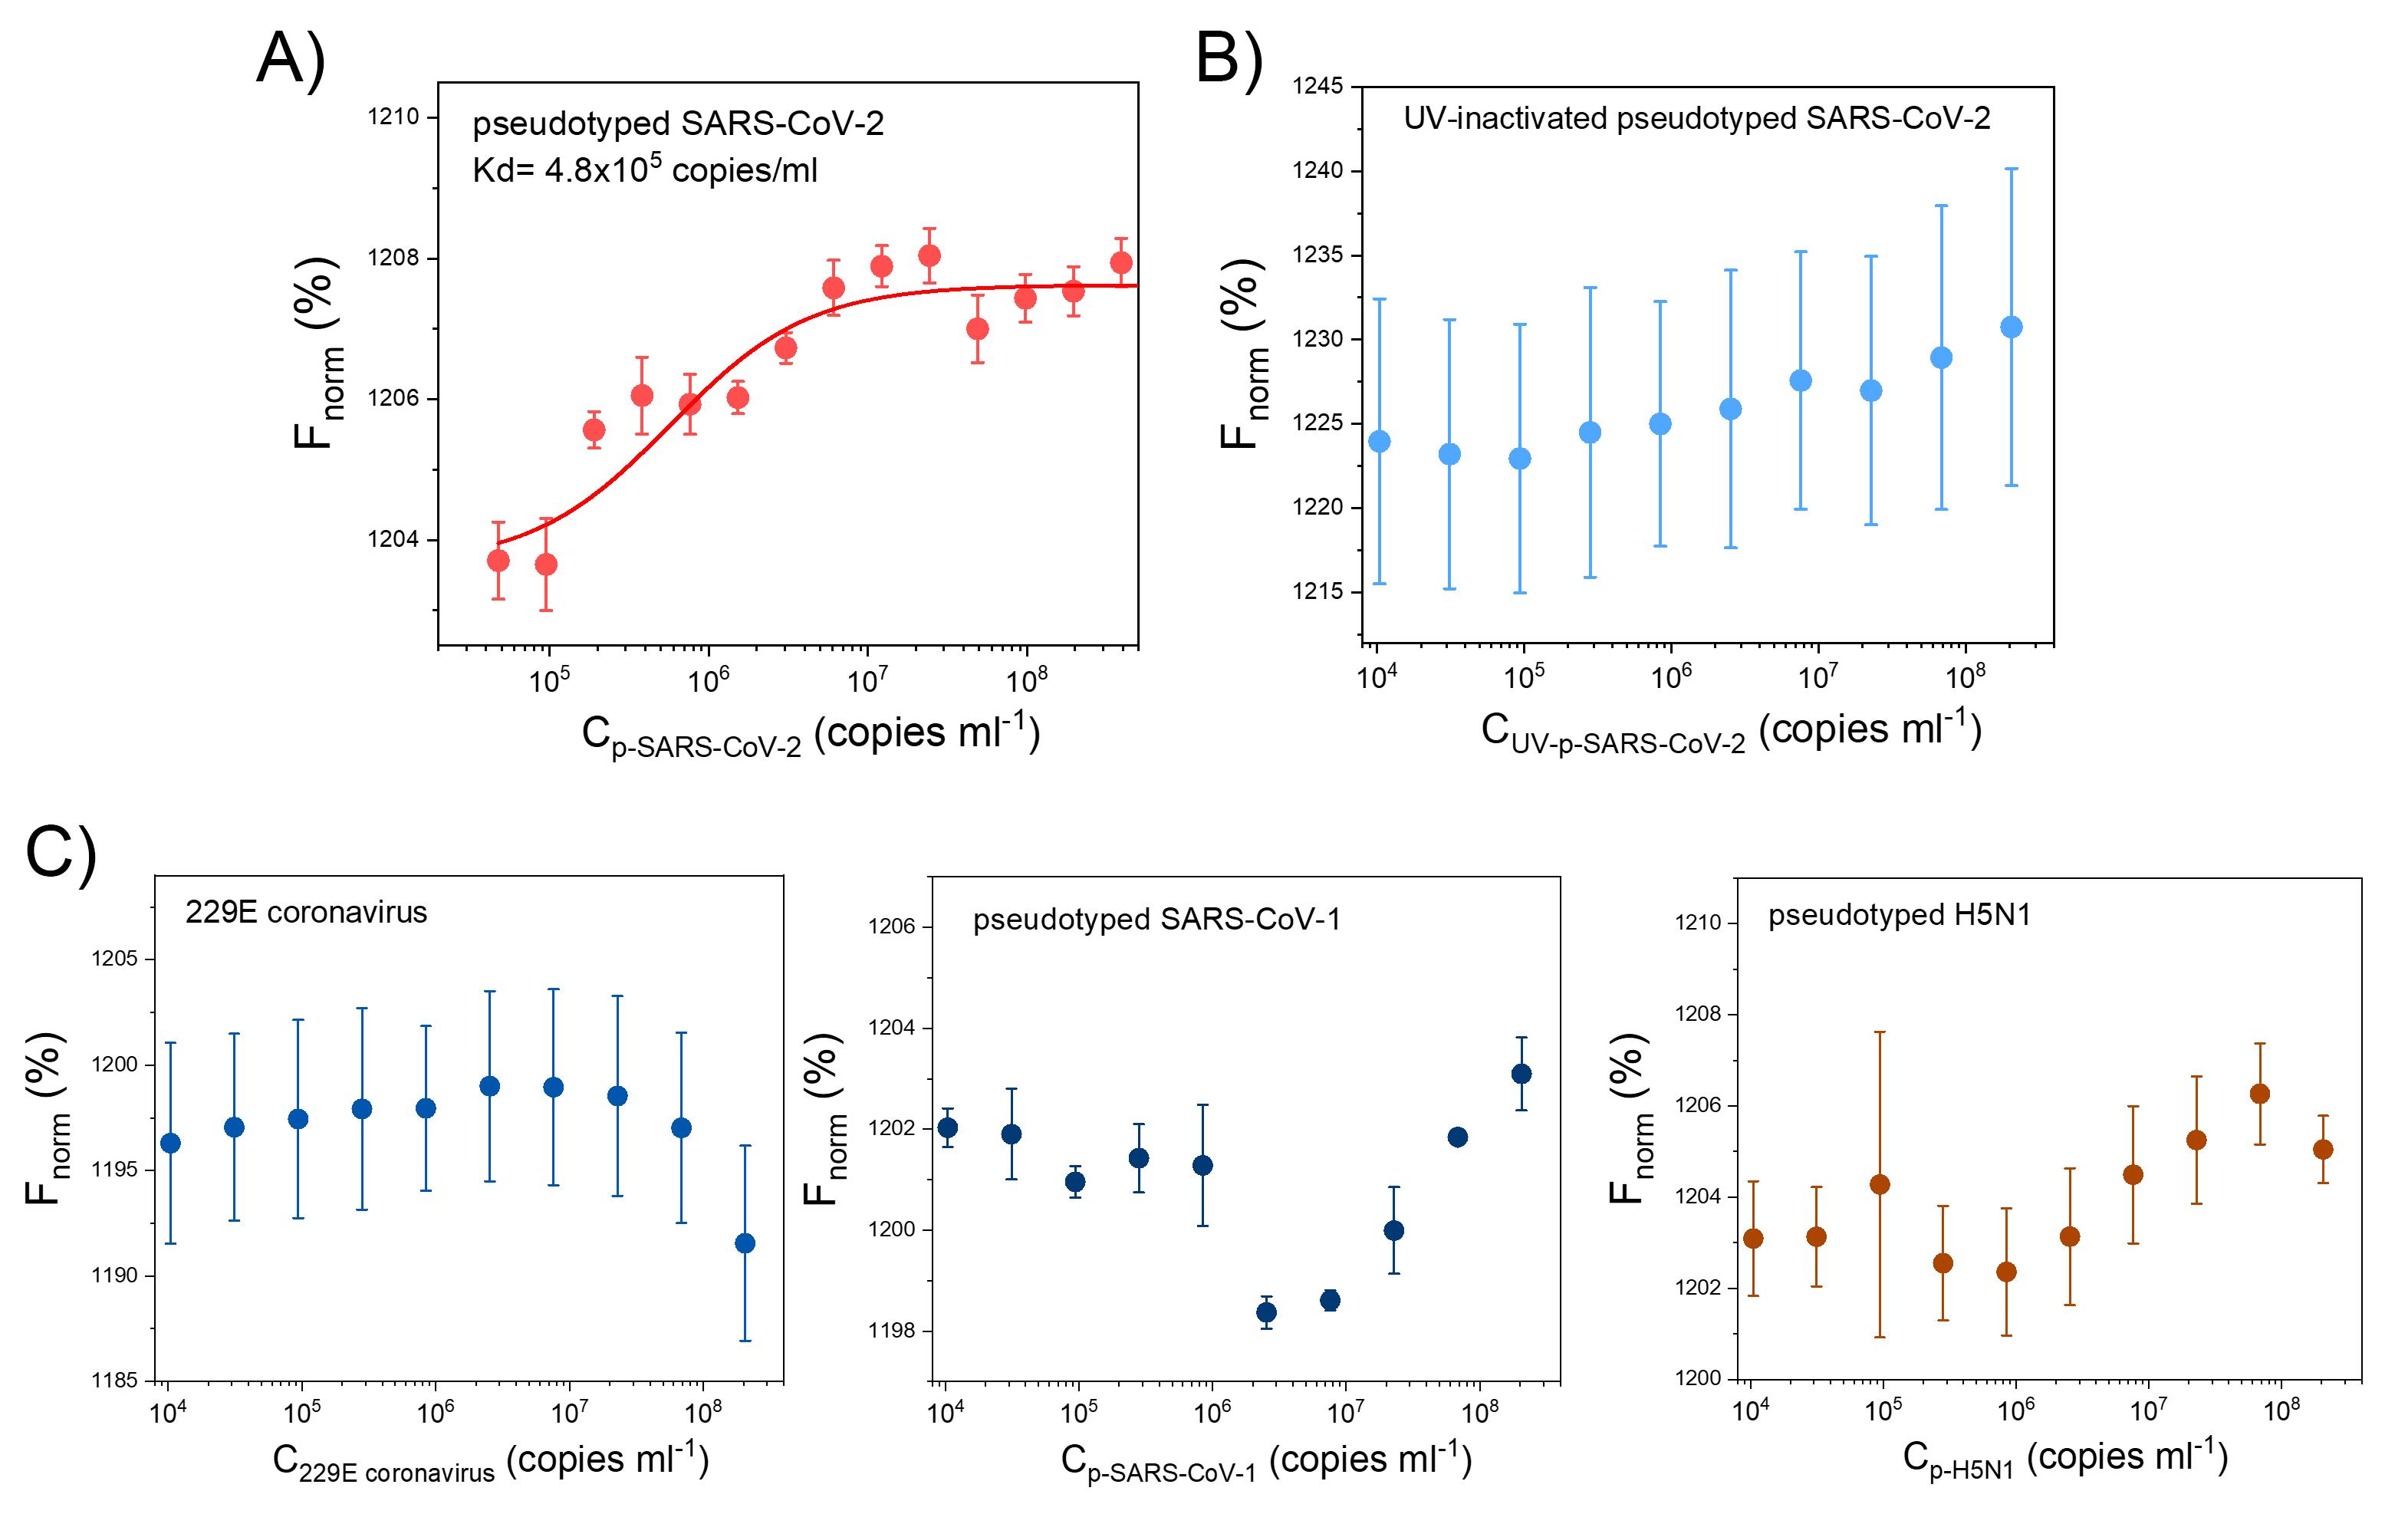
Figure 5. MST results for infectious SARS-CoV-2 (A), UV-inactivated pseudotyped SARS-CoV-2 (B), and other viruses (C). 229E coronavirus, pseudotyped SARS-CoV-1, and pseudotyped H5N1. SARS2-AR10 was labeled with FAM at the 5’ end, and its concentration was fixed at 250nM. These results confirmed the binding of the aptamer to infectious pseudotyped SARS-CoV-2 and its selectivity. n = 3 technical replicates (mean ± SD). This figure has been reprinted with permission from Peinetti et al. (2021).
Notes
Some of the materials described in this paper are biosafety level 2 (BSL2), and that requires extra care to handle safely and appropriately. The most basic engineering control for handling biohazardous materials is to do so in a biosafety cabinet. All steps of these procedures that include pseudovirus must be performed in a biosafety cabinet or the virus solution must be in a sealed container (e.g., wax sealed capillary tubes or sealed 96-well plate).
Recipes
SARS-CoV-2 pseudoviruses
SARS-CoV-2 pseudoviruses were provided by Prof. Rong lab (University of Illinois Chicago) in PBS buffer (Guo et al., 2009; Wang et al., 2014). The titer of the stock solution was 1 × 10¹¹ copies/mL.
The stock solution was aliquoted in tubes containing 20 μL each and kept at -80 °C. Before each experiment, a new aliquot was thawed. Once thawed, it should not be refrozen but can be stored at 4 °C for one week. Please note that the contents should not be used more than one week after thawing.
SELEX buffer
1× PBS, 2.5 mM MgCl2, and 0.5 mM CaCl2, pH = 7.4
Prepare 25 mM MgCl2 solution. Weight out 238 mg MgCl2 and dissolve in 100 mL of molecular grade water.
Prepare 5 mM CaCl2 solution. Weight out 55 mg CaCl2 and dissolve in 100 mL of molecular grade water.
Mix 20 mL of 10× PBS, 20 mL of 25 mM MgCl2 solution and 20 mL of 5 mM CaCl2 solution. Dilute with 140 mL of molecular grade water.
It can be stored at room temperature for several months. If the salts crystalize and are visually apparent, discard and make fresh buffer.
Higher concentrated stock solutions of SELEX buffer begin to have solubility issues and are not advised. Individual components can be stored as up to 10× stock solutions.
PBS-T
Add Tween 20 to PBS to 10% v/v (e.g., 10 mL of Tween 20 + 90 mL of PBS) and mix thoroughly
Further dilute the solution to a final concentration of 0.05% v/v by adding 0.5 mL from step 3a to 99.5 mL of PBS.
Note: The Tween 20 is very viscous and makes pipetting small volumes accurately difficult. The stepwise dilution improves the accuracy of volumes dispensed. The 10% Tween stock solution can be stored at 4 °C for up to one month for future usage.
PBS-T-BSA
Dissolve 0.3 g BSA in 6 mL of PBS-T to prepare a 5% w/v BSA solution.
Acetate buffer
Dissolve sodium acetate in ultrapure water to a concentration of 0.1 M.
Adjust pH to 6.5 by adding glacial acetic acid or sodium hydroxide. If pH > 6.5, the reaction will not work.
Prepare 80 mL of distilled water in a suitable container. Add 772.142 mg of sodium acetate to the solution. Adjust solution to a final pH of 6.5 by adding acetic acid or sodium hydroxide. Add distilled water until the volume is 100 mL.
Stop solution
SLOWLY add 1 mL of concentrated sulfuric acid to 9 mL of ultrapure water inside of a fume hood. Because concentrated sulfuric acid is volatile, it can drop from pipettes. Take care in transferring to open tubes.
Acknowledgments
The authors thank Ms. Laura M. Cooper and Dr. Lijun Rong for providing the pseudovirus of SARS-Cov-2 used in this protocol and Dr. Daiana Capdevila for her insightful discussions. This work was supported by a RAPID grant from the National Science Foundation (CBET 20-29215) and a seed grant from the Institute for Sustainability, Energy, and Environment at University of Illinois at Urbana-Champaign and Illinois-JITRI Institute (JITRI 23965). A.S.P. thanks the PEW Latin American Fellowship for financial support. We also thank the Robert A. Welch Foundation (Grant F-0020) for support of the Lu group research program at the University of Texas at Austin.
The protocols described here are adapted from our previous work (Peinetti et al., 2021).
Competing interests
The authors have applied for a patent (WO2021236828A1) based on the contents of the original paper from which these protocols are derived (Peinetti et al., 2021).
References
- Baaske, P., Wienken, C. J., Reineck, P., Duhr, S. and Braun, D. (2010). Optical thermophoresis for quantifying the buffer dependence of aptamer binding. Angew Chem Int Ed Engl 49(12): 2238-2241.
- Bai, C., Lu, Z., Jiang, H., Yang, Z., Liu, X., Ding, H., Li, H., Dong, J., Huang, A., Fang, T., et al. (2018). Aptamer selection and application in multivalent binding-based electrical impedance detection of inactivated H1N1 virus. Biosens Bioelectron 110: 162-167.
- Balogh, Z., Lautner, G., Bardoczy, V., Komorowska, B., Gyurcsanyi, R. E. and Meszaros, T. (2010). Selection and versatile application of virus-specific aptamers. FASEB J 24(11): 4187-4195.
- Cai, Y., Zhang, J., Xiao, T., Peng, H., Sterling, S. M., Walsh, R. M., Jr., Rawson, S., Rits-Volloch, S. and Chen, B. (2020). Distinct conformational states of SARS-CoV-2 spike protein. Science 369(6511): 1586-1592.
- Chakraborty, B., Das, S., Gupta, A., Xiong, Y., Vysnavi, T-V., Kizer, M. E., Duan, J., Chandrasekaran, A. R. and Wang, X. (2022). Aptamers for Viral Detection and Inhibition. ACS Infect Dis 8(4): 667-692.
- Chen, M., Hu, D., Li, X., Yang, S., Zhang, W., Li, P. and Song, B. (2015). Antiviral activity and interaction mechanisms study of novel glucopyranoside derivatives. Bioorg Med Chem Lett 25(18): 3840-3844.
- Cho, E. J., Lee, J. W. and Ellington, A. D. (2009). Applications of aptamers as sensors. Annu Rev Anal Chem (Palo Alto Calif) 2: 241-264.
- Drolet, D. W., Moon-McDermott, L. and Romig, T. S. (1996). An enzyme-linked oligonucleotide assay. Nat Biotechnol 14(8): 1021-1025.
- Duhr, S., Arduini, S. and Braun, D. (2004). Thermophoresis of DNA determined by microfluidic fluorescence. Eur Phys J E Soft Matter 15(3): 277-286.
- Dunn, M. R., Jimenez, R. M., and Chaput, J. C. (2017). Analysis of aptamer discovery and technology. Nat Rev Chem 1 (10):1-16.
- Ellington, A. D. and Szostak, J. W. (1990). In vitro selection of RNA molecules that bind specific ligands. Nature 346(6287): 818-822.
- Fang, X. and Tan, W. (2010). Aptamers generated from cell-SELEX for molecular medicine: a chemical biology approach. Acc Chem Res 43(1): 48-57.
- González, V. M., Martin, M. E., Fernandez, G. and Garcia-Sacristan, A. (2016). Use of Aptamers as Diagnostics Tools and Antiviral Agents for Human Viruses. Pharmaceuticals (Basel) 9(4): 78.
- Guo, Y., Tisoncik, J., McReynolds, S., Farzan, M., Prabhakar, B. S., Gallagher, T., Rong, L. and Caffrey, M. (2009). Identification of a new region of SARS-CoV S protein critical for viral entry. J Mol Biol 394(4): 600-605.
- Harazi, A., Becker-Cohen, M., Zer, H., Moshel, O., Hinderlich, S. and Mitrani-Rosenbaum, S. (2017). The Interaction of UDP-N-Acetylglucosamine 2-Epimerase/N-Acetylmannosamine Kinase (GNE) and Alpha-Actinin 2 Is Altered in GNE Myopathy M743T Mutant. Mol Neurobiol 54(4): 2928-2938.
- Hong, S., Zhang, X., Lake, R. J., Pawel, G. T., Guo, Z., Pei, R. and Lu, Y. (2019). A photo-regulated aptamer sensor for spatiotemporally controlled monitoring of ATP in the mitochondria of living cells. Chem Sci 11(3): 713-720.
- Huizenga, D. E. (1997). Isolation and analysis of novel functional single-stranded DNAs (aptamer, ribozyme, deoxyribozyme).
- Jarmoskaite, I., AlSadhan, I., Vaidyanathan, P. P., Herschlag, D. (2020). How to measure and evaluate binding affinities. eLife 9: e57264.
- Jerabek-Willemsen, M., Wienken, C. J., Braun, D., Baaske, P. and Duhr, S. (2011). Molecular interaction studies using microscale thermophoresis. Assay Drug Dev Technol 9(4): 342-353.
- Juraszek, J., Rutten, L., Blokland, S., Bouchier, P., Voorzaat, R., Ritschel, T., Bakkers, M. J. G., Renault, L. L. R. and Langedijk, J. P. M. (2021). Stabilizing the closed SARS-CoV-2 spike trimer. Nat Commun 12(1): 244.
- Kim, H., Choi, H., Heo, Y., Kim, C., Kim, M., and Kim, K.T. (2022). Biosensors Based on Bivalent and Multivalent Recognition by Nucleic Acid Scaffolds. Appl Sci 12 (3):1717.
- Kukushkin, V. I., Ivanov, N. M., Novoseltseva, A. A., Gambaryan, A. S., Yaminsky, I. V., Kopylov, A. M. and Zavyalova, E. G. (2019). Highly sensitive detection of influenza virus with SERS aptasensor. PLoS One 14(4): e0216247.
- Kwon, P. S., Ren, S., Kwon, S. J., Kizer, M. E., Kuo, L., Xie, M., Zhu, D., Zhou, F., Zhang, F., Kim, D., et al. (2020). Designer DNA architecture offers precise and multivalent spatial pattern-recognition for viral sensing and inhibition. Nat Chem 12(1): 26-35.
- Li, L., Xing, H., Zhang, J. and Lu, Y. (2019). Functional DNA Molecules Enable Selective and Stimuli-Responsive Nanoparticles for Biomedical Applications. Acc Chem Res 52(9): 2415-2426.
- Li, L., Xu, S., Yan, H., Li, X., Yazd, H. S., Li, X., Huang, T., Cui, C., Jiang, J. and Tan, W. (2021). Nucleic Acid Aptamers for Molecular Diagnostics and Therapeutics: Advances and Perspectives. Angew Chem Int Ed Engl 60(5): 2221-2231.
- Liu, J., Cao, Z. and Lu, Y. (2009). Functional nucleic acid sensors. Chem Rev 109(5): 1948-1998.
- Ma, Y., Mou, Q., Yan, P., Yang, Z., Xiong, Y., Yan, D., Zhang, C., Zhu, X. and Lu, Y. (2021). A highly sensitive and selective fluoride sensor based on a riboswitch-regulated transcription coupled with CRISPR-Cas13a tandem reaction. Chem Sci 12(35): 11740-11747.
- Peinetti, A. S., Lake, R. J., Cong, W., Cooper, L., Wu, Y., Ma, Y., Pawel, G. T., Toimil-Molares, M. E., Trautmann, C., Rong, L., et al. (2021). Direct detection of human adenovirus or SARS-CoV-2 with ability to inform infectivity using DNA aptamer-nanopore sensors. Sci Adv 7(39): eabh2848.
- Bruesehoff, P. J., Li, J., Augustine, A. J. 3rd and Lu, Y. (2002). Improving Metal Ion Specificity During In Vitro Selection of Catalytic DNA. CCHTS 5 (4): 327-335.
- Plach, M.G., Grasser, K., and Schubert, T. (2017). MicroScale Thermophoresis as a Tool to Study Protein-peptide Interactions in the Context of Large Eukaryotic Protein Complexes. Bio-protocol 7 (23): e2632.
- Ramakrishnan, M., Alves De Melo, F., Kinsey, B. M., Ladbury, J. E., Kosten, T. R. and Orson, F. M. (2012). Probing cocaine-antibody interactions in buffer and human serum. PLoS One 7(7): e40518.
- Shen, Z., Wu, Z., Chang, D., Zhang, W., Tram, K., Lee, C., Kim, P., Salena, B. J. and Li, Y. (2016). A Catalytic DNA Activated by a Specific Strain of Bacterial Pathogen. Angew Chem Int Ed Engl 55(7): 2431-2434.
- Sun, M., Liu, S., Wei, X., Wan, S., Huang, M., Song, T., Lu, Y., Weng, X., Lin, Z., Chen, H., et al. (2021). Aptamer Blocking Strategy Inhibits SARS-CoV-2 Virus Infection. Angew Chem Int Ed Engl 60(18): 10266-10272.
- Tai, W., He, L., Zhang, X., Pu, J., Voronin, D., Jiang, S., Zhou, Y. and Du, L. (2020). Characterization of the receptor-binding domain (RBD) of 2019 novel coronavirus: implication for development of RBD protein as a viral attachment inhibitor and vaccine. Cell Mol Immunol 17(6): 613-620.
- Tuerk, C. and Gold, L. (1990). Systematic evolution of ligands by exponential enrichment: RNA ligands to bacteriophage T4 DNA polymerase. Science 249(4968): 505-510.
- Wang, J., Cheng, H., Ratia, K., Varhegyi, E., Hendrickson, W. G., Li, J. and Rong, L. (2014). A comparative high-throughput screening protocol to identify entry inhibitors of enveloped viruses. J Biomol Screen 19(1): 100-107.
- Xia, T., Yuan, J. and Fang, X. (2013). Conformational dynamics of an ATP-binding DNA aptamer: a single-molecule study. J Phys Chem B 117(48): 14994-15003.
- Xiang, Y. and Lu, Y. (2014). DNA as sensors and imaging agents for metal ions. Inorg Chem 53(4): 1925-1942.
- Xie, S., Ai, L., Cui, C., Fu, T., Cheng, X., Qu, F. and Tan, W. (2021). Functional Aptamer-Embedded Nanomaterials for Diagnostics and Therapeutics. ACS Appl Mater Interfaces 13(8): 9542-9560.
- Xing, H., Hwang, K., Li, J., Torabi, S. F. and Lu, Y. (2014). DNA Aptamer Technology for Personalized Medicine. Curr Opin Chem Eng 4: 79-87.
- Zhang, Z., Pandey, R., Li, J., Gu, J., White, D., Stacey, H. D., Ang, J. C., Steinberg, C. J., Capretta, A., Filipe, C. D. M., et al. (2021). High-Affinity Dimeric Aptamers Enable the Rapid Electrochemical Detection of Wild-Type and B.1.1.7 SARS-CoV-2 in Unprocessed Saliva. Angew Chem Int Ed Engl 60(45): 24266-24274.
- Zou, X., Wu, J., Gu, J., Shen, L., and Mao, L. (2019). Application of Aptamers in Virus Detection and Antiviral Therapy. Front Microbiol 10: 1462.
Article Information
Copyright
© 2022 The Authors; exclusive licensee Bio-protocol LLC.
How to cite
Readers should cite both the Bio-protocol article and the original research article where this protocol was used:
- Pawel, G. T., Ma, Y., Wu, Y., Lu, Y. and Peinetti, A. S. (2022). Binding Affinity Measurements Between DNA Aptamers and their Virus Targets Using ELONA and MST. Bio-protocol 12(21): e4548. DOI: 10.21769/BioProtoc.4548.
- Peinetti, A. S., Lake, R. J., Cong, W., Cooper, L., Wu, Y., Ma, Y., Pawel, G. T., Toimil-Molares, M. E., Trautmann, C., Rong, L., et al. (2021). Direct detection of human adenovirus or SARS-CoV-2 with ability to inform infectivity using DNA aptamer-nanopore sensors. Sci Adv 7(39): eabh2848.
Category
Biophysics > Bioengineering
Biochemistry > DNA
Do you have any questions about this protocol?
Post your question to gather feedback from the community. We will also invite the authors of this article to respond.