- Protocols

- Articles and Issues
- For Authors
- About
- Become a Reviewer

An Unbiased CRISPR-Cas9 Screening Method for the Identification of Positive and Negative Regulatory Proteins of Cell Adhesion
(*contributed equally to this work) Published: Vol 12, Iss 21, Nov 5, 2022 DOI: 10.21769/BioProtoc.4545 Views: 2812
Reviewed by: Giusy TornilloAlfano LuigiAnonymous reviewer(s)
Original research article
The authors used this protocol in:

Apr 2022
Advertisement


Protocol Collections
Comprehensive collections of detailed, peer-reviewed protocols focusing on specific topics


Abstract
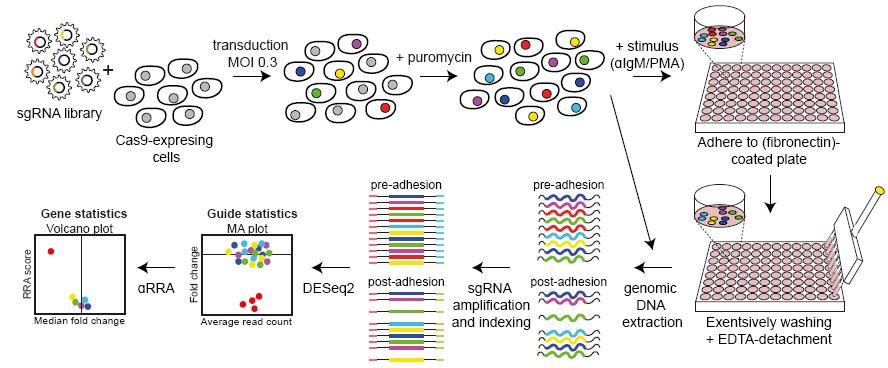
Mature B-cell lymphomas are highly dependent upon the protective lymphoid organ microenvironment for their growth and survival. Targeting integrin-mediated homing and retention of the malignant B cells in the lymphoid organs, using the Bruton’s tyrosine kinase (BTK) inhibitor ibrutinib, is a highly efficacious FDA-approved therapy for chronic lymphocytic leukemia (CLL), mantle cell lymphoma (MCL), and Waldenström macroglobulinemia (WM). Unfortunately, a significant subset of patients is intrinsically resistant to ibrutinib or will develop resistance upon prolonged treatment. Here, we describe an unbiased functional genomic CRISPR-Cas9 screening method to identify novel proteins involved in B-cell receptor–controlled integrin-mediated adhesion, which provides novel therapeutic targets to overcome ibrutinib resistance. This screening method is highly flexible and can be easily adapted to identify cell adhesion–regulatory proteins and signaling pathways for other stimuli, adhesion molecules, and cell types.
Graphical abstract:
Background
In mature B-cell lymphomas, the malignant B cells are highly dependent on their protective lymphoid organ microenvironment; the stromal cells, T cells, and macrophages in the lymph node and bone marrow secrete a variety of cytokines and chemokines and express several adhesion molecules, which stimulate survival and proliferation of the malignant B cells (Burger and Wiestner, 2018). The retention of the malignant cells in these protective niches is mediated by cell adhesion to extracellular matrix components (e.g., fibronectin) and cellular ligands (e.g., VCAM-1, ICAM-1, and cadherins).
In many mature B-cell malignancies, such as chronic lymphocytic leukemia (CLL), mantle cell lymphoma (MCL), and Waldenström macroglobulinemia (WM), the activation of integrins is controlled by the B-cell receptor (BCR) signaling (Figure 1), among others (de Rooij et al., 2012; Chang et al., 2013; de Rooij et al., 2016). Targeting the BCR signalosome [e.g., by the Bruton’s tyrosine kinase (BTK) inhibitor ibrutinib or the PI3Kδ inhibitor idelalisib] has demonstrated an unprecedented clinical efficacy in these malignancies, with objective response rates of 70%–90% (Burger and Wiestner, 2018). We and others have shown that these drugs do not act by directly killing the lymphoma cells, but rather by mobilizing the cells from their protective niches into the peripheral blood, where they are deprived from survival and growth signals, eventually dying (de Rooij et al., 2012, 2016; Byrd et al., 2013; Chang et al., 2013; Wang et al., 2013; Brown et al., 2014; Treon et al., 2015).
Notwithstanding the high clinical efficacy of these drugs, a subset of patients does not respond at all or develops resistance upon prolonged treatment (Stephens and Byrd, 2021). Considering the microenvironment dependence as the Achilles’ heel of many B-cell malignancies, we aimed to identify novel signaling molecules involved in the regulation of B-cell homing and retention.
Over the last decade, pooled genetic screening platforms, either using shRNAs or CRISPR-Cas9 libraries, have been widely used not only in the context of (synthetic) lethality and drug resistance, but also in more functional assays, such as FACS-based reporter or signaling screens (Przybyla and Gilbert, 2022). Here, we describe the detailed method of a pooled genetic CRISPR-Cas9-mediated knockout screening method to identify genes involved in integrin-mediated adhesion: a loss-of-adhesion screen. This screen is suitable for studying a variety of different cell types, stimuli (chemokines or cytokines), cell adhesion molecules (integrins, cadherins, and selectins), and their ligands [(extra)cellular matrix components].
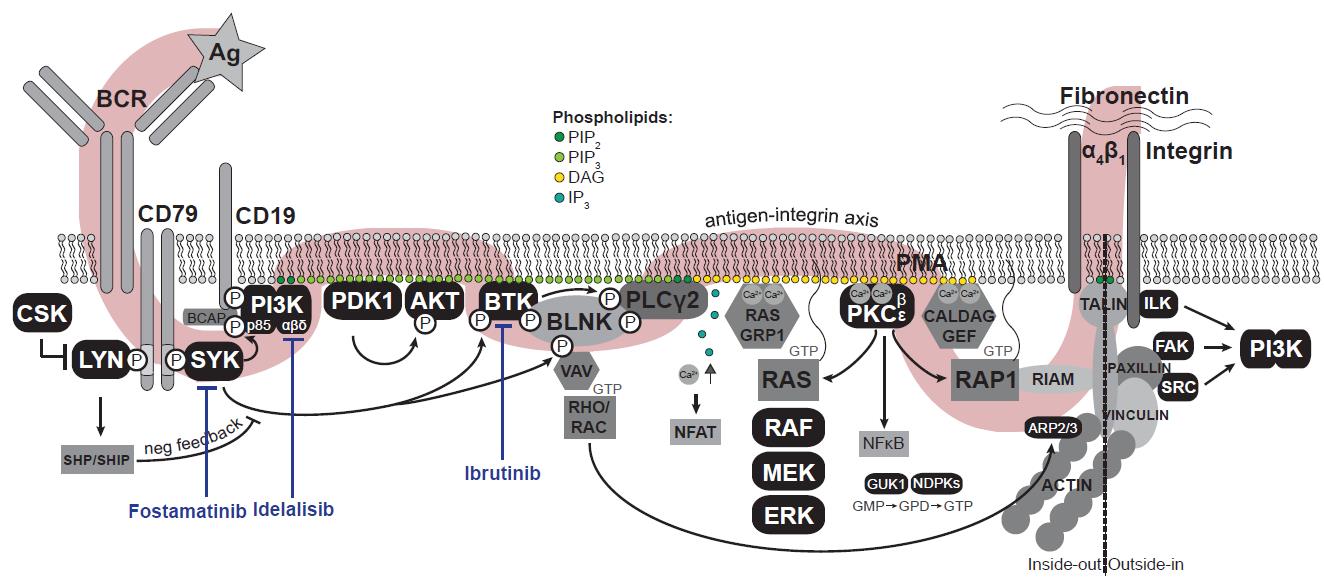
Figure 1. The B-cell receptor signaling pathway. Antigen (Ag) binding to the B-cell receptor (BCR) induces a signaling cascade resulting in the activation of integrins. In black, all kinase(-related) proteins are depicted. Adapted from De Rooij et al. (2022). Ag: antigen (αIgM); BCR: B-cell receptor; PIP2: phosphatidylinositol-4,5-diphosphate; PIP3: phosphatidylinositol-3,4,5-triphosphate; DAG: diacylglycerol; IP3: inositol-1,4,5-triphosphate; Ca2+: cytosolic calcium ions; PMA: phorbol-12-myristate-13-acetate; GMP/GDP/GTP: guanosine-mono/di/triphosphate.
Materials and Reagents
Plasmids and vectors
LentiCas9-Blast (Addgene, catalog number: 52962)
Cas9-reporter [pKLV2-U6gRNA5(gGFP)-PGKBFP2AGFP-W] (Addgene, catalog number: 67980)
psPAX2 (Addgene, catalog number: 12260)
pMD2.G (Addgene, catalog number: 12259)
pEGFP-N3 (Clontech, catalog number: 6080-1)
LentiGuide-Puro Brunello kinome library (Addgene, catalog number: 1000000082)
Cell culture, transfection, and transduction
6-well plate (Greiner, catalog number: 657160)
T175 flasks (Greiner, catalog number: 658170)
15 mL tubes (Falcon, catalog number: 734-0452)
0.45 µm filter (Millipore, catalog number: SLHA033SS)
Dulbecco’s modified Eagle medium (DMEM, Thermo Fisher Scientific, GibcoTM, catalog number: 41966-052)
Iscove’s modified Dulbecco’s medium (IMDM, Thermo Fisher Scientific, GibcoTM, catalog number: 12440-061)
Polyethylenimine, linear (PEI, Polysciences, catalog number: 24313-2)
HEK293T-17 (ATCC, catalog number: CRL11268)
Namalwa (DSMZ, catalog number: ACC24)
Cryovials (Costar, catalog number: 430488)
Puromycin (Invivogen, catalog number: ant-pr-1)
Blasticidin S hydrochloride (Thermo Fisher Scientific, GibcoTM, catalog number: R210-01)
Supplements for cell culture medium (added before use; see Recipes)
Fetal bovine serum (FBS) (HyClone, catalog number: SH30071.03)
L-glutamine (Sigma-Aldrich, catalog number: 59202C)
Penicillin-streptomycin (Sigma-Aldrich, catalog number: P4333)
Library amplification
94 × 16 mm plates (Greiner, catalog number: 633181; other sizes can be used if desired)
EnduraTM electrocompetent cells (Lucigen, catalog number: 60242-1)
Agar (BD, catalog number: 214010)
Ampicillin (Sigma, catalog number: A5354)
NucleoBond Xtra midi prep kit (Macherey-Nagel, catalog number: 740420.50)
LB (BD, catalog number: 240230)
LB medium containing antibiotics (see Recipes)
SOC medium (see Recipes)
D-glucose (Merck Millipore, catalog number: 1083371000)
Agar plates containing antibiotics (see Recipes)
Adhesion
96-well high binding, flat bottom plates (Greiner, catalog number: 655061)
Human plasma fibronectin (FN) (Sigma-Aldrich, catalog number: F2006)
Poly-L-lysine hydrobromide (PLL) (Sigma-Aldrich, catalog number: P6282)
Bovine serum albumin fraction V (BSA) (Roche, catalog number: 10735094001)
Ibrutinib (SelleckChem, catalog number: S2680)
Goat F(ab’)2 anti-human IgM (Southern Biotech, catalog number: 2022-14)
Phorbol-12-myristate-13-acetate (PMA) (Sigma-Aldrich, catalog number: P8139)
Multichannel pipette reservoir (Corning, catalog number: 4870)
25% glutaraldehyde (Sigma-Aldrich, catalog number: 354400)
Crystal violet (Sigma-Aldrich, catalog number: C0775)
Ethanol (Merck Millipore, catalog number: 1009831000)
Phosphate buffered saline (PBS) (Fresenius Kabi, catalog number: M090001/13)
Ethylenediaminetetraacetic acid (EDTA) (Sigma-Aldrich, catalog number: E9884)
0.5% crystal violet in 20% ethanol (see Recipes)
0.5 M EDTA, pH 8.0 (see Recipes)
Genomic DNA isolation
Quick DNA mini prep kit (Zymo Research, catalog number: D3024)
Qubit broad range kit (Thermo Fisher Scientific, catalog number: Q32850)
PCR and next-generation sequencing
PhusionTM high-fidelity DNA polymerase (contains 5× HF buffer) (Thermo Fisher Scientific, catalog number: F530S)
10 mM dNTP mix (Sigma-Aldrich, 71004-3)
10 µM PCR1 barcoded forward primer (Sigma-Aldrich, Tables 1, 2)
10 µM PCR1 reverse primer (Sigma-Aldrich, Table 1)
10 µM PCR2 forward primer (Sigma-Aldrich, Table 1)
10 µM PCR2 indexed reverse primer (Sigma-Aldrich, Tables 1, 2)
Agarose (Meridian Biosciences, catalog number: BIO-41025)
Ethidium bromide (EtBr) (Sigma-Aldrich, catalog number: E1385)
NucleoSpin gel and PCR clean-up kit (Macherey-Nagel, catalog number: 740609.250)
Qubit high sensitivity kit (Thermo Fisher Scientific, catalog number: Q32851)
Tris base (Sigma-Aldrich, catalog number: T1503)
Acetic acid (Sigma-Aldrich, catalog number: A6283)
PhiX Control v3 (Illumina, catalog number: FC-110-3001)
TAE buffer (see Recipes)
Agarose gel (see Recipes)
Table 1. Primers PCR1 and PCR2
| Primer | Sequence |
|---|---|
| PCR 1 barcoded forward | ACACTCTTTCCCTACACGACGCTCTTCCGATCTNNNNNNGGCTTTATATATCTTGTGGAAAGGACG |
| PCR 1 reverse | GTGACTGGAGTTCAGACGTGTGCTCTTCCGATCTACTGACGGGCACCGGAGCCAATTCC |
| PCR 2 forward | AATGATACGGCGACCACCGAGATCTACACTCTTTCCCTACACGACGCTCTTCCGATCT |
| PCR 2 indexed reverse | CAAGCAGAAGACGGCATACGAGATNNNNNNGTGACTGGAGTTCAGACGTGTGCTCTTCCGATCT |
The NNNNNN in the PCR1 forward and PCR2 reverse primers are replaced by the desired barcodes/ indexes listed in Table 2.
Table 2. Barcodes/indexes for PCR1 and PCR2 primers
| Catalog number | Barcode PCR1 | Index PCR2 |
| 1 | CGTGAT | ATCACG |
| 2 | ACATCG | CGATGT |
| 3 | GCCTAA | TTAGGC |
| 4 | TGGTCA | TGACCA |
| 5 | CACTGT | ACAGTG |
| 6 | ATTGGC | GCCAAT |
| 7 | GATCTG | CAGATC |
| 8 | TCAAGT | ACTTGA |
| 9 | CTGATC | GATCAG |
| 10 | AAGCTA | TAGCTT |
| 11 | GTAGCC | GGCTAC |
| 12 | TACAAG | CTTGTA |
Equipment
12-well multichannel pipette (Eppendorf Research, catalog number: 4926000069)
An electronic multichannel, which releases the fluid at a given speed, might be of interest, especially when a large number of 96-well plates are used for the screen. We used the Picus 1200 (Sartorius, catalog number: 735491)
Spectrophotometer (CLARIOstar Plus, BMG Labtech)
Fluorescence microscope (Olympus Lifesciences)
FACSCanto II (BD Biosciences)
37 °C, 5% CO2 incubators (cell culture)
Electroporation system (Bio-Rad, Gene Pulser)
37 °C incubator (bacteria)
100 mL erlenmeyers
Microcentrifuge (Hettich, MIKRO 220R)
Centrifuge (Hettich, ROTINA 420)
Vortex (Heidolph, Reax Top)
Qubit (ThermoFisher)
Thermal cycler (Westburg, Biometra TAdvanced)
Gel electrophoresis system (LKB Power supply; CBS scientific)
Sequencer (Illumina, HiSeq2000)
-80 °C freezer
-20 °C freezer
Software
FlowJo (BD Biosciences; https://www.flowjo.com/)
Perl (https://www.perl.org/) or Python (Anaconda) (https://www.anaconda.com/)
DESeq2 R-package (http://www.bioconductor.org/packages/release/bioc/htmL/DESeq2.htmL) (Love et al., 2014) and/or MAGeCK (only in Linux) (https://sourceforge.net/p/mageck/wiki/Home/) (Li et al., 2014)
Procedure
Setting up the adhesion assay
Note: For choosing a suitable cell line and optimal conditions for the screen, several small-scale adhesion assays should be performed to determine which cell line shows the best adhesive capacity (either unstimulated or after stimulation, depending on the aim of the screen), which adhesion molecules and corresponding ligands are suitable for the screening analysis, which stimuli are suitable for the screen, what concentrations and incubation times should be used, etc.
Example: BCR-controlled integrin-mediated adhesion of Namalwa cells to fibronectin
Coat 96-well high binding plates with 100 µL of PBS containing 2.5 µg/mL fibronectin at 4 °C overnight or with 100 µL of PBS containing 1 mg/mL PLL for 15 min at 37 °C. The PLL should be coated on a separate plate. See Figure 2 for a layout example of an adhesion experiment.
To optimize the concentration for the coating (adhesion substrate) and, if applicable, the stimulus, perform a titration experiment with both stimulated and unstimulated cells. Using too high concentrations could result in high basal/unstimulated adhesion (Figure 3A, U2932) and/or such strong stimulated adhesion that it is difficult to inhibit (Figure 3C); using a too low concentration of coating or stimulus results in such weak adhesion that it decreases the sensitivity of the assay.
If available, take along an inhibitor that targets adhesion as a positive control. In our case, ibrutinib-treated cells were taken along to establish the concentration of fibronectin and αIgM at which unstimulated (no αIgM) and untreated (no ibrutinib) cells hardly or not adhered, whereas stimulated (with αIgM) and untreated (no ibrutinib) cells showed strong adhesion that could be efficiently inhibited by ibrutinib (Figure 3C). For Namalwa, the optimal concentrations were 2.5 µg/mL fibronectin and 100 ng/mL αIgM.
Apart from fibronectin, other cell adhesion molecules and their ligands can also be used as coating (e.g., VCAM-1, ICAM-1, selectins, cadherins, laminin, or collagen) (Figure 3D). We used fibronectin since we obtained strong adhesion with this molecule and it binds to several distinct integrins, whereas for example VCAM-1 mainly binds to integrin α4β1 (Takada et al., 2007).
Wash the wells twice with 100 µL of PBS.
Block the wells with 100 µL of 4% BSA in serum-free medium for at least 1 h at 37 °C.
For Namalwa cells, we used IMDM both as culture medium and to perform the adhesion assay.
Incubate the cells in 1% BSA in serum-free medium for 1 h at 37 °C at a cell density of 1.5 × 10⁶ per mL. If using inhibitors, add your inhibitor of interest to this medium. Adjust the time period of pre-incubation with inhibitor as desired.
Add the desired stimulus to your cells and plate 100 µL cells per well (= 1.5 × 10⁵ cells/well). Incubate for 30 min at 37 °C (Figure 2). Adjust the time period of incubation with the stimulus as desired.
For Namalwa cells, we used 100 ng/mL αIgM or 50 ng/mL PMA as stimuli. As with fibronectin, titrate these concentrations down to prevent too strong or too weak adhesion.
If possible, we recommend taking along a stimulus relatively distal in the pathway of interest. Since the viability/fitness of the cells will also affect their adhesive capacity, the knock out of a gene that impairs cell fitness will also reduce cell adhesion, irrespective of its role in the regulation of adhesion. The downstream stimulus functions as a control for the fitness (and adhesive capacity) of the cell. Here, we used PMA as distal stimulus, which is an activator of PKC and CalDAG-GEFs (Figure 1).
The incubation time can differ per stimulus. For example, for chemokine-induced adhesion, the optimal incubation time is 2 or 5 min.
Some stimuli, such as chemokines, do not maximally induce adhesion when added soluble. These molecules need to be co-coated with the adhesion molecule in step A1.
Wash the fibronectin-coated plate with 100 µL of warm 1% BSA in serum-free medium by smashing the fluid out of the plate, dapping it dry on a tissue, and gently adding new medium to remove non-adherent cells.
Repeat step A6 until (1) the uncoated wells are empty, (2) the effect of the stimulation is maximal (i.e., with a maximal number of stimulated cells and a minimal number of unstimulated cells remaining adherent), and (3) the effect of the inhibitor is maximal. Write down the number of washes necessary to reach this point, as this is an indication for the number of washes during the screening procedure.
Remove the 1% BSA in serum-free medium and fix the cells by adding 100 µL of 10% glutaraldehyde in PBS. For the PLL plate, without washing or removing cells, add 67 µL of 25% glutaraldehyde in PBS. Incubate for 10 min at room temperature.
Wash twice with PBS.
Add 100 µL of 0.5% crystal violet in 20% ethanol. Incubate for 45 min at room temperature.
Wash the plate extensively with H2O to remove the overload crystal violet.
Add 100 µL of ethanol to elute the crystal violet. Incubate for 30 min at room temperature.
Measure absorbance at 570 nm on a spectrophotometer.
Determine adhesion rate by first subtracting absorbance due to nonspecific adhesion, as determined in the uncoated, 4% BSA-blocked wells, followed by dividing it by the maximal absorbance, as determined in the PLL-coated wells.
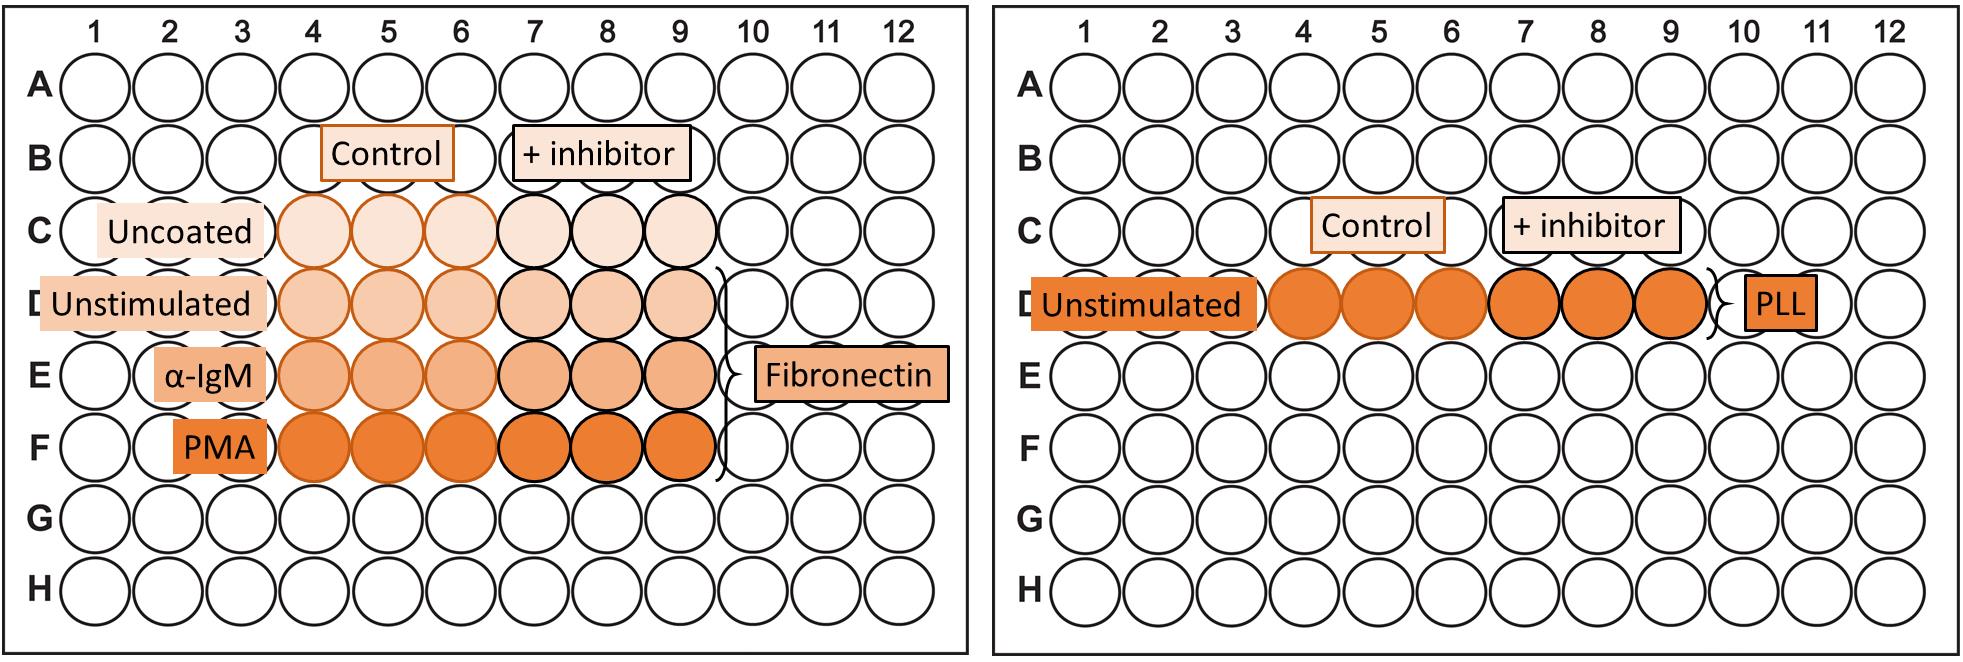
Figure 2. Plate layout adhesion assay. An example of the design of an adhesion assay (in triplicate) evaluating the effect of an inhibitor on adhesion. The PLL-coating should be on a separate plate.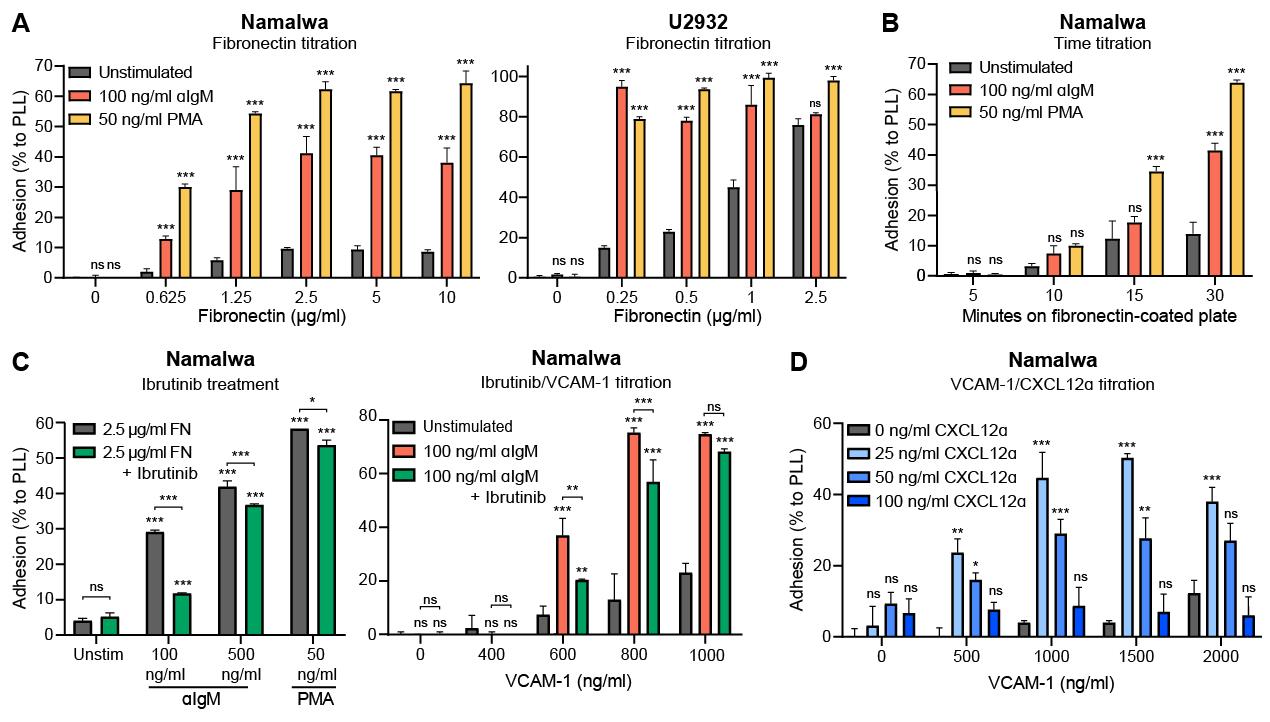
Figure 3. Titration experiments adhesion. Namalwa and U2932 cells were allowed to adhere to a coated plate as indicated. Cells were stimulated with the indicated concentration stimuli and/or pretreated with 100 nM Ibrutinib. (A) Namalwa and U2932 cells were allowed to adhere to a plate coated with different concentrations of FN. Whereas high concentrations did not affect unstimulated adhesion of Namalwa cells, U2932 cells showed increased unstimulated adhesion. Therefore, for U2932 cells the optimal concentration of FN would be 0.25 µg/mL. (B) Namalwa cells were allowed to adhere to a plate coated with 2.5 µg/mL of FN for different time frames. For αIgM and PMA, 30 min adhesion showed the strongest adhesion. (C) Ibrutinib pre-treatment prevented adhesion induced by low concentrations of αIgM and adhesion to low concentrations of VCAM-1, whereas this effect was largely gone when higher concentrations of αIgM or VCAM-1 were used. Optimal concentrations would be 100 ng/mL of αIgM and 600 ng/mL of VCAM-1, although higher concentrations resulted in an increased fold-change of stimulated adhesion over unstimulated adhesion. (D) For CXCL12α-induced adhesion to VCAM-1, an adhesion optimum was reached with 25 ng/mL of CXCL12α, reflecting the typical bell-shaped curve for stimulation of chemokine receptors due to receptor desensitization/downregulation at higher chemokine concentrations. For αIgM we did not observe a bell-shaped curve when increasing the concentration. *P < 0.05; **P < 0.01; ***P < 0.001; ns: not significant; two-way ANOVA with Tukey’s multiple comparison test of unstimulated versus stimulated condition.Choosing the cell line of interest
To select a suitable cell line, the following aspects should be considered:
The cell line should be transducible with the sgRNA library.
If using poorly transducible cell lines, we recommend using a dual-vector system with Cas9 and the sgRNA in two separate constructs, instead of a one-vector system with Cas9 and the sgRNA in the same construct. The vector size of the dual-vector sgRNA construct (approximately 10 kb) is significantly smaller than the one-vector Cas9/gRNA construct (approximately 15 kb), allowing for higher transduction efficacy of the library.
The cells should adhere sufficiently (see Section A) to reach a certain power of the screen:
If the goal is to identify genes involved in basal/unstimulated adhesion, we suggest using a cell line for which the basal adhesion is as high as possible, even after more than five washing steps.
The disadvantage of using a poorly adhering cell line is that in order to maintain the complexity of the sgRNA library post-adhesion, the quantity of cells employed for the screen and the number of adhesion assays that need to be performed is significantly higher.
The disadvantage of using a cell line that detaches after a low number (e.g., three) of washing steps is that the sensitivity of the screen is low: only all-or-nothing genes will be identified, not the intermediate adhesion inducers. For example, if the knock out of a certain gene will cause a cell line that normally detaches after ten washing steps to detach after eight washing steps, this gene will not be identified in another cell line that detaches after three washing steps; the sensitivity of the assay with this cell line is too low. Since most signaling pathways may display (partial) redundancy, a minimum of five washing steps will increase the chance of identifying genes.
If interested in stimulated adhesion, we suggest using a cell line that shows minimal basal adhesion (close to zero) and at least a 2-fold increase in adhesion after stimulation. In an ideal situation, as with identifying genes involved in basal adhesion, the fraction of cells that is adherent after stimulation is as high as possible, even after more than five washing steps.
We typically observe a distribution of the sgRNAs of 1.5-fold from the mean, so if the basal adhesion is 30% and the stimulated adhesion is 2-fold higher (60%), even a perfect dropout could only slightly drop out from the cloud in an MA-plot. Since the chance of having a perfect dropout is small, with most signaling pathways displaying (partial) redundancy, a minimum of 2-fold increase in adhesion after stimulation will increase the chance of identifying genes with the screen.
Obtaining a plasmid pool of the sgRNA library of interest
Note: Either design (and construct) the sgRNA library yourself or obtain it from a distributor (e.g., Addgene). Nowadays, many companies provide custom-designed oligo libraries, which you can clone into a vector yourself, or completely cloned customized libraries. If designing the library yourself, include control sgRNAs targeting essential and non-essential/non-expressed genes. Furthermore, make sure that known positive and negative regulators of adhesion are included in the library. For our BCR-controlled adhesion screen, we made sure that the established adhesion-regulators BTK, SYK, and PI3K (PIK3R1) (Figure 1) were present in our selected library, the Brunello kinome library.
Generating a Cas9-expressing cell line
Note: If using a one-vector library or if a stable Cas9-expressing cell line is already available, proceed directly to Section E.
Obtain a Cas9 expression vector of your interest. We used lentiCas9-Blast, since our sgRNA library contained puromycin as selection marker. This is preferred as it allows selection of transduced cells within a limited time (approximately three days).
Produce lentivirus containing the Cas9 expression vector.
Plate 1 × 10⁶ HEK293T-17 cells in 2 mL in a 6-well plate and incubate for 24 h. After 24 h, the cells should be adherent and at 80% confluency.
Use DMEM as culture medium for HEK293T-17.
Mix 2 µg of LentiCas9-Blast, 1 µg of psPAX2, 0.5 µg of pMD2.G, and 0.1 µg of pEGFP-N3 with 8 µg of PEI in 400 µL of serum free DMEM.
Note: The use of pEGFP-N3 is optional; we only added it to check the transfection efficiency of the HEK cells.
Incubate for 15 min at room temperature.
Carefully add the transfection mixture to HEK293T-17 cells and incubate for 16 h at 37 °C.
Check for GFP expression in HEK cells using a fluorescence microscope. If >50% of HEK cells are GFP-positive, replace medium with fresh medium and incubate for 24 h at 37 °C.
Take viral supernatant from HEK cells and filter with a 0.45 µm filter to remove cell debris.
Use the virus directly (step D3) or store aliquots at -80 °C.
Transduce a cell line with the Cas9 expression vector by adding the virus to your cells.
Make sure that your cells of interest are at a density compatible with their exponential growth.
If your transduction efficiency is low, you might consider adding polybrene during the viral transduction. However, in our cells polybrene was slightly toxic, so first check the effect of polybrene itself and perform a titration experiment for viability.
We added our virus in a 1:2 dilution to obtain the highest multiplicity of infection (MOI) possible. The higher the number of infections that take place during this transduction, the higher the Cas9 expression and, thus, the Cas9 activity will probably be, and the more efficient your cell line will generate your desired knockouts. If a cell line is used for which such a high concentration of virus is toxic, or if your quantity of virus is scarce, lower dilutions can also be used.
Select transduced cells by culturing the cells in the presence of 10 µg/mL blasticidin for seven days. Use untransduced cells as control.
Check Cas9 efficacy with a Cas9-reporter. We used the pKLV2-U6gRNA5(gGFP)-PGKBFP2AGFP-W lentiviral construct, which results in the expression of BFP, GFP, and a sgRNA targeting GFP.
Produce Cas9-reporter-lentivirus as in step D2.
Transduce the Cas9-expressing cells and, as control, the parental cells with the virus as in step D3.
As in step D3c, we added the virus in a 1:2 dilution to obtain the highest MOI possible, and thus the strongest effect of the reporter. Lower dilutions can be used when your cells have a high transduction efficiency, if the quantity of virus is limited, or if a high concentration of virus is toxic for your cells.
After six days, validate Cas9 efficacy by checking for GFP and BFP expression by flow cytometry. These six days are necessary to allow the cells to induce the GFP knockout. If transduction with reporter was successful, the parental cells are GFP- and BFP-positive (Figure 4; green). If all Cas9-expressing cells have active Cas9, those cells will only be BFP-positive since the sgRNA in the reporter construct results in defective GFP (Figure 4; blue). If less than 90% of the Cas9-expressing cells show active Cas9 (e.g., as for Granta-519 in Figure 4), you might consider either increasing the blasticidin concentration to improve the selection pressure or transducing the cells again with Cas9-lentivirus.
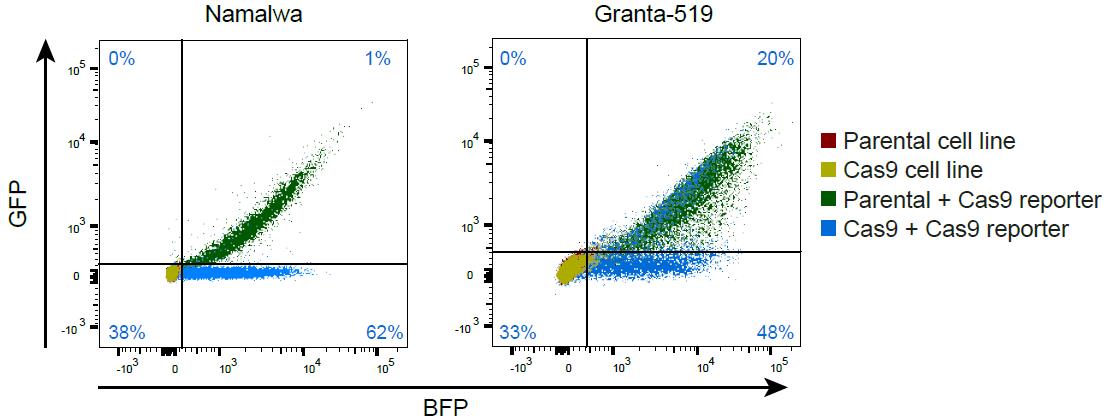
Figure 4. Cas9-reporter assay. An example of the Cas9-reporter assay with the parental and Cas9-expressing cells without Cas9-reporter in red and yellow, being both GFP- and BFP-negative. In green, parental cells transduced with the Cas9-reporter are depicted, being both GFP- and BFP-positive. In blue, the Cas9 expressing cells transduced with the Cas9-reporter are depicted, being largely only BFP-positive, indicating efficient Cas9/gRNA-mediated GFP knockout. The percentages depicted in the quadrants describe the percentage of the Cas9 cell line with the Cas9-reporter (blue) per quadrant. In Namalwa, Cas9 is active in 62/(62+1) = 98% of cells, whereas in Granta-519 only 48/(48+20) = 70% of cells contain active Cas9.
Lentiviral sgRNA library production
Note: A major determinant of successful screening is the maintenance of the complexity of the library throughout the screening process. For a dropout screen, this means that during every step of the screen (e.g., after amplifying the library, after puromycin selection, after adhesion, after DNA isolation, etc.) all sgRNAs should be represented >1,000-fold on average in your sample, to warrant sufficient (statistical) power of the screen. In the case of the Brunello kinome library, which contains 6,204 unique sgRNAs, this means that during every step of the screen at least 6.2 × 10⁶ colonies/cells should be present.
Amplify the sgRNA library.
Electroporate 0.1–1 µg plasmid library in one vial EnduraTM electrocompetent cells at 1.8 kV.
Enable the EnduraTM cells to recover in 1 mL SOC medium for 1 h at 37 °C.
Take 1 µL from EnduraTM cells and perform four consecutive 10× dilutions in 100 µL of LB (1:103, 1:104, 1:105, and 1:106). Plate these four dilutions on agar plates with 50 µg/mL of ampicillin and incubate plates upside down overnight at 37 °C.
Note: Agar plates are incubated upside down to reduce evaporation of moisture from the agar during overnight incubations.
Dilute the remaining 999 µL of EnduraTM cells in 400 mL of LB with 50 µg/mL of ampicillin and incubate overnight at 37 °C.
Count the number of colonies on the agar plates.
If enough colonies are present on the agar plates (at least 100 but preferably 1,000 times the number of unique sgRNAs present in the library), perform plasmid DNA isolation of the 400 mL of LB according to manufacturer’s protocol. Use multiple columns depending on the optical density of the bacterial culture. In our case, we typically used four columns of the NucleoBond Xtra midi prep kit.
We suggest storing a master stock of your library at -80 °C for future library amplifications, instead of amplification of consecutively produced stocks. This prevents accumulating random changes in sgRNA composition by amplification errors.
Produce lentivirus containing the library as in step D2, but with HEK293T-17 cells grown in five T175 culture flasks instead of a 6-well plate. The packaging mixture should be scaled up relative to the surface area of the culture flasks (6-well plate = 9.6 cm2). After harvesting viral supernatant, aliquot the virus in cryovials (for titration) and 15 mL tubes (screening aliquots) and store at -80 °C.
As the quality of your virus decreases with every freeze-thaw cycle, do not immediately start with the virus titration (Section F) but first freeze down the virus. This way, virus used for the screen will have the same number of freeze-thaw cycles and thus probably the same quality as the virus used for titration.
Lentiviral sgRNA library titration
Note: To maximize the number of cells with a single integration and to limit the number of cells needed for viral transduction, cells should be transduced at a MOI of 0.3. To determine the efficacy of your virus batch and the quantity of virus to be added to the cells, first perform titration assays.
Plate 1 mL of your Cas9-expressing cell line in a 6-well plate at a 2-fold higher density than the density at which the cells would not become overgrown by the end of the assay in the absence of (puromycin) selection. Plate enough wells to allow testing of all desired conditions (Figure 5).
Thaw an aliquot of the virus and prepare the desired pre-dilutions of the virus. In our case, we made pre-dilutions of 1:32, 1:16, 1:8, 1:4, and 1:2 virus and added 1 mL per well to the cells, testing a final concentration of 1:64 until 1:4. If your cell line has a higher transduction efficiency, you might consider testing for example 1:200 until 1:12.5 virus dilutions. Incubate for 24 h.
Note: Usually, 24 h is sufficient to allow cells to become resistant to puromycin. However, in some cases, cells may need up to 48 h to become resistant.
Add an appropriate concentration of puromycin to the second half of the plate to allow selection for transduced cells. Incubate for 48 h.
If the appropriate puromycin concentration is unknown, a puromycin titration experiment needs to be performed in advance.
Measure cell density and viability by flow cytometry and calculate at which concentration of virus 30% of the cells remain viable in the puromycin-condition versus the non-puromycin-condition. This will be the desired concentration of virus to be used during the screen (i.e., a MOI of 0.3).
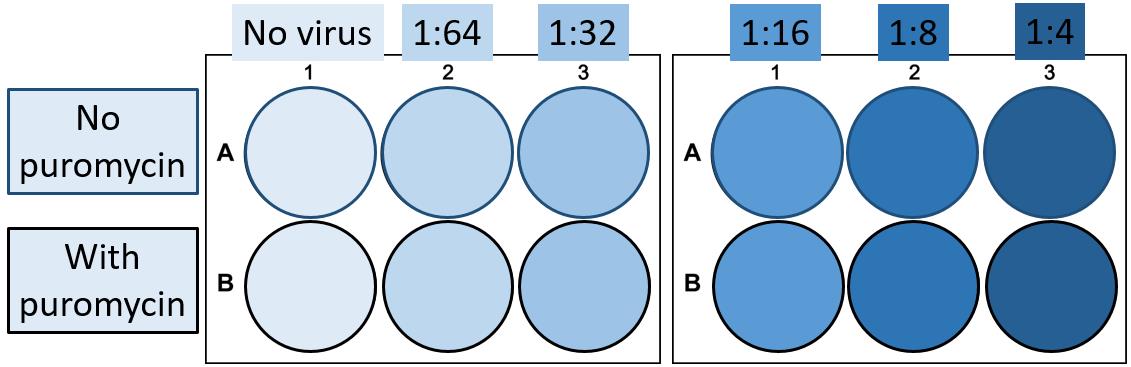
Figure 5. Plate layout virus titration. An example of the design of a virus titration assay in 6-well plates. The depicted layout is performed in duplicate.
Viral transduction of the library for the screen
Expand your cells to warrant obtaining sufficient numbers of cells for the infection at a MOI of approximately 0.3, to maintain the complexity of the library. We suggest performing three independent transductions, which you keep as separate replicate samples throughout the whole screening procedure, to increase the statistical power of your screen and thereby the chance of identifying relevant proteins.
We often observe a lower transduction efficiency in a T175 compared to a 6-well plate in which the virus titration is performed. To warrant maintenance of the desired complexity of the library (1,000× coverage), we suggest transducing more cells than calculated, if possible, to compensate for the anticipated reduced transduction efficiency.
Since we required at least 6.2 × 10⁶ transduced cells after transduction at a MOI of 0.3, we transduced 6.2 × 10⁶/0.3 + a bit extra = 24 × 106 cells.
The size of a bit extra depends on the standard deviation of your transduction efficiency. To be sure to maintain the complexity of the library, we transduced at least 10% more cells than required based upon the MOI calculation.
Divide your cells over T175 flasks, so that your cells are at a density compatible with their exponential growth. Prepare an extra flask for an untransduced, puromycin selection control.
Thaw and pool sufficient virus aliquots to transduce all flasks.
Add virus to each flask, except for the puromycin selection control, and incubate for 24 h.
Add the appropriate concentration of puromycin to achieve complete cell death of the untransduced cells and incubate for 48 h.
Allow cells to recover from the puromycin selection until cells are growing with an acceptable viability (less than 10% below standard culture viability) and proliferation rate (both close to the parental cells), and until the number of viable cells is sufficient to set up all conditions.
Allow recovery for a minimum of six days to allow efficient gene knockouts.
Adhesion screen
Pool all transduced cells of each replicate.
For each replicate, take a cell aliquot for the pre-adhesion reference sample.
This aliquot should contain at least a 1,000-fold representation of the unique sgRNAs in your library. If possible, we recommend increasing this number of cells to maintain the complexity of the library even after genomic DNA (gDNA) extraction, since the efficiency of gDNA extraction is often 50%–70%.
Pellet the aliquot of the reference sample by centrifugation (e.g., 600 × g for 3 min), aspirate supernatant, and resuspend in 200 µL of PBS per sample. Store these samples at -20 °C, until all selected samples have been collected.
Use the remaining cells for the adhesion assay as in steps A1–A6.
Coat all wells of an appropriate number of 96-well plates with fibronectin (Figure 6), but add unstimulated cells or cells pretreated with an inhibitor in the corner-wells, as a control for the number of washes. Despite the large number of used plates and the time-inefficient workload, we did not scale up the adhesion assay to, for example, 6-well plates (or Petri dishes), since high-binding 6-well plates are not available and since washing with an equal force (stringency) over the entire surface is feasible with a 96-well plate, but not with a 6-well plate.
Use separate plates for different stimuli to be able to collect the cells separately.
After extensive washing (step A6), add 100 µL of 5 mM EDTA/PBS to detach all adherent cells and incubate for 10 min. For some cell types, trypsin might be beneficial over EDTA.
Collect the adherent cells.
Wash the plate once with 100 µL of PBS and add this to the 5 mM EDTA/PBS suspension with adherent cells.
Pellet the samples as in step H3.
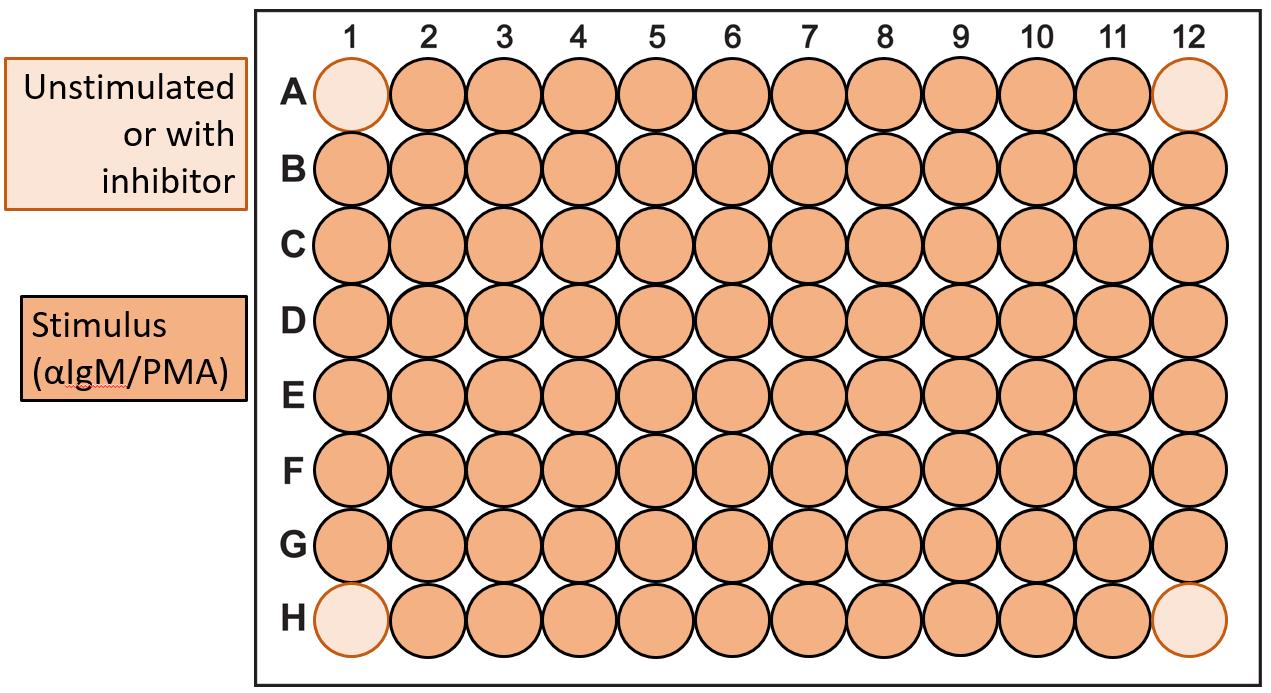
Figure 6. Plate layout adhesion assay screen. Use the wells in the corners as control wells to establish the number of washes needed during the adhesion assay. These control wells either contain unstimulated cells or cells pre-incubated with an inhibitor with an established effect on adhesion.
Genomic DNA isolation
Extract genomic DNA from cell pellets, for example, using the Quick DNA mini prep kit according to manufacturer’s protocol.
Measure DNA concentration per sample, for example using the Qubit broad range kit and a Qubit fluorometer according to manufacturer’s protocol.
PCR and next-generation sequencing of sgRNA inserts
For the first round of PCR amplification reaction (Figure 7) for each sample and for a water control (no DNA), prepare the following: 1 µg of gDNA, 10 µL of 5× HF buffer, 1 µL of 10 mM dNTPs, 1 µL of 10 µM PCR1 barcoded forward primer, 1 µL of 10 µM PCR1 reverse primer, 0.5 µL of Phusion polymerase, and H2O to 50 µL. Use a distinct barcoded forward primer for every sample.
This can be scaled up for any screening library size used. A typical human diploid cell contains 6 pg of DNA and, therefore, we used 40 reactions/40 µg DNA per sample, which is representative for 6.7 × 10⁶ cells, maintaining the coverage of the sgRNA library (>6.2 × 10⁶).
If more than 12 samples are being processed, barcoding can also be applied in the second round of PCR.
We suggest sequencing the sgRNA library as well, to assess the starting distribution of the library. To do so, use 1 ng library plasmid in one PCR reaction (50 µL).
The primers suitable for the lentiGuide-Puro and lenti-CRISPRv2 backbone are listed in Table 1 and 2 (Evers et al., 2016).
Run the following protocol: (1) 98 °C for 30 s; (2) 21 cycles of 98 °C for 30 s, 60 °C for 30 s, and 72 °C for 1 min; (3) 72 °C for 5 min; (4) hold at 4 °C.
Pool the PCR reactions.
Use the product of PCR1 to set up the second round of PCR reactions (Figure 7) using distinct indexed reverse primers if processing more than 12 samples: 2 µL of pooled PCR1 product, 10 µL of 5× HF buffer, 1 µL of 10 mM dNTPs, 1 µL of 10 µM PCR2 forward primer, 1 µL of 10 µM PCR2 indexed reverse primer, 0.5 µL of Phusion polymerase, and 34.5 µL of H2O (final volume is 50 µL).
Run the following protocol: (1) 98 °C for 30 s; (2) 15 cycles of 98 °C for 30 s, 60 °C for 30 s, and 72 °C for 1 min; (3) 72 °C for 5 min; (4) hold at 4 °C.
Apply 4 µL of each PCR2 product, including the H2O control, to a 2% agarose gel to inspect the presence of an appropriately sized product (589 bp) across the samples and the absence of any product in the H2O (no DNA) control (see Figure 8 for an example).
Purify the PCR product using the PCR purification kit according to the manufacturer’s protocol. In case of a prominent primer dimer band, first apply the full PCR product to a 2% agarose gel and isolate the proper band from the gel.
Measure the DNA concentration per sample using the Qubit high sensitivity kit and a Qubit fluorometer according to the manufacturer’s protocol.
Pool equimolar quantities of all samples.
Run samples on an Illumina next-generation sequencer, according to the manufacturer’s protocol.
For a screen with nine conditions (samples of pre-adhesion and two stimuli post-adhesion, all in triplicate) generated with a library containing 6,000 sgRNA constructs, we would require 5.4 × 10⁷ reads. This can easily be achieved on a single HiSeq X lane (expected number of reads being approximately 3 × 10⁹). Addition of 30% PhiX is recommended, because of the limited variation of initial nucleotides.
The barcoded/indexed primers can be adjusted to the favorite design of your sequence facility, like the TruSeq design, and can be run together with RNAseq samples.
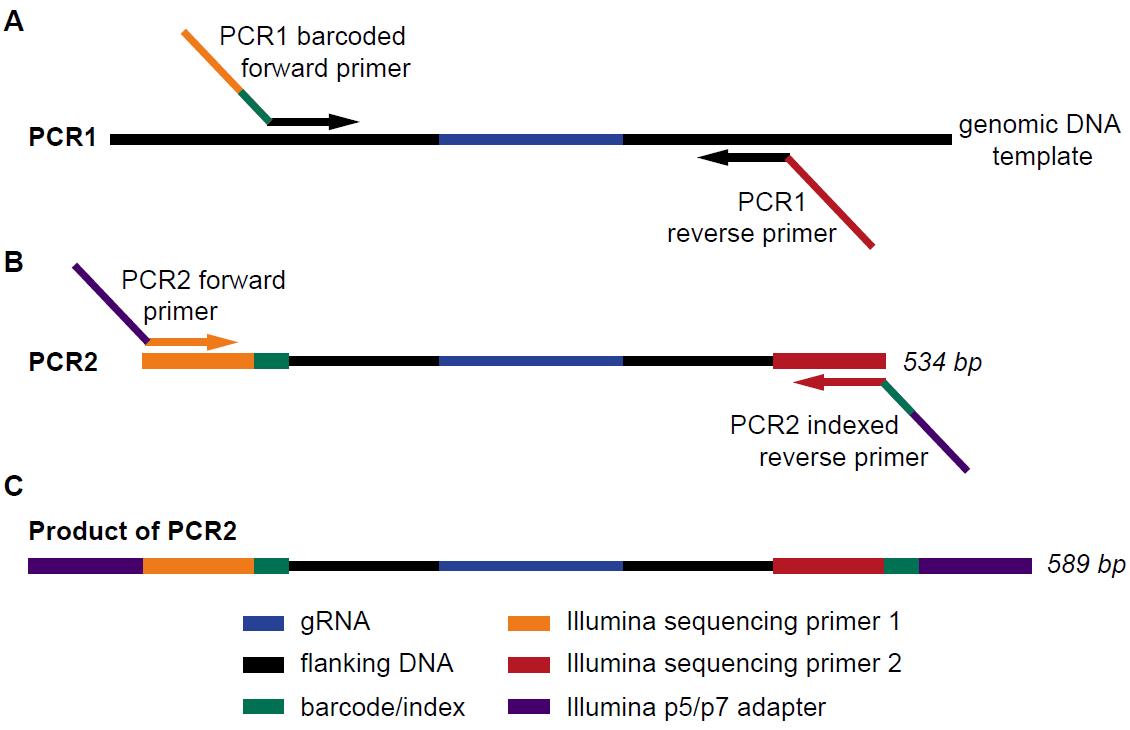
Figure 7. Schematic overview of PCR reactions for sequencing library preparation. (A) The first round of amplification is carried out with primers flanking the sgRNA sequence. The PCR1 forward primer adds a barcode and the Illumina sequencing primer 1, while the reverse primer adds the Illumina indexing read primer sequence. (B) The second round of PCR uses the product of PCR1 as template to add the P5 and P7 adapters, as well as a further optional index in the reverse primer. (C) The final product is a 589 bp fragment containing all the elements required for annealing and sequencing on Illumina high throughput sequencers. Adapted from Jastrzebski et al. (2016).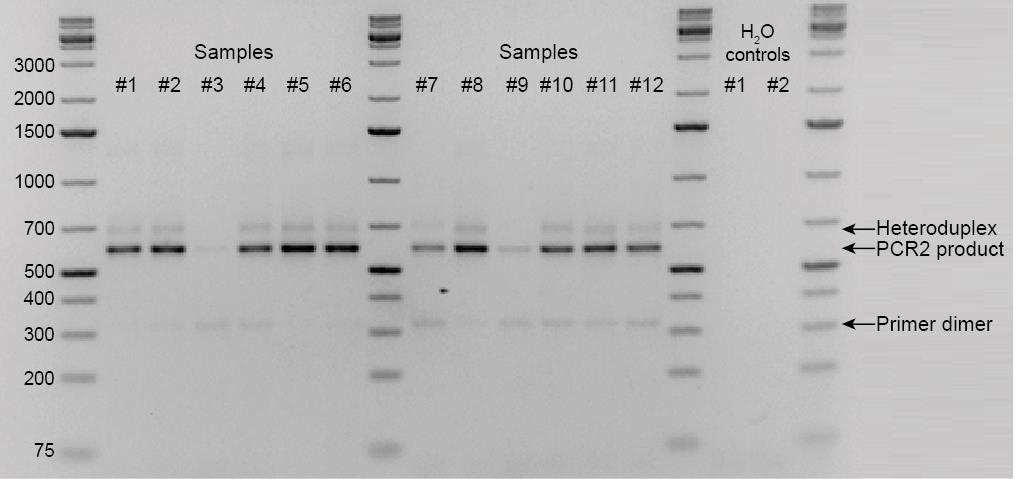
Figure 8. Agarose gel with PCR2 product. The PCR2 product of 589 bp is present in most samples and not in the H2O controls of PCR1 and PCR2. The third and ninth samples failed and were repeated.
Data analysis
Note: All used scripts for R, Perl, and Python are available on the public GitHub repository https://github.com/MFMdeRooij/CRISPRscreen/https://doi.org/10.5281/zenodo.6342853. In these scripts, the analysis is more extensively explained, while here we only provide a brief description. The raw data of the Namalwa adhesion screen are available in the NCBI SRA database under the accession number SRR16971271.
Generate a count table from the fastq file as described on the GitHub repository (/CRISPRScreenAnalysis/FastqToCountTable.pl). In brief, this script:
Sorts the reads on barcode (i.e., per sample).
Determines the guide sequence and counts unique guides.
Aligns the count table to the reference table of the library.
For barcode determination one mismatch was allowed; for guide sequence determination no mismatches were allowed but a shift of maximum three nucleotides was allowed. These shifts are caused by indels in the synthetic PCR oligos. Optionally, you can order HPLC-purified PCR primers, which have fewer mutations.
Perform DESeq2 analysis (Love et al., 2014) and αRRA from the MAGeCK pipeline (Li et al., 2014) as described on the GitHub repository (/CRISPRScreenAnalysis/CRISPRScreen Analysis.R) to obtain statistics at guide and gene level. This analysis can include shrinkage of non-informative fold changes, which makes it different from standard MAGeCK analysis. The script generates guide and gene output tables, and for example replicate, dispersion, and MA plots (see Figure 9 for an example).
The median fold changes of hits in a (synthetic) lethality screen are generally higher than in a loss-of-adhesion screen, since in a lethality screen samples are typically compared after 10 cell divisions. If the event (apoptosis/cell cycle arrest) occurs after two cell divisions, this effect is amplified for eight more cell divisions (so times 28 = 256-fold depletion). In the loss-of-adhesion screen, an event is not amplified by cell divisions. Nonetheless, the loss-of-adhesion screen provides sufficient power to identify proteins involved in adhesion (de Rooij et al., 2022).
To determine whether cell viability affects your assay, either perform a lethality screen in parallel or define (strong) viability genes by comparing read counts of the pre-adhesion samples with the distribution of the library (significant: FDR < 0.1 DESeq2 followed by αRRA). If present in your library, the essential genes of Hart et al. (2014) can also be used.
Generate volcano plots by plotting the median fold change of the guides per gene against the αRRA depletion and enrichment scores, as described on the GitHub repository (/CRISPRScreenPlots/VolcanoSplit_GenesOfInterest.py) or fold change plots (/CRISPRScreenPlots/GuideFCPlot.py), which plotted the fold changes of all the guides against the genes of interest.
Optionally, check the sequence quality as described on the GitHub repository using Pearl and R (/CRISPRScreenAnalysis/Quality.pl followed by /CRISPRScreenAnalysis/Quality.R) or using Python (/CRISPRScreenAnalysis/FastqToCountTable.py). With these scripts you can determine the number of CRISPR reads per barcode, the number of reads perfectly mapped to the library, the number of primer dimer reads, and the most abundant read. If this most abundant read is not present in your library, this indicates a PCR contamination.
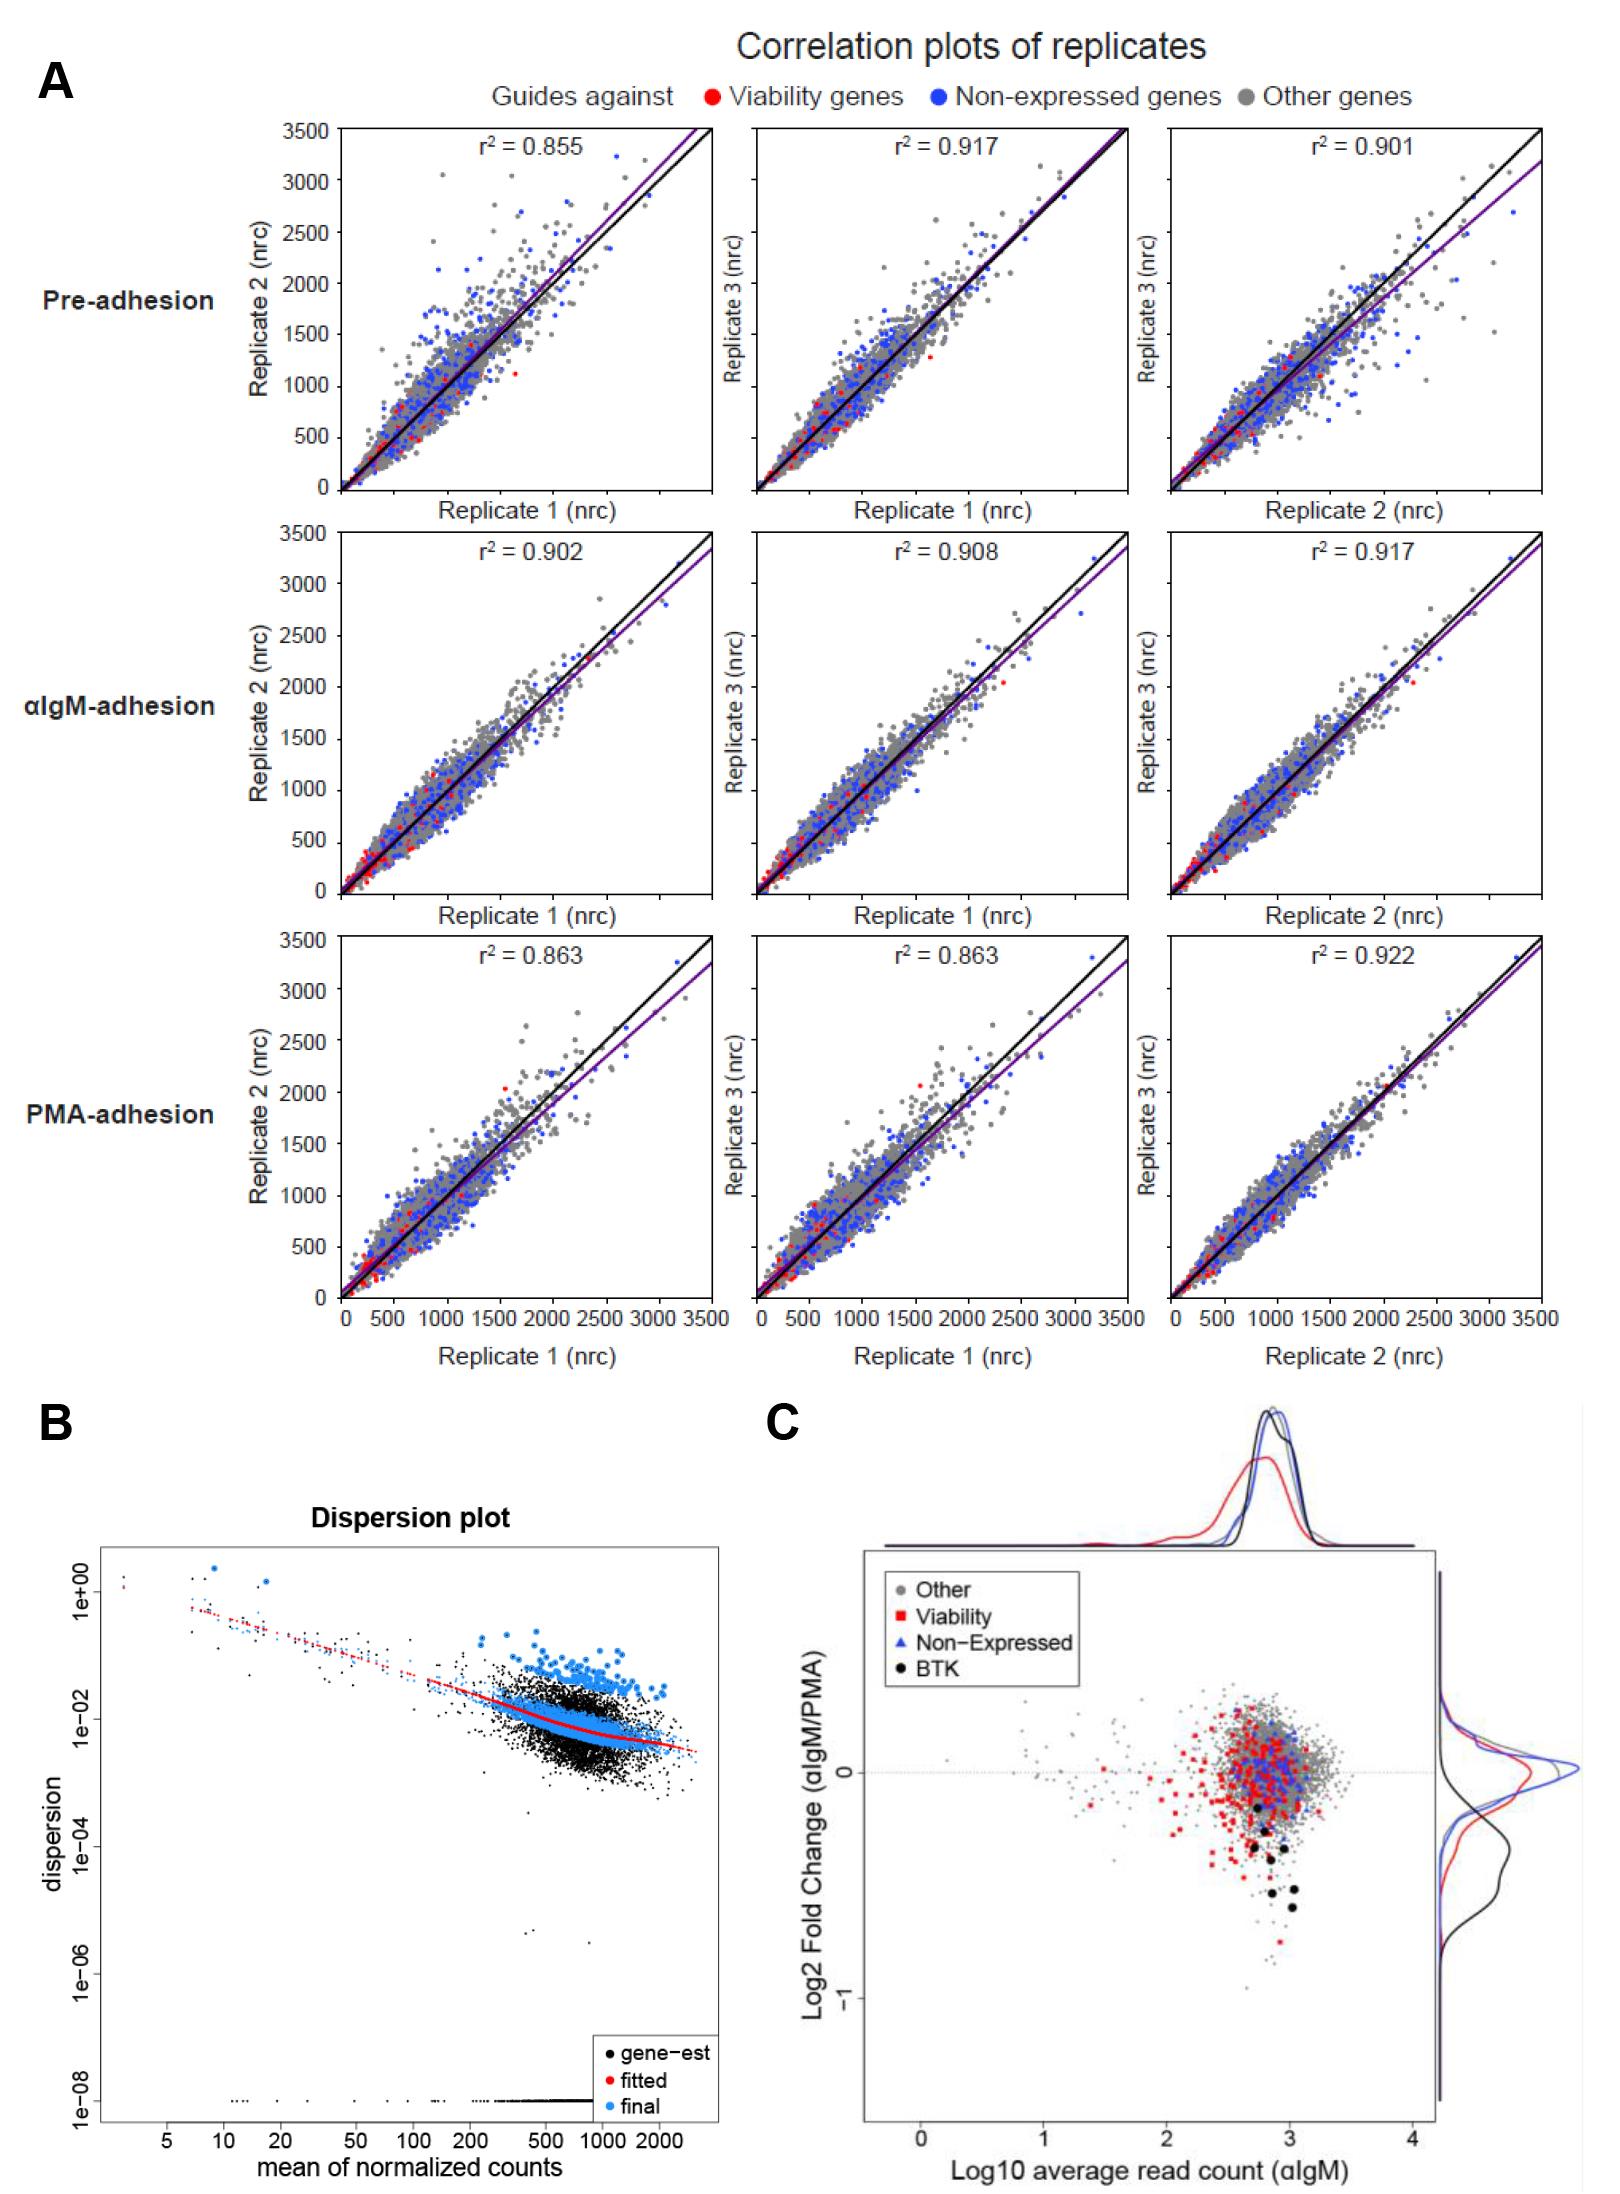
Figure 9. Example of DESeq2 analysis of the loss-of-adhesion screen of Namalwa. (A) The replicate plots of guide distribution in the three different replicates of the Namalwa screen. nrc: normalized read counts; black line y=x; purple line: linear fit. (B) The dispersion is plotted versus the mean of normalized counts per guide. (C) The log10-count of the guides in the αIgM-stimulated post-adhesion sample is plotted (horizontally) against the log2-fold change of the guides in the αIgM-stimulated post-adhesion sample versus the PMA-stimulated post-adhesion sample (vertically). In black, the guides targeting BTK are depicted.
Recipes
Supplemented culture medium
Reagent Final concentration Amount DMEM/IMDM n/a 500 mL FCS 10% 50 mL L-glutamine (200 mM) 2 mM 5 mL Penicillin-streptomycin 1% 5 mL Total n/a 560 mL 0.5% crystal violet in 20% ethanol
Reagent Final concentration Amount Crystal violet 5% 25 g Ethanol (absolute) 20% 100 mL H2O n/a 400 mL Total n/a 500 mL Agar plates containing antibiotics
Reagent Final concentration Amount LB 20 g/L 15 g Agar 15 g/L 11.25 g H2O n/a 750 mL Total n/a 750 mL Autoclave this solution in a 1 L bottle.
Cool down to approximately 55 °C.
Add the appropriate antibiotic to the plate, depending upon which antibiotic resistance gene the plasmid carries. We used 750 µL of 50 mg/mL ampicillin (final concentration is 100 µg/mL).
Pour approximately 10 mL per plate.
Leave your plates out on the bench to solidify.
LB medium containing antibiotics
Reagent Final concentration Quantity LB 20 g/L 15 g H2O n/a 750 mL Total n/a 750 mL Autoclave this solution in a 1 L bottle.
Cool down to approximately 55 °C.
Add the appropriate antibiotic, depending upon which antibiotic resistance gene the plasmid carries. We used 750 µL 50 mg/mL ampicillin (final concentration is 100 µg/mL).
SOC medium
Reagent Final concentration Quantity LB 20 g/L 5 g D-glucose 20 mM 900.8 mg H2O n/a 250 mL Total n/a 250 mL Produce as LB but with D-glucose added.
0.5 M EDTA, pH 8.0
Reagent Final concentration Quantity EDTA 0.5 M 186.1 g H2O n/a 1,000 mL Total n/a 1,000 mL Stir 186.1 g of EDTA into 800 mL of distilled water.
Add NaOH solution to adjust the pH to 8.0.
Dilute the solution to 1 L with distilled water.
TAE buffer (10×)
Reagent Final concentration Quantity Tris-base 400 mM 48.4 g Acetic acid (100%) 200 mM 11.4 ml EDTA (0.5 M, pH 8.0) 10 mM 20 mL H2O n/a 970 mL Total n/a 1,000 mL Dissolve 48.4 g of Tris-base in approximately 700 mL of deionized H2O.
Carefully add 11.4 mL of 100% acetic acid and 20 mL of 0.5 M EDTA.
Adjust the solution to a final volume of 1 L.
For the preparation of the 1× TAE working solution, dilute 100 ml of 10× TAE buffer in 900 mL H2O.
Agarose gel
Reagent Final concentration Quantity Agarose 2% 3 g TAE buffer n/a 150 mL Total n/a 150 mL Heat the agarose/TAE buffer mixture in a microwave. At 30 s intervals, remove the flask and swirl the contents to mix well. Repeat until the agarose has completely dissolved.
Add 0.5 μg/mL ethidium bromide.
Pour gel in casting apparatus.
Allow the agarose to set at room temperature.
Acknowledgments
This research was supported by grants from the Dutch Cancer Society (KWF) to MS (catalog number: 7873, catalog number: 102750) and to RLB (catalog number: 12539), and by grants from Lymph&Co and the International Waldenstrom’s Macroglobulinemia Foundation (IWMF)/Leukemia & Lymphoma Society (LLS) to MS. This protocol was adapted from de Rooij et al. (2022).
Competing interests
The authors have no competing interests to declare.
Ethics
The study did not involve human subjects or animal work.
References
- Brown, J. R., Byrd, J. C., Coutre, S. E., Benson, D. M., Flinn, I. W., Wagner-Johnston, N. D., Spurgeon, S. E., Kahl, B. S., Bello, C., Webb, H. K., et al. (2014). Idelalisib, an inhibitor of phosphatidylinositol 3-kinase p110δ, for relapsed/refractory chronic lymphocytic leukemia. Blood 123(22): 3390-3397.
- Burger, J. A. and Wiestner, A. (2018). Targeting B cell receptor signalling in cancer: preclinical and clinical advances. Nature Reviews Cancer 18(3): 148-167.
- Byrd, J. C., Furman, R. R., Coutre, S. E., Flinn, I. W., Burger, J. A., Blum, K. A., Grant, B., Sharman, J. P., Coleman, M., Wierda, W. G., et al. (2013). Targeting BTK with Ibrutinib in Relapsed Chronic Lymphocytic Leukemia. New Engl J Med 369(1): 32-42.
- Chang, B. Y., Francesco, M., De Rooij, M. F. M., Magadala, P., Steggerda, S. M., Huang, M. M., Kuil, A., Herman, S. E. M., Chang, S., Pals, S. T., et al. (2013). Egress of CD19+CD5+ cells into peripheral blood following treatment with the Bruton tyrosine kinase inhibitor ibrutinib in mantle cell lymphoma patients. Blood 122(14): 2412-2424.
- de Rooij, M. F. M., Kuil, A., Geest, C. R., Eldering, E., Chang, B. Y., Buggy, J. J., Pals, S. T. and Spaargaren, M. (2012). The clinically active BTK inhibitor PCI-32765 targets B-cell receptor– and chemokine-controlled adhesion and migration in chronic lymphocytic leukemia. Blood 119(11): 2590-2594.
- de Rooij, M. F. M., Kuil, A., Kraan, W., Kersten, M. J., Treon, S. P., Pals, S. T. and Spaargaren, M. (2016). Ibrutinib and idelalisib target B cell receptor- but not CXCL12/CXCR4-controlled integrin-mediated adhesion in Waldenström macroglobulinemia. Haematologica 101(3): e111-e115.
- de Rooij, M. F. M., Thus, Y. J., Swier, N., Beijersbergen, R. L., Pals, S. T. and Spaargaren, M. (2022). A loss-of-adhesion CRISPR-Cas9 screening platform to identify cell adhesion-regulatory proteins and signaling pathways. Nat Commun 13(1): 2136.
- Evers, B., Jastrzebski, K., Heijmans, J. P. M., Grernrum, W., Beijersbergen, R. L. and Bernards, R. (2016). CRISPR knockout screening outperforms shRNA and CRISPRi in identifying essential genes. Nat Biotechnol 34(6): 631-633.
- Hart, T., Brown, K. R., Sircoulomb, F., Rottapel, R. and Moffat, J. (2014). Measuring error rates in genomic perturbation screens: gold standards for human functional genomics. Mol Syst Biol 10(7): 733.
- Jastrzebski, K., Evers, B. and Beijersbergen, R. L. (2016). Pooled shRNA Screening in Mammalian Cells as a Functional Genomic Discovery Platform. In: Azorsa, D. O. and Arora, S. (Eds.) High-Throughput RNAi Screening: Methods and Protocols. Springer New York, 49-73.
- Li, W., Xu, H., Xiao, T., Cong, L., Love, M. I., Zhang, F., Irizarry, R. A., Liu, J. S., Brown, M. and Liu, X. S. (2014). MAGeCK enables robust identification of essential genes from genome-scale CRISPR/Cas9 knockout screens. Genome Biol 15(12): 554.
- Love, M. I., Huber, W. and Anders, S. (2014). Moderated estimation of fold change and dispersion for RNA-seq data with DESeq2. Genome Biol 15(12): 550.
- Przybyla, L. and Gilbert, L. A. (2022). A new era in functional genomics screens. Nat Rev Genet 23(2): 89-103.
- Stephens, D. M. and Byrd, J. C. (2021). Resistance to Bruton tyrosine kinase inhibitors: the Achilles heel of their success story in lymphoid malignancies. Blood 138(13): 1099-1109.
- Takada, Y., Ye, X. and Simon, S. (2007). The integrins. Genome Biology 8(5): 215.
- Treon, S. P., Tripsas, C. K., Meid, K., Warren, D., Varma, G., Green, R., Argyropoulos, K. V., Yang, G., Cao, Y., Xu, L., et al. (2015). Ibrutinib in Previously Treated Waldenström’s Macroglobulinemia. New Engl J Med 372(15): 1430-1440.
- Wang, M. L., Rule, S., Martin, P., Goy, A., Auer, R., Kahl, B. S., Jurczak, W., Advani, R. H., Romaguera, J. E., Williams, M. E., et al. (2013). Targeting BTK with Ibrutinib in Relapsed or Refractory Mantle-Cell Lymphoma. New Engl J Med 369(6): 507-516.
Article Information
Copyright
© 2022 The Authors; exclusive licensee Bio-protocol LLC.
How to cite
Thus, Y. J., de Rooij, M. F. M., Beijersbergen, R. L. and Spaargaren, M. (2022). An Unbiased CRISPR-Cas9 Screening Method for the Identification of Positive and Negative Regulatory Proteins of Cell Adhesion. Bio-protocol 12(21): e4545. DOI: 10.21769/BioProtoc.4545.
Category
Cancer Biology > Invasion & metastasis > Drug discovery and analysis > Cell adhesion
Drug Discovery > Drug Screening
Cell Biology > Cell movement > Cell adhesion
Do you have any questions about this protocol?
Post your question to gather feedback from the community. We will also invite the authors of this article to respond.