- Protocols

- Articles and Issues
- For Authors
- About
- Become a Reviewer

Fluorescent Binding Protein Sensors for Detection and Quantification of Biochemicals, Metabolites, and Natural Products
Published: Vol 12, Iss 22, Nov 20, 2022 DOI: 10.21769/BioProtoc.4543 Views: 2920
Reviewed by: Chiara AmbrogioAnonymous reviewer(s)
Original research article
The authors used this protocol in:

Mar 2022
Advertisement


Protocol Collections
Comprehensive collections of detailed, peer-reviewed protocols focusing on specific topics


Related protocols
Abstract
Membrane transporters and soluble binding proteins recognize particular nutrients, metabolites, vitamins, or ligands. By modifying genetically engineered single cysteine residues near the active sites of such proteins with extrinsic maleimide fluorophores, the approaches that we report create sensitive fluorescent sensors that detect, quantify, and monitor molecules that are relevant to the biochemistry, physiology, microbiology, and clinical properties of pro- and eukaryotic organisms.
Graphical abstract:
Background
The covalent modification of proteins to investigate their biochemical properties (Means and Feeney, 1971) was initially limited by the often uncertain location of amino acid side chains in protein tertiary structure, and the variable reactivity of different side chains with extrinsic chemical probes. However, the combination of protein sequence information, crystallographic depictions of protein folding, site-directed mutagenesis, and specific alkylation chemistry allowed high yield, often stoichiometric labeling of genetically engineered cysteine (Cys) sulfhydryls at strategic sites in proteins. Cys sulfhydryls are selectively modified by reagents like methanthiosulfonates, maleimides, and iodoacetamides (Means and Feeney, 1971). When combined with site-directed spin labeling experiments and electron paramagnetic resonance (EPR) spectroscopy, this approach provided information about the structure and function of membrane proteins (Altenbach et al., 1989, 1990). In addition, while exploring the properties of the major facilitator lactose permease, LacY, Kaback and colleagues adapted the method to site-directed fluorescent labeling (Nie et al., 2007; Smirnova et al., 2008). However, LacY is a Gram-negative bacterial inner membrane (IM) protein that is shielded by the barrier properties of the outer membrane [OM; Nikaido, 2003; Nikaido and Vaara, 1985] and hence recalcitrant to labeling in vivo. Our protocol focuses on fluorescent modification of engineered Cys residues on the external loops of Gram-negative bacterial OM proteins (OMPs), to transform them into sensors. This methodology enables labeling of living cells, which has many advantages, including facile preparation, high sensitivity, biochemical durability, multifunctionality, and convenient storage (Nairn et al., 2017; Chakravorty et al., 2019; Kumar et al., 2022). We also genetically engineered, purified, and fluorescently labeled binding proteins [e.g., human siderocalin (HsaSCN)] for use as soluble sensors. These manipulations transform both types of proteins into sensitive, quantitative biosensors that detect the presence of biochemicals, metabolites, natural products, enzymes, and other molecules.
Materials and Reagents
Appropriate growth media [e.g., MOPS minimal media (Neidhardt et al., 1974)]
50 mM NaHPO4, pH 6.7
Phosphate-buffered saline (PBS)
Talon Superflow metal affinity resin (Takara, catalog number: 635670; for purification of soluble proteins)
A stock solution of ~1 mM fluorescein 5' maleimide (FM; AnaSpec, catalog number: AS-81405) in anhydrous dimethyl formamide (DMF) or dimethyl sulfoxide (DMSO)
10 mM Tris-Cl, pH 8
β-mercaptoethanol (Fisher, catalog number: O3446I-100)
Sensor storage: solutions containing 10% glycerol, either labeled bacterial cells in media, or purified protein buffer, respectively. Store samples frozen at -70 °C.
Iron-deficient MOPS Minimal Medium (Neidhardt et al., 1974) (see Recipes)
Iron-free glassware (see Recipes)
50 mM sodium phosphate, pH 6.7 (see Recipes)
Phosphate-buffered saline (see Recipes)
Equipment
High-speed centrifuge (Beckman Coulter, model: Avanti J25)
Spectrophotometer (Beckman Coulter, model: DU800)
Fluorometer (OLIS Clarity; model: OLIS-SLM-Aminco 8100) and quartz fluorescence cuvettes (Fisher 14-958-128)
Typhoon Biomolecular Imager (GE/Amersham, model: 8600)
Procedure
Overall design and engineering of site-directed fluorescent sensors
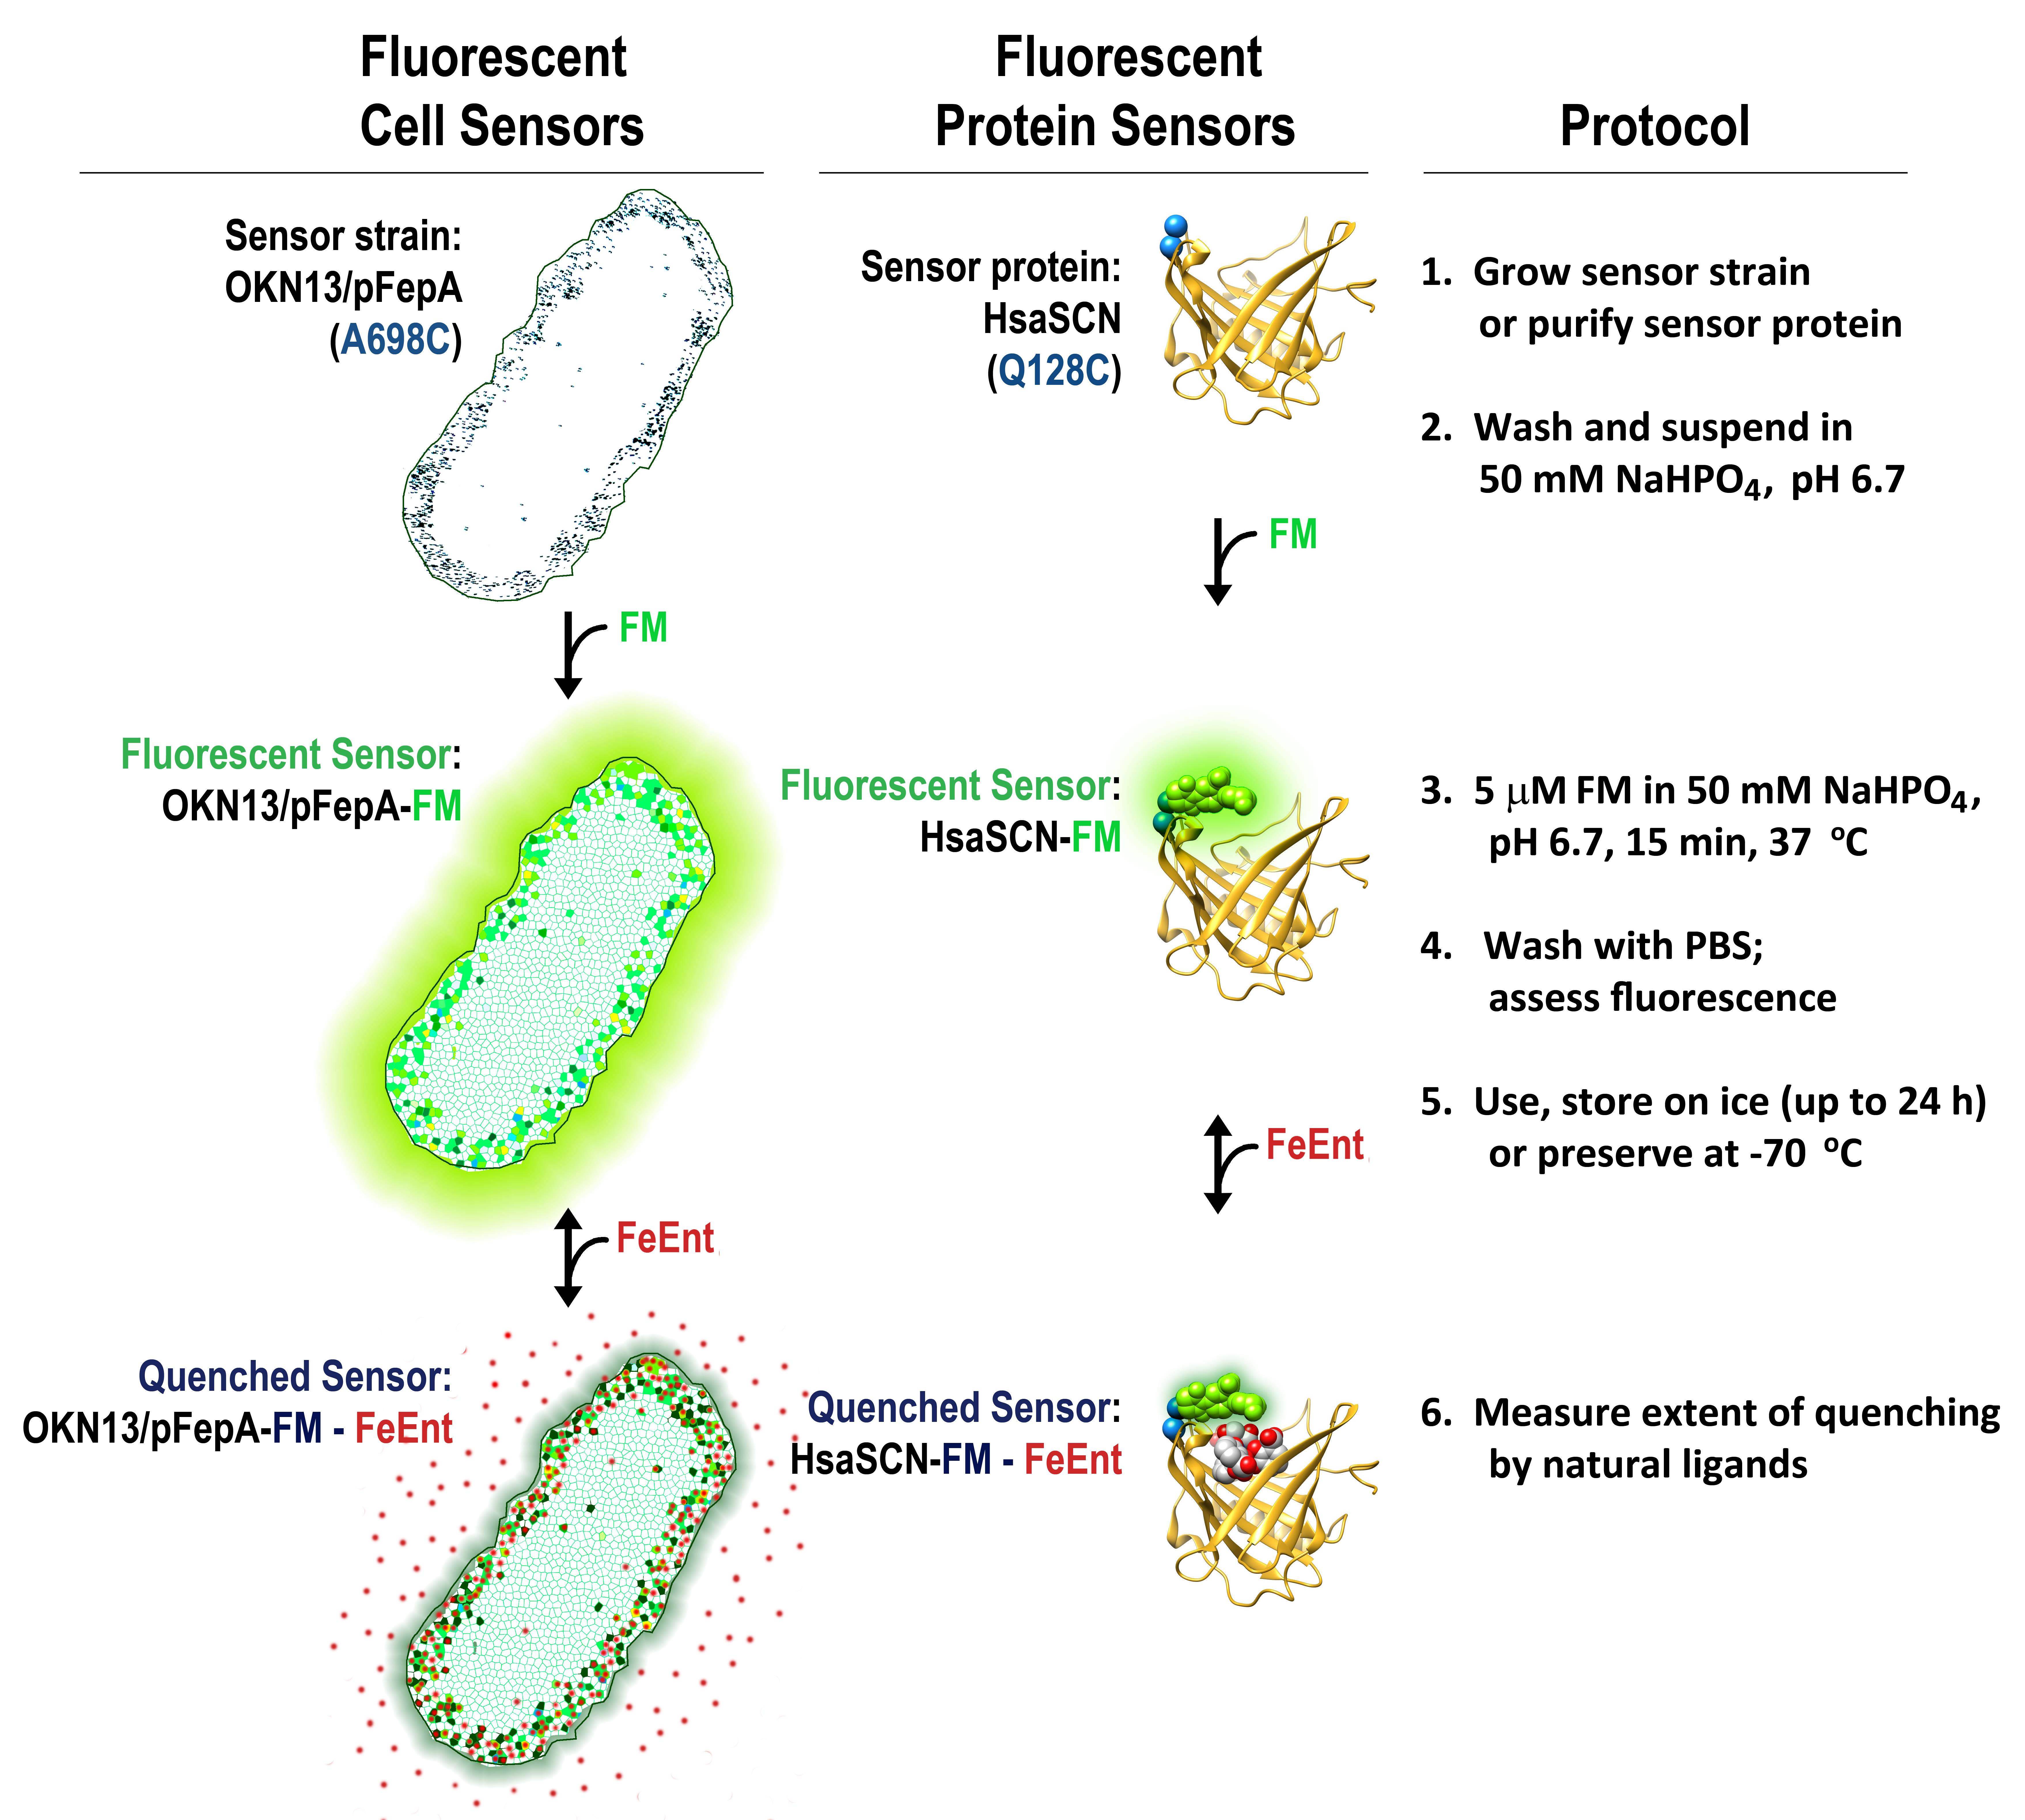
This methodology is predicated on locating sites in the primary structure of OM or soluble binding proteins that tolerate Cys substitution and chemical modification with extrinsic fluorophores. Using either crystallographic data or structural models [e.g., from the MODELLER algorithm of CHIMERA (Pettersen et al., 2004)], we predict accessible sites, genetically engineer single Cys residues at those locations, and subject the resulting Cys mutant proteins to labeling with fluorophores. Regardless of the basis of such predictions, the extent of labeling and biochemical functionality of each construct must be experimentally verified. Consequently, for each protein of interest we select 4–6 candidate target residues, mutagenize them to substitute Cys, evaluate their expression, their susceptibility to alkylation with different maleimide fluorophores, and their overall sensitivity to interactions with ligands.
Selection of target residues for Cys substitution mutagenesis
For a protein whose tertiary or quaternary structure is fully delineated, we pick candidate residues with side chains that project near its ligand binding site, such that adsorption of a ligand may result in the quenching of an attached fluorophore. For example, Escherichia coli FepA (EcoFepA) binds the siderophore ferric enterobactin (FeEnt) in the loops of its surface vestibule (Smallwood et al., 2014). Its crystal structure (Buchanan et al., 1999) correctly predicted that Cys mutant proteins EcoFepA_S271C and EcoFepA_A698C are accessible to fluoresceination, and then sensitive to FeEnt binding (Smallwood et al., 2014). For Klebsiella pneumoniae IroN (KpnIroN), which is not yet structurally solved but has 82% identity to EcoFepA, we relied on the guideline that >25% sequence identity predicts an identical overall protein fold (Ginalski, 2006; Stokes-Rees and Sliz, 2010). To determine labeling targets in KpnIroN we used CLUSTALW to align it with EcoFepA [PDB sequence 1FEP (Buchanan et al., 1999)], and then employed the MODELLER of CHIMERA (UCSF) to predict KpnIroN tertiary structure, including surface loops. This led to the selection and engineering of mutant KpnIroN_T210C, located in L2, that is quantitatively modified by FM (Chakravorty et al., 2019).
Cys mutant proteins
As a general approach, we use PCR to clone a binding protein of interest from the chromosomes of a particular bacterial species. When the sensors originate from E. coli OMPs, we clone the nucleotide sequences encoding their mature proteins and insert them downstream from the native promoter of EcofepA in pITS23 (Scott et al., 2001), which is a derivative of the low-copy pHSG575 (Takeshita et al., 1987). One may generate Cys substitution mutants in proteins by a variety of methods; we use QuikChange mutagenesis (Agilent) of the wild-type genes on pITS23 (Ma et al., 2007), with complementary oligonucleotides flanking the mutation, following the manufacturer’s instructions. After confirming the mutations by sequencing (Genewiz) of purified plasmids, express and fluorescently label the sensor proteins in intact cells, that may be stored frozen at -70 °C. If the desired sensor derives from a soluble binding protein, then clone the relevant structural genes in plasmid pET28a, that adds a 6-histidine (6H)- tag at either the N- or C-termini of the mature protein, and purify it by metal ion affinity chromatography (Talon Superflow, Takara Bio Inc.).
Cys mutant protein expression and analysis of fluorescence labeling
Although other plasmid systems are likely also acceptable, our vector for OMP production, pITS23 (Scott, 2000), carries wild-type EcofepA under control of its native, Fur-regulated promoter. For expression of other E. coli OMP sensors, we precisely replace EcofepA in pITS23 with the alternate OMP structural gene (with its own signal sequence), such that the iron-regulated EcofepA promoter controls biosynthesis of the OM protein. For OM proteins of other bacterial species, we replace the sequence encoding mature EcoFepA with the sequence encoding the foreign, mature OM protein, downstream from the EcoFepA signal sequence, and regulated by the EcofepA promoter. This approach allows for the EcoFepA signal sequence to direct secretion and assembly of the foreign OMP in the E. coli OM. Next, choose appropriate conditions for high-level expression of the OM sensor proteins of interest. We utilize the E. coli host OKN1359, because its inability to make enterobactin (entA) or to transport iron (∆tonB) leads to overexpression of iron-regulated sensor proteins during growth in iron-deficient MOPS media (Chakravorty et al., 2019; Kumar et al., 2022). Additionally, OKN1359 is devoid of several OM proteins (∆fiu, ∆fepA, ∆cir), which facilitates expression of foreign OM proteins. Expose the Cys mutant constructs in situ, in living cells, to FM or other fluorophore maleimides (e.g., coumarin maleimides and Alexa Fluor maleimides; see below). Evaluate the expression and labeling of each cloned OMP by growing bacteria harboring the appropriate plasmid construct in MOPS medium to late log phase (A600nm = 2.5–3.5), and analyze SDS-PAGE resolved samples, or perform immunoblots of bacterial OM or soluble purified protein fractions, to visualize the production and extent of modification of the sensor proteins. For soluble binding proteins, purify a 6H-tagged Cys mutant protein from cell lysate by metal affinity chromatography (e.g., Talon Superflow, Takara Bio Inc), modify it with FM or other fluorophore maleimides, and re-purify the fluorescently labeled sensor by acetone precipitation or gel filtration chromatography.
Fluorescence labeling
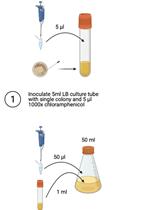
For modifications with fluorophore maleimides, inoculate bacteria harboring plasmids that encode a Cys mutant OMP from frozen stocks into LB, grow the strain with shaking (200 rpm) at 37 °C overnight, and sub-culture at 1% into MOPS minimal media with shaking (200 rpm) at 37 °C for 10–12 h, until late exponential phase. Collect the cells by centrifugation at 7,500 × g for 15 min; wash with and resuspend in 50 mM NaHPO4, pH 6.7. Use a micropipettor tip to transfer a small amount of maleimide fluorophore (e.g., FM) powder to 0.5 mL of anhydrous DMF or DMSO, and determine the concentration of this stock solution from its absorbance at 488 nm in 10 mM Tris-Cl, pH 8 (ϵmM = 80). The stock solution may be stored at -20 °C. Calculate the appropriate dilution factor of the stock, and then label the bacterial cells or purified proteins in 50 mM NaHPO4, pH 6.7, by adding FM to a final concentration of 5 μM, at 37 °C for 15 min. Terminate the labeling reaction by adding β-mercaptoethanol to 140 μM, which instantaneously reacts with excess fluorophore maleimide. After collecting the fluoresceinated cells by centrifugation at 7,500 × g for 15 min, wash with phosphate-buffered saline (PBS), and resuspend the labeled bacteria in PBS. Immediately use the labeled cells in spectroscopic experiments or rest them on ice (up to 24 h), or add glycerol to 15% and store them (indefinitely) as 1-mL aliquots at -70 °C. In the latter case, after thawing the labeled cells, pellet them by centrifugation in a microfuge, wash them once, and resuspend them in PBS. For evaluation of protein expression or the extent of FM-labeling, solubilize aliquots of the cell suspensions with sample buffer, and subject them to SDS-PAGE (Figure 1). After electrophoresis, first visualize the extent of labeling with a fluorescence imager (Typhoon 8600GE/Amersham), and then stain the gels with Coomassie blue R (Ames, 1974).
Fluorescence spectroscopic binding determinations
We observe fluorophore-labeled cells in an OLIS-SLM AMINCO 8100 fluorescence spectrometer, upgraded with an OLIS operating system and software (OLIS SpectralWorks, OLIS Inc., Bogart, GA), to control its shutters, polarizers, and data collection. We also utilize an OLIS Clarity fluorescence spectrometer, with the same operating software, for fluorescence assays. For binding determinations, deposit 2.5 × 10⁷ labeled cells in a quartz cuvette (final volume: 2 mL) with stirring at 37 °C, measure the initial fluorescence (F0), and then add increasing concentrations of a ligand, while monitoring the quenching of fluorescence emissions (F) at 520 nm.
Grow sensor strains to maximize Cys-mutant OMP expression, or purify soluble Cys-mutant binding proteins.
For bacteria, determine cell density from absorbance at 600 nm; for purified proteins, determine the concentration from absorbance at 280 nm.
Pellet bacterial cells by centrifugation at 7,500 × g for 15 min and resuspend in the same volume of 50 mM NaHPO4, pH 6.7. Repeat. For soluble binding proteins, dialyze the solution of purified protein (1–5 mg/mL) overnight, using appropriate molecular weight–cutoff tubing or membrane, against 50 mM NaHPO4, pH 6.7.
Dissolve ~1 mg of FM in 0.5 mL of anhydrous DMF or DMSO; determine [FM] by measuring the absorbance of a 1/100 dilution at 488 nm in 10 mM Tris-Cl, pH 8 (ϵmM = 8.1).
Expose bacterial cells or purified proteins to 5 μM FM (or other maleimide fluorophore) in 50 mM NaHPO4, pH 6.7, at 37 °C for 15 min, and quench the reaction with 140 μM β-mercaptoethanol.
Pellet bacterial cells by centrifugation at 7,500 × g for 15 min and resuspend in the same volume of PBS. Repeat the centrifugation and resuspend the cells in PBS at ~109/mL; dialyze fluoresceinated soluble binding proteins against PBS overnight, to remove excess fluorophore.
Assess the efficacy of covalent modification by diluting aliquots of fluoresceinated cells or proteins in PBS in a fluorometer; analyze with excitation at 488 nm and emission at 520 nm. Calculate the specific fluorescence of the samples (fluorescence intensity/109 cells or /mg protein).
Measure the extent of fluorescence quenching by natural ligands.
Use, store on ice (up to 24 h), or preserve at -70 °C in 10% glycerol.
Data analysis
For fluorescence spectroscopic measurements of sensor-ligand quenching, perform each measurement in triplicate, and calculate the mean value of F/F0 at each ligand concentration (Figure 1). For analysis and curve-fitting of fluorescence quenching data, plot 1-F/F0 vs. [ligand] and analyze the data by a 1-site binding model, using Grafit 6.0.12 (Erithacus Ltd. West Sussex, UK), or Enzfitter (Biosoft, Cambridge, UK), that fit data to a single site saturation curve, where the amount of ligand bound is plotted as a function of the amount free:  . These plots yield KD values of for each receptor-ligand interactions, with associated standard errors.
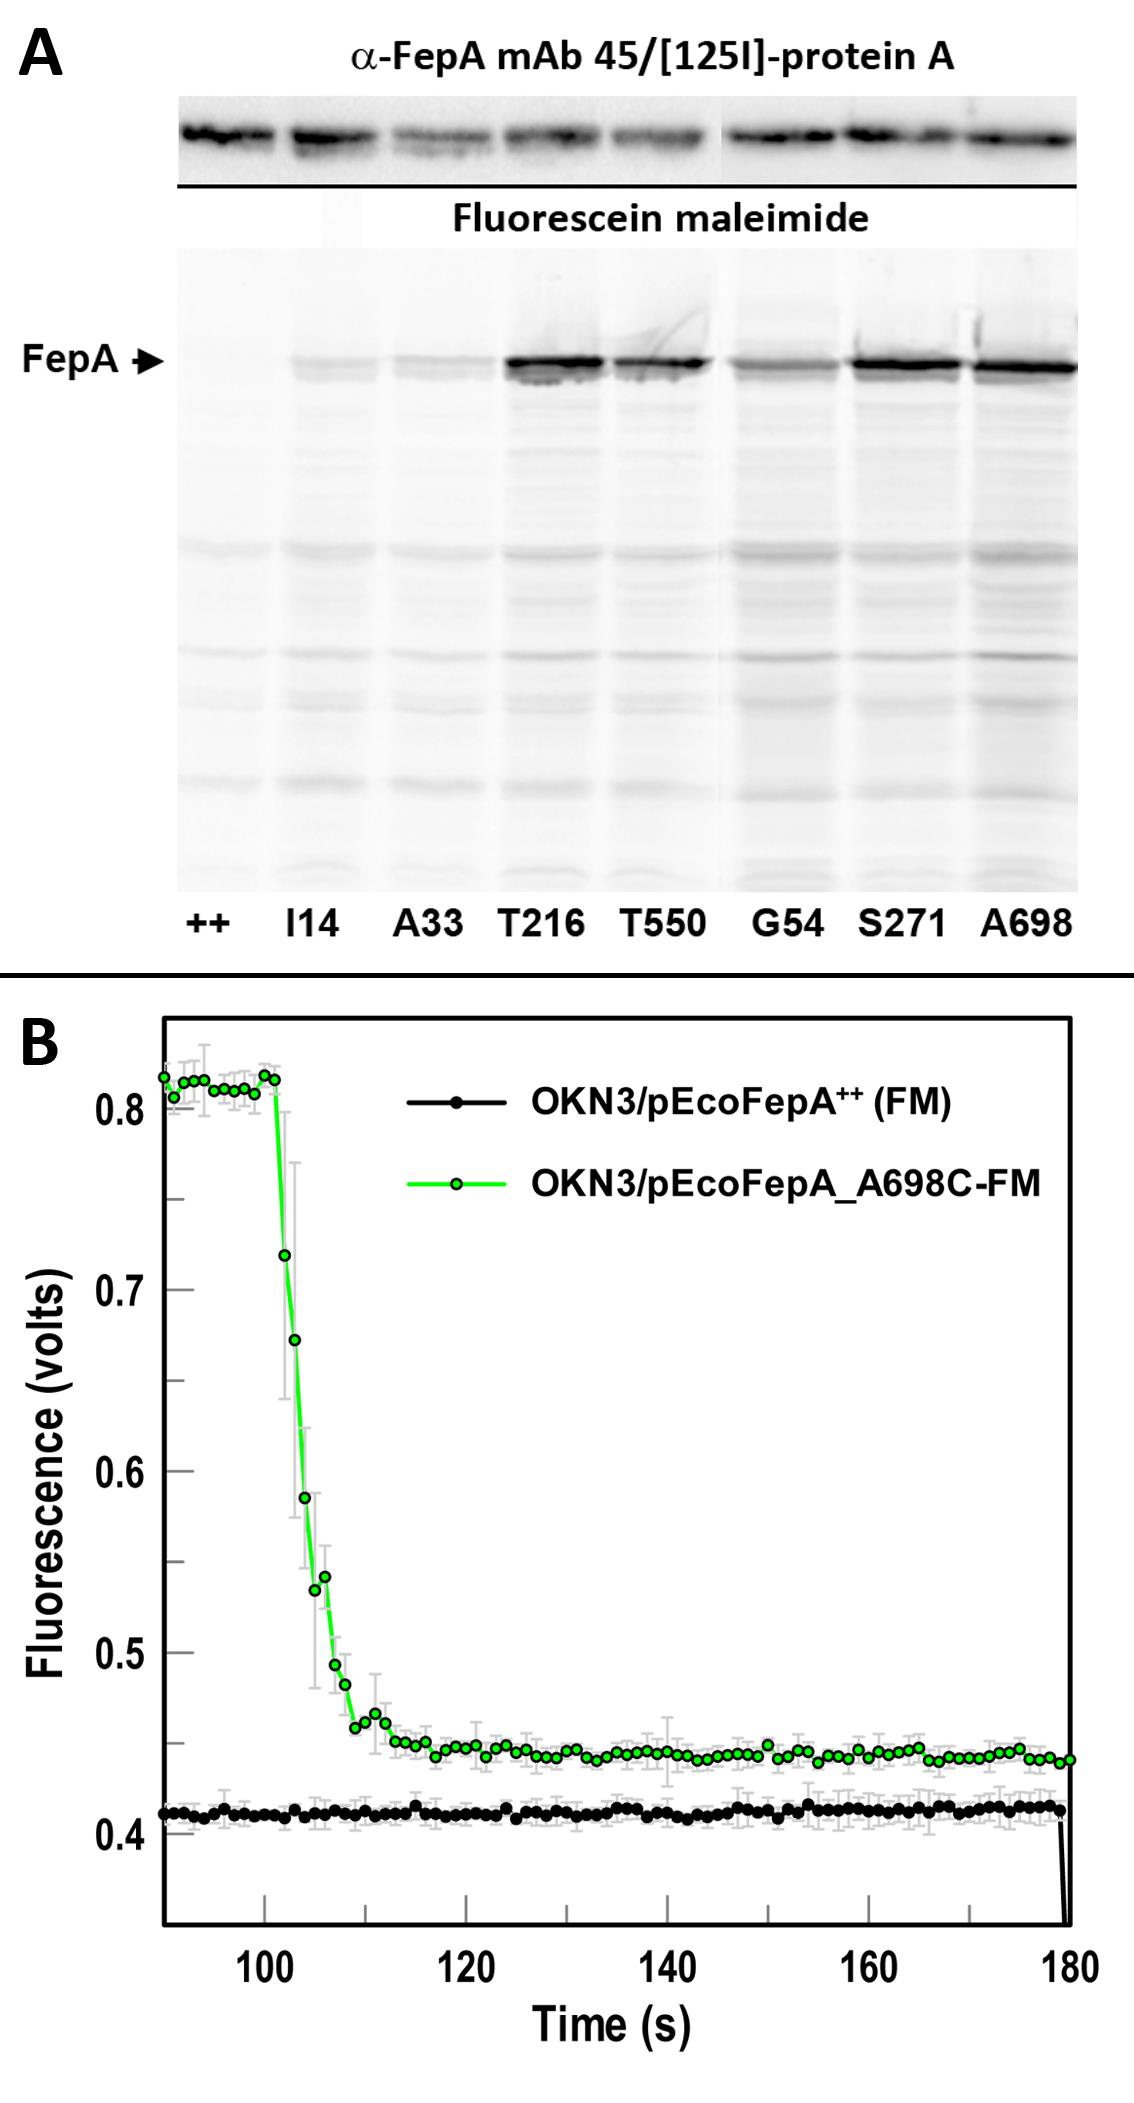
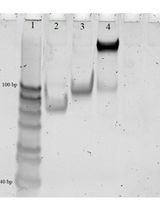
Figure 1. Representative data. A. Fluorescent labeling of Cys substitutions in E. coli FepA. Wild-type (++) EcoFepA and its seven Cys mutants were grown in MOPS media and labeled with 5 µM FM in 50 mM NaHPO4, pH 6.7, at 37 °C for 15 min. Cell lysates were resolved by SDS-PAGE (Ames, 1974), and the gel was scanned for fluorescence at 520 nm on a Typhoon imager. FM did not react with wild-type FepA, but it labeled the Cys mutants to different extents. The gel proteins were transferred to nitrocellulose and probed with α-FepA mAb 45 (Murphy et al., 1990)/[125I]-protein A to monitor expression. Certain mutants (T216C, S271C, A698C) were stoichiometrically labeled by FM. B. Analysis of fluorescence quenching during FeEnt binding to EcoFepA-A698C-FM. Cells [OKN3 (∆fepA) (Ma et al., 2007)] producing EcoFepA or its mutant A698C were exposed to FM, washed, and assayed in an OLIS/SLM-Aminco 8100 fluorometer, with excitation at 488 nm and emission at 520 nm. EcoFepA_A698C-FM showed intense fluorescence, which was quenched when 10 nM FeEnt was added at 100 s. Data points are the means of triplicate measurements; grey error bars represent the associated standard deviations of means.
Notes
Host bacteria
OM proteins from many Gram-negative bacteria, including E. coli, K. pneumoniae (Kumar et al., 2022), Acinetobacter baumannii (Nairn et al., 2017), Caulobacteri crescentus (Balhesteros et al., 2017) and more, are susceptible to FM labeling in situ, in the cell envelopes of those living cells. However, the cell surface of laboratory E. coli is a preferred environment for expression and labeling of both native and foreign OM proteins, because it is not obscured by an LPS O-antigen nor capsular polysaccharide. Hence, we perform most labeling reactions in laboratory E. coli host strains.
Protein expression
It is advisable to adopt a cloning/expression strategy that maximizes production of the target OM protein. We use iron-regulated Fur promoters in conjunction with iron-deficient MOPS media, to maximize the expression of foreign proteins in E. coli. However, other promoters (e.g., lac or tac) are equally effective.
Media for bacterial growth and target protein expression
As a result of the iron-regulated promoters in our experiments, we utilize MOPS minimal media, that is a complete minimal media for Enterobacteriaceae (Neidhardt et al., 1974), and readily rendered iron-deficient by excluding FeSO4 and tricine from its formulation. We have no experience with the chemical modification of cells grown in other defined media or broths, but we anticipate that regardless of growth media, preliminary washing with 50 mM NaHPO4, pH 6.7, will lead to efficacious maleimide labeling reactions.
Recipes
Iron-deficient MOPS Minimal Medium (Neidhardt et al., 1974)
10× MOPS concentrate
The following recipe is for 1 L of 10× concentrate:
MOPS 83.7 g
NH4Cl 5.1 g
K2SO4 0.48 g
CaCl2 0.56 mg
MgCl2·6H2O 1.07 g
NaCl 29.25 g
Add MOPS to about 800 mL of double distilled H2O. Adjust pH to 7.4 with KOH pellets (~14 g), add the other components, bring the volume to 1 L, and pass through a 0.2 μm filter.
DO NOT AUTOCLAVE.
1,000× Micronutrient solution
The amounts are for 100 mL of 1,000× micronutrient solution.
(NH4)6Mo7O24·4H2O 37 mg
CoCl2·6H2O 71 mg
HBO3 250 mg
CuSO4·5H2O 25 mg
MnCl2 160 mg
ZnCl2 13.6 mg
Pass through a 0.2 μm filter. DO NOT AUTOCLAVE. Dilute 1:1,000 into final media.
1,000× KH2PO4 solution
30 g in 100 mL. Dilute 1:1,000 into the final media.
To prepare the final media
Add 1 mL of KH2PO4 solution to 900 mL of double-distilled H2O in an iron-free flask, and autoclave. Add 100 mL of filter-sterilized 10× MOPS concentrate and 1 mL of filter-sterilized 1,000× micronutrient solution. Before inoculation, add a carbon source (e.g., 0.4% glucose), amino acids, and vitamins for auxotrophic markers, and appropriate antibiotics.
Iron-free glassware
To remove adventitious iron from glassware, fill the flasks or bottles with 0.1 N HCl, soak overnight at room temperature, and thoroughly rinse with distilled water.
50 mM sodium phosphate, pH 6.7
6.9 g Sodium dihydrogen phosphate monohydrate (NaH2PO4·H2O) in 1 L of distilled water.
Adjust pH to 6.7 with 1 M NaOH.
Phosphate-buffered saline
Dissolve the following in 1 L distilled water:
NaCl 8 g
KCl 0.2 g
Na2HPO4 1.44 g
KH2PO4 0.24 g
Acknowledgments
This research was supported by National Institutes of Health grants GM53836 and R21AI115187, and National Science Foundation grant MCB0952299 to P.E. Klebba and S.M.C. Newton. The authors thank the many undergraduate students, graduate students, and postdoctoral researchers who successfully applied these procedures in their experiments. The original research articles from which these methodologies derived are: Cao et al. (2003), Chakravorty et al. (2019), Hanson et al. (2016), Kumar et al. (2022), Ma et al. (2007), Nairn et al. (2017), Payne et al. (1997), and Smallwood et al. (2009, 2014).
Competing interests
The authors declare no competing financial interests. These procedures are included in part or whole in U.S. Patent No.: US 10,604,782 B2, and US Patent Application No.: US 2021/0263014 A1.
Ethics
The procedures reported herein do not involve human or animal subjects.
References
- Altenbach, C., Flitsch, S. L., Khorana, H. G. and Hubbell, W. L. (1989). Structural studies on transmembrane proteins. 2. Spin labeling of bacteriorhodopsin mutants at unique cysteines. Biochemistry 28(19): 7806-7812.
- Altenbach, C., Marti, T., Khorana, H. G. and Hubbell, W. L. (1990). Transmembrane protein structure: spin labeling of bacteriorhodopsin mutants. Science 248(4959): 1088-1092.
- Ames, G. F. (1974). Resolution of bacterial proteins by polyacrylamide gel electrophoresis on slabs. Membrane, soluble, and periplasmic fractions. J Biol Chem 249(2): 634-644.
- Balhesteros, H., Shipelskiy, Y., Long, N. J., Majumdar, A., Katz, B. B., Santos, N. M., Leaden, L., Newton, S. M., Marques, M. V. and Klebba, P. E. (2017). TonB-Dependent Heme/Hemoglobin Utilization by Caulobacter crescentus HutA. J Bacteriol 199(6): e00723-16.
- Buchanan, S. K., Smith, B. S., Venkatramani, L., Xia, D., Esser, L., Palnitkar, M., Chakraborty, R., van der Helm, D. and Deisenhofer, J. (1999). Crystal structure of the outer membrane active transporter FepA from Escherichia coli. Nat Struct Biol 6(1): 56-63.
- Cao, Z., Warfel, P., Newton, S. M. and Klebba, P. E. (2003). Spectroscopic observations of ferric enterobactin transport. J Biol Chem 278(2): 1022-1028.
- Chakravorty, S., Shipelskiy, Y., Kumar, A., Majumdar, A., Yang, T., Nairn, B. L., Newton, S. M. and Klebba, P. E. (2019). Universal fluorescent sensors of high-affinity iron transport, applied to ESKAPE pathogens. J Biol Chem 294(12): 4682-4692.
- Ginalski, K. (2006). Comparative modeling for protein structure prediction. Curr Opin Struct Biol 16(2): 172-177.
- Hanson, M., Jordan, L. D., Shipelskiy, Y., Newton, S. M. and Klebba, P. E. (2016). High-Throughput Screening Assay for Inhibitors of TonB-Dependent Iron Transport. J Biomol Screen 21(3): 316-322.
- Kumar, A., Yang, T., Chakravorty, S., Majumdar, A., Nairn, B. L., Six, D. A., Marcondes Dos Santos, N., Price, S. L., Lawrenz, M. B., Actis, L. A., et al. (2022). Fluorescent sensors of siderophores produced by bacterial pathogens. J Biol Chem 298(3): 101651.
- Ma, L., Kaserer, W., Annamalai, R., Scott, D. C., Jin, B., Jiang, X., Xiao, Q., Maymani, H., Massis, L. M., Ferreira, L. C., et al. (2007). Evidence of ball-and-chain transport of ferric enterobactin through FepA. J Biol Chem 282(1): 397-406.
- Means, G. E. and Feeney, R. E. (1971). Chemical Modification of Proteins. Holden-Day, Inc., San Francisco, CA.
- Murphy, C. K., Kalve, V. I. and Klebba, P. E. (1990). Surface topology of the Escherichia coli K-12 ferric enterobactin receptor. J Bacteriol 172(5): 2736-2746.
- Nairn, B. L., Eliasson, O. S., Hyder, D. R., Long, N. J., Majumdar, A., Chakravorty, S., McDonald, P., Roy, A., Newton, S. M. and Klebba, P. E. (2017). Fluorescence High-Throughput Screening for Inhibitors of TonB Action. J Bacteriol 199(10): e00889-16.
- Neidhardt, F. C., Bloch, P. L. and Smith, D. F. (1974). Culture medium for enterobacteria. J Bacteriol 119(3): 736-747.
- Nie, Y., Ermolova, N. and Kaback, H. R. (2007). Site-directed alkylation of LacY: effect of the proton electrochemical gradient. J Mol Biol 374(2): 356-364.
- Nikaido, H. (2003). Molecular basis of bacterial outer membrane permeability revisited. Microbiol Mol Biol Rev 67(4): 593-656.
- Nikaido, H. and Vaara, M. (1985). Molecular basis of bacterial outer membrane permeability. Microbiol Rev 49(1): 1-32.
- Payne, M. A., Igo, J. D., Cao, Z., Foster, S. B., Newton, S. M. and Klebba, P. E. (1997). Biphasic binding kinetics between FepA and its ligands. J Biol Chem 272: 21950-21955.
- Scott, D. C. (2000). Mechanism of ferric enterobactin transport through Escherichia coli FepA: evolution of a bacterial venus fly trap, Department of Chemistry & Biochemistry. University of Oklahoma, Norman.
- Scott, D. C., Cao, Z., Qi, Z., Bauler, M., Igo, J. D., Newton, S. M. and Klebba, P. E. (2001). Exchangeability of N termini in the ligand-gated porins of Escherichia coli. J Biol Chem 276(16): 13025-13033.
- Smallwood, C. R., Jordan, L., Trinh, V., Schuerch, D. W., Gala, A., Hanson, M., Shipelskiy, Y., Majumdar, A., Newton, S. M. and Klebba, P. E. (2014). Concerted loop motion triggers induced fit of FepA to ferric enterobactin. J Gen Physiol 144(1): 71-80.
- Smallwood, C. R., Marco, A. G., Xiao, Q., Trinh, V., Newton, S. M. and Klebba, P. E. (2009). Fluoresceination of FepA during colicin B killing: effects of temperature, toxin and TonB. Mol Microbiol 72(5): 1171-1180.
- Smirnova, I. N., Kasho, V. and Kaback, H. R. (2008). Protonation and sugar binding to LacY. Proc Natl Acad Sci U S A 105(26): 8896-8901.
- Stokes-Rees, I. and Sliz, P. (2010). Protein structure determination by exhaustive search of Protein Data Bank derived databases. Proc Natl Acad Sci U S A 107(50): 21476-21481.
- Takeshita, S., Sato, M., Toba, M., Masahashi, W. and Hashimoto-Gotoh, T. (1987). High-copy-number and low-copy-number plasmid vectors for lacZ alpha-complementation and chloramphenicol- or kanamycin-resistance selection. Gene 61(1): 63-74.
- Neidhardt, F. C., Bloch, P. L. and Smith, D. F. (1974). Culture medium for enterobacteria. J Bacteriol 119(3): 736-747.
- Pettersen, E. F., Goddard, T. D., Huang, C. C., Couch, G. S., Greenblatt, D. M., Meng, E. C. and Ferrin, T. E. (2004). UCSF Chimera--a visualization system for exploratory research and analysis. J Comput Chem 25(13): 1605-1612.
Article Information
Copyright
© 2022 The Authors; exclusive licensee Bio-protocol LLC.
How to cite
Readers should cite both the Bio-protocol article and the original research article where this protocol was used:
- Newton, S. M. and Klebba, P. E. (2022). Fluorescent Binding Protein Sensors for Detection and Quantification of Biochemicals, Metabolites, and Natural Products. Bio-protocol 12(22): e4543. DOI: 10.21769/BioProtoc.4543.
- Kumar, A., Yang, T., Chakravorty, S., Majumdar, A., Nairn, B. L., Six, D. A., Marcondes Dos Santos, N., Price, S. L., Lawrenz, M. B., Actis, L. A., et al. (2022). Fluorescent sensors of siderophores produced by bacterial pathogens. J Biol Chem 298(3): 101651.
Category
Microbiology > Pathogen detection > Biosensor
Molecular Biology > Protein > Activity
Do you have any questions about this protocol?
Post your question to gather feedback from the community. We will also invite the authors of this article to respond.