- Protocols

- Articles and Issues
- For Authors
- About
- Become a Reviewer

Motion-capture Analysis of Mice Using a Video Recorded on an iPhone Camera
Published: Vol 12, Iss 21, Nov 5, 2022 DOI: 10.21769/BioProtoc.4539 Views: 1859
Reviewed by: Julie WeidnerHSIU CHUN CHUANGJordi Boix-i-Coll
Original research article
The authors used this protocol in:

Jun 2022
Advertisement


Protocol Collections
Comprehensive collections of detailed, peer-reviewed protocols focusing on specific topics


Abstract
When focusing on quick movements in the analysis of animal behavior, a high-speed camera can be used as a powerful tool. There are many options for high-speed cameras to record movement. In recent years, the quality and sophistication of videos captured on cell phones have evolved so much that the iPhone’s slow-motion video system can function as a tool for behavior analysis. Here, we describe a method to analyze the movement of the ankle joint and jump speed during the jumping action of mice, using an iPhone.
Keywords: MouseBackground
Behavioral analysis is commonly performed in animals (Hart et al., 2009; Charles et al., 2016), and some studies have conducted gait analysis in mice, focusing on ankle motion for musculoskeletal research (Iwata et al., 2010; Suzuki et al., 2016; Suzuki et al., 2021). A camera is essential for this kind of analysis, and a high-speed camera is specifically useful for capturing quick movements (Iwata et al., 2010; Druelle et al., 2019; Pfeffer et al., 2019). Preparatory behavior just before a jump affects the jumping performance of animals, and analyzing the former is important for evaluating the latter (Bosco et al., 1982; Komi, 1984; Bosco et al., 1987; Bobbert and Casius, 2005). iPhone, a popular cell phone, has a high-speed camera mode (slow-motion video support). This mode can function as a tool for behavior analysis (Pittman and Ichikawa, 2013). In this protocol, we have introduced a method to evaluate the mouse jumping motion using an iPhone.
Materials and Reagents
Laboratory-bred mice
Note: Both male and female mice were used for the test. The conditions described in this study (bar size and distance from the camera to bar) were suitable for over 12-week-old mice. Mice were housed in groups of 3–5 per cage and kept in a room with controlled temperature (~23 °C) and humidity (50–60%) under a 12-h light/dark cycle (lights on at 8:30 AM) with ad libitum access to food and water.
Equipment
iPhone 8 (MQ842J/A, Apple)
Notes:
Slow-motion video support for 1,080 pixel at 120 or 240 frames per second (fps), video stabilization, and continuous autofocus video.
The 240 fps slow-motion video support is available on almost all iPhone 6 and later models; therefore, it can be applied to models other than the iPhone 8.
Tripod
Hair removal cream
Black marker pen
Steel jump bar with carbon plates
Note: Dimensions: H: 0.8 cm (0.4 cm + 0.4 cm) × W: 4.5 cm × L: 100 cm.
Plastic ruler
Anesthesia machine with sevoflurane
Note: This was used for a short time to mark the landmarks described below.
Software
Tracker (https://physlets.org/tracker/)
ImageJ software (https://imagej.nih.gov/ij/)
Microsoft Excel (Microsoft)
Procedure
Note: This analysis was conducted to evaluate the jumping motion of mice. The mice were subjected to a training session. Five minutes before the beginning of the session, the mice were placed in the landing place (cage) for habituation. Then, at the beginning of the training session, the beam was placed in such a way that it touched the cage, and the mice were placed on the beam such that they could simply walk into the cage. After three successful entries at each distance, the beam was slowly moved further away from the cage in 5-cm increments. Through this process, mice could jump straight from the bar to the landing space (Video 1). The method for this long jump test has been described previously (Mittal et al., 2015).

This is an overview of the equipment setup. C57BL6J male mice jumped 35 cm from the bar into the landing space. For video camera analysis, the iPhone camera on the tripod was placed in front of the bar, as shown in Figure 1.
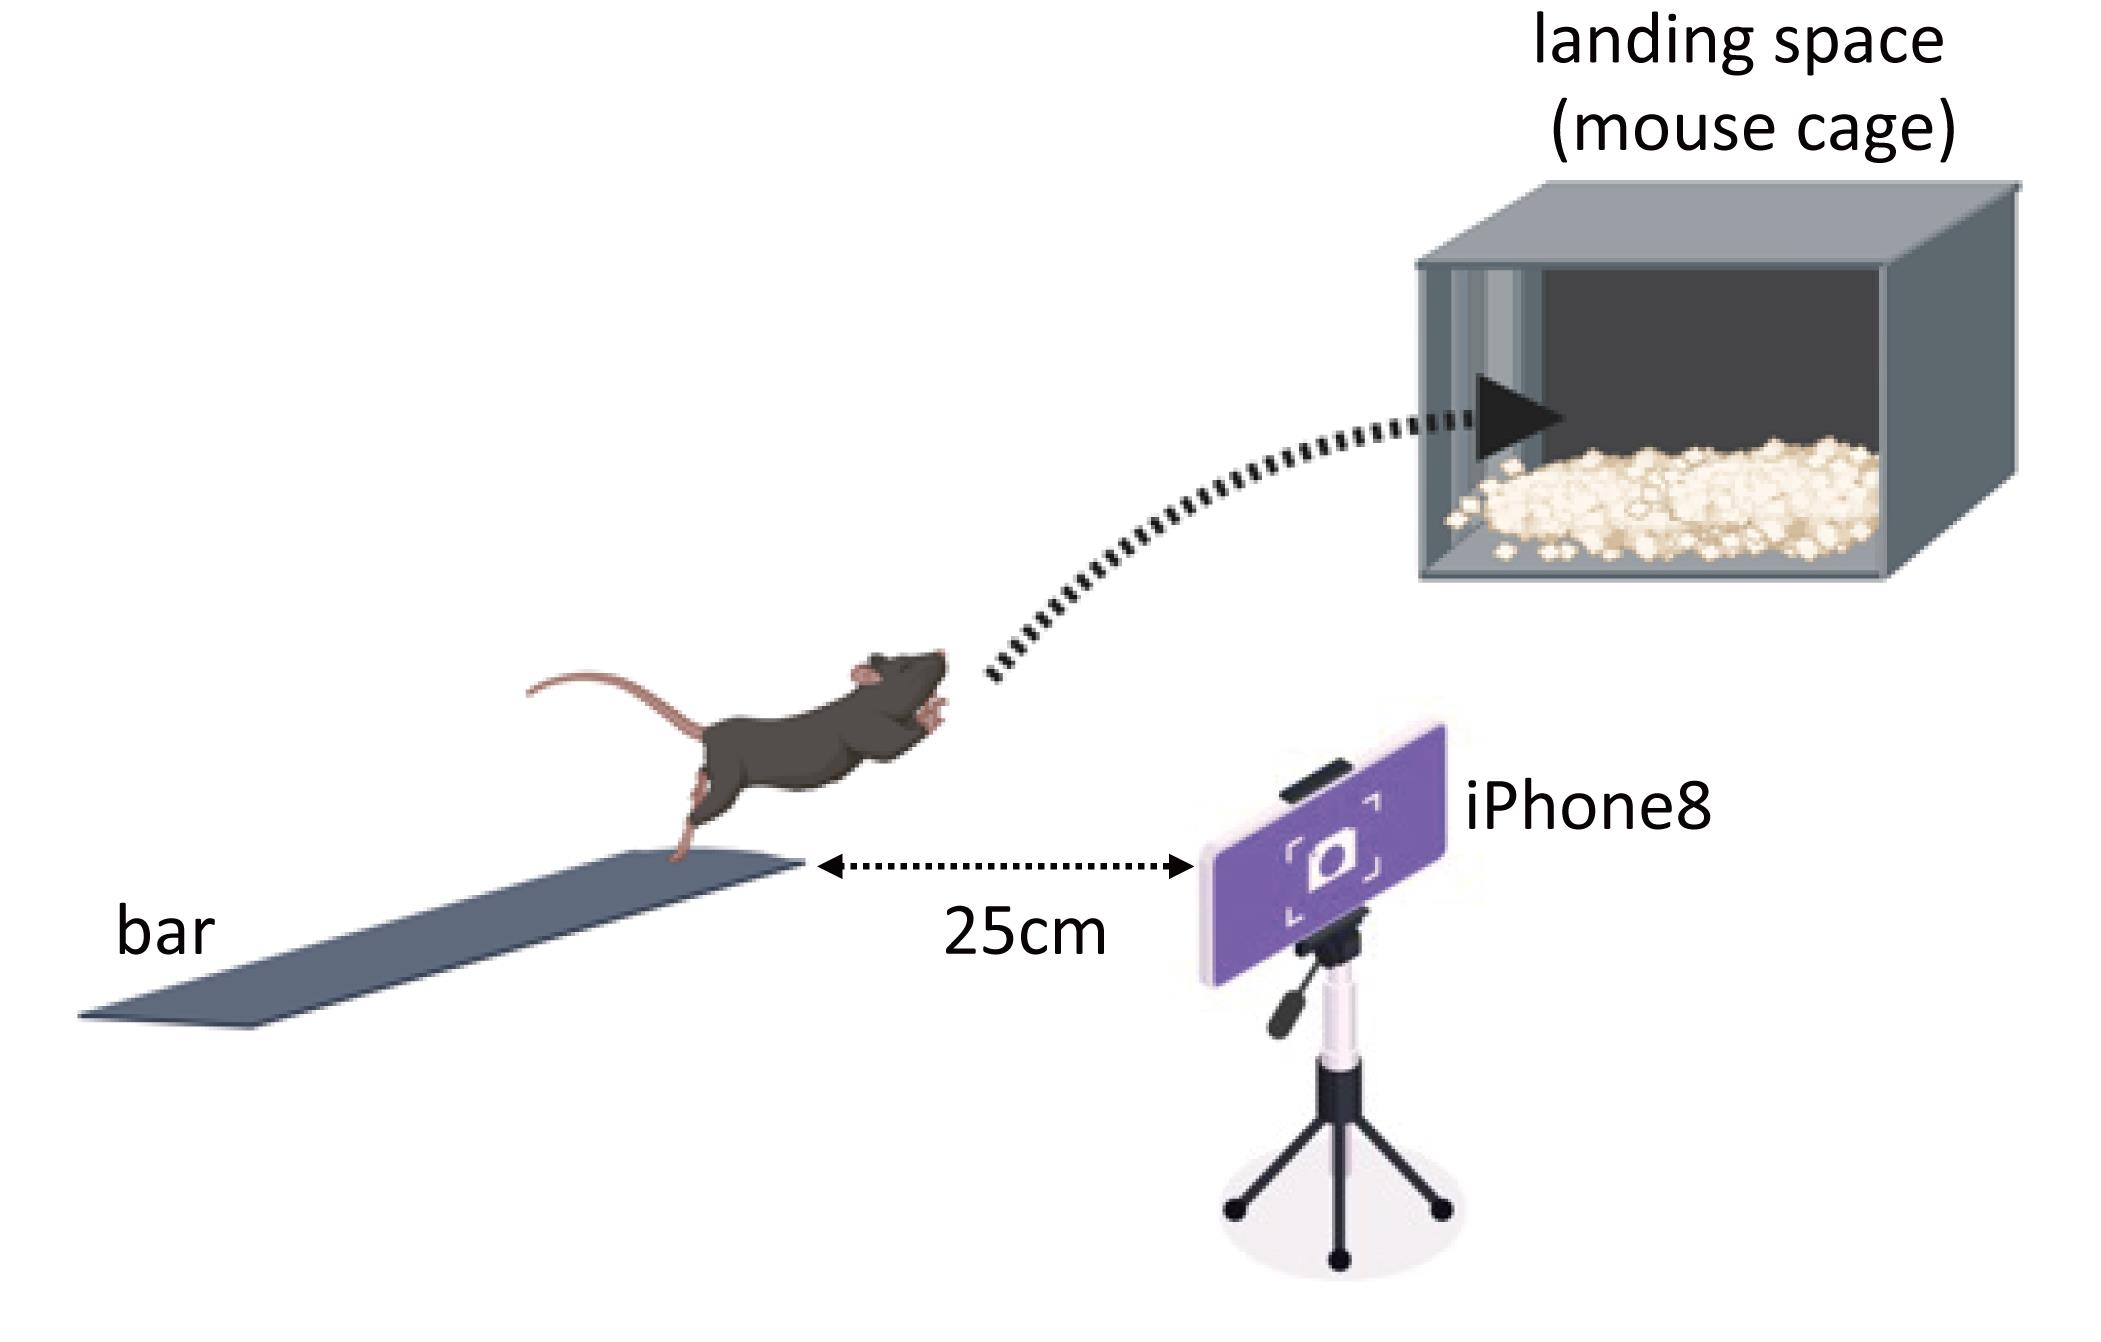
Figure 1. Schematic image of a video recorded using an iPhone camera (Created with BioRender.com)
Transport the mice from the breeding room to the laboratory in cages. Under anesthesia, shave the right hindlimbs of the mice using a hair removal cream, to analyze the motion of the ankle joint. Mark three anatomical landmarks (the lower third of the tibia, fibula epiphysis, and fifth metatarsal head) with a black ink marker (Charles et al., 2016) (Figure 2). After this procedure, rest mice for 1 h to remove the effects of anesthesia.
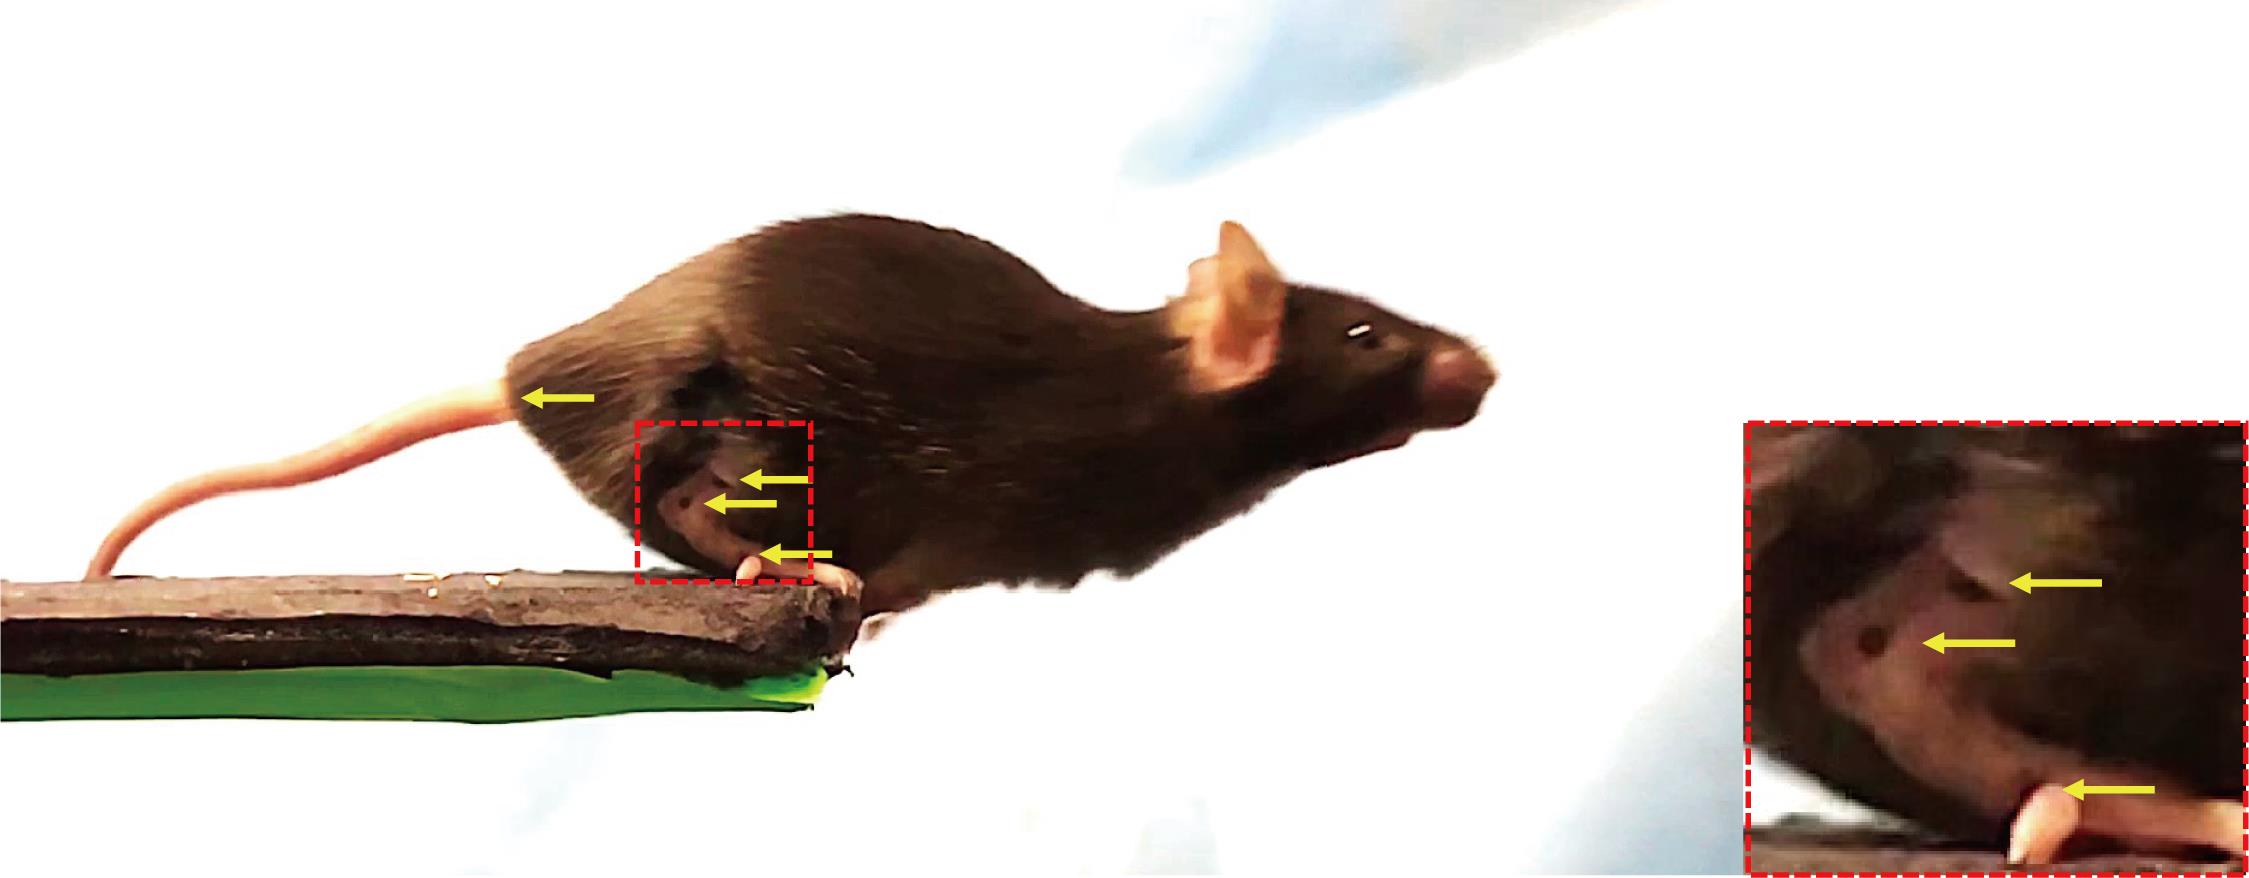
Figure 2. Representative image of a mouse jumping. Yellow arrows indicate the three ankle markers and tail ridge. The image on the right is an enlarged view of the hind limb (red dotted line).
Set up the jump bar 80 cm above the ground, and adjust the height of the camera vertically at the edge of the jump bar, such that the lens is at the same height as the jump bar. Adjust the distance between the jump bar and the camera, depending on the area to be photographed. For this analysis, we set the distance to 25 cm (Figure 2).
Set the iPhone to slow-motion video mode (Tap “setting” icon and select “General” → ”Camera” → 1080p/240 fps). Let the mice jump from the jump bar to the landing space (Figure 1) (Mittal et al., 2015). Jumping is performed three times. Film all jumps, allowing a 3-min interval between jumps.
Note: The movie is excluded from evaluation if the mouse did not jump in a straight line from the jump bar to the cage.
Data analysis
Analyze the recorded videos using the Tracker software. Use a reference length in the movie as the calibration scale
Note: The thickness of the carbon plate was 4 mm, which was used as the calibration scale.
Manually define the coordinate positions of the markers for each image. The tracker displays the X- and Y-values of the marked coordinate positions. Reflect this information onto an Excel file, and analyze the data (Figure 3).
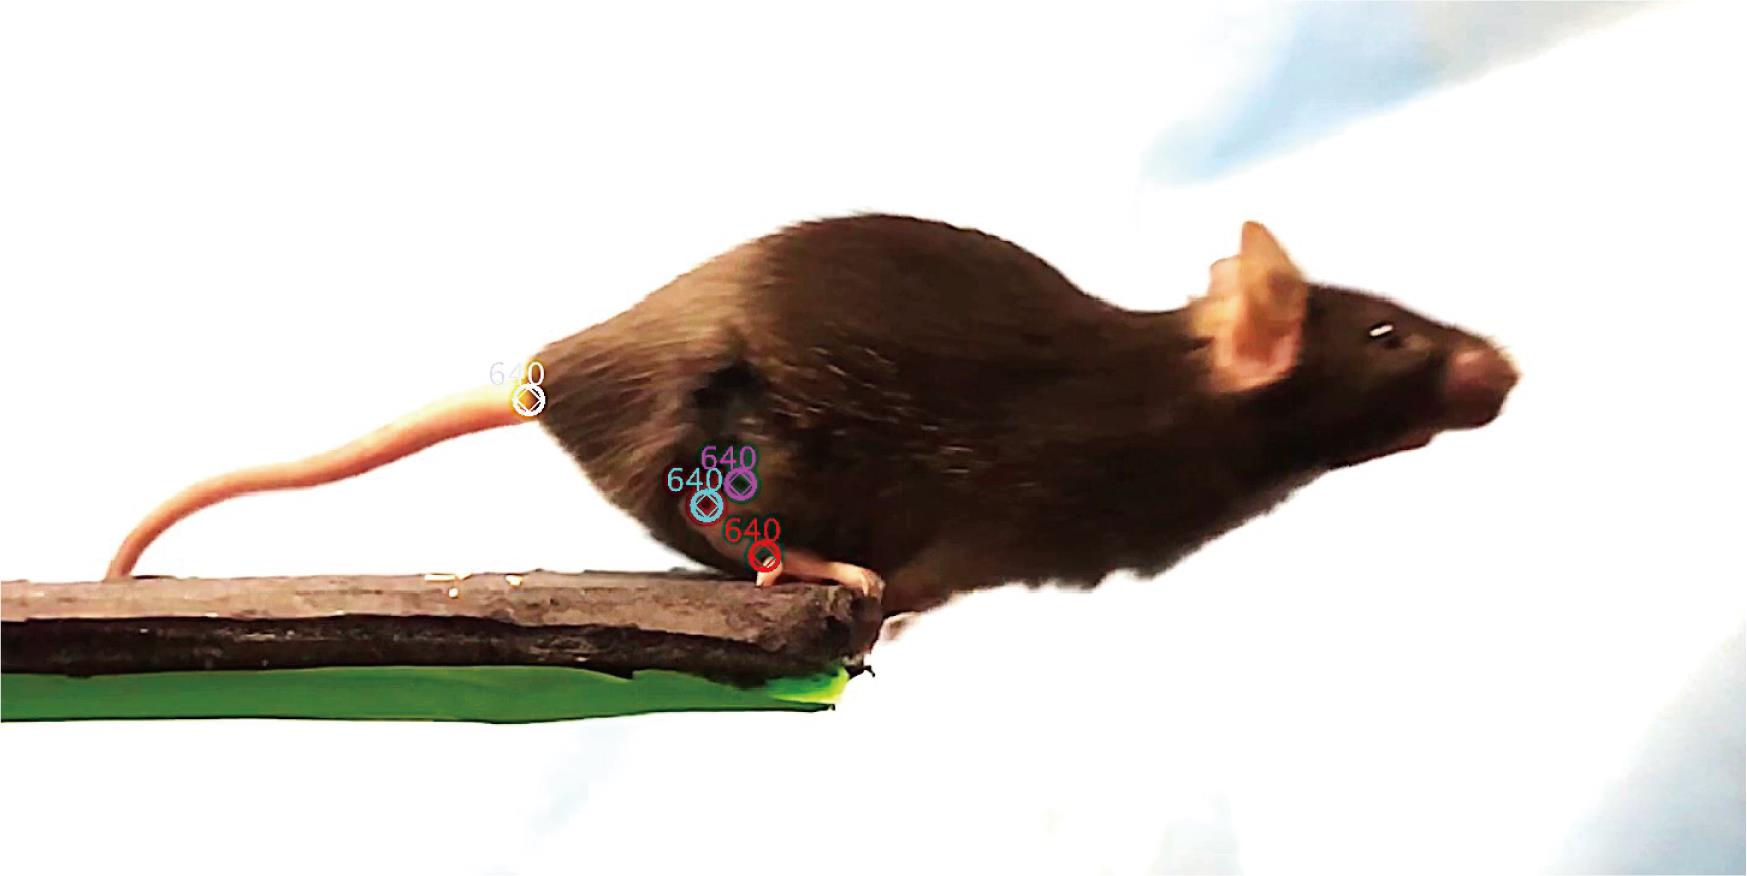
Figure 3. Representative image of marker identification. The red, blue, and purple points indicate the ankle markers. The white points indicate the tail ridge.Calculate the changes in the angle and angular velocity of the ankle joint, from the positional information of the three coordinates. Calculate the incident velocity and angle of incidence, based on the coordinates of the tail ridge and jump bar.
Analyze the centroid using ImageJ software by tracing the edge of the trunk and measuring the centroid to evaluate the change in potential energy (Figure 4). The tail is not included in the trace area, as the mice do not move their tails in the preparation phase.
Note: How to use ImageJ: Briefly, open “Set measurement” and set “Centroid,” then open “Analyze” and select “measure.”
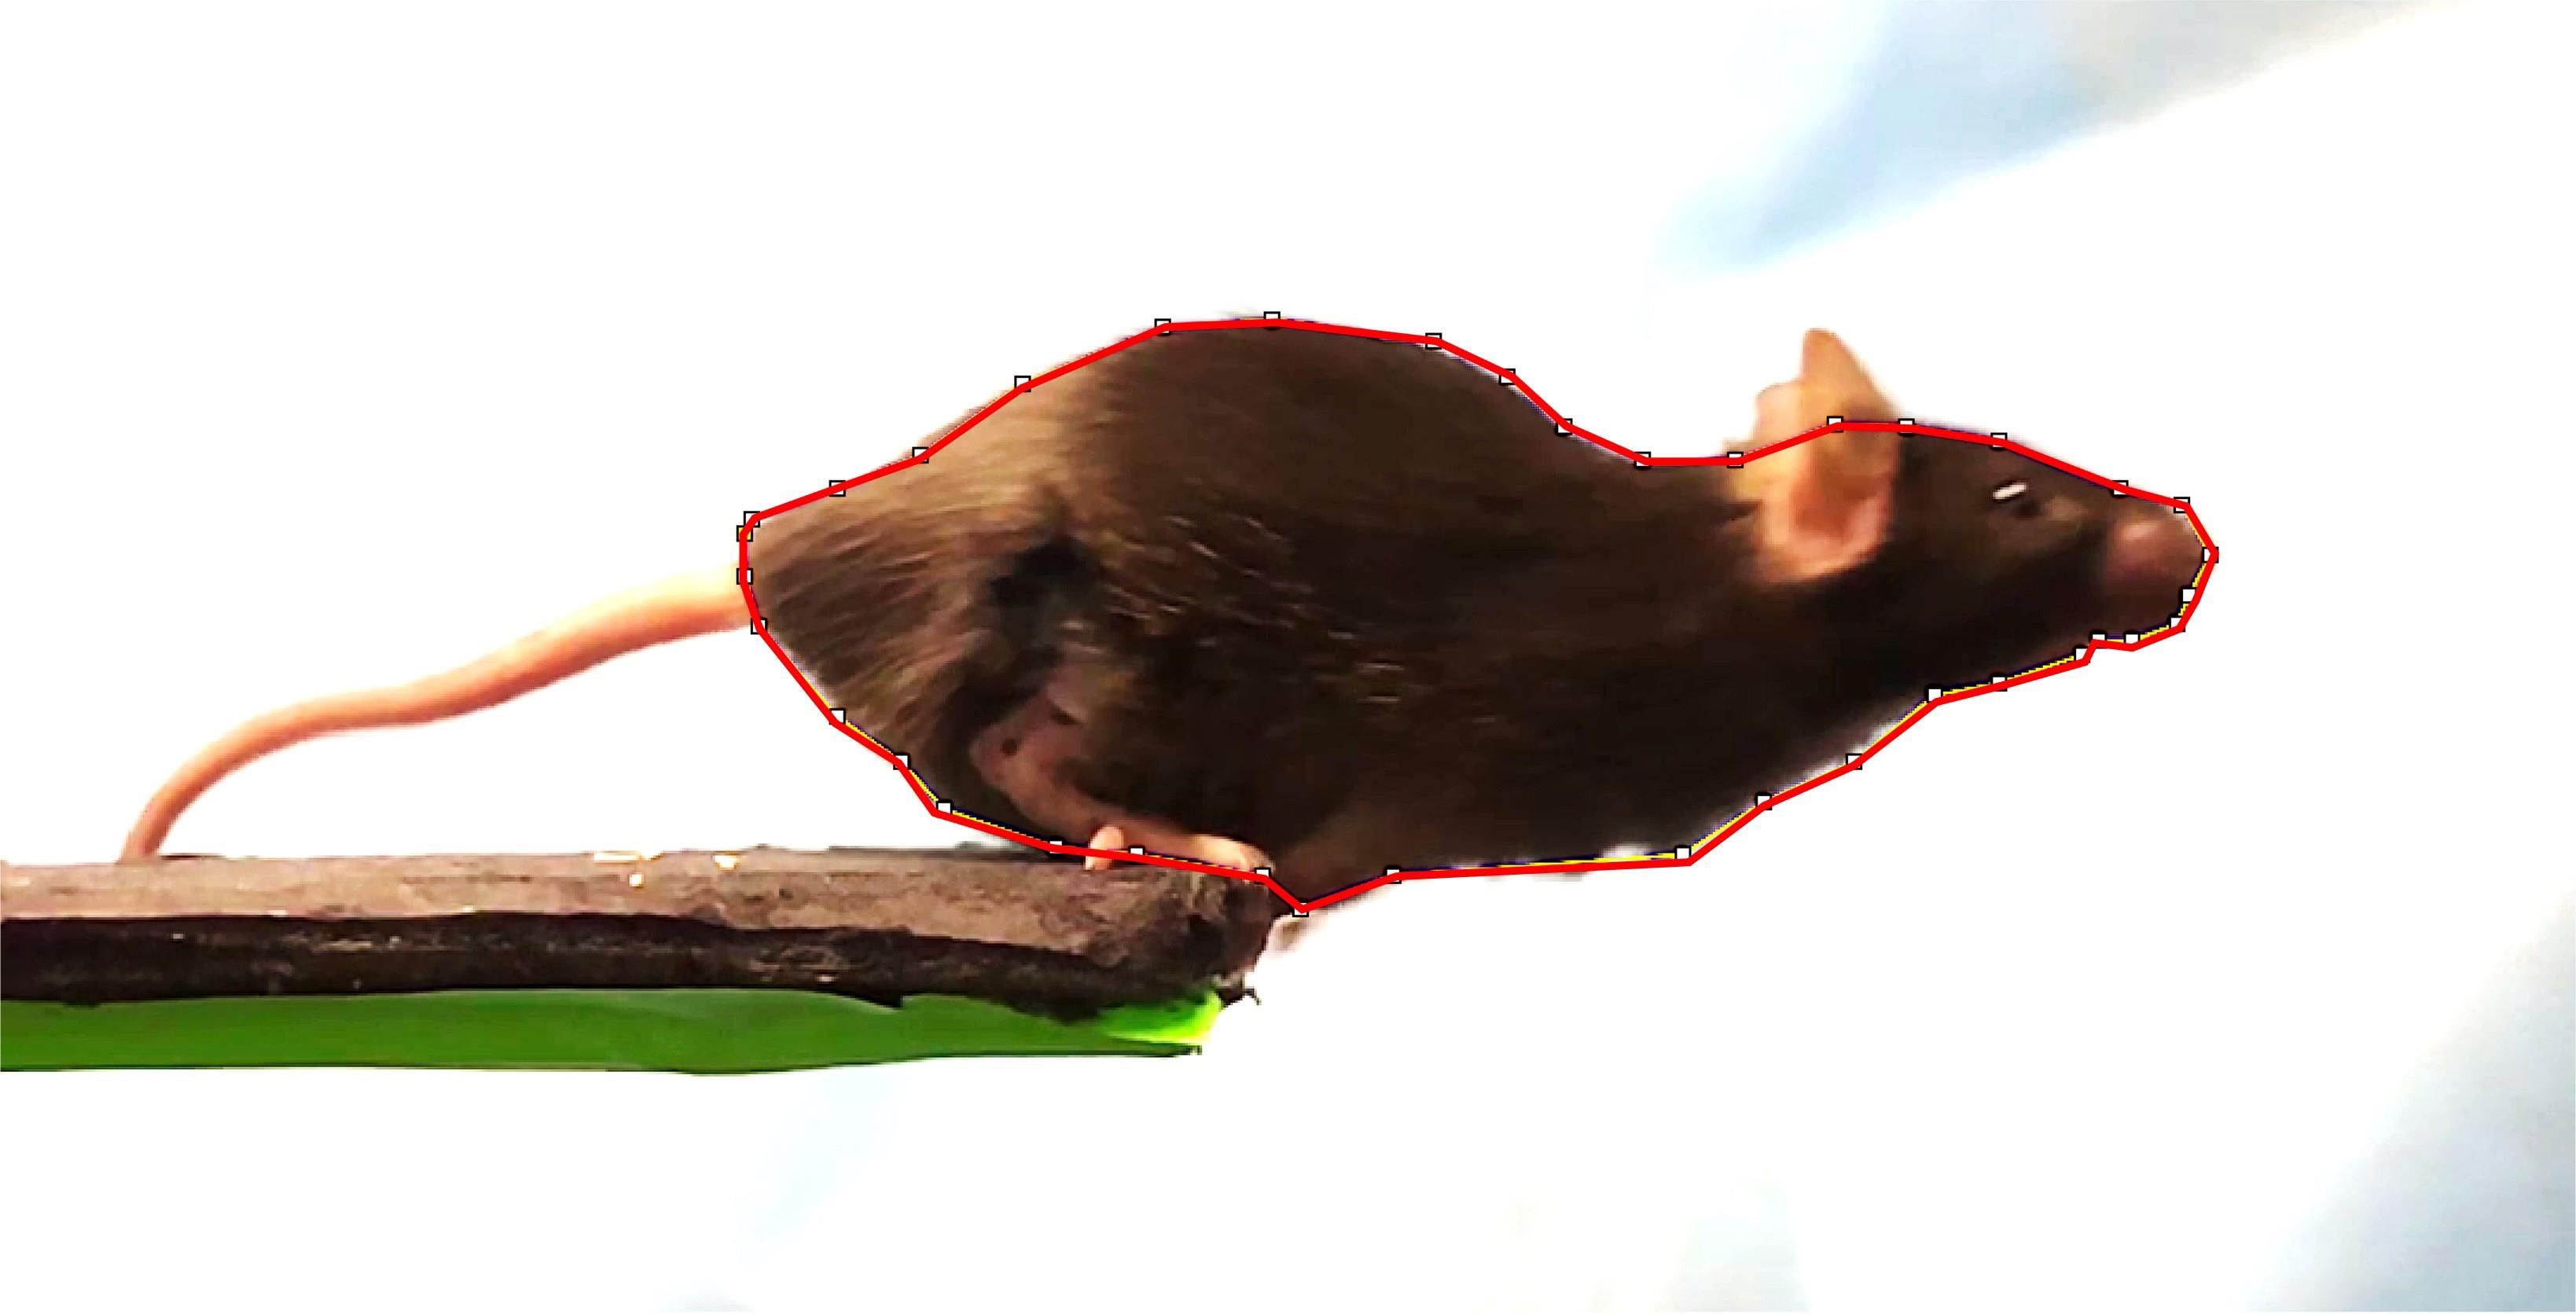
Figure 4. Representative image of centroid calculation. The red line indicates the traced edge of the trunk in the preparation phase.
Representative data
Based on the video analysis data, graph the variation of ankle joint angle over time (Figure 5), and calculate the changes in angular velocity.
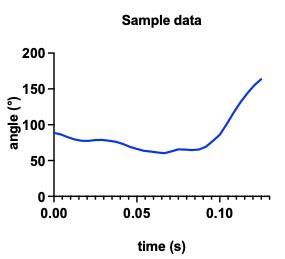
Figure 5. Represents the ankle angle of 12-week-old C57/BL6J mice. It shows the change in ankle angle from the preparation phase of jumping to the take-off.
Acknowledgments
This protocol was modified from that of previous studies (Iwata et al., 2010; Mittal et al., 2015). The project received financial support from AMED-CREST (Japan Agency for Medical Research and Development) (JP21gm0810008 to H.A.), JSPS KAKENHI (grant Nos. 20H05696 and 21K19403 to H.A.), and NIH (grant Nos. AR050631 and AR065379 to H.A.).
This protocol was performed in our original research paper (Nakamichi et al., 2022).
Competing interests
The authors declare that they have no competing interests.
Ethics
All animal experiments were performed with the approval of the Scripps Institutional Animal Care and Use Committee (protocol No. IACUC-09-0029).
References
- Bobbert, M. F., Casius, L. J. (2005). Is the effect of a countermovement on jump height due to active state development? Med Sci Sports Exerc 37(3): 440-6.
- Bosco, C., Montanari, G., Ribacchi, R., Giovenali, P., Latteri, F., Iachelli, G., Faina, M., Colli, R., Dal Monte, A., La Rosa, M., et al. (1987). Relationship between the efficiency of muscular work during jumping and the energetics of running. Eur J Appl Physiol Occup Physiol 56(2):138-43.
- Bosco, C., Viitasalo, J. T., Komi, P. V. and Luhtanen, P. (1982). Combined effect of elastic energy and myoelectrical potentiation during stretch-shortening cycle exercise. Acta Physiol Scand 114(4): 557-565.
- Charles, J. P., Cappellari, O., Spence, A. J., Hutchinson, J. R., Wells, D. J. (2016). Musculoskeletal Geometry, Muscle Architecture and Functional Specialisations of the Mouse Hindlimb. PLoS One 11(4): e0147669.
- Druelle, F., Goyens, J., Vasilopoulou-Kampitsi, M. and Aerts, P. (2019). Compliant legs enable lizards to maintain high running speeds on complex terrains. J Exp Biol 222(Pt 6): jeb195511.
- Hart, P. C., Bergner, C. L., Dufour, B. D., Smolinsky, A. N., Egan, R. J., et al. (2009). Analysis of Abnormal Repetitive Behaviors in Experimental Animal Models. Transl Neurosci 71-82.
- Hwang, S. H., Chang, E. H., Kwak, G., Jeon, H., Choi, B. O., Hong, Y. B. (2021). Gait parameters as tools for analyzing phenotypic alterations of a mouse model of Charcot-Marie-Tooth disease. Anim Cells Syst (Seoul) 25(1): 11-18.
- Iwata, A., Fuchioka, S., Hiraoka, K., Masuhara, M. and Kami, K. (2010). Characteristics of locomotion, muscle strength, and muscle tissue in regenerating rat skeletal muscles. Muscle Nerve 41(5): 694-701.
- Komi, P. V. (1984). Physiological and biomechanical correlates of muscle function: effects of muscle structure and stretch-shortening cycle on force and speed. Exerc Sport Sci Rev 12: 81-121.
- Mittal, N., Pan, J., Palmateer, J., Martin, L., Pandya, A., Kumar, S., Ofomata, A., Hurn, P. D., Schallert, T. (2015). So you think you can jump? A novel long jump assessment to detect deficits in stroked mice. J Neurosci Methods 256: 212-9.
- Nakamichi, R., Ma, S., Nonoyama, T., Chiba, T., Kurimoto, R., Ohzono, H., Olmer, M., Shukunami, C., Fuku, N., Wang, G., et al. (2022). The mechanosensitive ion channel PIEZO1 is expressed in tendons and regulates physical performance. Sci Transl Med 14(647): eabj5557.
- Pfeffer, S. E., Wahl, V. L., Wittlinger, M. and Wolf, H. (2019). High-speed locomotion in the Saharan silver ant, Cataglyphis bombycina. J Exp Biol 222(Pt 20): jeb198705.
- Pittman, J. T. and Ichikawa, K. M. (2013). iPhone® applications as versatile video tracking tools to analyze behavior in zebrafish (Danio rerio). Pharmacol Biochem Behav 106: 137-42.
- Suzuki, H., Ito, Y., Shinohara, M., Yamashita, S., Ichinose, S., Kishida, A., Oyaizu, T., Kayama, T., Nakamichi, R., Koda, N., et al. (2016). Gene targeting of the transcription factor Mohawk in rats causes heterotopic ossification of Achilles tendon via failed tenogenesis. Proc Natl Acad Sci U S A 113(28): 7840-7845.
Article Information
Copyright
© 2022 The Authors; exclusive licensee Bio-protocol LLC.
How to cite
Readers should cite both the Bio-protocol article and the original research article where this protocol was used:
- Nakamichi, R. and Asahara, H. (2022). Motion-capture Analysis of Mice Using a Video Recorded on an iPhone Camera. Bio-protocol 12(21): e4539. DOI: 10.21769/BioProtoc.4539.
- Nakamichi, R., Ma, S., Nonoyama, T., Chiba, T., Kurimoto, R., Ohzono, H., Olmer, M., Shukunami, C., Fuku, N., Wang, G., et al. (2022). The mechanosensitive ion channel PIEZO1 is expressed in tendons and regulates physical performance. Sci Transl Med 14(647): eabj5557.
Category
Mechanobiology
Do you have any questions about this protocol?
Post your question to gather feedback from the community. We will also invite the authors of this article to respond.