- Protocols

- Articles and Issues
- For Authors
- About
- Become a Reviewer

Measuring Intracellular H2O2 in Intact Human Cells Using the Genetically Encoded Fluorescent Sensor HyPer7
Published: Vol 12, Iss 20, Oct 20, 2022 DOI: 10.21769/BioProtoc.4538 Views: 3811
Reviewed by: David PaulVsevolod BelousovAnonymous reviewer(s)
Original research article
The authors used this protocol in:

Apr 2022


Protocol Collections
Comprehensive collections of detailed, peer-reviewed protocols focusing on specific topics


Abstract
Depending on its local concentration, hydrogen peroxide (H2O2) can serve as a cellular signaling molecule but can also cause damage to biomolecules. The levels of H2O2 are influenced by the activity of its generator sites, local antioxidative systems, and the metabolic state of the cell. To study and understand the role of H2O2 in cellular signaling, it is crucial to assess its dynamics with high spatiotemporal resolution. Measuring these subcellular H2O2 dynamics has been challenging. However, with the introduction of the super sensitive pH-independent genetically encoded fluorescent H2O2 sensor HyPer7, many limitations of previous measurement approaches could be overcome. Here, we describe a method to measure local H2O2 dynamics in intact human cells, utilizing the HyPer7 sensor in combination with a microscopic multi-mode microplate reader.
Graphical abstract:
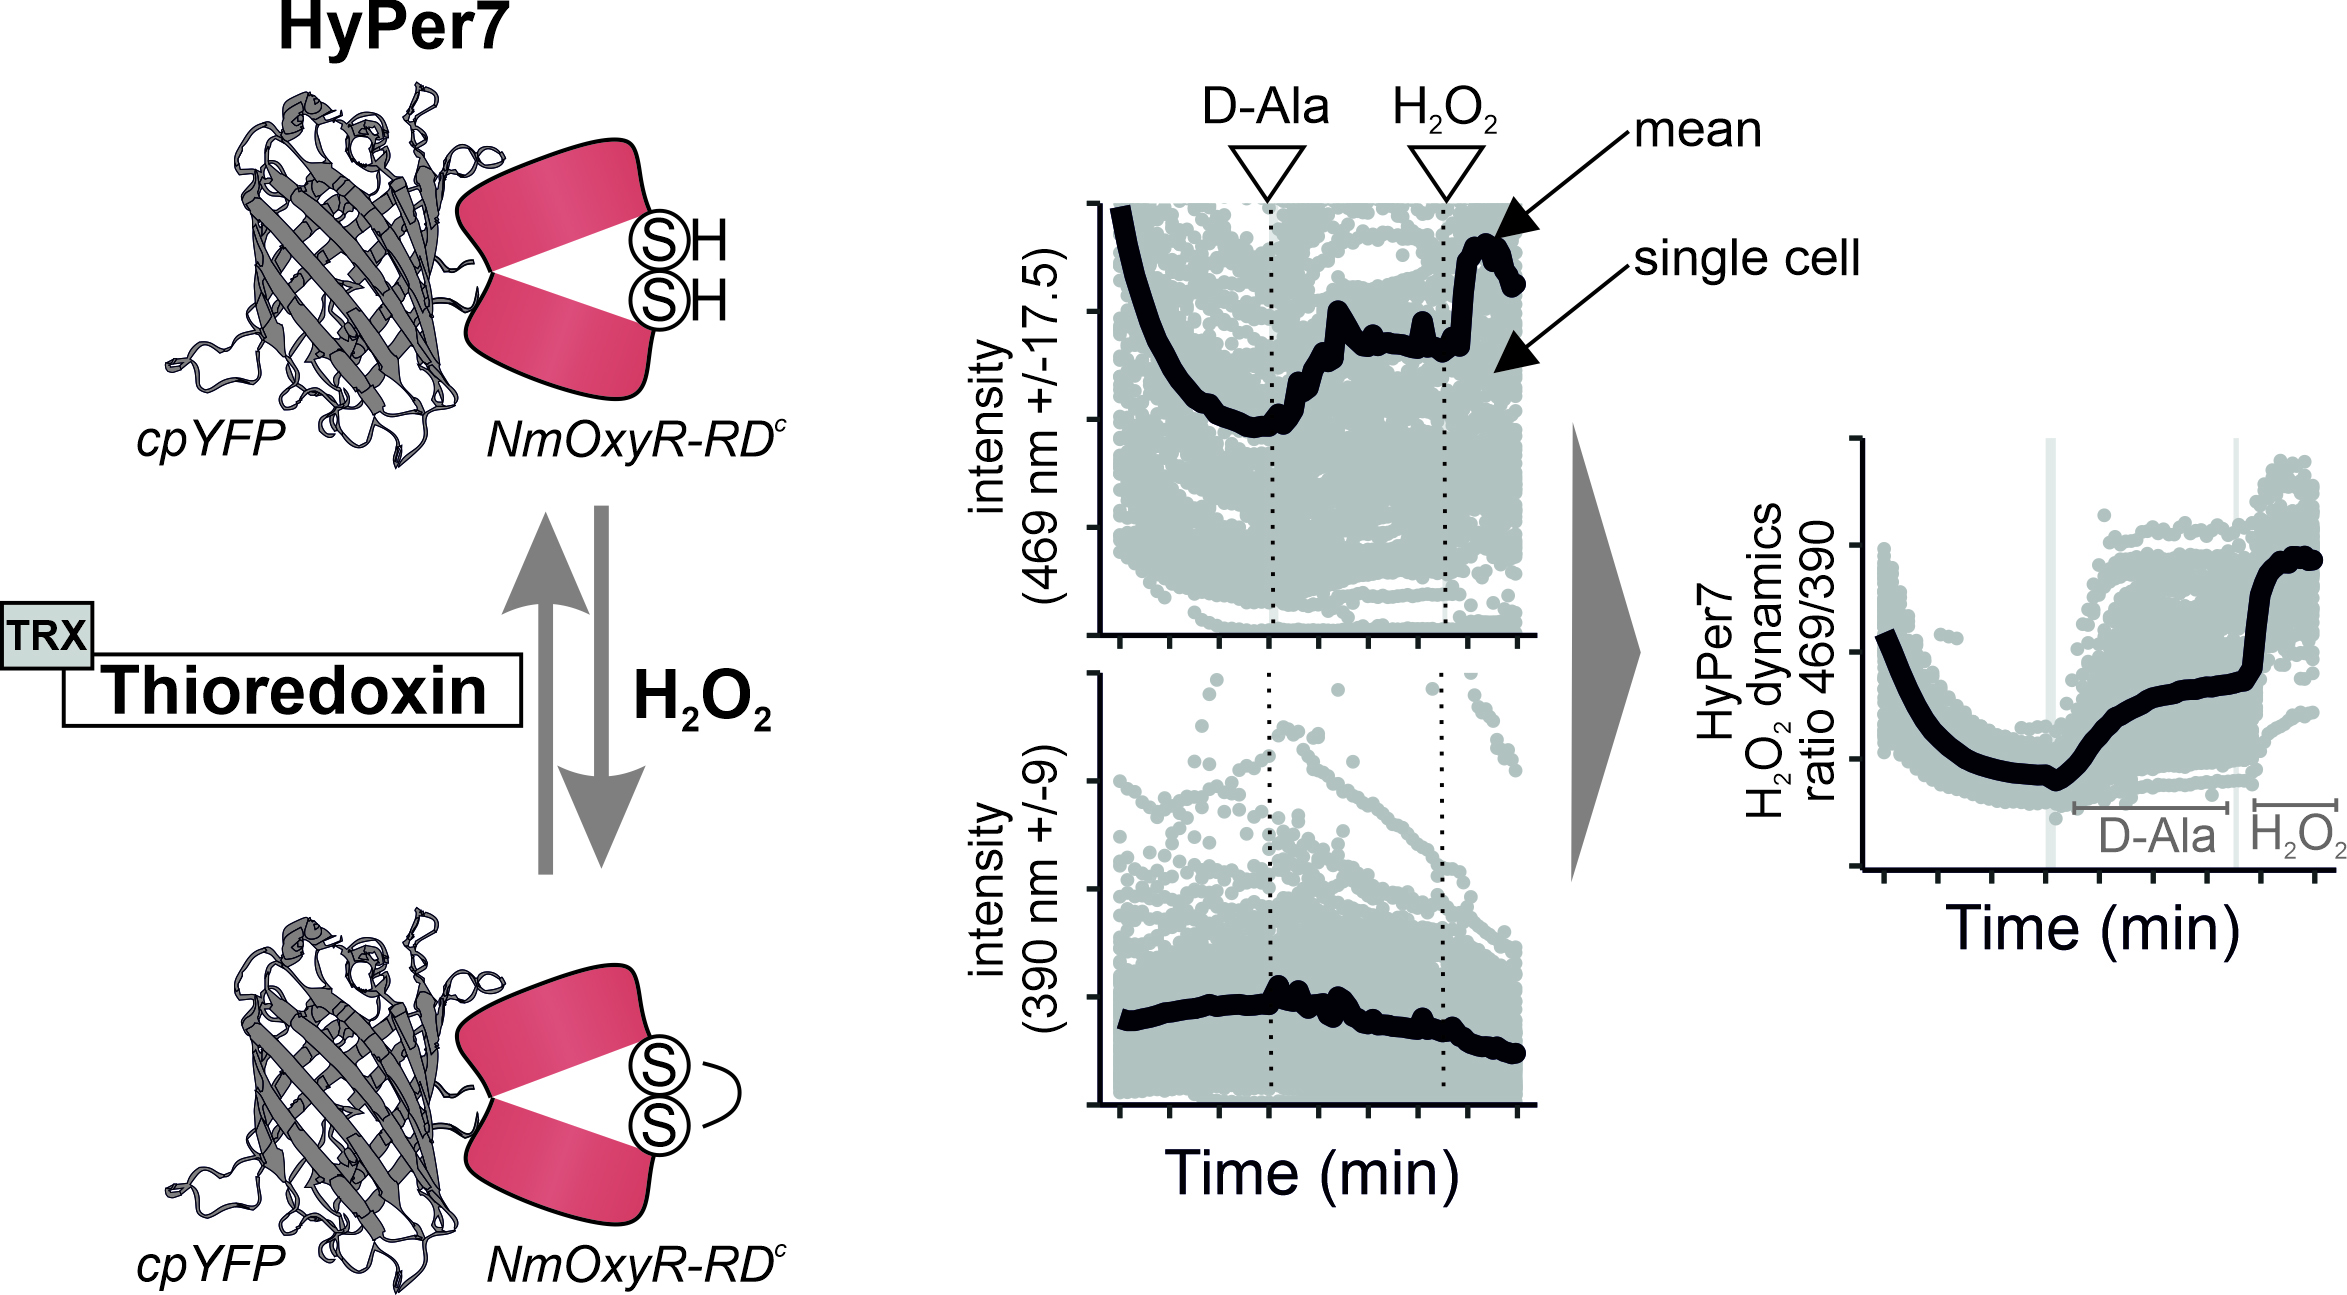
Overview of HyPer7 sensor function and measurement results.
Background
Aerobic life comes at a price due to the formation of reactive oxygen species (ROS) as an unavoidable by-product of essential metabolic processes. ROS is a collective term for reactive chemical species containing oxygen, of which hydrogen peroxide (H2O2) is the most relevant member due to its long half-life and comparably high cellular concentration. H2O2 has both beneficial and deleterious effects on cells depending on its levels, flux, and the functional state of the cell (Sies and Jones, 2020). Consequently, cellular H2O2 levels are tightly controlled.
The subcellular dynamics of H2O2 are poorly understood in intact mammalian cells. To explore these dynamics, biosensors that are targetable, sensitive, specific, and reversible are required. Research previously relied on small chemical probes (mostly irreversible and therefore not measurements of dynamic fluxes of H2O2) or comparably insensitive genetically encoded sensors (reversible but insensitive) (Roma et al., 2018; Kalinovic et al., 2019; Liao et al., 2020; Plecita-Hlavata et al., 2020).
In recent years, more sensitive genetically encoded fluorescent H2O2 sensors were developed, including HyPer7 (Pak et al., 2020). HyPer7 consists of a circular permutated yellow fluorescent protein (cpYFP) that is integrated into the H2O2-sensing regulatory domain of Neisseria meningitidis OxyR (Oxy-RD). OxyR is a natural H2O2 sensor and transcription factor. OxyR from different organisms have different sensitivities; the specific Oxy-RD domain from N. meningitidis renders HyPer7 particularly sensitive and allows measurement of close to baseline H2O2 levels in otherwise unperturbed mammalian tissue cell lines.
Oxy-RD contains two cysteine residues that react in a sensitive and highly specific manner with H2O2 and consequently form a disulfide bond. This disulfide bond in Oxy-RD puts a strain on the fused cpYFP, thus changing the cpYFP excitation spectrum. cpYFP has two excitation maxima at ca 400 nm and 499 nm, respectively, and emits at 516 nm. Changes in the sensor oxidation state result in ratiometric changes with decreases in the excitation maximum at 400 nm and increases at 499 nm upon Oxy-RD oxidation (Pak et al., 2020). Notably, targeted mutations in the cpYFP backbone result in pH insensitivity of HyPer7. This is a clear advantage compared with previous HyPer sensor variants (e.g., HyPer3) that were all pH sensitive in the physiological pH range and required laborious pH control experiments.
Sensors for different biomolecules can be combined with different treatments of cells, with different genetic backgrounds, or with genetic engineering tools. One such genetically encoded tool is D-amino acid oxidase (DAO), an enzyme that converts D-amino acids to the corresponding α-keto acid and generates as a by-product H2O2 (Matlashov et al., 2014). Since DAO can be targeted to different regions within a cell, it can be employed for the localized generation of H2O2.
Here, we describe a protocol to measure local H2O2 dynamics in cytosol and mitochondria. Combining this method with genetically engineered tools, such as the DAO system or CRISPR-cas9–mediated gene editing, to specifically remove parts of the antioxidative system allows detailed investigations of subcellular H2O2 dynamics.
Materials and Reagents
Cultivation of HEK293 cells
1.5 mL Eppendorf tube (Diagonal, catalog number: 02-023-0100)
Sterile filter pipette tips:
10 µL (Greiner Bio-One, Sapphire, catalog number: 772353)
100 µL (Greiner Bio-One, Sapphire, catalog number: 774353)
1,250 µL (Greiner Bio-One, Sapphire, catalog number: 778353)
96-well plate (µClear, Greiner Bio-One, catalog number: 655090)
15 mL Falcon tube (VWR, catalog number: 734-0451)
LUNA reusable cell counting slide (Logos Biosystems, catalog number: L12011)
Autoclaved disposable glass Pasteur pipettes without cotton pad (VWR, catalog number: HECH40567001)
Sterile, individually packed serological pipettes:
5 mL pipettes (Sarstedt, catalog number: 86.1253.001)
10 mL pipettes (Sarstedt, catalog number: 86.1254.001)
10% Fetal calf serum (FCS, Sigma-Aldrich, catalog number: F0804)
1% Penicillin/streptomycin (P/S, Sigma-Aldrich, catalog number: P0781-100ML)
Dulbecco's Modified Eagle Medium high glucose (DMEM, Thermo Fisher, Gibco, catalog number: 41965062)
Reagent reservoir (VWR, catalog number: 613-1175)
Flp-In T-Rex HEK293 cells (Human embryonic kidney 293, Invitrogen, catalog number: R78007)
Poly-L-lysine (Sigma-Aldrich, catalog number: P4832-50mL)
Dulbecco's Phosphate Buffered Saline powder (DPBS, Sigma-Aldrich, catalog number: D5652)
10× Trypsin-EDTA solution (Sigma-Aldrich, catalog number: T4174)
Trypan Blue (Logos Biosystems, catalog number: T13001)
DMEM medium-complete (Gibco, catalog number: 41965039) (see Recipes)
DPBS (see Recipes)
Trypsin-EDTA solution (see Recipes)
Transfection of HEK293 cells
Plasmids:
pCS2+HyPer7-NES [addgene: plasmid #136467 (Pak et al., 2020)]
pCS2+MLS-HyPer7 [addgene: plasmid #136470 (Pak et al., 2020)]
Polyethylenimine (PEI) (Polysciences, catalog number: 23966-1)
Polyethylenimine (PEI) 1 mg/mL (see Recipes)
Dulbecco’s Modified Eagle Medium medium-pure (DMEM, Thermo Fisher, Gibco, catalog number: 41965062) (see Recipes)
Induced expression of DAO in HEK293 cells
Doxycycline (DOX) (AppliChem, catalog number: A2951,0005)
H2O2 measurement
D-Alanine (Sigma-Aldrich, catalog number: 338-69-2)
L-Alanin BioChemica (Applichem, catalog number: A3690,0100)
H2O2 (Sigma-Aldrich, catalog number: 216763-100ML)
Minimal media (see Recipes):
NaCl (Roth, catalog number: 7647-14-5)
KCl (Roth, catalog number: 7447-40-7)
MgCl2 (Roth, catalog number: 2189.2)
CaCl2 (Merck, catalog number: 23.891.000)
HEPES (VWR, catalog number: 7365-45-9)
Glucose (CIL, catalog number: 110187-42-3)
10% Fetal calf serum (FCS, Sigma-Aldrich, catalog number: F0804)
Equipment
Cultivation of HEK293 cells
Laminar flow hood class II (ENVAIR eco)
CO2 incubator (New Brunswick)
Vacuum pump (laboport)
Microscope (motic AE2000)
Multichannel pipette (VWR)
Cell counter – LUNA-II (Logos Biosystems, catalog number: L40002)
Equipped cell culture laboratory containing, e.g., a laminar flow hood class II (ENVAIR eco), a CO2 incubator for cultivation of cells (with cultivation set at 37 °C and 5% CO2), a vacuum pump for removal of medium using sterile glass Pasteur pipettes, a microscope, a cell counter, and a cooling centrifuge.
Transfection of HEK293 cells
In addition to A.
Vortex shaker
H2O2 measurement
Cytation 3 (Agilent, BioTek)
CO2 control
Injection system (optional)
390LED Rev H (Agilent, BioTek, catalog number: 1225009)
roGFPsmall filterblock ex.390 em. 525 Rev D (Agilent, BioTek, catalog number: 1225108)
465LED Rev I (Agilent, BioTek, catalog number: 1225001)
GFP filterblock ex. 469 em. 525 Rev I (Agilent, BioTek, catalog number: 1225101)
Minimal media [HEPES buffer (HBSS) solution from (Poburko et al., 2011)] (see Recipes)
Complete minimal media [HEPES buffer (HBSS) solution from (Poburko et al., 2011)] (see Recipes)
Software
Redox Ratio Analysis (RRA) [Dr M.D. Fricker, https://markfricker.org/77-2/software/redox-ratio-analysis/ (Fricker, 2016)]
Rstudio (https://www.rstudio.com/)
Procedure
An overview of the procedure is depicted in Figure 1.
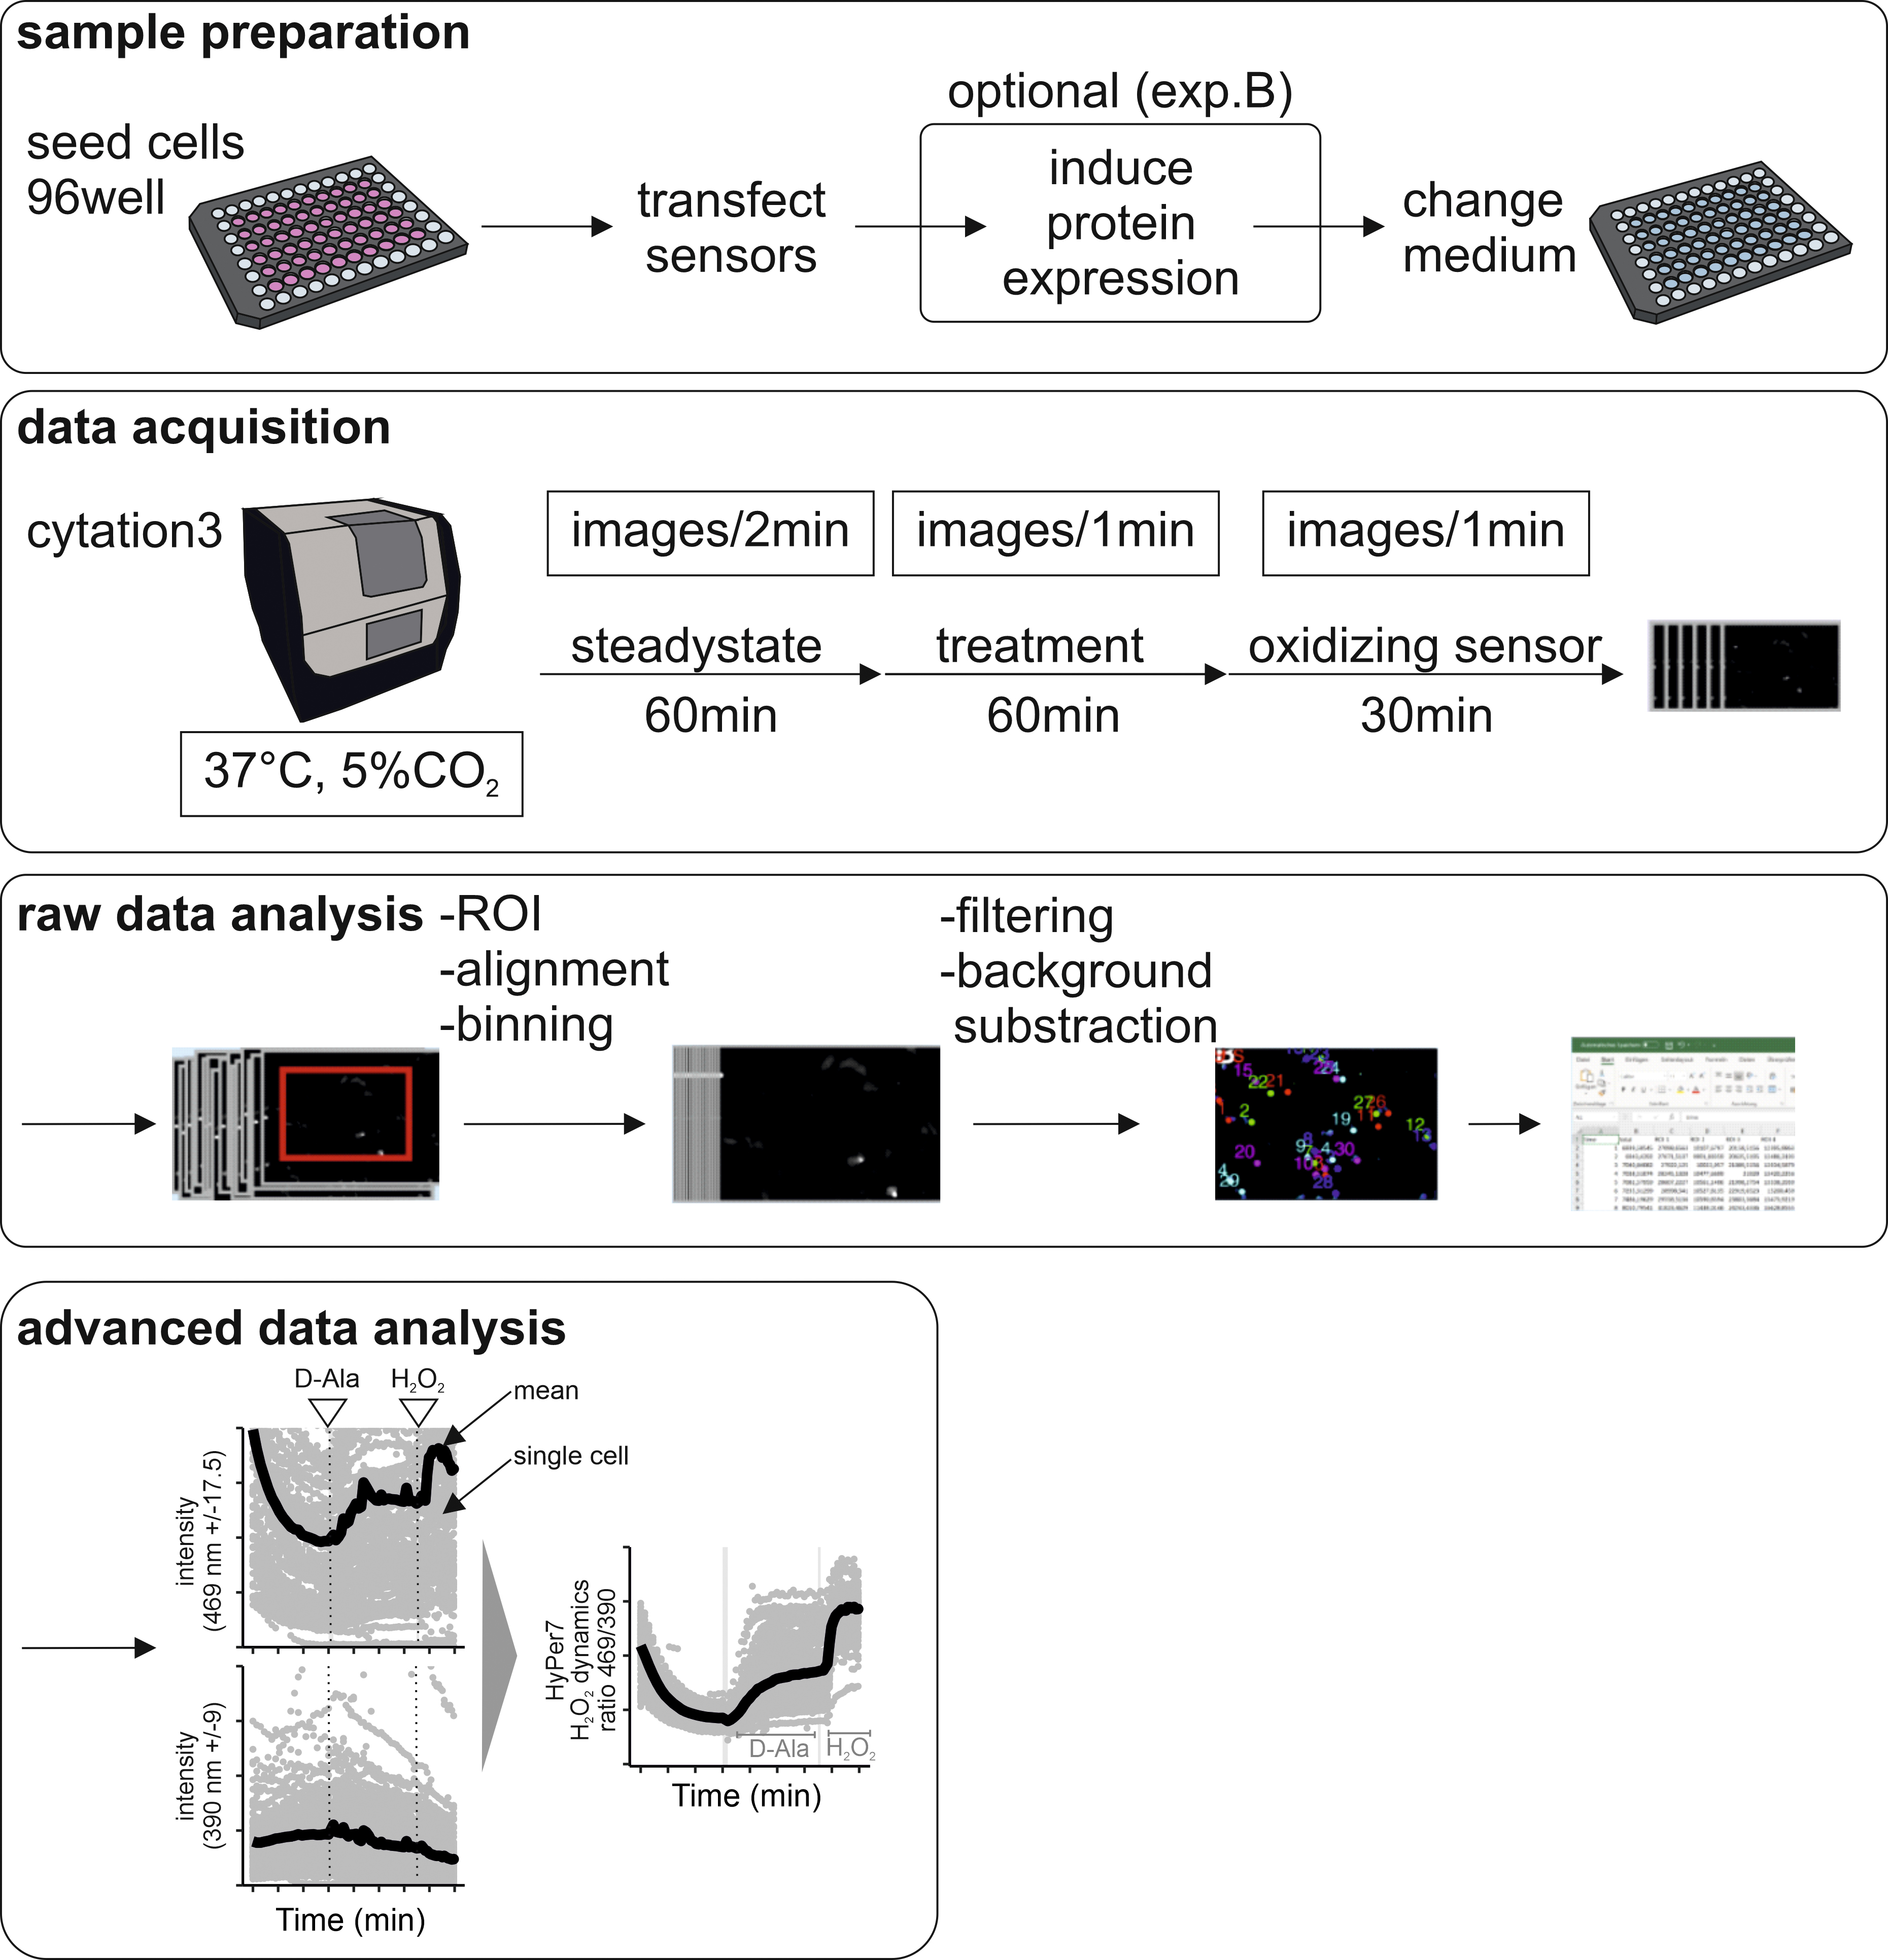
Figure 1. Schematic representation of the steps in the HyPer7 measurement protocol. Cells are seeded in 96-well plates. We describe two different experiments, one where the response upon addition of external bolus H2O2 is assessed (experiment A), and one where H2O2 is locally generated by DAO (optional experiment B). Data are acquired on a Cytation 3 automated multi-well microscope setup that allows culturing cells at 37 °C in the presence of 5% CO2. After data acquisition, data must be processed (raw data analysis) and then further analyzed for presentation.
Cultivation of HEK293 cells (day 1) (see Note 1)
Flp-In T-Rex HEK293 cells are cultured in high-glucose DMEM medium-complete containing FCS and a penicillin/streptomycin antibiotic mixture. HEK293 cells are cultured on 100 mm dishes in 10 mL of DMEM medium-complete until 90% confluency. For the described experiment, HEK293 cells are plated on a poly-L-lysine–coated 96-well plate in 100 µL of DMEM medium-complete.
Transfer a 96-well plate from the package together with the poly-L-lysine to a surface-sterilized laminar flow hood class II.
Take a 10 mL pipette, and dropwise add poly-L-lysine until the surface is fully covered. Let it sit at room temperature for 5 min.
Remove the poly-L-lysine carefully using a 1 mL pipette, as it can be reused up to approximately five times. Transfer the coated 96-well plate to an incubator at 37 °C and 5% CO2 and let it dry for a minimum of 1 h.
Cultivate HEK293 cells on 100 mm dishes in 10 mL of DMEM medium-complete in an incubator at 37 °C and 5% CO2 until they reach 90% confluency.
Transfer the sterile DMEM medium-complete, sterile DPBS, and sterile Trypsin-EDTA to a surface-sterilized laminar flow hood class II. Preheat all solutions to 37 °C.
Before seeding, transfer the coated 96-well plate to the laminar flow hood. Wash the plate three times carefully with preheated DPBS.
Transfer the dishes to the laminar flow hood.
Remove the media using an autoclaved disposable glass Pasteur pipette and a vacuum pump.
Wash the cells carefully by adding 5 mL of sterile DPBS at the edge of the dish using a serological pipette and a pipette boy.
Remove the DPBS using an autoclaved disposable glass Pasteur pipette and a vacuum pump.
Add 1 mL of sterile Trypsin-EDTA onto the cells using a 1 mL sterile filter pipette tip.
Incubate the dish at 37 °C and 5% CO2 for 5 min until the cells detach. Flick the dish with the palm of your hand.
Transfer the dish back into the laminar flow hood, and add 4 mL of DMEM medium-complete using a 5 mL serological pipette.
Singularize the cells using a 5 mL serological pipette and a pipette boy.
Transfer the cell suspension to a 15 mL Falcon tube, and transfer 20 µL of this cell suspension to a 1.5 mL Eppendorf tube for counting.
Determine the concentration of cells using the small aliquot of cell suspension with a cell counter or hemocytometer using Trypan Blue.
Dilute the cell suspension so that they are at a concentration of 4,000 cells/100 µL. Of this solution, 100 µL needs to be seeded per well. Total volume depends on the number of wells needed. Try to avoid seeding the outer wells due to evaporation.
Seed the diluted cell suspension using a reservoir, sterile filter pipette tips, and a multichannel pipette.
Incubate the plate in an incubator at 37 °C and 5% CO2.
Transfection of HEK293 cells (day 2) (see Notes 2 and 3)
The day after seeding, cells are transfected with the sensor of interest. If more wells are transfected with the same sensor, a transfection master mix is prepared in a 1.5 or 2 mL Eppendorf tube (dependent on the number of wells).
Transfer the sterile DMEM medium-pure and sterile DMEM medium-complete to a surface-sterilized laminar flow hood class II. Preheat all solutions to 37 °C.
Thaw the plasmid as well as the Polyethylenimine [PEI (1 mg/mL)].
Mix 0.05 μg/well of plasmid DNA with 10 μL/well of DMEM medium-pure and incubate at room temperature for 5 min.
After the incubation, add 0.15 μL/well of PEI (1 µg/mL final concentration), and vortex for 10 s. Incubate the transfection mix for 10 min at room temperature to ensure the formation of transfection complexes.
Transfer the seeded 96-well plate to the laminar flow hood.
Add 40 μL/well of DMEM medium-complete to the transfection solution.
Add 50 µL of plasmid transfection solution to each well.
Incubate the plate in an incubator at 37 °C and 5% CO2.
Induce expression of DAO in HEK293 cells [day 3; only if inducible system is used (experiment B)] (see Note 4)
Induce the protein expression of the mitochondrial-targeted DAO (mtDAO), which was stably transfected using the Flp-In T-Rex system. DAO will generate H2O2 upon reacting with D-alanine. It does not react with L-alanine.
Transfer the sterile DMEM medium-complete to a surface-sterilized laminar flow hood class II. Preheat all solutions to 37 °C.
Thaw the doxycycline (DOX).
Prepare 1 mL of DMEM medium-complete with DOX 1:100 diluted (from 1 mg/mL stock, final concentration 10 µg/mL) using sterile filter pipette tips.
Transfer the 96-well plate to the laminar flow hood.
Transfer the prepared DOX solution to a reservoir.
Add 10 µL of this solution to each well of the 96-well plate using sterile filter pipette tips and a multichannel pipette.
Incubate the plate in an incubator at 37 °C and 5% CO2.
H2O2 measurement (day 4) (see Note 5)
Measure the response of the HyPer7 to the addition of bolus H2O2 (experiment A), or if the DAO is expressed by treating with D-alanine or L-alanine (experiment B).
Check the filters before starting up the Cytation 3. HyPer7 is measured at excitation levels of 390 nm (±9) and 469 nm (±17.5).
Preheat the Cytation 3 to 37 °C with 5% CO2, and set up the measuring protocol accordingly. Experiment A: 60 min steady-state (acquire a picture every 2 to 3 min); injection/addition by hand of 30 µL of H2O2 (range for the initial experiment of 2.5–20 µM of H2O2 final concentration); 60 min measurement (acquire a picture every 1 to 1.5 min); injection/addition by hand of 20 µM of H2O2 (to fully oxidize the HyPer7 sensor); and 30 min measurement (acquire a picture every 1 to 1.5 min).
Experiment B: 60 min steady-state (acquire a picture every 2 to 3 min); injection/addition by hand of 30 µL of D/L-alanine (range for the initial experiment of 1–8 mM D-alanine final concentration); 60 min measurement (acquire a picture every 1 to 1.5 min); injection/addition by hand of 20 µM H2O2 (to fully oxidize the HyPer7 sensor); and 30 min measurement (acquire a picture every 1 to 1.5 min).
Prepare the H2O2 (experiment A) and D-alanine and L-alanine (experiment B) dilutions in minimal media (without 10% FCS). Consider that further dilution will take place, due to the already present 50 µL of complete minimal media (with 10% FCS) in each well.
Prime the injection system with the H2O2, D-alanine, or L-alanine dilution.
Transfer the 96-well plate to a working bench, and add distilled water (dH2O) to all the empty outer wells to prevent the evaporation of media.
Remove the media of the wells that will be measured. Do not remove media from wells that will be measured at a later point during the day. With these Cytation 3 settings, it is possible to measure up to 18 wells in the same measurement.
Add 50 µL of complete minimal media (with 10% FCS) to each well.
Place the 96-well plate in the Cytation 3, and start setting the beacons for each well.
After setting the beacons and saving the settings, start the measurement.
Add between 10–30 µL of treatment solution. Do not add less volume to ensure that the solutions will properly mix.
Data analysis
In this protocol, we describe the use of the ratiometric sensor HyPer7. Using two excitation peaks at approximately 405 and 488 nm, the redox state of the sensor and thus indirectly the levels of H2O2 in its surroundings can be assessed. Forming the ratio of the intensities at these peaks reduces errors that result from differences in sensor concentrations (Pak et al., 2020). Data can be analyzed using standard software like excel. For the waste amount of single cell data, we employ a semi-automatized software package, the RRA (redox ratio analysis) program (Fricker, 2016). The data exported from this program are further analyzed using R.
As the first step of the analysis, we use the RRA program to extract the fluorescence intensities for both channels and each single cell. For this, load the images into RRA, and stack all images of one well. As the 469 nm channel is much brighter, make sure to first select this one and afterwards the 390 nm channel (roGFPsmall); it will improve the alignment.
Select a region of interest (ROI) and align the images. This is necessary to ensure that the cells are at the exact same spot over time and their signal can be extracted properly.
To remove background noise, continue the “advanced ratio analysis” mode, and filter the background.
Afterwards, select every cell present in the ROI, and export the data as an excel file.
As the second step, we perform downstream analysis in R. Load the excel file into R, where you will clean the data and remove potential outliers, such as floating dead cells. These outliers are easily identified as ROIs having ratio values of + 6000 as well as ×10x.
Merge the data of the replicates, and calculate the mean of all the single cells measured.
Represent each cell individually as points, together with the calculated mean as a line using ggplot2. This way, we can see the heterogeneity of the individual cell responses, as well as the cell population mean.
Export the graphs.
Notes
Cell seeding: Cells are seeded at a low density to ensure the measurement on a single-cell basis with a 70% confluency. It is important to score how fast different cell lines used in this experiment grow to adjust the seeding of cells on day 1. Cell density often has effects on the handling of the applied treatment by the cells (e.g., a higher number of cells might more rapidly remove H2O2 from the medium compared to a lower number). If the cells are too dense on the day of the measurement, this can cause the presence of more floating cells during your measurement and thus hamper proper automated data analysis. For the same reason, we also advise precoating the 96-well plate with poly-L lysine to increase cell attachment. When comparing multiple experiments, it is important to seed the same number of cells, transfect at the same time, and perform the experiment in a similar manner.
Transfection: We always perform measurements 48 h after transfection. This time can be varied as the transiently transfected sensor often is detectable for up to 5 days. A high transfection efficiency is important for the subsequent single-cell measurements.
The imaging parameters used in this protocol (390 and 469 nm) are not the most optimal. The maxima of the sensor excitation peaks are at 405 and 488 nm; however, the commercially available filters used are the best fitting ones for the Cytation setup that we are using.
Sensor targeting to different compartments: Biosensors can be genetically targeted to different (sub-)compartments including cytosol (equipment with a nuclear export signal), mitochondrial matrix and intermembrane space (IMS), outer mitochondrial membrane and plasma membrane, and nucleus. For each localization, sensor measurements must be established from scratch. For example, “small” compartments like the IMS might harbor only a small number of sensor molecules, thus giving rise to only small fluorescence signals (especially of the 405 nm channel). Moreover, the mechanisms of sensor reversibility often rely on the presence of enzymes. In the case of HyPer7, the sensor is oxidized by H2O2 directly but requires reduction by the thioredoxin system. Thus, if this system is not present in sufficient amounts in the compartment of choice, results might be affected. Conversely, biosensor expression might also affect its local surroundings. For HyPer7, it has to be considered that it scavenges H2O2 when it “detects” H2O2, and thus it might interfere with redox signaling.
Inducible expression systems: Instead of transient transfections, inducible expression systems might be used. We often combine the transient expression of biosensors with the inducible stable expression of genetic engineering tools like the mtDAO system. It is important to carefully titrate expression levels of these genetic tools (using different expression times and DOX amounts) and confirm (like for the biosensors) their correct localization. To confirm functionality of the engineering tool, it is advisable to directly assess its function. In the case of mtDAO, cotransfection with HyPer7 to the mitochondrial matrix and addition of D-alanine could serve as control.
Measurements:
Minimal medium: We often observe a strong interference of colored medium (e.g., medium containing phenol red) with the measurements. To ensure no interference, we use minimal medium. This medium can also be easily adapted to additional needs of the experimental regime, such as incubation of cells with different nutrient sources or depletion of cells from those nutrients.
Sensors: For a multiplexing/multiparameter measurement approach, it would be highly interesting to combine different biosensors within the very same cell. This would also help to explore the strong heterogeneity between cells that is observed in single-cell measurements. It is, however, important to consider that biosensors with similar fluorescence spectrum features cannot be combined.
Steady-state measurements: Like with most H2O2 sensors, assessing the steady state of HyPer7 can require a long time. The sensor is initially more oxidized due to the contact of the cells with oxygenated medium. The loss of oxygen from the medium reduces HyPer7. A steady signal is often reached after 40 min. This steady-state signal often corresponds to almost fully reduced HyPer7 indicating that experiments are most often performed to assess oxidizing insults.
Heterogeneity in sensor responses: When assessing single cells, we observe a strong heterogeneity in biosensor responses between cells. On the one hand, this necessitates the presentation of results on the level of single cells and the performance of the experiment with many cells to indicate a reliable mean for the experiment. It also indicates that multiparameter experiments should best be done with different sensors within the same cell to identify correlations.
Recipes
Dulbecco’s Modified Eagle Medium (DMEM) medium-complete
Add 10% fetal calf serum (FCS) and 1% penicillin/streptomycin (P/S) to a fresh bottle of high glucose DMEM.
Store at 4 °C and prewarm to 37 °C before use.
Dulbecco’s Modified Eagle Medium (DMEM) medium-pure
No fetal calf serum (FCS) and no penicillin/streptomycin (P/S) are added. Store at 4 °C and prewarm to 37 °C before use.
Dulbecco's Phosphate Buffered Saline (DPBS)
Dissolve one bottle of DPBS powder in double-distilled water (ddH2O) according to the manufacturer’s description.
Sterilize by autoclaving.
Store at 4 °C and prewarm to 37 °C before use.
Trypsin-EDTA solution
Dilute 10× Trypsin-EDTA solution 1:10 with sterile PBS.
Store at 4 °C and prewarm to 37 °C before use.
Aliquots can be kept frozen at -20 °C.
Polyethylenimine (PEI) 1 mg/mL
Dissolve PEI in ddH2O.
While stirring, add HCl to increase the pH to 7.0.
Sterile filter the solution.
Store in small aliquots at -20 °C for short-term storage; for long-term storage store at -80 °C.
Minimal media [HEPES buffer (HBSS) solution from Poburko et al. (2011)]
140 mM NaCl, 5 mM KCl, 1 mM MgCl2, 2 mM CaCl2, 20 mM HEPES and 10 mM glucose in distilled water.
Store at 4 °C.
Complete minimal media [HEPES buffer (HBSS) solution from Poburko et al. (2011)]
140 mM NaCl, 5 mM KCl, 1 mM MgCl2, 2 mM CaCl2, 20 mM HEPES and 10 mM glucose in distilled water.
Add 10% FCS; aliquots can be kept frozen at -20 °C.
Preheat an aliquot of the Minimal media to 37 °C.
Acknowledgments
The Deutsche Forschungsgemeinschaft (DFG) funds research in the Laboratory of JR (RI2150/2-2 – project number 251546152, RI2150/5-1 – project number 435235019, CRC1218 / TP B02 – project number 269925409, and RTG2550/1 – project number 411422114). The protocol was used in the following original research paper (Hoehne et al., 2022).
Competing interests
The authors declare that they have no competing interests.
References
- Fricker, M. D. (2016). Quantitative Redox Imaging Software. Antioxid Redox Signal 24(13): 752-762.
- Hoehne, M. N., Jacobs, L., Lapacz, K. J., Calabrese, G., Murschall, L. M., Marker, T., Kaul, H., Trifunovic, A., Morgan, B., Fricker, M., et al. (2022). Spatial and temporal control of mitochondrial H2O2 release in intact human cells. EMBO J 41(7): e109169.
- Kalinovic, S., Oelze, M., Kroller-Schon, S., Steven, S., Vujacic-Mirski, K., Kvandova, M., Schmal, I., Al Zuabi, A., Munzel, T. and Daiber, A. (2019). Comparison of Mitochondrial Superoxide Detection Ex Vivo/In Vivo by mitoSOX HPLC Method with Classical Assays in Three Different Animal Models of Oxidative Stress. Antioxidants (Basel) 8(11).
- Liao, P. C., Franco-Iborra, S., Yang, Y. and Pon, L. A. (2020). Live cell imaging of mitochondrial redox state in mammalian cells and yeast. Methods Cell Biol 155: 295-319.
- Matlashov, M. E., Belousov, V. V. and Enikolopov, G. (2014). How much H2O2 is produced by recombinant D-amino acid oxidase in mammalian cells? Antioxid Redox Signal 20(7): 1039-1044.
- Pak, V. V., Ezerina, D., Lyublinskaya, O. G., Pedre, B., Tyurin-Kuzmin, P. A., Mishina, N. M., Thauvin, M., Young, D., Wahni, K., Martinez Gache, S. A., et al. (2020). Ultrasensitive Genetically Encoded Indicator for Hydrogen Peroxide Identifies Roles for the Oxidant in Cell Migration and Mitochondrial Function. Cell Metab 31(3): 642-653 e646.
- Plecita-Hlavata, L., Engstova, H., Holendova, B., Tauber, J., Spacek, T., Petraskova, L., Kren, V., Spackova, J., Gotvaldova, K., Jezek, J., et al. (2020). Mitochondrial Superoxide Production Decreases on Glucose-Stimulated Insulin Secretion in Pancreatic beta Cells Due to Decreasing Mitochondrial Matrix NADH/NAD+ Ratio. Antioxid Redox Signal 33(12): 789-815.
- Poburko, D., Santo-Domingo, J. and Demaurex, N. (2011). Dynamic regulation of the mitochondrial proton gradient during cytosolic calcium elevations. J Biol Chem 286(13): 11672-11684.
- Roma, L. P., Deponte, M., Riemer, J. and Morgan, B. (2018). Mechanisms and Applications of Redox-Sensitive Green Fluorescent Protein-Based Hydrogen Peroxide Probes. Antioxid Redox Signal 29(6): 552-568.
- Sies, H. and Jones, D. P. (2020). Reactive oxygen species (ROS) as pleiotropic physiological signalling agents. Nat Rev Mol Cell Biol 21(7): 363-383.
Article Information
Copyright
© 2022 The Authors; exclusive licensee Bio-protocol LLC.
How to cite
Jacobs, L. J. H. C., Hoehne, M. N. and Riemer, J. (2022). Measuring Intracellular H2O2 in Intact Human Cells Using the Genetically Encoded Fluorescent Sensor HyPer7. Bio-protocol 12(20): e4538. DOI: 10.21769/BioProtoc.4538.
Category
Cell Biology > Cell imaging > Live-cell imaging
Biochemistry > Other compound > Reactive oxygen species
Do you have any questions about this protocol?
Post your question to gather feedback from the community. We will also invite the authors of this article to respond.