- Protocols

- Articles and Issues
- For Authors
- About
- Become a Reviewer

Assay for Protealysin-like Protease Inhibitor Activity
Published: Vol 12, Iss 19, Oct 5, 2022 DOI: 10.21769/BioProtoc.4528 Views: 2346
Reviewed by: Anonymous reviewer(s)
Original research article
The authors used this protocol in:

Feb 2021
Advertisement


Protocol Collections
Comprehensive collections of detailed, peer-reviewed protocols focusing on specific topics


Abstract
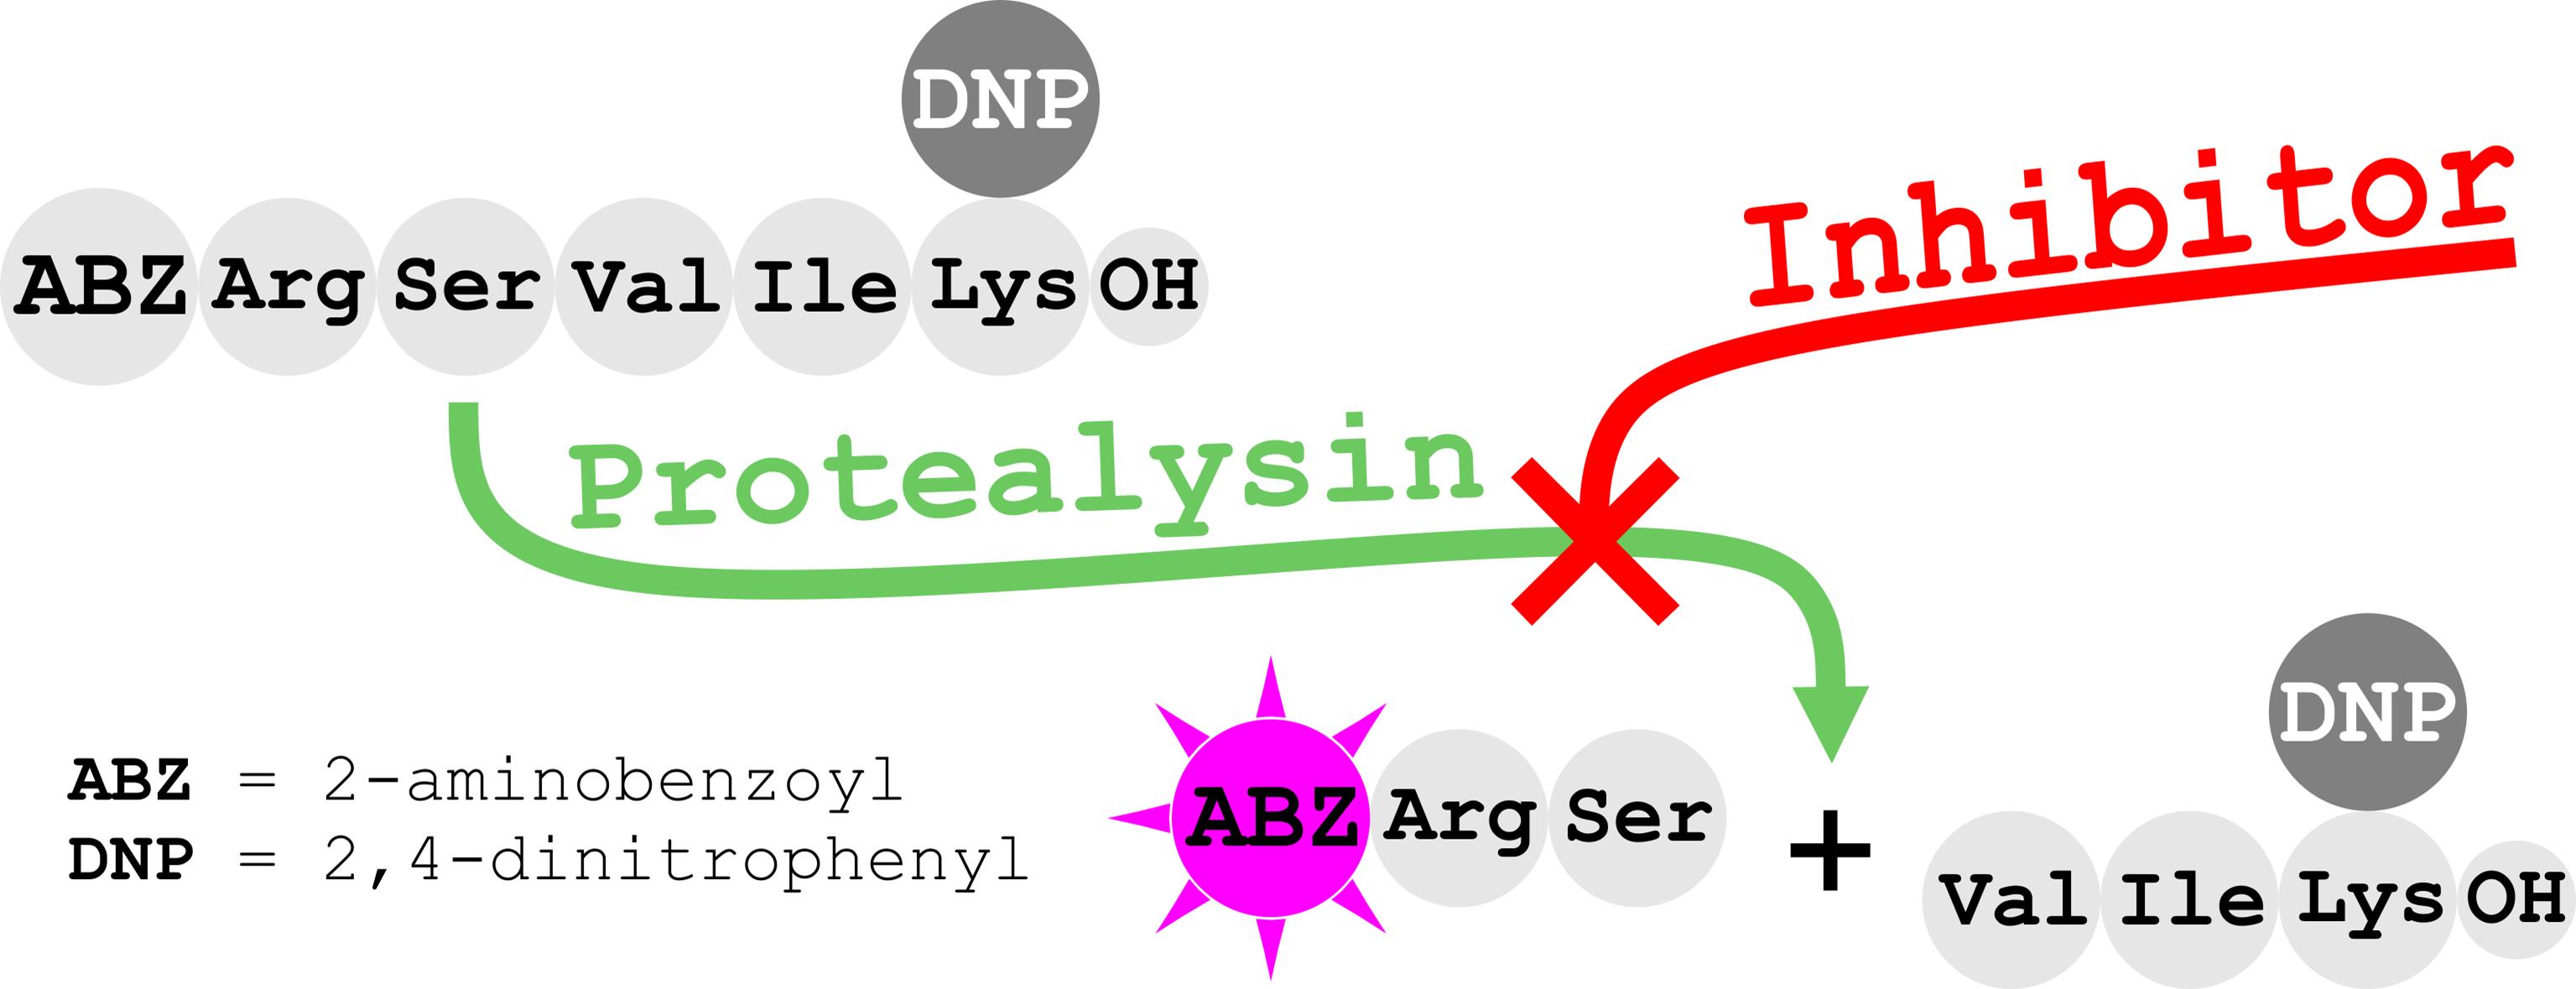
Here, we present the first quantitative method for the activity analysis of protealysin-like protease (PLP) inhibitors. This approach is based on a previously developed method for protealysin activity determination by hydrolysis of internally quenched fluorescent peptide substrate 2-aminobenzoyl-L-arginyl-L-seryl-L-valyl-L-isoleucyl-L-(ϵ-2,4-dinitrophenyl)lysine. In this protocol, we significantly reduced enzyme concentration and introduced some minor modifications to decrease variation between replicates. The protocol was validated using emfourin, a novel proteinaceous metalloprotease inhibitor. Data obtained demonstrates that the developed assay method is an affordable approach for characterizing and screening various PLP inhibitors.
Graphical abstract:
Background
Protealysin-like proteases (PLPs) are a large group of zinc-containing metalloproteases belonging to the M4 family, according to the MEROPS database (www.ebi.ac.uk/merops) (Demidyuk et al., 2008, 2013). The interest in PLPs is primarily due to their possible involvement in bacterial pathogenesis, as they seem to be involved in bacterial invasion into eukaryotic cells, suppression of immune defense of some animals, and destruction of plant cell walls (Tsaplina et al., 2012, 2020; Demidyuk et al., 2013; Feng et al., 2014; Eshwar et al., 2018; Khaitlina et al., 2020).
We have previously developed a method for activity determination of protealysin (PLN), the prototype of PLP, from Serratia proteamaculans based on the hydrolysis of internally quenched fluorescent peptide substrate 2-aminobenzoyl-L-arginyl-L-seryl-L-valyl-L-isoleucyl-L-(ϵ-2,4-dinitrophenyl)lysine [Abz-RSVIK(Dnp)]. The proposed substrate was advantageous for quantitative activity analysis of PLN, as well as other M4 peptidases (Karaseva et al., 2019). Recently, we discovered emfourin (M4in) from S. proteamaculans, a novel potent slow-binding competitive proteinaceous inhibitor of PLN. To characterize the inhibition activity of M4in, we had to modify the PLN activity assay. Firstly, we significantly reduced the enzyme concentration and, in addition, introduced some minor modifications to decrease variation between replicates (Chukhontseva et al., 2021). Using the modernized protocol in the M4in study has shown that this approach is suitable for screening and characterizing PLP inhibitors.
Since Abz-RSVIK(Dnp) can be used to determine the activity of not only PLN but also other M4 family proteases (Karaseva et al., 2019), the proposed method can be adapted to determine the activity of inhibitors of various representatives of this family. Metalloproteases belonging to the M4 family are produced by significant human pathogens, such as Pseudomonas aeruginosa, Staphylococcus aureus, Staphylococcus epidermidis, Burkholderia cenocepacia, Enterococcus faecalis, Legionella pneumophila, Clostridium perfringens, and several pathogenic Vibrio species; their inhibitors, in the face of growing antibiotic resistance in bacteria, are considered as potential drug targets (Adekoya and Sylte, 2009). Thus, this method can be useful in the search for new antibacterial agents.
Materials and Reagents
Microcentrifuge tubes (1.5 mL) for reagent dilutions (SSI, catalog number: 1260)
Black 96-well polystyrene flat bottom microwell plate (Corning, catalog number: 3915)
0.20 μm membrane filter (Corning, catalog number: 431219)
Protealysin (PLN) was produced in E. coli and purified as described in Gromova et al. (2009). Although PLN was used in the development of the protocol, other M4 family proteases can also be used. In particular, we successfully implemented the protocol without any modification with thermolysin from Bacillus thermoproteolyticus (Serva, catalog number: 36015)
Emfourin (M4in) was produced in E. coli and purified as described in Chukhontseva et al. (2021). The activity of other proteinaceous or low-molecular-weight inhibitors of M4 family peptidases can also be determined using the protocol
Substrate: 2-aminobenzoyl-L-arginyl-L-seryl-L-valyl-L-isoleucyl-L-(ϵ-2,4-dinitrophenyl)lysine [Abz-RSVIK(Dnp)] (Peptide 2.0)
Tris(hydroxymethyl)aminomethane (Tris) (Sigma-Aldrich, catalog number: T1503)
Tris(hydroxymethyl)aminomethane hydrochloride (Tris-HCl) (Sigma-Aldrich, catalog number: T3253)
Dimethyl sulfoxide (DMSO) (MP Biomedicals, catalog number: 0219605525)
Assay buffer (see Recipes)
Substrate stock solution in DMSO (see Recipes). Can be stored at -20 °C without any loss in substrate properties; however, it is necessary to minimize freeze-thaw cycles
Protease (PLN) solution (see Recipes). Prepare immediately before analysis; do not store
Inhibitor (M4in) solution (see Recipes). Prepare immediately before analysis; do not store
Equipment
Desktop microcentrifuge (Eppendorf, Micro Centrifuge 5415)
Solid state laboratory thermostat for microcentrifuge tubes (DNA-technology, Thermit)
Temperature-controlled microplate reader capable of measuring fluorescence kinetics (BMG, CLARIOstar Plus)
Software
GraphPad Prism 8.0 (GraphPad Software)
Procedure
Prepare assay buffer and substrate and protein (PLN and M4in) stock solutions.
Add 120 μL of the substrate solution into the wells of a black 96-well plate (see Note 1).
Incubate the plate in a microplate reader at 37 °C for 10 min (see Note 2).
Remove 30 µL of the substrate solution from each well.
Preheat the assay buffer and protein stock solutions in a thermostat at 37 °C.
Add inhibitor solution or assay buffer into the wells according to Table 1:
15 μL of inhibitor solution for inhibition test.
15 μL of assay buffer for enzyme activity control (see Note 3).
30 μL of assay buffer for substrate control (see Note 4).
Incubate the mixtures in the reader at 37 °C for 1 min.
Start the reaction in inhibition test and enzyme activity control with 15 μL of PLN solution (Table 1). Immediately after adding the enzyme, mix the solutions once with a micropipette set at 80 μL. This operation reduces possible signal distortions in the beginning of the reaction.
Place the plate into the reader at 37 °C and record time-related fluorescence changes every 10 s for 15 min, at the excitation and emission wavelengths of 320 and 420 nm, respectively (see Note 5).
Transfer the substrate solution from the substrate control well into a spectrophotometer cell to measure the optical density at 365 nm. Use the concentration calculated from the obtained optical density as the initial substrate concentration in the hydrolysis reactions (see Note 6).
Table 1. Composition of the assay mixtures
Sample Reagent Concentration Volume (μL) In the reaction mixture In the added solution Substrate control Substrate 30 or 90 μM 40 or 120 μM 90 Assay buffer 30 Total: 120 Enzyme activity control Substrate 30 or 90 μM 40 or 120 μM 90 Assay buffer 15 Protease 50 pM 400 pM 15 Total: 120 Inhibition test Substrate 30 or 90 μM 40 or 120 μM 90 Inhibitor 0.5–3.5 nM 4–28 nM 15 Protease 50 pM 400 pM 15 Total: 120
Data analysis
Several independent measurements were made for each pair of substrate and M4in concentrations. The progress curves were plotted and analyzed using GraphPad Prism 8.0 software. Detailed information of curve analyses can be found in the original research article (Chukhontseva et al., 2021). Characteristic progress curves are represented as an example (Figure 1).
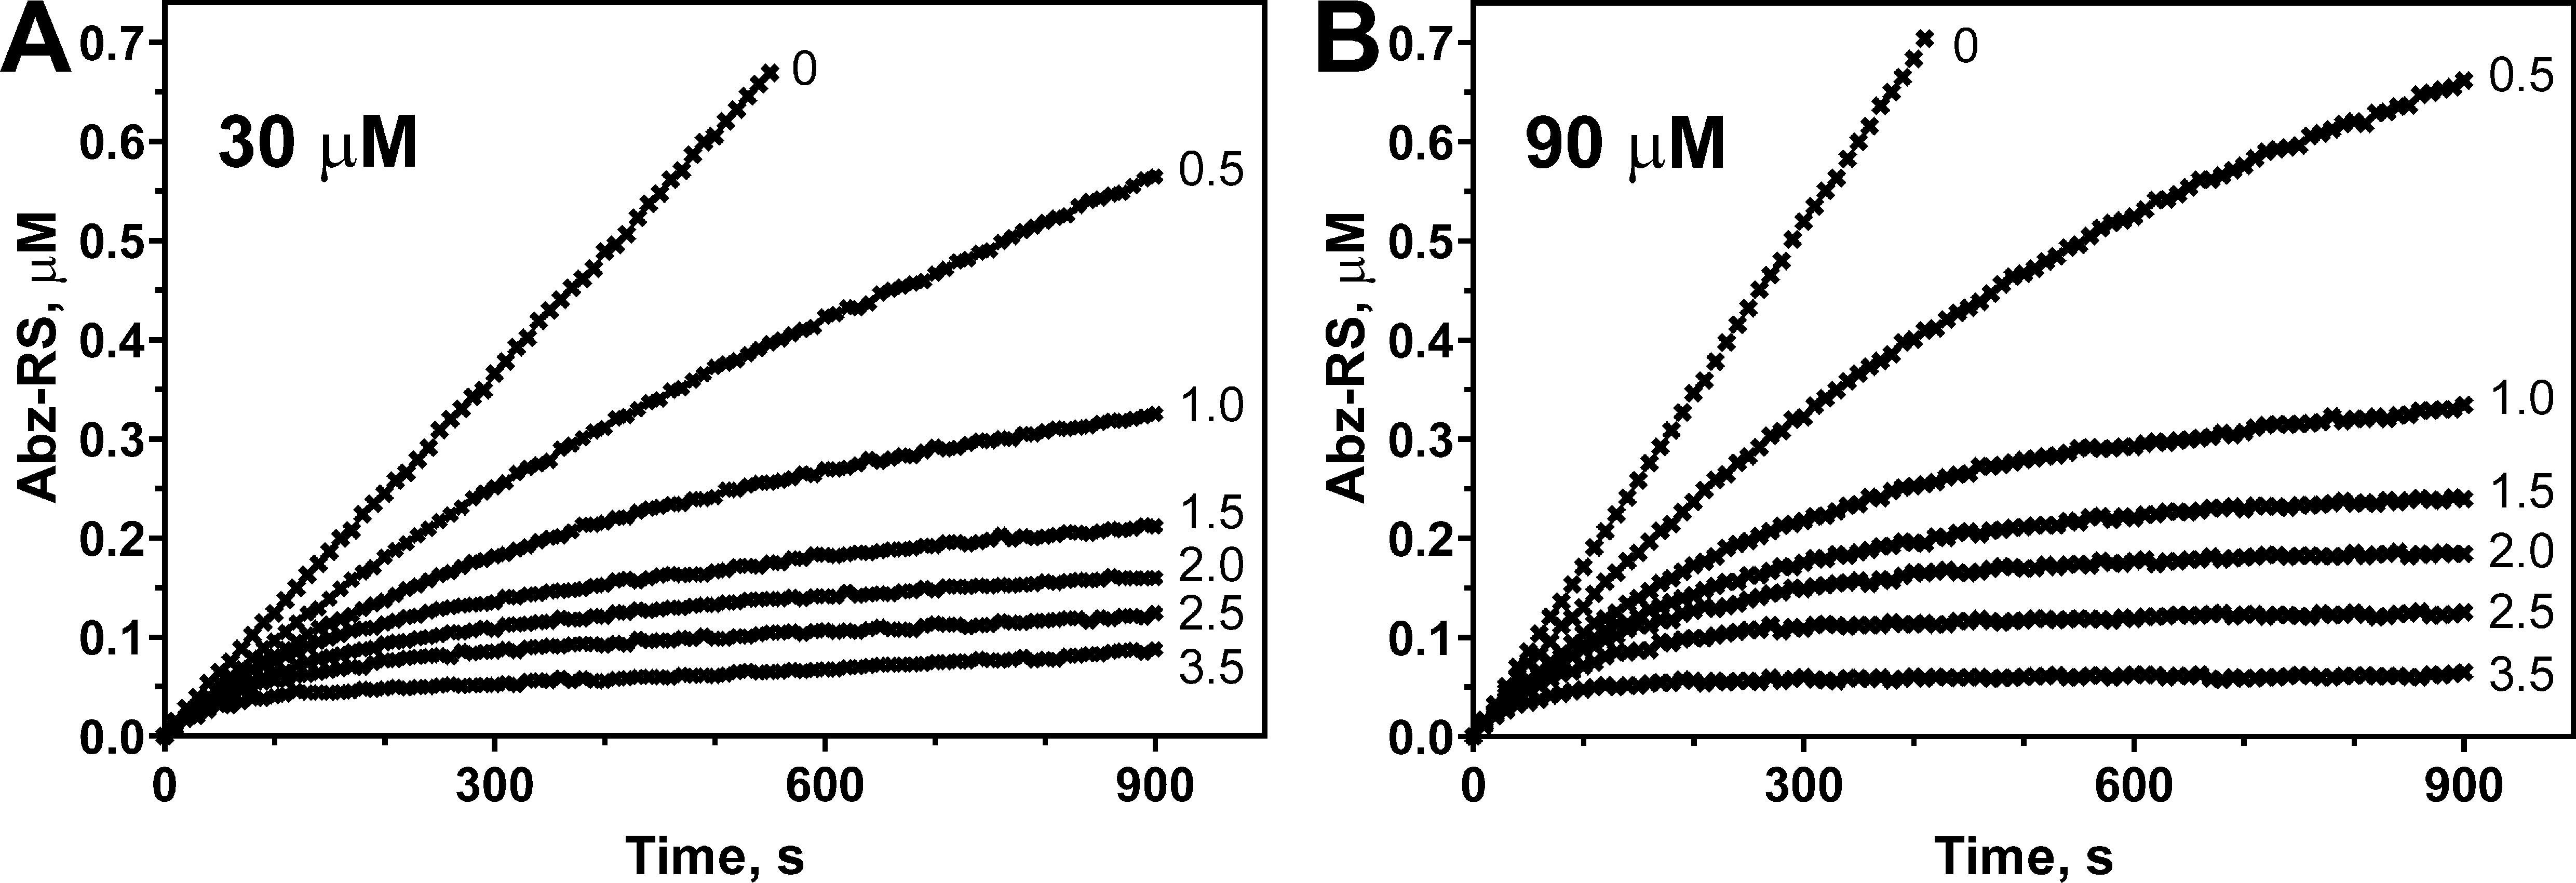
Figure 1. Emfourin-mediated inhibition of the Abz-RSVIK(Dnp) hydrolysis catalyzed by protealysin. The Abz-RSVIK(Dnp) concentrations are 30 (A) and 90 (B) μM; the emfourin concentrations are 0, 0.5, 1, 1.5, 2, 2.5, and 3.5 nM; the protealysin concentration is 50 pM. The reactions were performed at 37 °C. Abz-RS (2-aminobenzoyl-L-arginyl-L-serin) is the product of the substrate hydrolysis. Conversion of the relative fluorescence units into the product concentration was made using calibration curves, as described previously (Karaseva et al., 2019).
Notes
As in the previously described PLN activity assay, in the inhibition assay the reactions were started by the enzyme addition (Chukhontseva et al., 2021). However, here we manage to significantly lower the enzyme concentration in the assay by adjusting the photomultiplier tube gain. The gain setting controls the amplification of the photomultiplier when converting fluorescent light into electrical current. We were able to conduct measurements using even lower enzyme concentrations (Figure 2). However, decreased concentrations lead to low signal and, consequently, decreased signal/noise ratio.
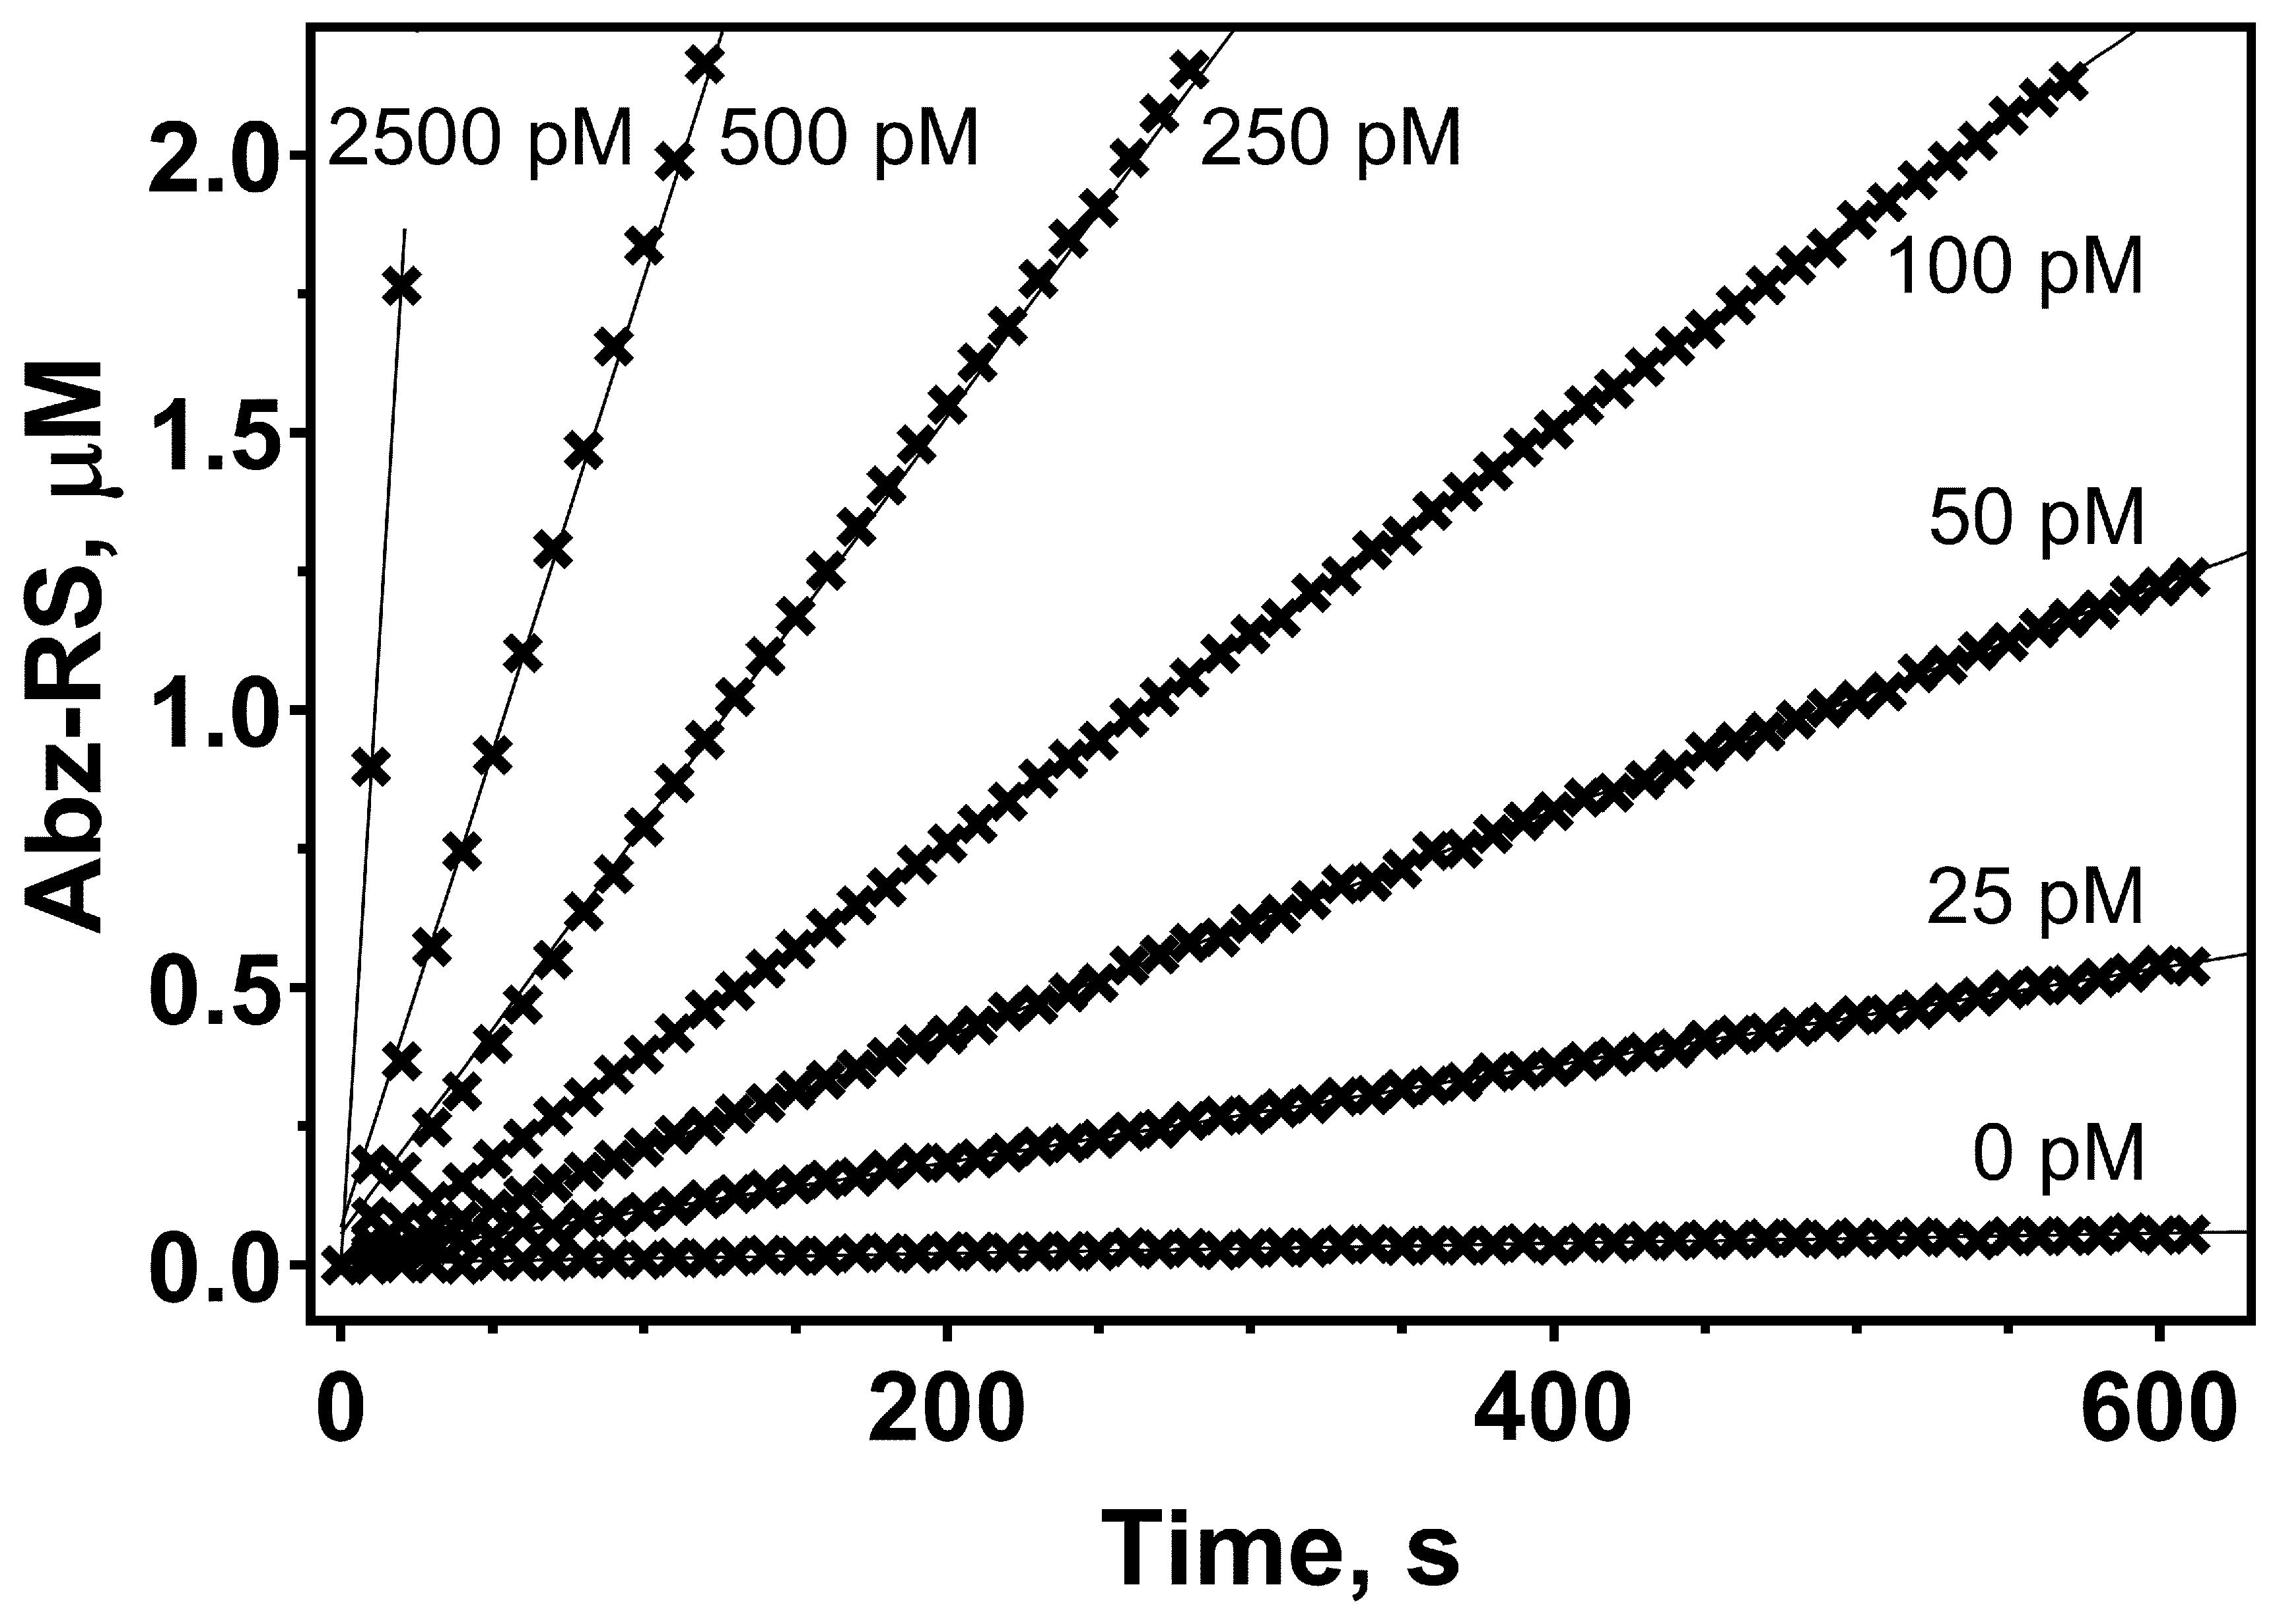
Figure 2. Kinetics of Abz-RSVIK(Dnp) hydrolysis by protealysin at different concentrations. The protealysin concentrations are 0, 25, 50, 100, 250, 500, and 2,500 pM; the Abz-RSVIK(Dnp) concentration is 30 μM. The reactions were performed at 37 °C. Abz-RS (2-aminobenzoyl-L-arginyl-L-serin) is the product of the substrate hydrolysis. Conversion of the relative fluorescence units into the product concentration was made using calibration curves, as described previously (Karaseva et al., 2019).The substrate adsorption on microplates is the main reason for this operation. We previously studied the kinetics of substrate adsorption on microplates and observed that after 10 min of incubation the substrate concentration did not change during the reaction time (Karaseva et al., 2019).
Enzyme activity control was carried out to check the protease activity. This control was made every time a new solution was prepared and between independent measurements.
The main aim of the substrate control was to determine the substrate concentration in the reaction mixture. The substrate control was also necessary to prove that background noise was low and that there was no spontaneous substrate hydrolysis in the absence of the enzyme. Our further attempts to lower enzyme concentration failed because of high background noise of the substrate, which resulted in signal variations.
Here, the delay between enzyme addition and the start of the measurement was approximately 20 s.
Substrate stock solution preparation and further dilution were done in a way that DMSO concentration did not exceed 2.5% in the final reaction mixture. In this concentration range, DMSO has no significant effect on the hydrolysis of Abz-RSVIK(Dnp) by protealysin (Figure 3). Substrate concentrations up to 130 μM could be used in the reaction mixture, as described previously (Karaseva et al., 2019). Substrate concentration dependency on the reaction rate at 50 pM of enzyme is shown in Figure 4.
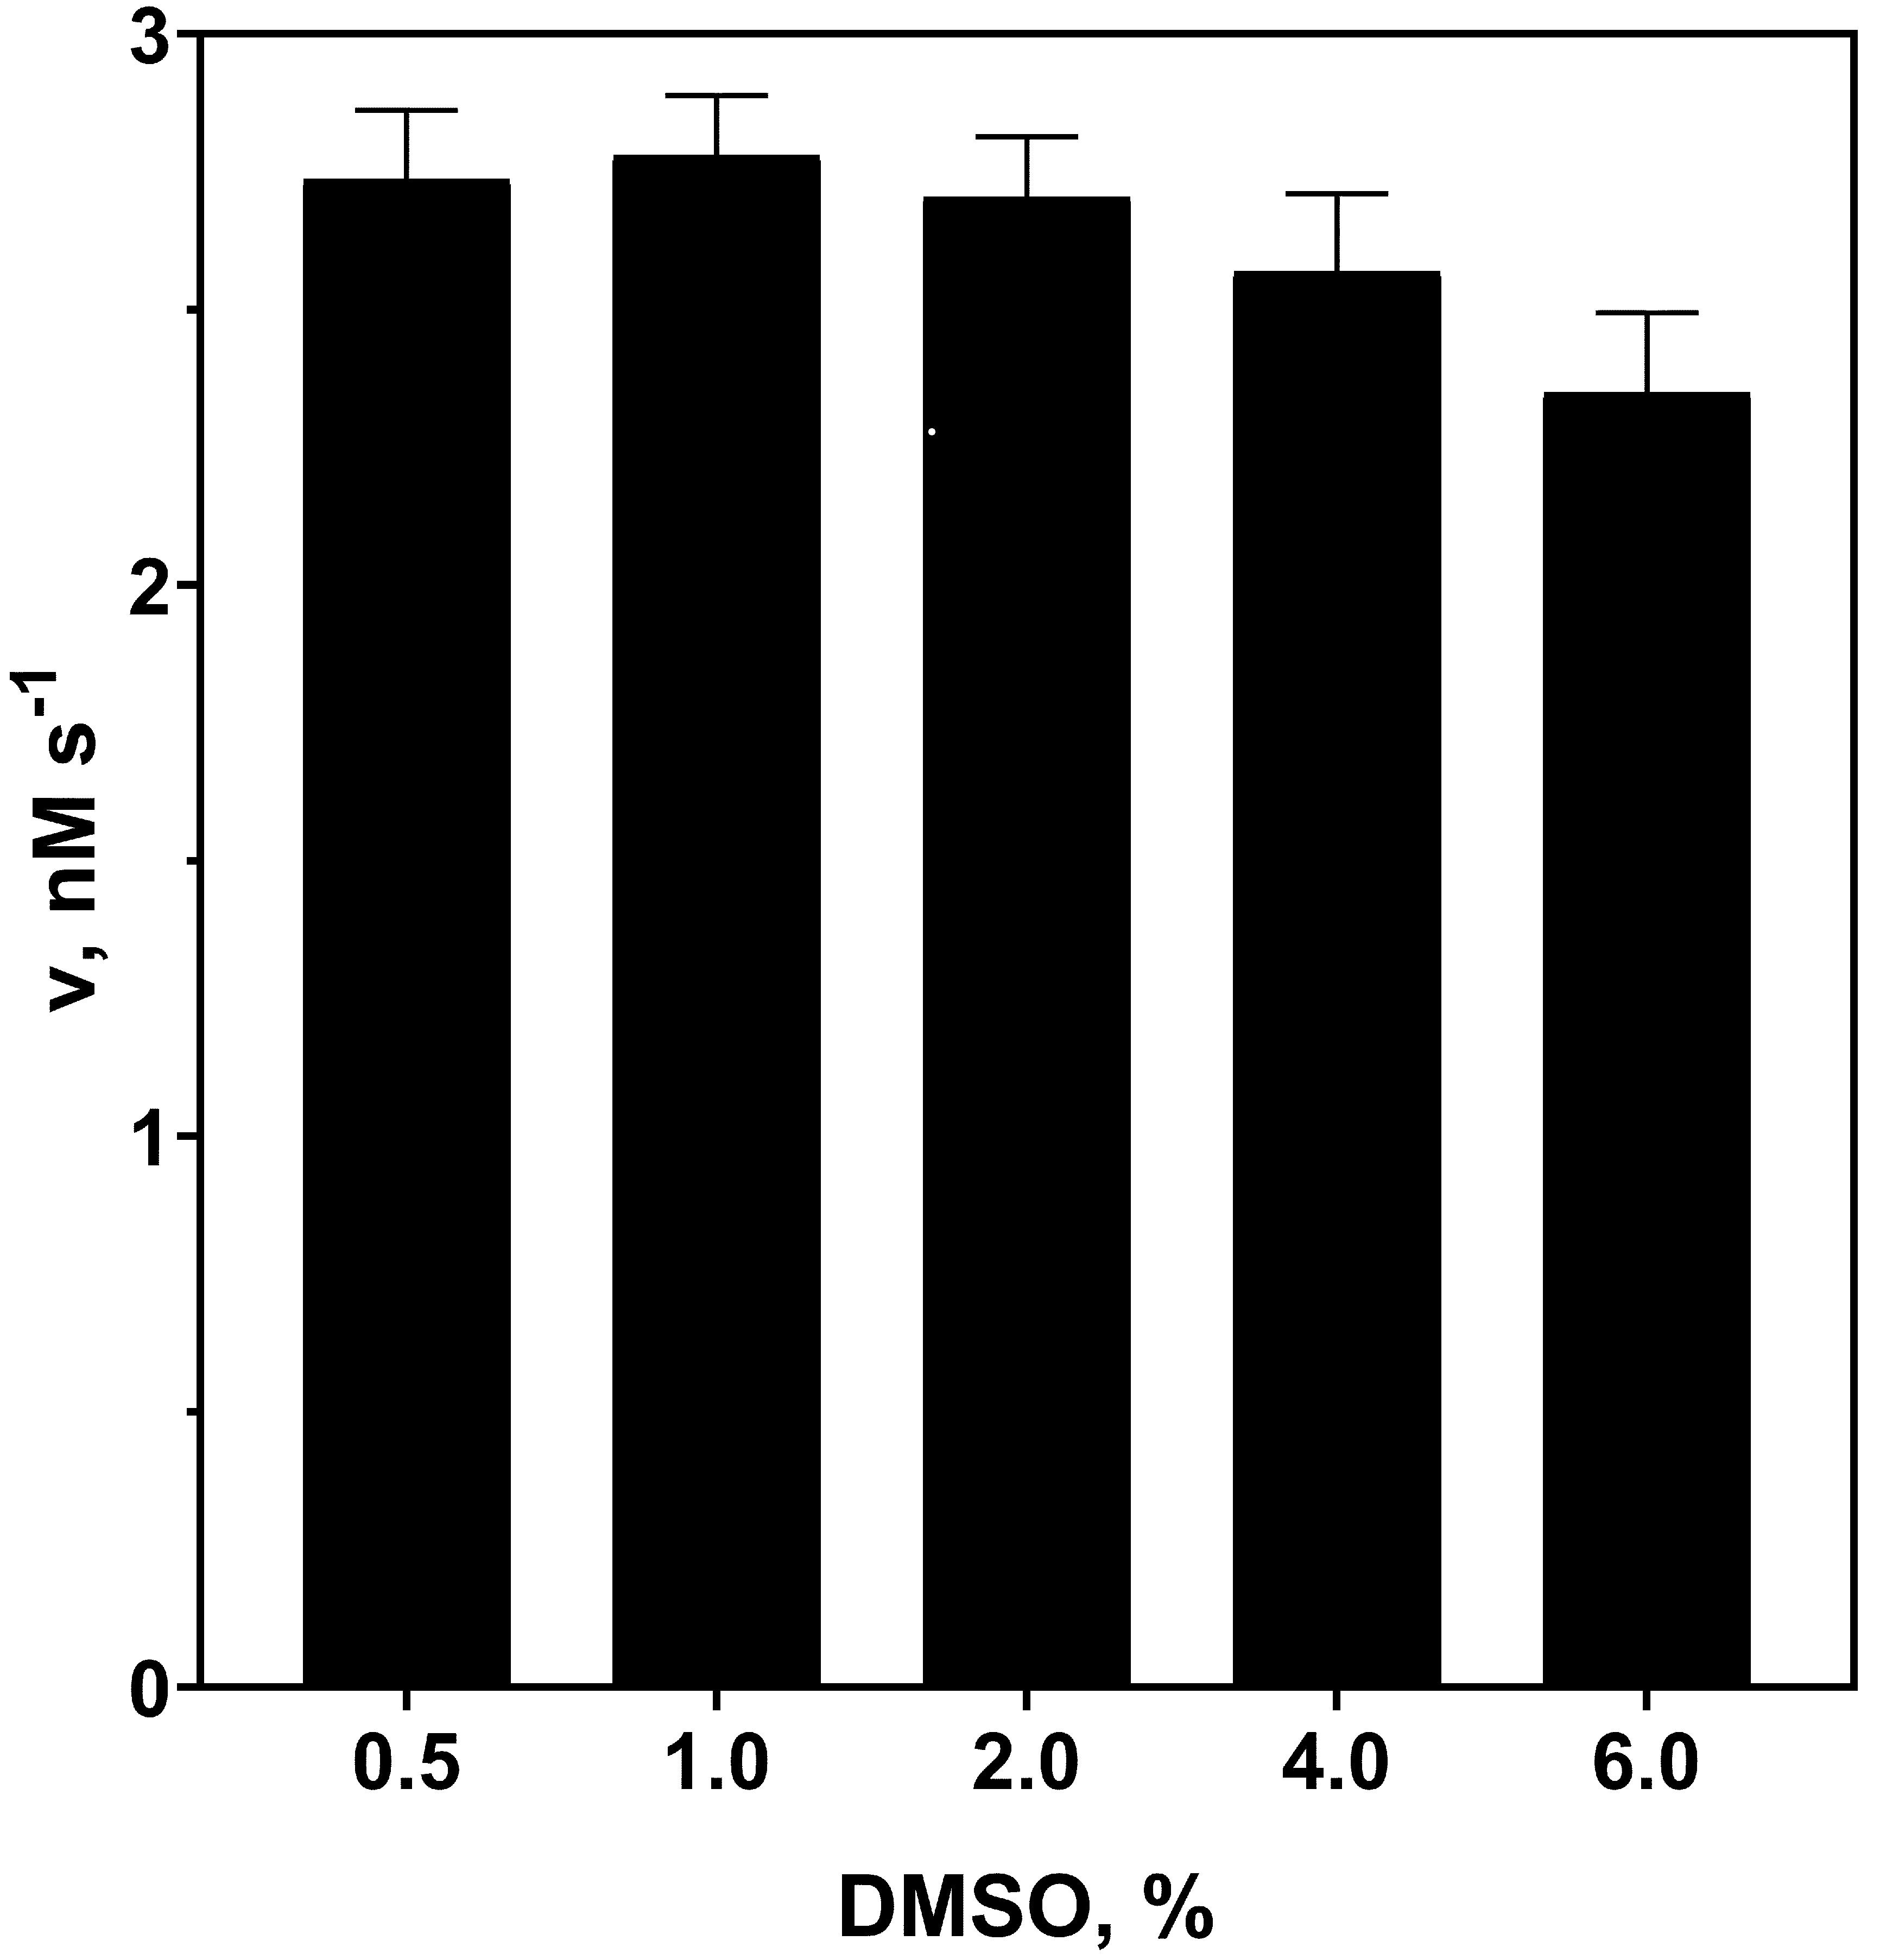
Figure 3. Effect of DMSO on Abz-RSVIK(Dnp) hydrolysis rate by protealysin. The Abz-RSVIK(Dnp) concentration is 16 μM; the protealysin concentration is 50 pM. The reactions were performed at 37 °C.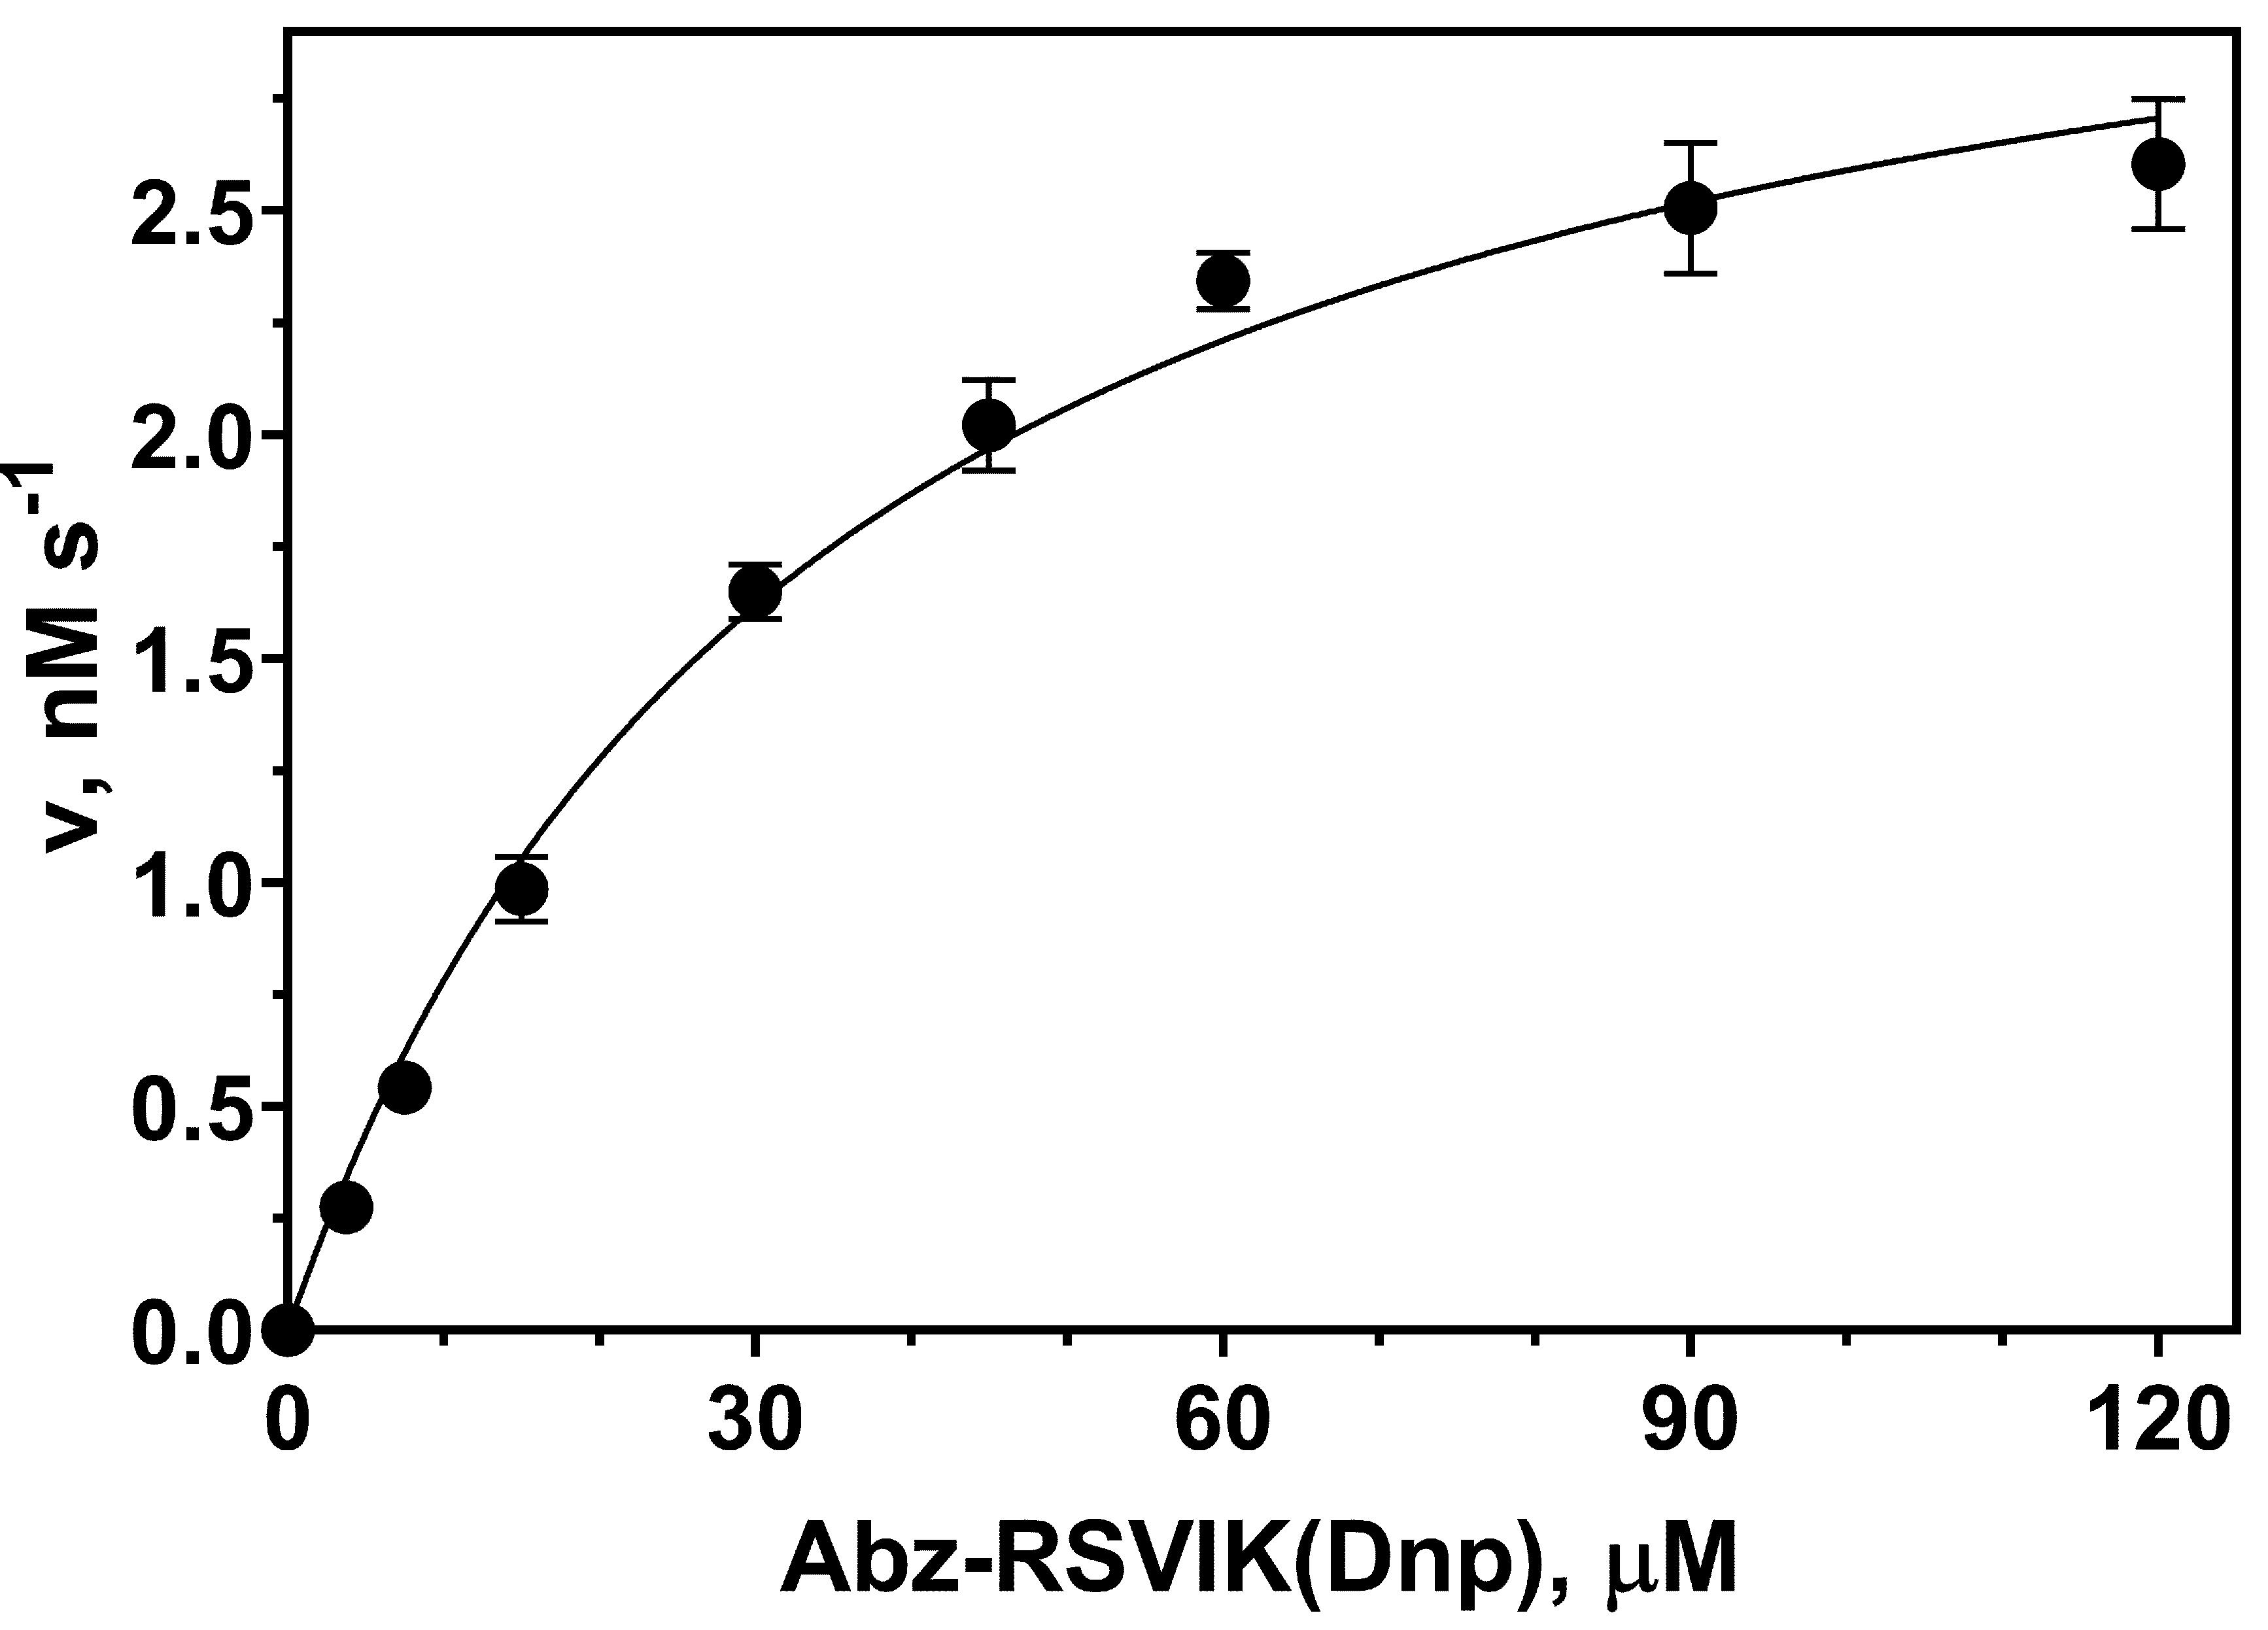
Figure 4. Michaelis–Menten saturation curve showing the relation between Abz-RSVIK(Dnp) concentration and the protealysin catalyzed reaction rate. The protealysin concentration is 50 pM. The reactions were performed at 37 °C.
Recipes
Assay buffer
50 mM Tris-HCl, pH 7.4
Mix 1.653 g of Tris-HCl and 0.242 g of Tris with 240 mL dH2O
Adjust pH to 7.4 with HCl
Add dH2O to 250 mL
Filter through a 0.20 μm membrane filter
Substrate stock solution
Dissolve 2 mg of substrate in 400 μL of DMSO. To obtain the required substrate concentrations, dilute the stock solution in the assay buffer. Centrifuge the resulting substrate solution at 10,000 × g for 10 min but do not transfer it to a new tube since substrate can absorb on plastic (Karaseva et al., 2019). Determine the substrate concentration by the absorbance of 2,4-dinitrophenyl at 365 nm using the extinction coefficient ϵ365nm = 1,7300 M1 cm-1 (Johanning et al., 1998). Keep substrate solution at room temperature during handling, prepare immediately before analysis, and do not store.
PLN and M4in solution
Take a small quantity of lyophilized protein (PLN or M4in) on the end of a pipette tip and dissolve in 200 μL of the assay buffer. Centrifuge the solution at 10,000 × g for 10 min and transfer to a new tube to remove undissolved fraction. Determine the concentration of the resulting solution by absorbance at 280 nm using the extinction coefficients for PLN (ϵ280nm = 52,370 M1cm1) and M4in (ϵ280nm = 10,810 M1cm1) (Chukhontseva et al., 2021; Karaseva et al., 2019). To obtain the required protein concentrations, dilute the solution in the assay buffer. Keep protein solutions at room temperature during handling.
Acknowledgments
The work was carried out using the equipment of the Center of Cellular and Gene Technology of the Institute of Molecular Genetics of the National Research Centre “Kurchatov Institute.” This work was supported by the Russian Science Foundation (project no. 22-24-00135). This protocol was adapted from previous work (Chukhontseva et al., 2021).
Competing interests
The authors declare no conflict of interest.
References
- Adekoya, O. A. and Sylte, I. (2009). The thermolysin family (M4) of enzymes: therapeutic and biotechnological potential.Chem Biol Drug Des 73(1): 7-16.
- Chukhontseva, K. N., Berdyshev, I. M., Safina, D. R., Karaseva, M. A., Bozin, T. N., Salnikov, V. V., Konarev, P. V., Volkov, V. V., Grishin, A. V., Kozlovskiy, V. I., et al. (2021). The protealysin operon encodes emfourin, a prototype of a novel family of protein metalloprotease inhibitors. Int J Biol Macromol 169: 583-596.
- Demidyuk, I. V., Gasanov, E. V., Safina, D. R. and Kostrov, S. V. (2008). Structural organization of precursors of thermolysin-like proteinases.Protein J 27(6): 343-354.
- Demidyuk, I. V., Gromova, T. Y. and Kostrov, S. V. (2013). Protealysin. Rawlings, N. D. and Salvesen, G. (Eds.) Handbook of Proteolytic Enzymes. 3rd edition. Academic Press, 507-602.
- Eshwar, A. K., Wolfrum, N., Stephan, R., Fanning, S. and Lehner, A. (2018). Interaction of matrix metalloproteinase-9 and Zpx in Cronobacter turicensis LMG 23827(T) mediated infections in the zebrafish model. Cell Microbiol 20(11): e12888.
- Feng, T., Nyffenegger, C., Hojrup, P., Vidal-Melgosa, S., Yan, K. P., Fangel, J. U., Meyer, A. S., Kirpekar, F., Willats, W. G. and Mikkelsen, J. D. (2014). Characterization of an extensin-modifying metalloprotease: N-terminal processing and substrate cleavage pattern of Pectobacterium carotovorum Prt1.Appl Microbiol Biotechnol 98(24): 10077-10089.
- Gromova, T. Y., Demidyuk, I. V., Kozlovskiy, V. I., Kuranova, I. P. and Kostrov, S. V. (2009). Processing of protealysin precursor.Biochimie 91(5): 639-645.
- Johanning, K., Juliano, M. A., Juliano, L., Lazure, C., Lamango, N. S., Steiner, D. F. and Lindberg, I. (1998). Specificity of prohormone convertase 2 on proenkephalin and proenkephalin-related substrates.J Biol Chem 273(35): 22672-22680.
- Karaseva, M. A., Chukhontseva, K. N., Lemeskina, I. S., Pridatchenko, M. L., Kostrov, S. V. and Demidyuk, I. V. (2019). An Internally Quenched Fluorescent Peptide Substrate for Protealysin. Sci Rep 9(1): 14352.
- Khaitlina, S., Bozhokina, E., Tsaplina, O. and Efremova, T. (2020). Bacterial Actin-Specific Endoproteases Grimelysin and Protealysin as Virulence Factors Contributing to the Invasive Activities of Serratia.Int J Mol Sci 21(11): 4025.
- Tsaplina, O. A., Demidyuk, I., Artamonova, T., Khodorkovsky, M. and Khaitlina, S. (2020). Cleavage of the outer membrane protein OmpX by protealysin regulates Serratia proteamaculans invasion. FEBS Lett 594(19): 3095-3107.
- Tsaplina, O. A., Efremova, T., Demidyuk, I. and Khaitlina, S. (2012). Filamentous actin is a substrate for protealysin, a metalloprotease of invasive Serratia proteamaculans. FEBS J 279(2): 264-274.
Article Information
Copyright
© 2022 The Authors; exclusive licensee Bio-protocol LLC.
How to cite
Berdyshev, I. M., Karaseva, M. A. and Demidyuk, I. V. (2022). Assay for Protealysin-like Protease Inhibitor Activity . Bio-protocol 12(19): e4528. DOI: 10.21769/BioProtoc.4528.
Category
Microbiology > Microbial biochemistry > Protein > Activity
Drug Discovery > Drug Screening
Biochemistry > Protein > Activity
Do you have any questions about this protocol?
Post your question to gather feedback from the community. We will also invite the authors of this article to respond.