- Protocols

- Articles and Issues
- For Authors
- About
- Become a Reviewer

Analysis of Lipid-linked Oligosaccharides Synthesized in vivo in Schizosaccharomyces pombe
(*contributed equally to this work) Published: Vol 12, Iss 18, Sep 20, 2022 DOI: 10.21769/BioProtoc.4508 Views: 2268
Reviewed by: Anonymous reviewer(s)
Original research article
The authors used this protocol in:
Mar 2022
Advertisement


Protocol Collections
Comprehensive collections of detailed, peer-reviewed protocols focusing on specific topics


![[2-<sup>3</sup>H]Mannose-labeling and Analysis of N-linked Oligosaccharides](https://en-cdn.bio-protocol.org/imageup/arcimg/20170718074630401.jpg?t=1774354755)
Abstract
Dolichol diphosphate-linked oligosaccharides (LLO) are the sugar donors in N-glycosylation, a fundamental protein post-translational modification of the eukaryotic secretory pathway. Defects in LLO biosynthesis produce human Congenital Disorders of Glycosylation Type I. The synthesis of LLOs and the transfer reactions to their protein acceptors is highly conserved among animal, plant, and fungi kingdoms, making the fission yeast Schizosaccharomyces pombe a suitable model to study these processes. Here, we present a protocol to determine the LLO patterns produced in vivo by S. pombe cells that may be easily adapted to other cell types. First, exponentially growing cultures are labeled with a pulse of [14C]-glucose. LLOs are then purified by successive extractions with organic solvents, and glycans are separated from the lipid moieties in mild acid hydrolysis and a new solvent extraction. The purified glycans are then run on paper chromatography. We use a deconvolution process to adjust the profile obtained to the minimal number of Gaussian functions needed to fit the data and determine the proportion of each species with respect to total glycan species present in the cell. The method we provide here might be used without any expensive or specialized equipment. The deconvolution process described here might also be useful to analyze species in non-completely resolved chromatograms.
Graphical abstract:
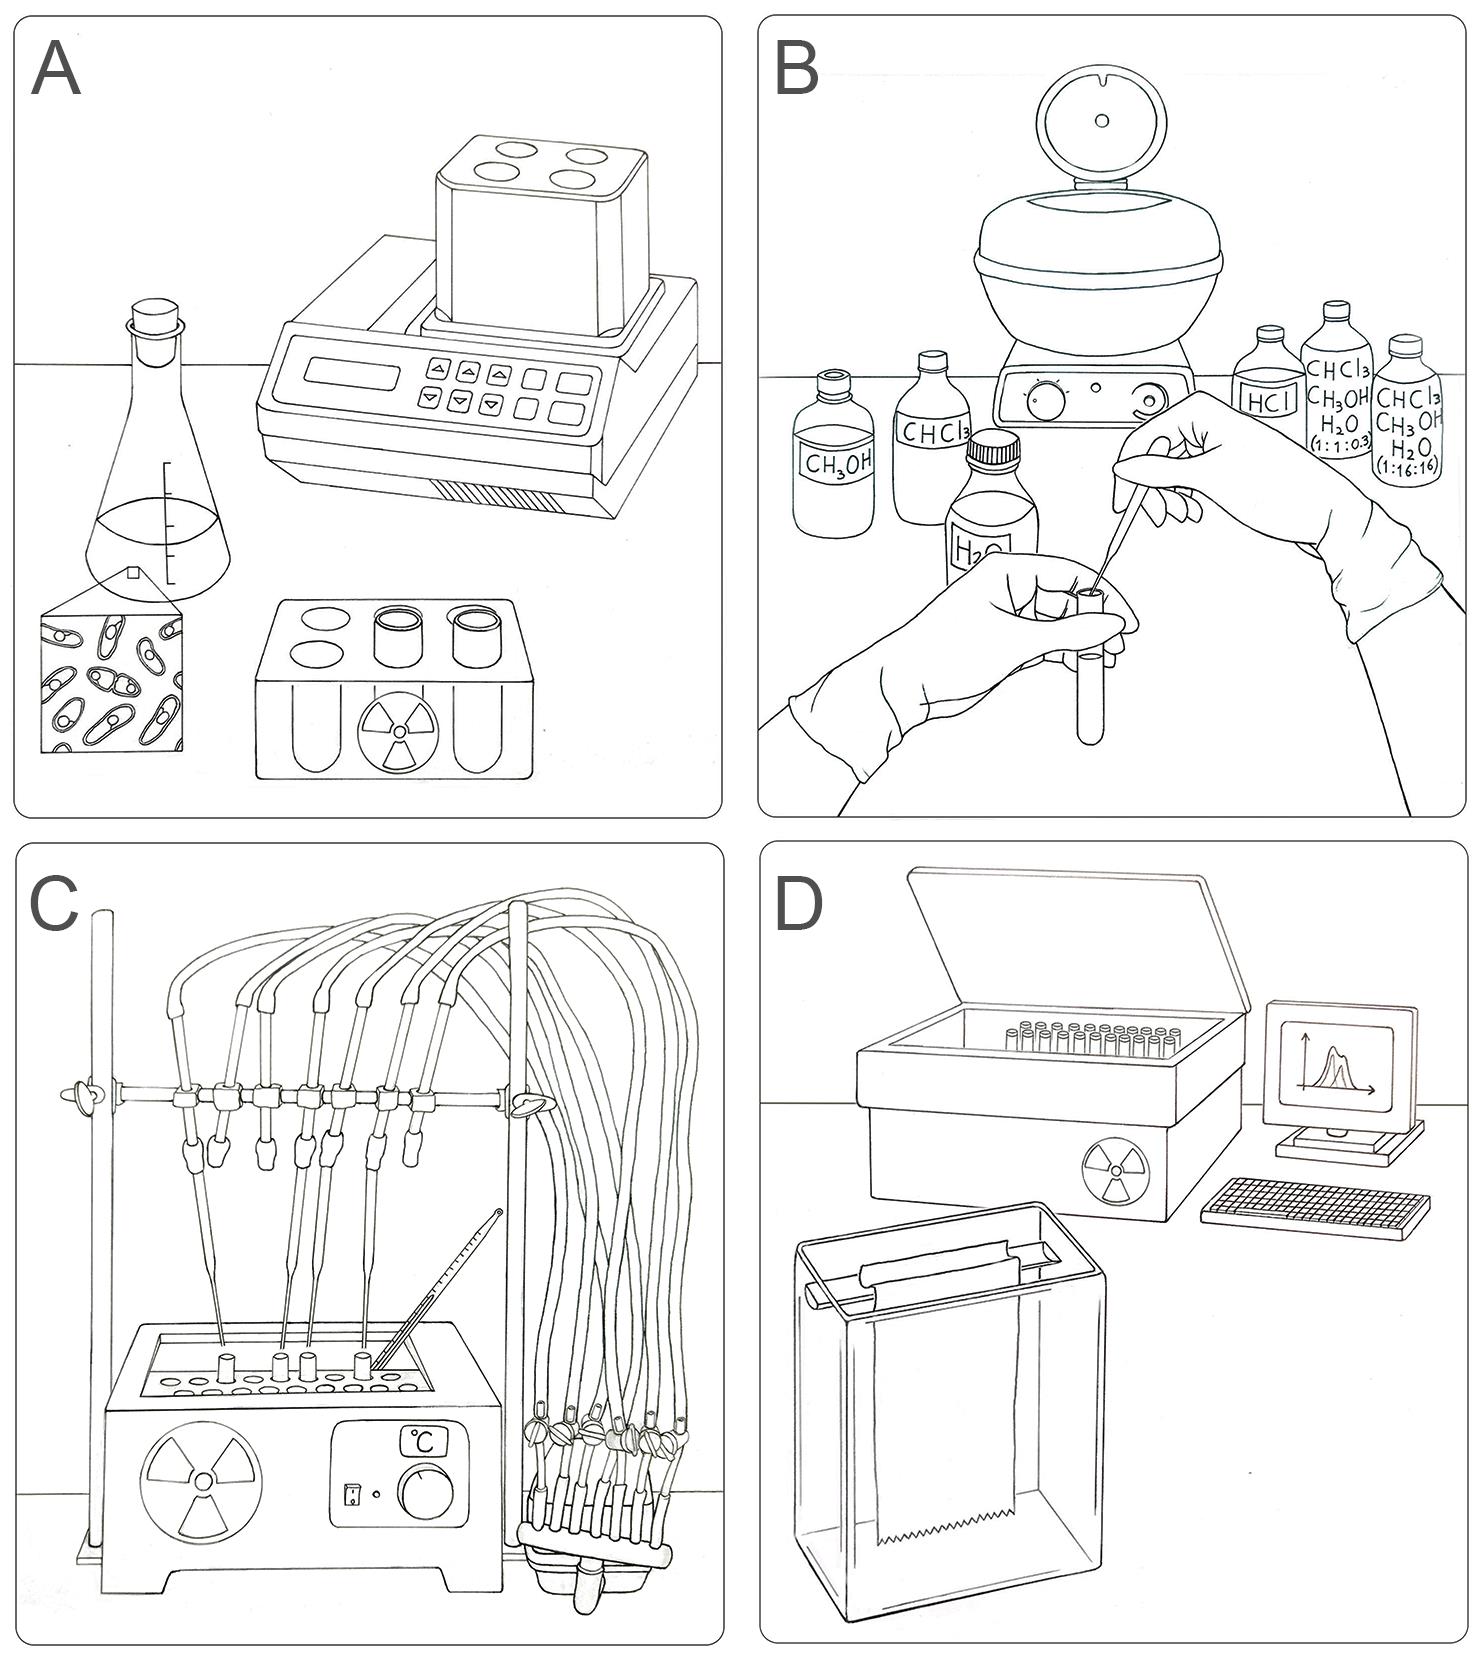
Workflow for the labeling, extraction, separation, and identification of LLO species in S. pombe. (A) Radioactive pulse of S. pombe cells with [14C]-glucose for 15 min at 28 °C. (B) Organic extraction of LLOs from labeled yeasts sequentially using methanol, chloroform, H2O, chloroform:methanol:H2O (1:1:0.3), 0.02 M HCl (to separate glycans from dolichol), and chloroform:methanol:H2O (1:16:16). (C) Preparation of the sample for chromatography on paper: drying by airflow and radioactivity check. (D) Loading of samples in chromatographic paper and descendent chromatography in a glass chamber. The obtained plots (CPM versus running distance) need to be analyzed to identify single glycan species.
Background
N-glycosylation is a frequent post-translational modification in the secretory pathway of eukaryotic cells involved in glycoprotein folding in the endoplasmic reticulum (ER). During N-glycosylation, a glycan composed of three glucoses (Glc), nine mannoses (Man), and two N-acetyl glucosamines (G3M9) is transferred in a single reaction step from a dolichol diphosphate oligosaccharide (LLO) donor to a consensus sequence present in proteins entering the ER (Cali et al., 2008). The reaction is catalyzed by the oligosaccharyltransferase (OST), which discriminates among completed and non-completed LLOs. The LLOs are synthesized stepwise in the ER membrane by different ALG gene products, first in the cytosolic side and then in the luminal side of the ER membrane (Figure 1) (Aebi, 2013; Stanley et al., 2015). Defects in LLOs synthesis result in their poor recognition by OST and thus less efficient transfer to proteins, leaving empty some normally occupied N-glycosylation sites. This hypoglycosylation of proteins may have profound effects in the cell and lead to several different Congenital Disorders of Glycosylation (CDG) type I (Ondruskova et al., 2021). These diseases are difficult to diagnose. The first confirmation usually arrives when hypoglycosylation is observed in serum transferrin, and a defect in LLO synthesis is assumed. To know which ALG genes are defective in each patient, either the biochemical analysis of LLO or a whole exome sequencing are required (Chang et al., 2018; Ng and Freeze, 2018; Wilson and Matthijs, 2021). The core machinery of LLO synthesis and N-glycosylation is highly conserved among eukaryotic species (Aebi, 2013), particularly between the fission yeast Schizosaccharomyces pombe and mammals (Fernandez et al., 1994). S. pombe is easily handled, facilities required for its growth and maintenance are inexpensive, and many biochemical and genetic tools are already developed for this organism. For these reasons, S. pombe has become a suitable model organism for research, and several molecular tools developed and optimized for use in this model organism have been used in mammalian cells (Hagan, 2016).
We present here a detailed protocol to specifically identify the LLO species synthesized in S. pombe in vivo. The key step of the protocol is to stop protein synthesis with inhibitors preventing glycan transfer to proteins while radioactive labeled LLOs are being synthesized. Cultures are compared under similar nutritional growth conditions, in order to avoid differences in LLO structures due to environmental conditions or metabolic constraints (Gershman and Robbins, 1981; Chapman and Calhoun, 1988). We then extract LLOs from the labeled cells and analyze them either by HPLC or by paper chromatography. To better identify the peaks obtained, we developed a deconvolution process using a Gaussian function available in a Microsoft Excel Solver datasheet provided here. This method allows a better visualization of the peaks, making them easily comparable with the standards run in parallel, and provides an accurate quantification of each peak. With the protocol described here, we were able to distinguish the LLOs produced in 16 S. pombe strains that synthesize combinatorial possible structures of LLOs (GXMY, where X is the number of Glc residues in the glycan, ranging from three to zero, and Y is the number of Man units, ranging from nine to five) (Gallo et al., 2022). This low-cost method has the advantages of being readily available for almost all laboratories, providing high accuracy, and being easily adapted to any cell type, simplifying the determination of the LLO biosynthetic step blocked in a particular cell mutant or synthesized by the organism being studied. Moreover, the method we provide to obtain the deconvolution of the LLO profiles may be used for other chromatographic resolutions.
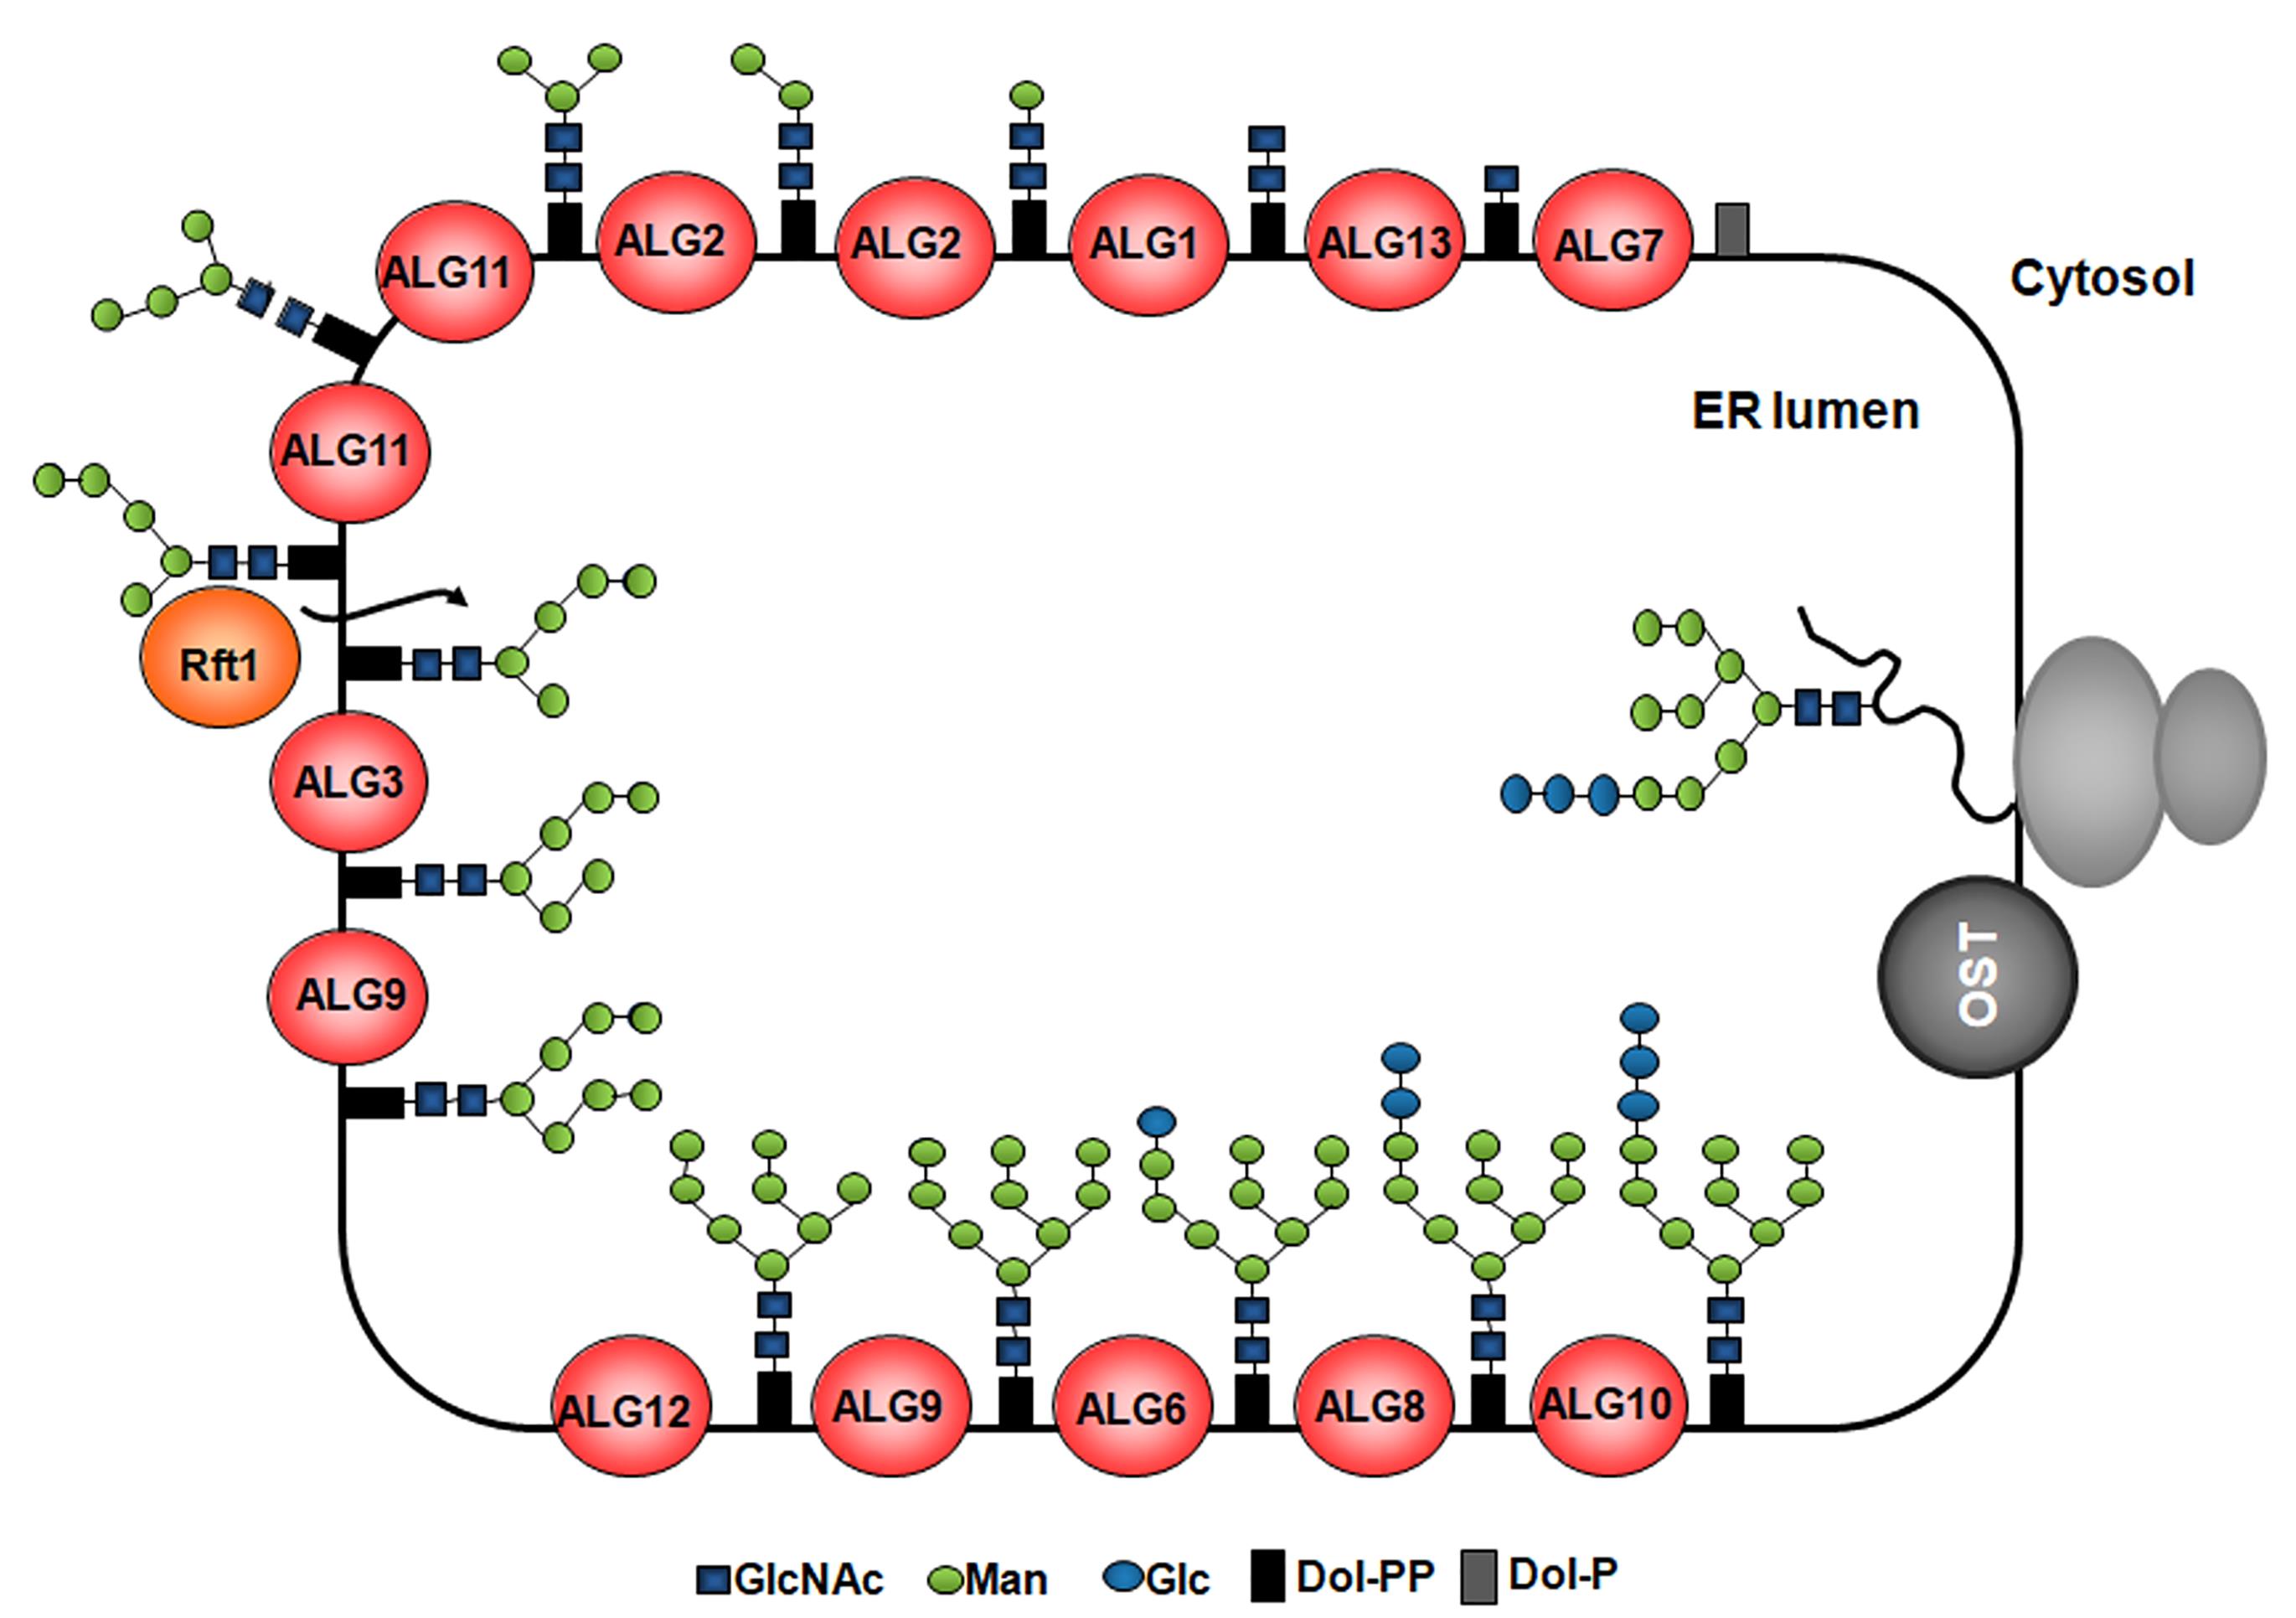
Figure 1. Synthesis of LLOs and glycan transfer to nascent proteins in the ER. The G3M9 LLO is built in the ER membrane step-by-step by monosaccharide addition mediated by specific glycosyltransferases encoded by alg (asparagine-linked glycosylation) genes. Two N-acetylglucosamines and five Man are transferred to the dolichol from nucleotide-sugars on the cytoplasmic side of the ER membrane. Then, the LLO intermediate bearing five Man residues is flipped to the ER lumen, where four additional Man residues are added by the ALG3-, ALG9-, and ALG12-encoded ER luminal dolichol-dependent mannosyltransferases. Finally, three Glc residues are incorporated by the ALG6-, ALG8-, and ALG10-encoded dolichol-dependent glucosyltransferases. Once completed, the LLO is transferred by OST to nascent polypeptides entering the ER through the translocon.
Materials and Reagents
Materials
Conical tubes, 50 mL (Biologix, catalog number: 10-9502)
Polypropylene centrifuge bottle with Screw-On Cap, 250 mL (Beckman Coulter, catalog number: 356011)
Polypropylene centrifuge bottle with Screw-On Cap, 50 mL (Beckman Coulter, catalog number: 357003)
Metal spatula
Glass beads 0.5 mm diameter (Millipore Sigma, Sigma, catalog number: G8772)
Glass tubes (Kimax, catalog number: 45048)
Glass eyedropper
Chromatography paper sheets (Sartorius Stedim FN3 580 × 600 mm)
Scintillation 20 mL glass counting vials (Wheaton, catalog number: 986532)
Reagents
Yeast extract (BactoTM, catalog number: 212750), store at room temperature (RT)
Adenine (Millipore Sigma, Sigma, catalog number: A8626), store at RT
Yeast nitrogen base (YNB) (Thermo Fisher Scientific, BD Difco, catalog number: DF0392-15-9), store at RT
Puromycin 10 mg/mL (InvivoGen, catalog number: ant-pr-1), store at 4 °C
Cycloheximide 2 mg/mL (Millipore Sigma, catalog number: C-6255), store at -20 °C
D-[14C(U)]-Glc (Perkin Elmer, catalog number: NEC042V20UC), store at 4 °C
Glucose 1 M (Dextrose 1-hydrate, Biopack, catalog number: 9812.08), store at RT
Methanol 99.9% (Millipore Sigma, Merck, catalog number: 106009), store at RT
Chloroform (Merck, catalog number: 107024), store at RT
1-propanol 98% (Millipore Sigma, Merk, catalog number: 100997), store at RT
Nitromethane (Millipore Sigma, catalog number: 270423), store at RT
Hydrochloric acid fuming 37% for analysis (Merck, catalog number: 1003171000)
PPO-POPOP scintillation cocktail (concentrated scintillator PPO-POPOP, RPI, catalog number: 111045)
Milli Q water
Yeast extract medium supplemented with adenine (YEA) (see Recipes)
Yeast nitrogen base (YNB) without glucose (see Recipes)
Radioactive solution to label a 500 μL sample (see Recipes)
Chloroform:methanol:water (1:1:0.3) (see Recipes)
Chloroform:methanol:water (1:16:16) (see Recipes)
0.02 N HCl (see Recipes)
Equipment
1 L glass flask
Orbital shaker (for flasks) set at 28 °C (Forma Scientific, model: 4581)
OD600 reader (Amersham Biosciences, model: Ultraspec 10)
Centrifuge (Beckman Avanti) with rotors JA-14 and JA-20
Thermomixer set at 28 °C (Thermo-shaker, mrc)
Water bath (Vicking SRL)
Airflow (Aquarium air pump RS-Electric, model: RS-15000)
Analog benchtop centrifuge (Rolco)
Vortex (Scientific Industries, model: Vortex-genie 2)
Freezer -20 °C (KENT)
Glass chromatography chamber (Homemade)
Scintillation counter (Pharmacia, RackBeta 1214/1219)
NOTE: The equipment described here may easily be replaced for common lab equipment of other brands.
Software
Microsoft Excel (version 2016) (Microsoft.com)
Procedure
In vivo labeling of LLOs
Harvesting S. pombe cells (4 h)
Inoculate a 50 mL Falcon tube containing 5 mL of sterile YEA medium with an isolated colony of the desired S. pombe strain. Grow overnight at 28 °C and 250 rpm in an orbital shaker.
The following morning inoculate 250 mL of sterile YEA in a 1 L glass flask with 1 mL of the overnight S. pombe culture.
Grow at 28 °C and 250 rpm until reaching the exponential growth phase (OD = 1–1.5). The time may vary depending on the strain.
Centrifuge 200 mL of the grown culture in 250 mL centrifuge bottles at 3,000 × g and 4 °C for 5 min.
Discard the supernatant.
Resuspend the pellet in 30 mL of cold 1% YNB. In this step, it is convenient to first resuspend the cells in 10 mL of ice-cold YNB using a 10 mL glass pipette and a pipette aid, and then add the remaining 20 mL.
Transfer the 30 mL sample to a 50 mL centrifuge bottle tube previously weighed. Keep it on ice. Weighing the tubes will be important later to calculate the wet mass of cells.
Centrifuge at 3,000 × g and 4 °C for 5 min and discard the supernatant.
Resuspend the pellet in 30 mL of YNB as described in step A6 and centrifuge as in step A8.
Discard the supernatant. Remove the remaining drops by placing the tube face down over a tissue paper.
Wash the pellet again with YNB by repeating steps A9–A10.
Weigh the tube with the pellet and calculate the wet mass of cells by subtracting the weight of each empty tube. Add two volumes of cold YNB per gram of cells (v/w). If you have 0.5 g of wet weight, you should add 1 mL of media. Resuspend cells with a pipette.
Take 500 μL of the cell suspension and place it into a new 50 mL centrifuge bottle, where the labeling will be performed.
Preparing reagents for radioactive pulse (15–30 min)
Add 200 μCi of [14C]-glucose per sample in a glass tube within a chemical hood and dry by exposure to a constant airflow at room temperature. Follow the approved procedures to manipulate radioactive liquids in your institution.
Once dried, solubilize the radioactive material in 50 μL of YNB containing 50 mM Glc (see Recipe 3).
Yeast cells labeling (20 min)
Add the protein synthesis inhibitors puromycin and cycloheximide to the 500 μL cell suspension from step A13 to reach final concentrations of 50 μg/mL and 70 μg/mL, respectively. Incubate tubes for 2 min at 28 °C.
Add the entire radioactive solution to the cell suspension. Incubate the sample at 28 °C for 15 min at 200 rpm using a thermomixer.
Stop the pulse by transferring all the cells to a glass tube containing 5 mL methanol.
Extraction of LLOs
Notes:
This step will take 6 h the first day and 4 h the next day if the protocol is interrupted at step 19; alternatively, 10 h if it is entirely performed on the same day.
Extraction of LLOs follows the following rationale: these compounds have both large hydrophilic and hydrophobic moieties. Thus, they are insoluble in solvents as chloroform:methanol (3:2), which is poorly hydrophilic but able to solubilize phospholipids, or in methanol or water, which are poorly hydrophobic but able to solubilize water-soluble metabolites. On the contrary, chloroform:methanol:water (1:1:0.3) is a single-phase solvent that displays both hydrophilic and hydrophobic features and thus is able to extract dolichol-linked oligosaccharides.
Centrifuge the glass tube at 2,000 × g for 3 min at room temperature and discard the supernatant carefully.
Notes:
All the following centrifugation steps of Procedure D should be performed under these same conditions.
Follow institutional rules to discard radioactive material.
Add 5 mL of chloroform:methanol (3:2) and resuspend the pellet completely by vortexing. This pellet is particularly tough to resuspend. To do so, it is convenient to place a small spatula in the tube at the moment of vortexing. The spatula must be actively kept inside the tube during the shaking of the sample. Remove the spatula from the tube after the pellet has been resuspended and leave it in a large beaker containing water until next use.
Repeat steps D1–D2 twice, completing three total extractions with chloroform:methanol (3:2).
Add 5 mL of methanol and resuspend the pellet as in step D2.
Centrifuge and discard the supernatant.
Finally, add 5 mL of Milli Q water and resuspend the pellet by vortexing, using the spatula to help.
Centrifuge and discard the supernatant.
Resuspend cells in 2 mL of ice-cold water and 0.5–1 mL of glass beads.
Vortex the sample for 10 min. Stop the vortexing every 1 min to put the sample on ice for 1 min and thus avoiding overheating.
Centrifuge.
Add Milli Q water to complete a volume of 5 mL.
Centrifuge and carefully discard the supernatant using an eyedropper.
Repeat four more times the water extraction steps D11–D12.
Add 5 mL of chloroform:methanol:water (1:1:0.3) and resuspend the pellet vigorously by vortexing.
Centrifuge.
Note: After centrifugation, it is common to see two phases in the supernatant instead of one. If this is the case, use an eyedropper to carefully add methanol drop by drop until observing just one phase.
Collect the supernatant in a new glass tube and start drying the sample using an airflow at room temperature. It is possible to accelerate the process by drying the supernatant at higher temperatures, placing the tube in a water bath under the air flow, without exceeding 40 °C (see Figure 2).
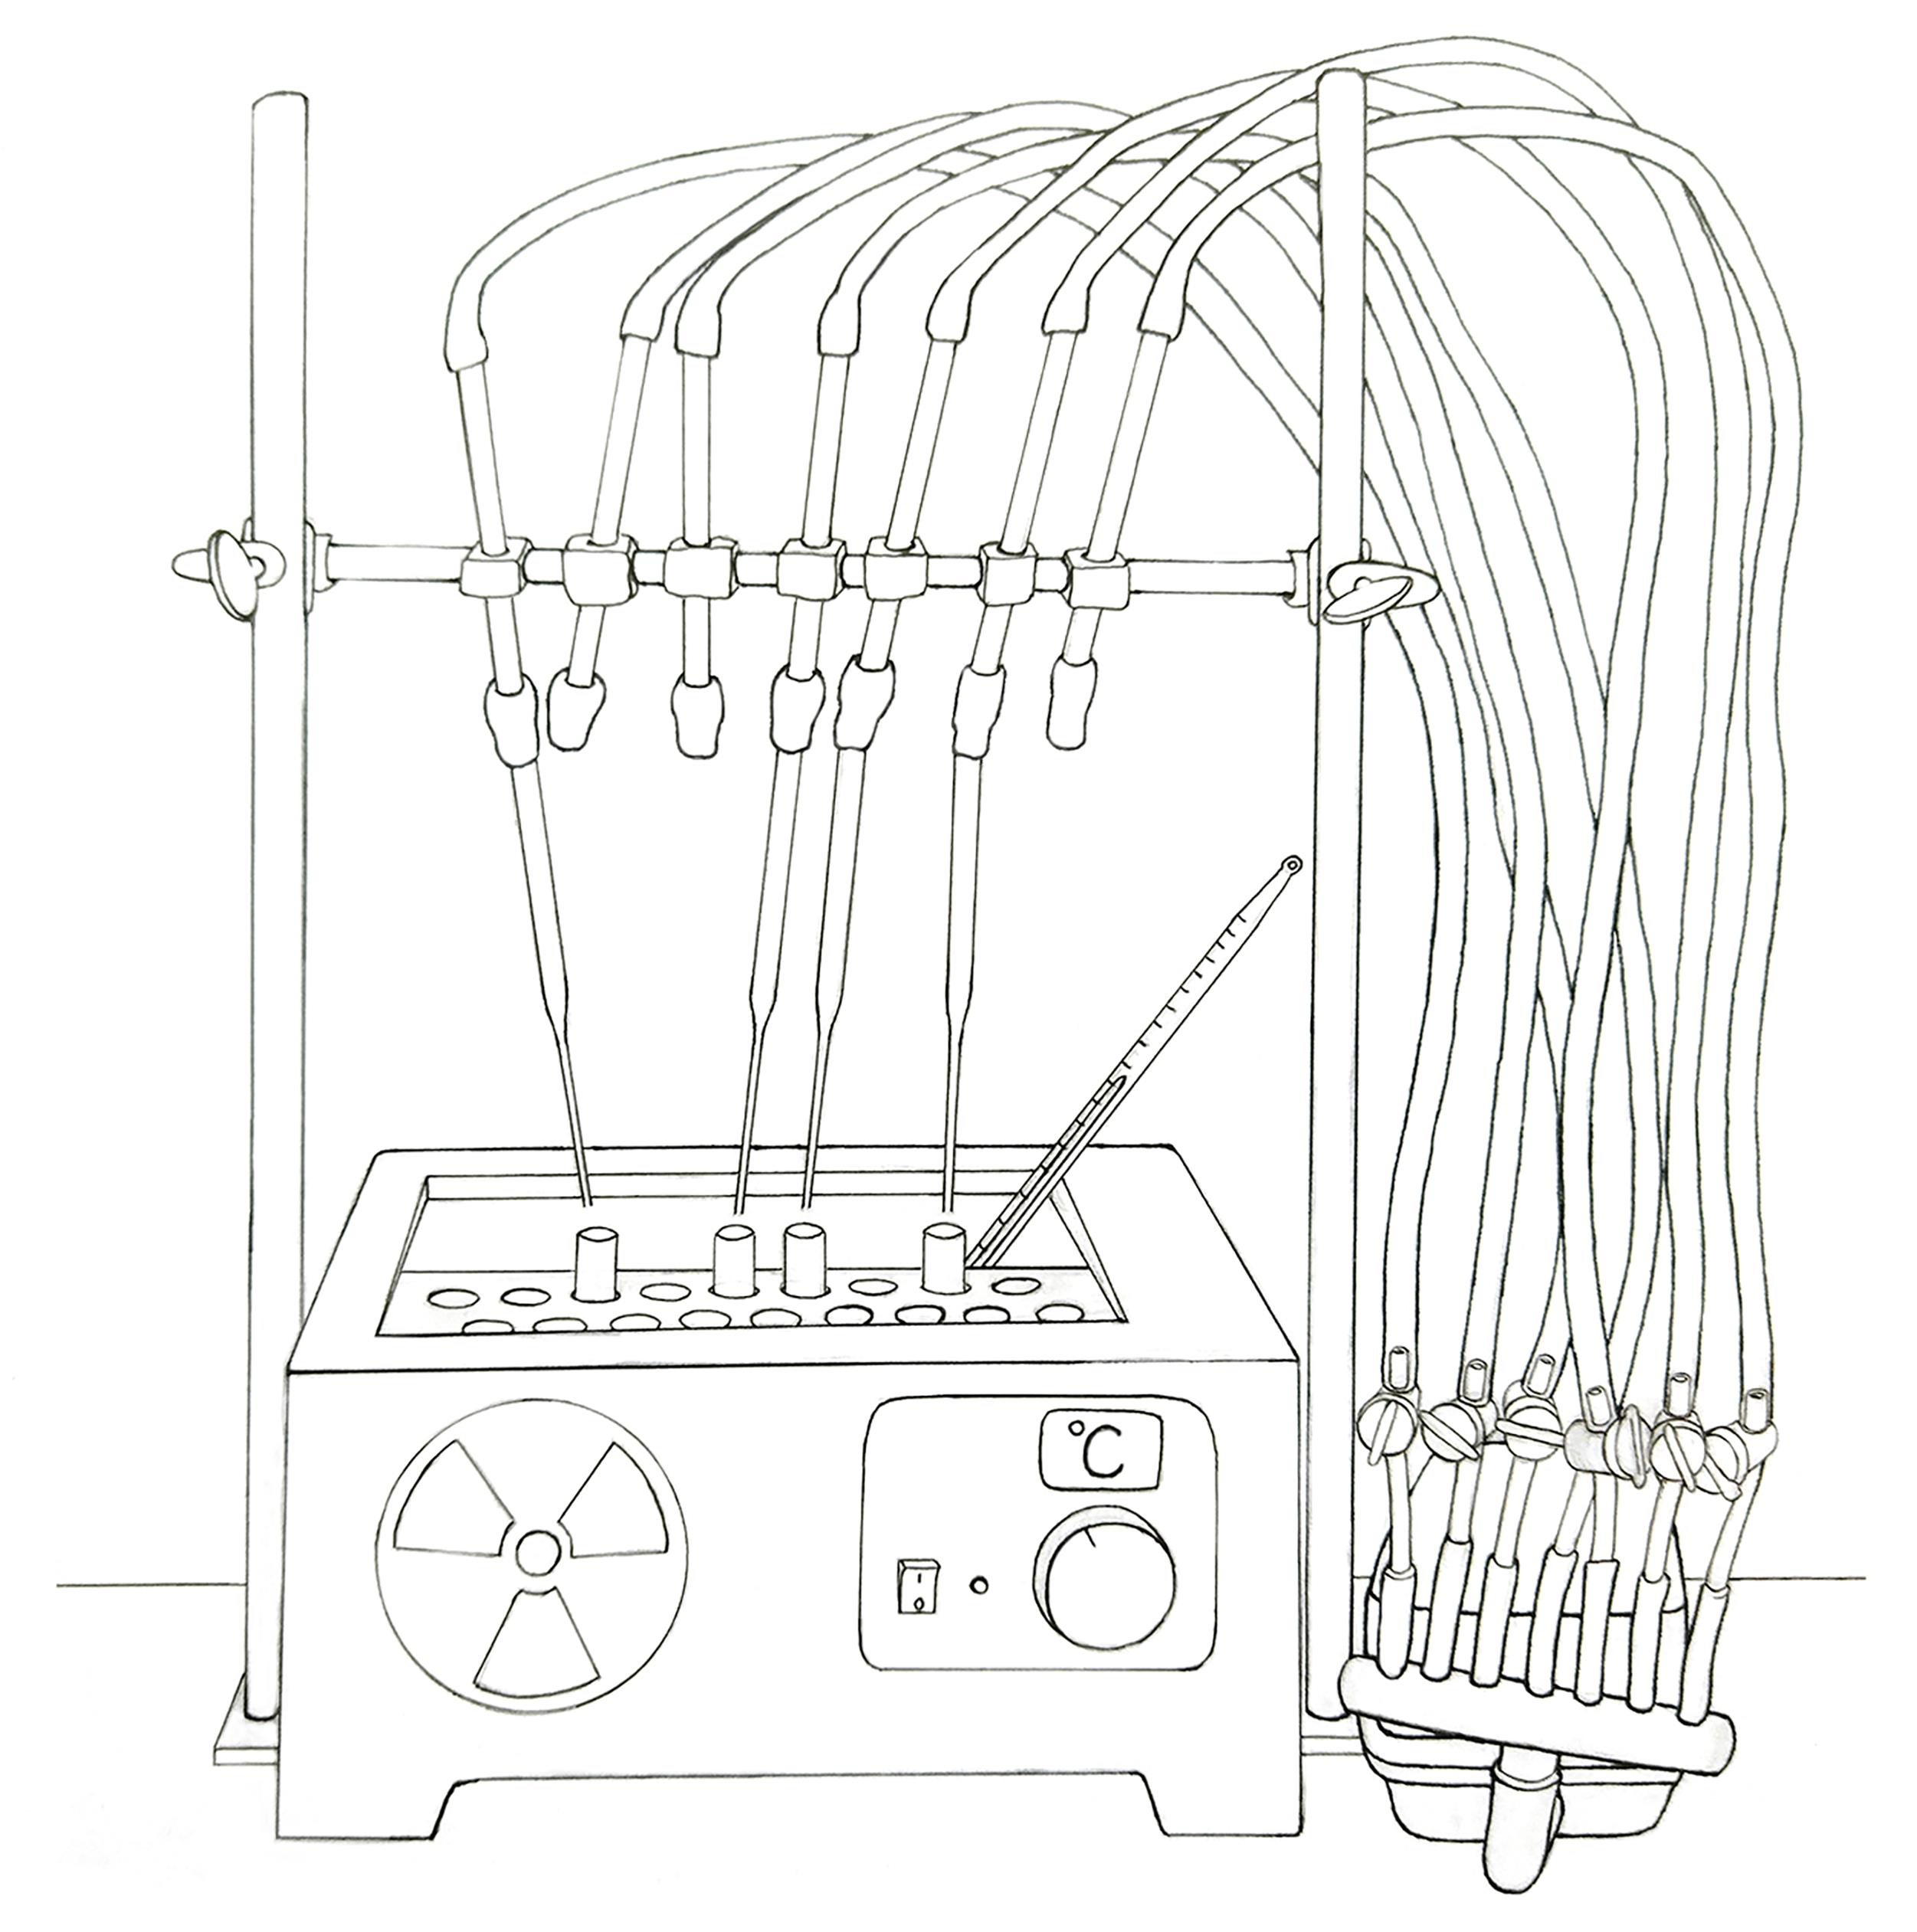
Figure 2. Schematic representation of the water bath and the adapted airflow used for drying samples. A commercial air pump for fish tanks was employed to supply airflow.In parallel, add 5 mL of chloroform:methanol:water (1:1:0.3) to the remaining pellet obtained in step D15 and mix it by vortexing. Centrifuge.
Collect this new supernatant using an eyedropper and pool it with the supernatant obtained in step D15 while it is being dried.
Repeat steps D16–D17 three more times. At the end of this extraction step, all the collected supernatants from a single sample will be pooled and dried in the same tube. If desired, it is possible to keep this final dried sample at -20 °C overnight and continue with the remaining steps the following day.
Add 1 mL of 0.02 M HCl to the dried extract and boil the sample for 15 min in a water bath. If the sample was frozen, leave at room temperature 5 min before boiling to avoid the fracture of the glass tube by temperature contrast.
Note: The acid hydrolysis step is necessary to separate glycans from dolichol moieties.
Put the boiled samples back at room temperature and wait for them to cool down.
Add sequentially 3 mL of chloroform and 2 mL of methanol to each sample and mix by vortexing.
Centrifuge.
After step D23, two phases will be formed. Recover the upper phase (water phase) in a new glass tube using an eyedropper whose tip has previously been bent upwards to avoid collecting any lower phase. Remove the water phase slowly and carefully, to avoid mixing the phases.
Start the drying of the water phase by exposure to a constant airflow at room temperature.
Wash the remaining lower phase by adding 1 mL of chloroform:methanol:water (1:16:16) previously prepared and centrifuge.
Collect once again the upper phase using an eyedropper with the bent tip and pool it with the previous water phase while it is being dried. Wait for the pooled samples to dry completely. It is possible to pause the protocol here by keeping the dried sample at -20 °C.
Chromatography (72–82 h)
Resuspend the dried sample in 52 μL of Milli Q water at room temperature.
Check if the sample has been properly labeled with the radioactive reagents by measuring a 2 μL aliquot in a counting vial and adding 1 mL of scintillation liquid. Measure the radioactivity using a scintillation counter. Check that the aliquot has more than 200–300 CPM.
Note: From this step, you may choose to analyze the samples by paper chromatography (protocol provided here) or by HPLC, as described in Stigliano et al. (2011).
Load the remaining 50 μL of the sample drop by drop on a chromatographic paper, as shown in Figure 3. Let the sample dry there before placing the paper within the chromatography chamber.
Run the sample by descending chromatography using 1-propanol:nitromethane:water (5:2:4). Approximately 50 mL of 1-propanol:nitromethane:water should be added to the chamber that holds the top of the paper (see Figure 3). Importantly, the run must be monitored at least once per day in order to prevent paper dryness. If required, add more solvent to the chamber. It is important to run in parallel (same paper) radioactive standards, as they will be used to identify the glycan species behind each peak (Figure 3). These standards can be obtained from a labeled chicken oviduct, as previously described by Parodi et al. (1981), or by purifying N-glycans from S. pombe strains of already known structures, as described in Fernandez et al. (1994). Once you perform this protocol and clearly identify the identity of pure peaks, you may also use those LLOs as standards. At 25 °C, a running time between 70 and 80 h would provide an optimal separation of the standard peaks, depending on the glycan species. To monitor the velocity of the chromatography, an additional standard sample can be run in parallel, on a different piece of chromatographic paper (external standard). Thus, this paper can be processed separately to obtain the position of the reference peaks at time 48 h and, based on that, decide when to stop the main running.
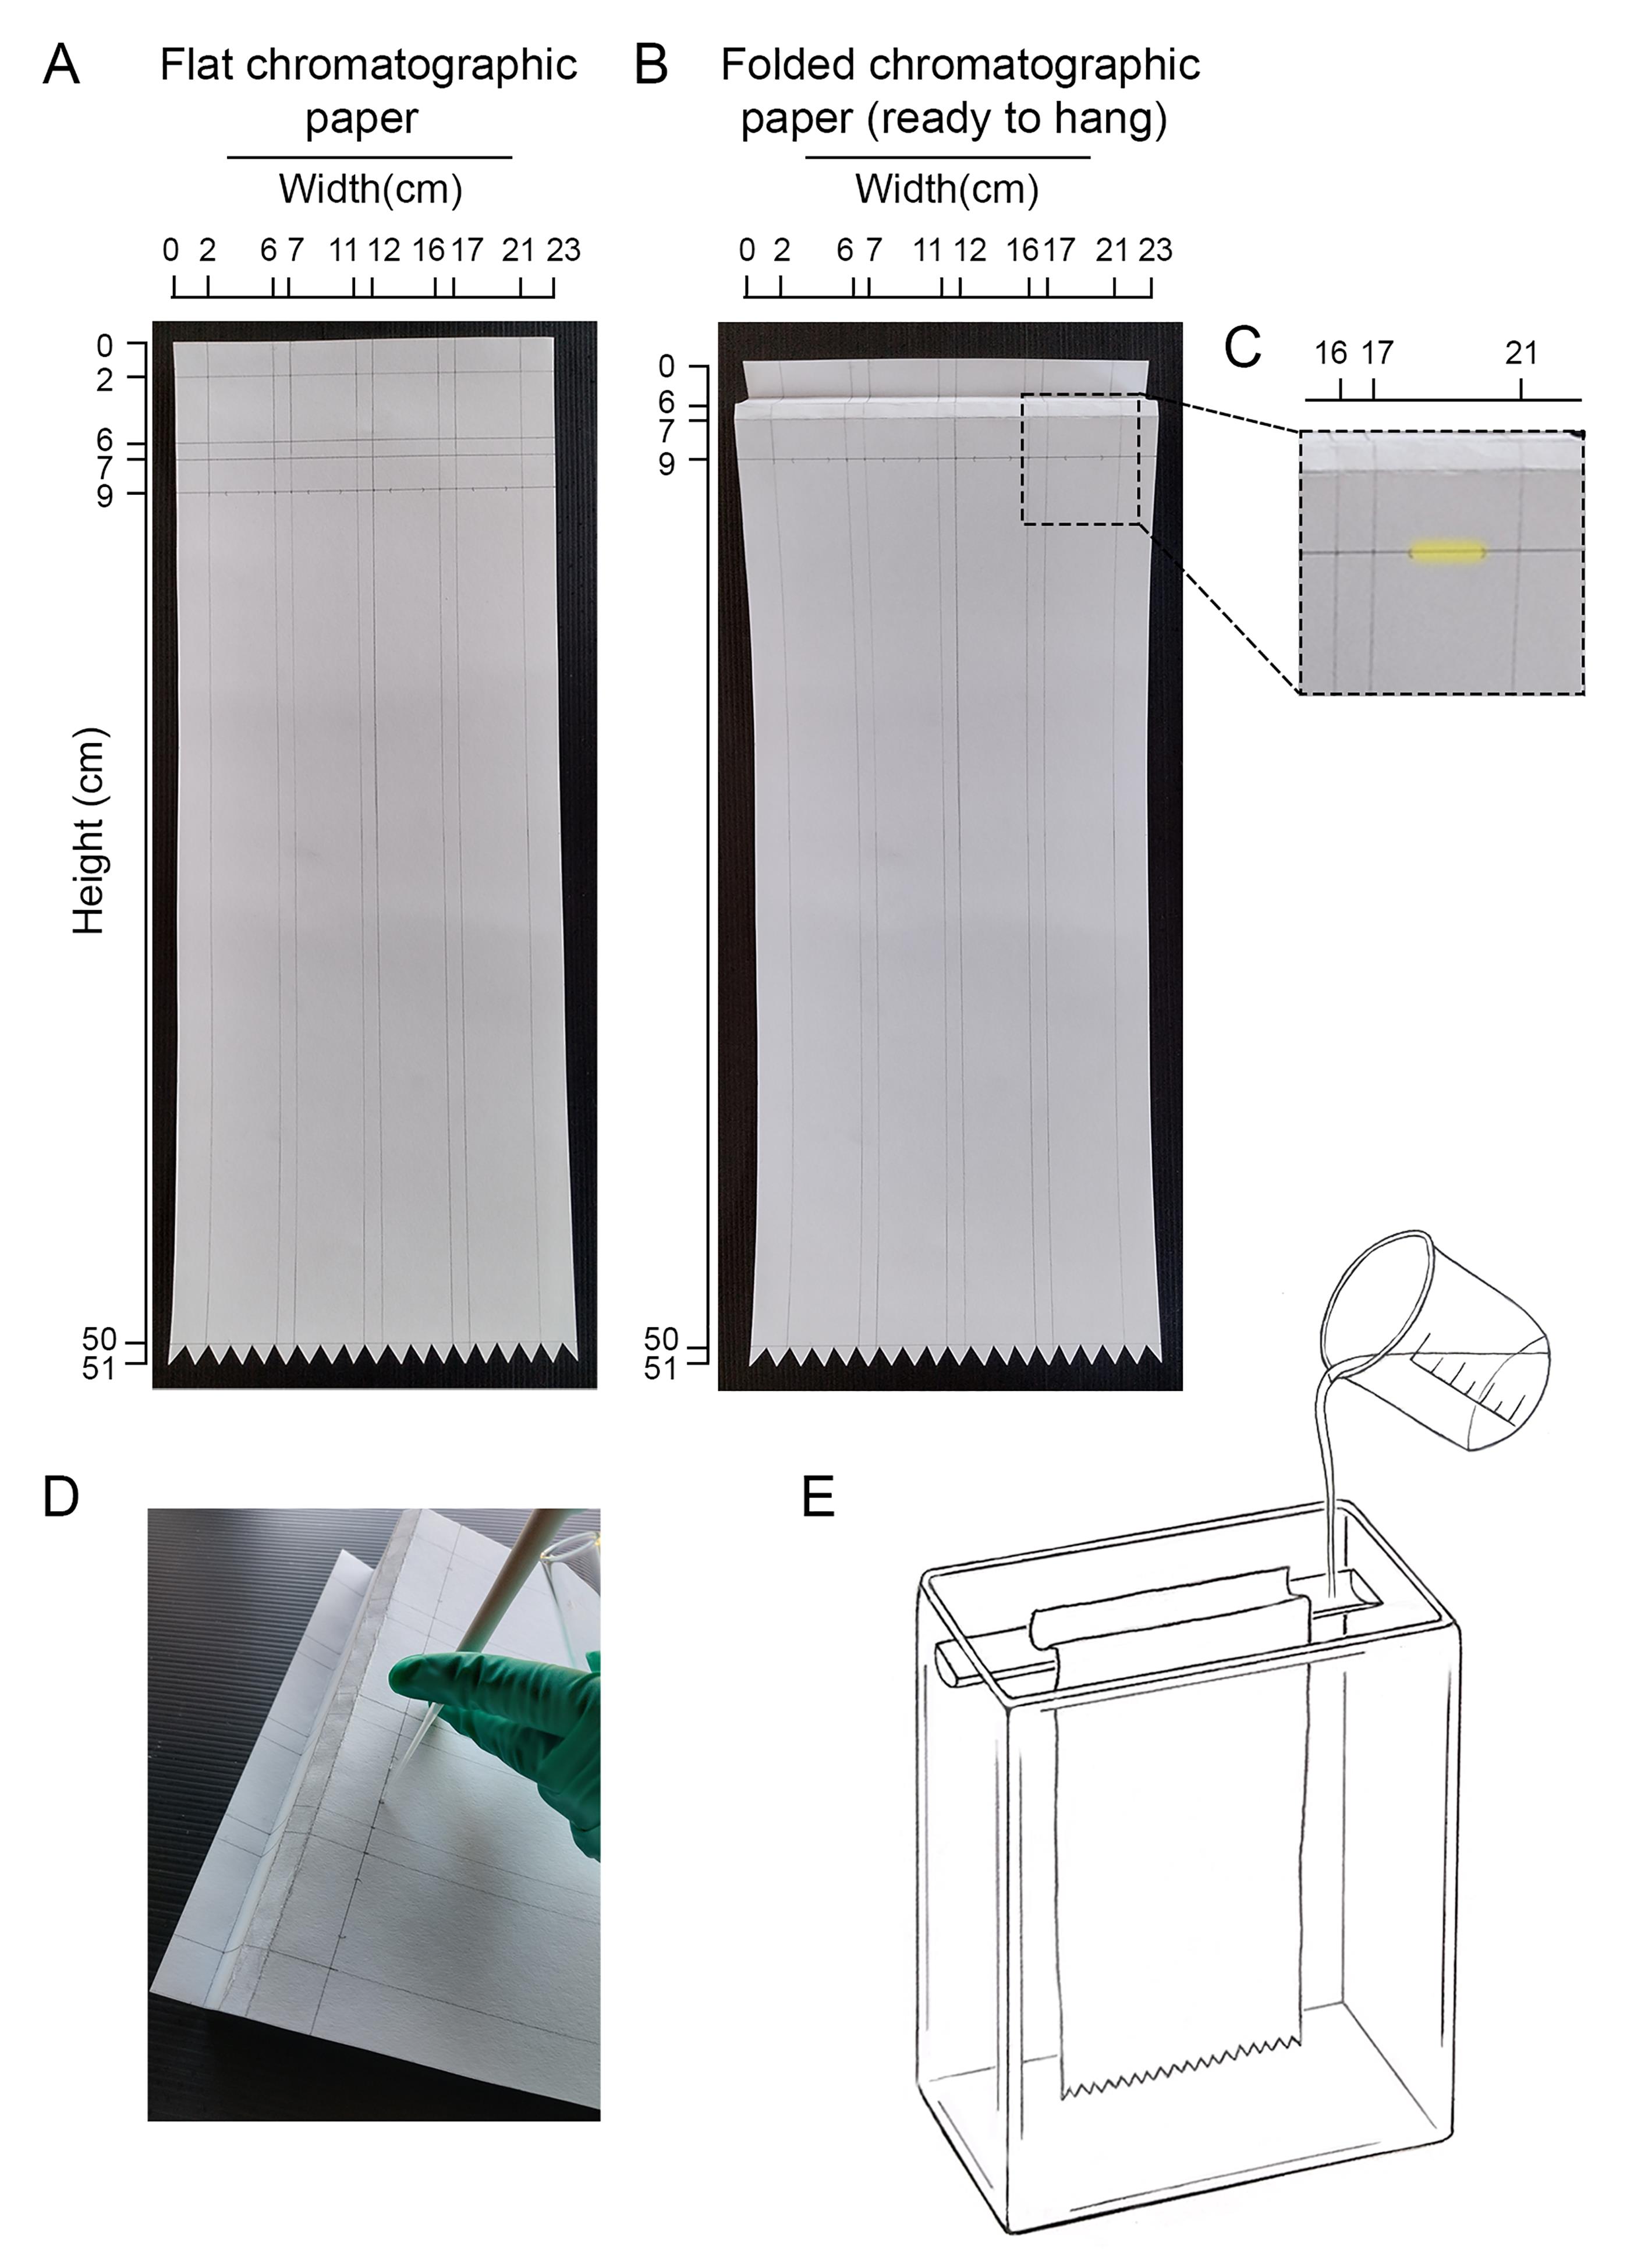
Figure 3. Design of the chromatography paper and loading the sample. (A) Recommended layout for chromatographic paper. In this case, four running trails were drawn. At least one of these trails should be used to run in parallel an internal standard sample composed of known labeled glycan species. (B) Indication of how the chromatographic paper should be folded before hanging it in the chromatographic chamber. (C) A detail of the area where the sample should be loaded in each trail is highlighted in yellow. (D) Illustrative picture showing how to load the sample into the paper. (E) Schematic illustration of the chromatographic chamber and the chromatographic paper hung inside.Remove the paper from the chromatography chamber, air dry it, and then cut each lane in 4 cm × 1 cm fractions. Place each fraction in counting vials and add 0.5 mL of scintillation liquid. It is not necessary for the liquid to cover the paper as it gets embedded.
Quantify the radioactive signal from each tube using a scintillation counter with a program for 14C radiation.
Data analysis
To obtain the radioactive profile of the LLO species, plot the intensity of the signal (counts per minute, CPM) versus the running length (cm) in the Excel sheet included in the following link. Figure 4A shows, as an example, representative chromatograms obtained for wildtype and Δalg8/Δalg12 S. pombe mutant strains (Gallo et al., 2022). LLOs patterns are measured in standardized conditions (see Procedure A–C of the protocol) that must be employed consistently across all experiments. Thus, as these patterns depend almost entirely on the genotype of the tested strains, the technique described here (which processes an enormous number of cells simultaneously) leads to robust and solid results, with a high level of reproducibility from replicate to replicate, and among different laboratories. Nevertheless, performing at least two independent replicates is required.
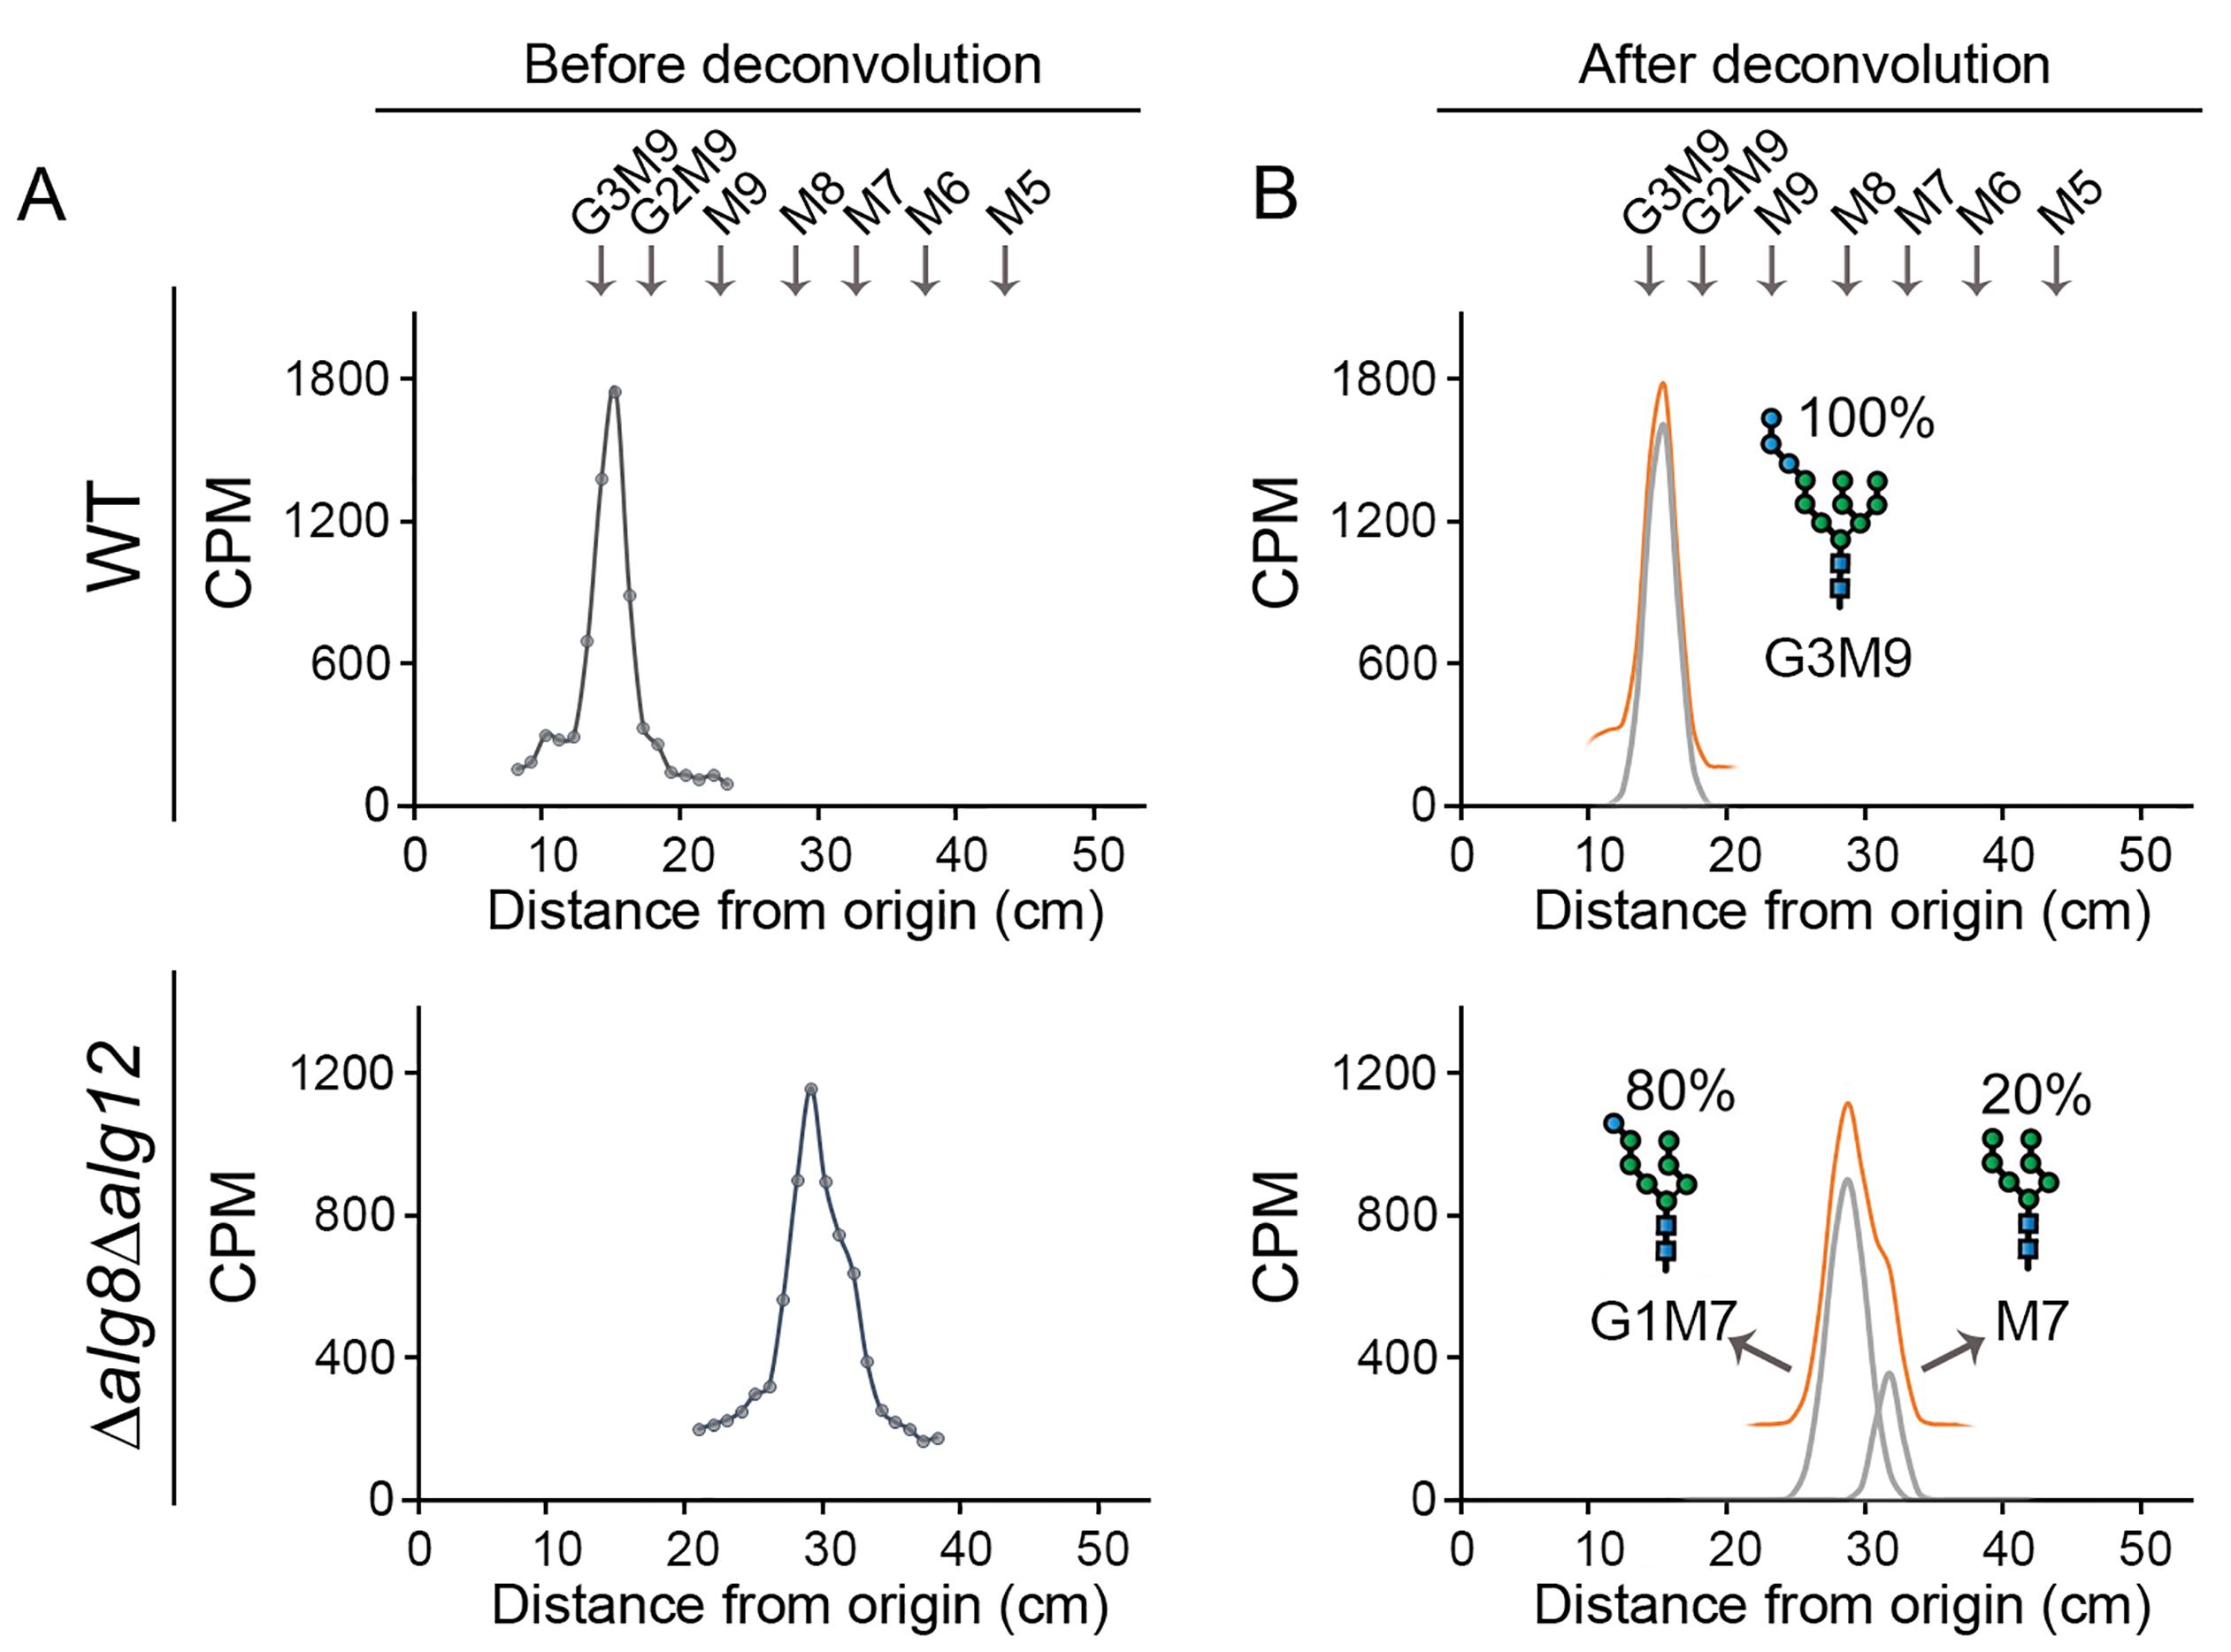
Figure 4. Representative profiles of labeled samples (A) before and (B) after deconvolution. LLO glycan patterns found in the S. pombe wildtype strain and Δalg8/Δalg12 mutant strain. In the wildtype strain, one single peak (G3M9) can be recognized, whilst in the mutant strain two not well resolved peaks (that belong to G1M7 and M7, respectively) were found. The running distance of a labeled mix of N-glycan composed by G3M9, M9, M8, M7, M6, and M5 is shown above the profiles.Quantify the proportion of each species within a sample by a deconvolution process using a Gaussian fit applied to the obtained chromatographic profile.
Note: The data analysis strategy is to combine one or more Gaussian functions to perform a non-linear fitting of the measured profile. The included Excel sheet ‘DeconvolutionDataSheet.xlsx ’ implements the fit of up to seven independent Gaussian functions on the same profile. The procedure follows a least square fitting criterion for optimization.
Load the obtained profile in the Excel sheet as a list of Running length (cm) and Counts (CPM) paired data (cells from A12 to B61) (see Figure 5).
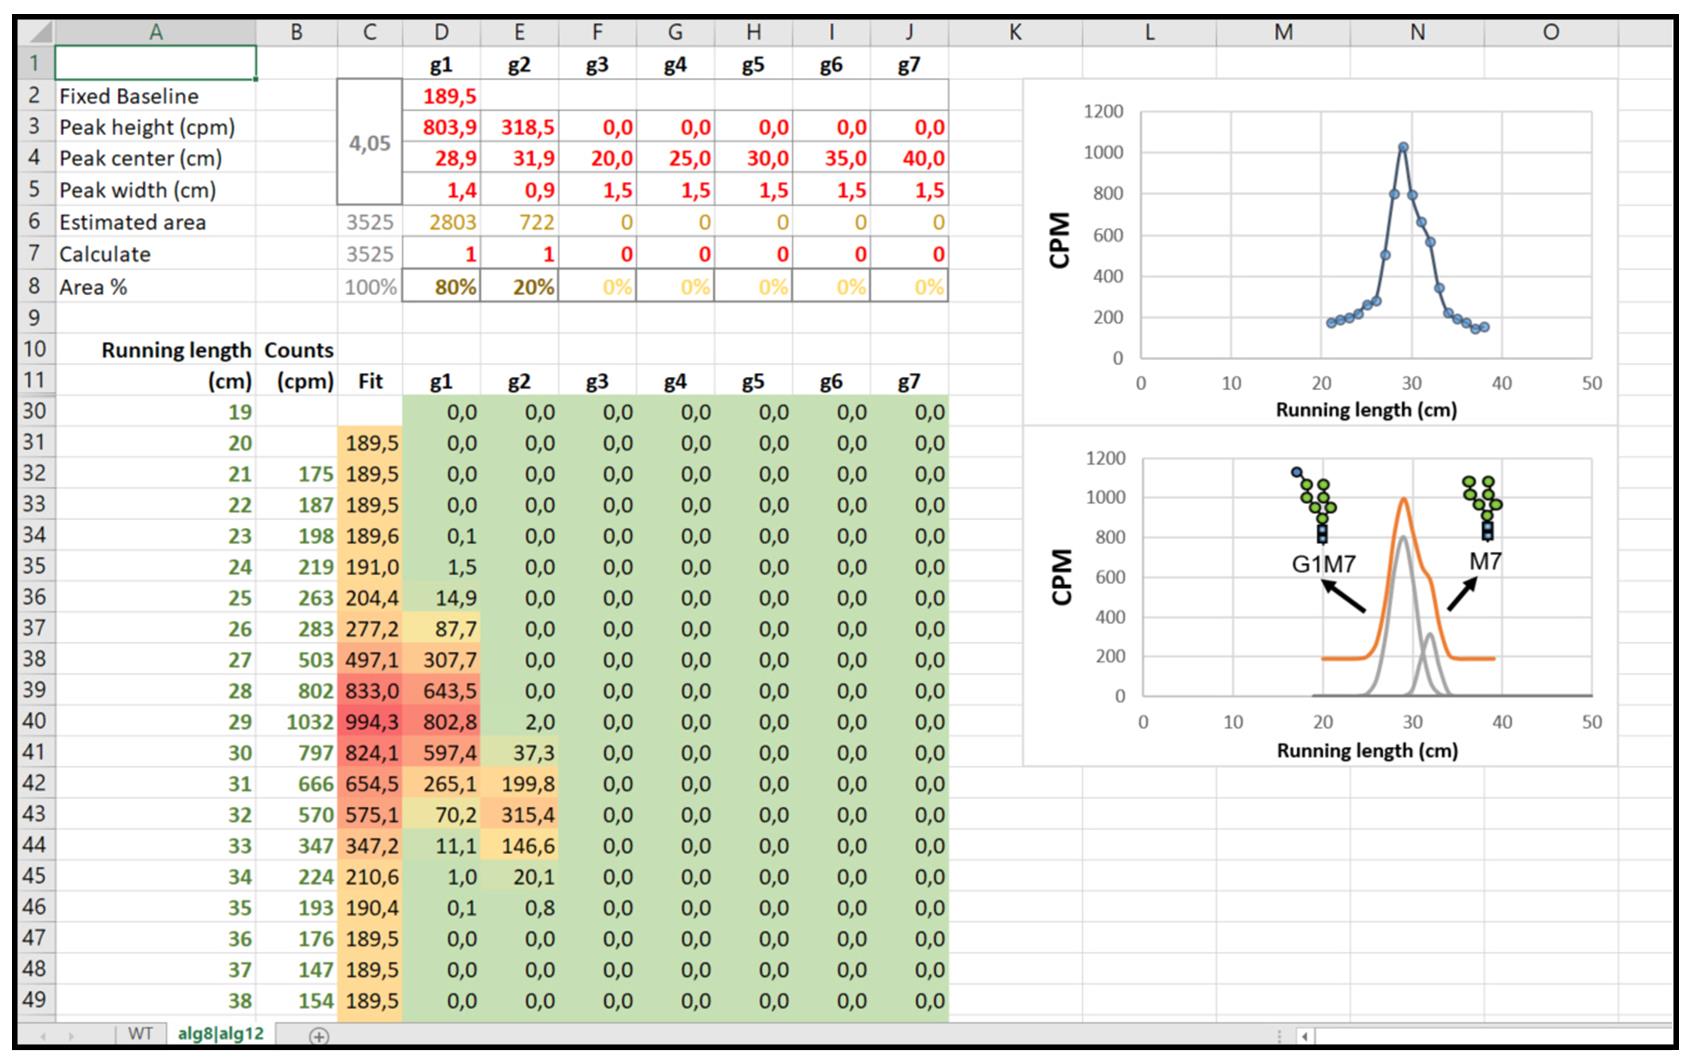
Figure 5. Excel Datasheet required to perform data analysis. The Excel sheet shows the number of peaks and their parameters (upper left), the data (bottom left), the plot of unprocessed data (upper right), and the processed data (bottom right). Note that a new sheet must be used for each strain.Enable one or more Gaussian functions to fit the measured profile, setting the value ‘1’ in row 7 from columns D to J. Set the value of ‘0’ to disable.
Notes:
Each column from D to J corresponds to an independent Gaussian function.
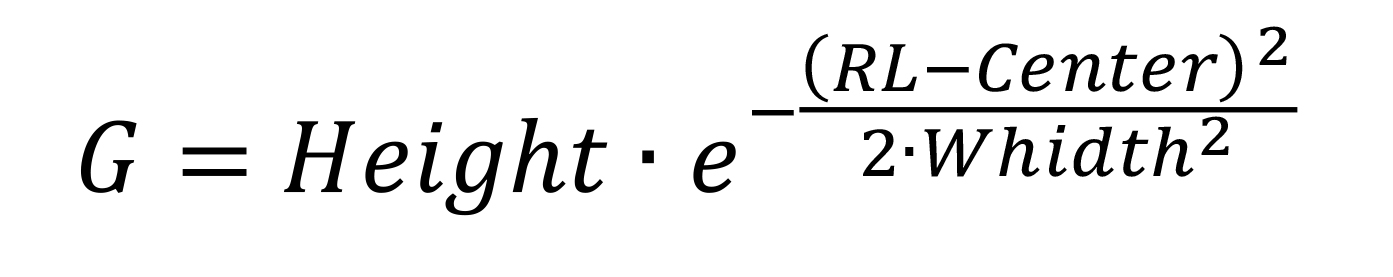
Calculate Gaussian function values as:
Set the baseline value in cell D2 to the minimum value measured in Counts.
Note: Use a constant value as baseline in order to subtract the base signal if needed.
For each enabled function (columns D to J), set approximated values for each peak height, center, and width (rows 3–5). Use the plot on the right as a visual aid for guessing the initial parameters as close as possible to the expected result.
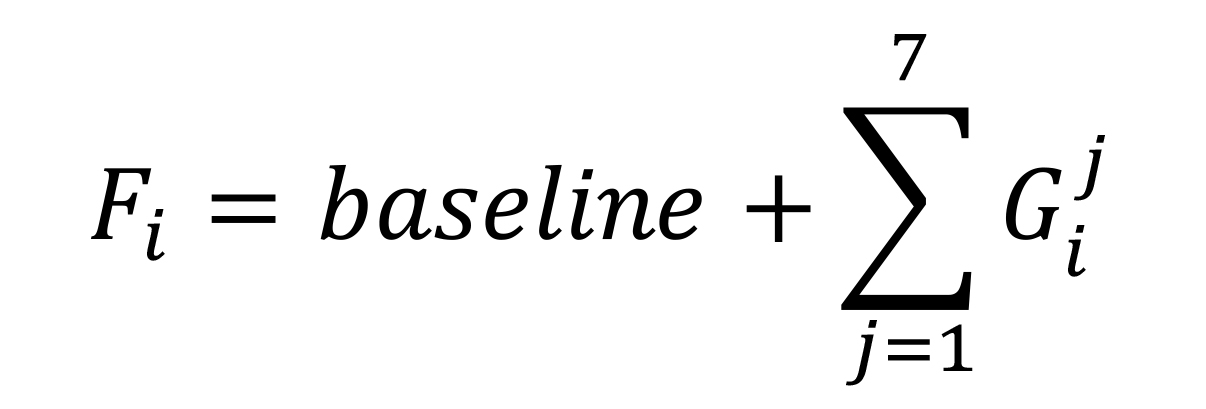
Sum up the baseline and all the enabled Gaussian functions for each data point (cells C12–C61).
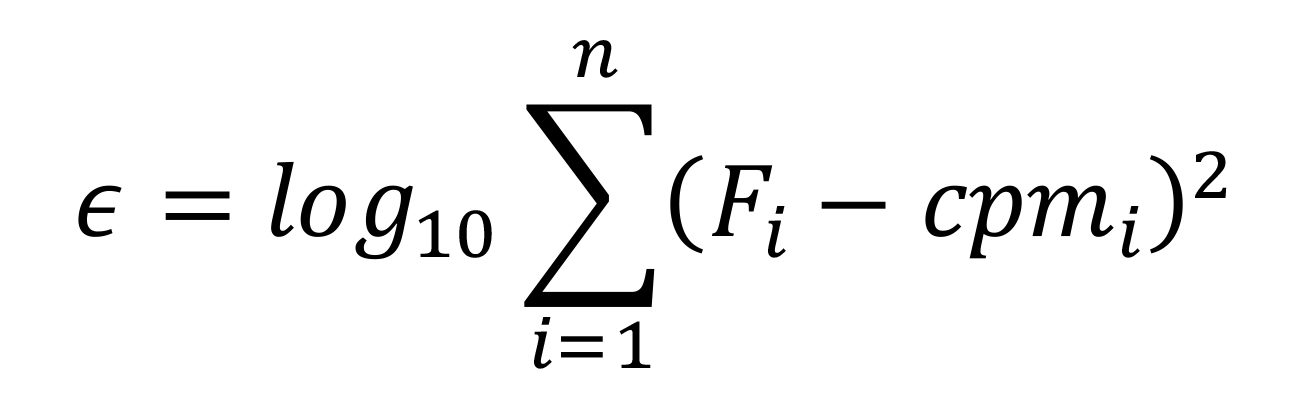
Note: Calculate the optimization function (in cell C2) as follows:
where
Open from the Excel menu the Data/Solver.
Complete the solver parameters as follows:
Target: $C$2
To: Min
Changing cells (you must define here the range of parameters you want to use in the fitting optimization)
Method: GRG Nonlinear
Number of fitted Gaussian functions Changing cells, solver parameter 1 $D$2;$D$3:$D$5 2 $D$2;$D$3:$E$5 3 $D$2;$D$3:$F$5 4 $D$2;$D$3:$G$5 5 $D$2;$D$3:$H$5 6 $D$2;$D$3:$I$5 7 $D$2;$D$3:$J$5 Press Resolve button and wait for execution. Then, accept to keep the Solver solution.
Read the proportional area for each band from row 8, columns D–J.
Note: Calculate the area of each band from the adjusted parameters as:

Compare the profiles of duplicates and perform an average of each species in each strain.
Formulas definitions or references:
G: Value of the Gaussian function
Height: Fitting parameter indicating the maximum CPM of the peak
RL: Experimental chromatographic running length in cm
Center: Fitting parameter indicating the position of the peak maximum in cm
Width: Fitting parameter associated to the broadness of the peak in cm
𝜖: Function used by Solver to achieve the fitting
Cpm: Experimental measurement for each RL in CPM
Area: Relative quantification of the identified band
Notes
There is a limit for this deconvolution procedure to distinguish between overlapping bands.
Decreased spatial resolution may affect results.
Recipes
Yeast extract medium supplemented with adenine (YEA)
Reagent Final concentration Amount Yeast extract 5 g/L 5 g Glucose 30 g/L 30 g Adenine 75 mg/L 75 mg H2O n/a Complete to 1 L Total n/a 1,000 mL Autoclave for 20 min at 120 °C
Yeast nitrogen base (YNB) without glucose
Reagent Final concentration Amount YNB 1% 10 g H2O n/a Complete to 1 L Total n/a 1,000 mL Autoclave for 20 min at 120 °C
Radioactive solution to label a 500 μL sample
Reagent Final concentration Amount [14C]-glucose 200 μCi 200 μL. Dry completely Glucose (1 M) 50 mM 2.5 μL 1% YNB n/a 50 μL Total n/a 50 μL Chloroform:methanol:water (1:1:0.3)
Reagent Final concentration Amount Chloroform n/a 435 mL Methanol n/a 435 mL H2O n/a 130 mL Total n/a 1,000 mL Chloroform:methanol:water (1:16:16)
Reagent Final concentration Amount Chloroform n/a 30 mL Methanol n/a 485 mL H2O n/a 485 mL Total n/a 1,000 mL 0.02 N HCl
Reagent Final concentration Amount Hydrochloric acid 37% (fuming) 0.02 N 0.83 mL H2O n/a Complete to 500 mL* Total n/a 500 mL *Note: Never add water to the acid. Place some distilled water in a volumetric flask, add fuming HCl, and then add water up to 500 mL.
Acknowledgments
This work was supported by the Agencia Nacional de Promoción Científica y Tecnológica (ANPCyT, Argentina) [PICT2017-1076 to C.D’.] and the National Research Council (CONICET, Argentina) [PIP-11220150100759 to C.D]. C.D. is a Career Investigator of the National Research Council (CONICET, Argentina). A.V. and G.L.G. are CONICET fellows. This protocol derives from the original paper (Gallo et al., 2022).
Competing interests
The authors declare no competing interests.
References
- Aebi, M. (2013). N-linked protein glycosylation in the ER. Biochim Biophys Acta 1833(11): 2430-2437.
- Cali, T., Vanoni, O. and Molinari, M. (2008). The endoplasmic reticulum crossroads for newly synthesized polypeptide chains. Prog Mol Biol Transl Sci 83: 135-179.
- Chang, I. J., He, M. and Lam, C. T. (2018). Congenital disorders of glycosylation. Ann Transl Med 6(24): 477.
- Chapman, A. E. and Calhoun, J. C. t. (1988). Effects of glucose starvation and puromycin treatment on lipid-linked oligosaccharide precursors and biosynthetic enzymes in Chinese hamster ovary cells in vivo and in vitro. Arch Biochem Biophys 260(1): 320-333.
- Fernandez, F. S., Trombetta, S. E., Hellman, U. and Parodi, A. J. (1994). Purification to homogeneity of UDP-glucose:glycoprotein glucosyltransferase from Schizosaccharomyces pombe and apparent absence of the enzyme from Saccharomyces cerevisiae. J Biol Chem 269(48): 30701-30706.
- Gallo, G. L., Valko, A., Herrera Aguilar, N., Weisz, A. D. and D'Alessio, C. (2022). A novel fission yeast platform to model N-glycosylation and the bases of congenital disorders of glycosylation type I. J Cell Sci 135(5).
- Gershman, H. and Robbins, P. W. (1981). Transitory effects of glucose starvation on the synthesis of dolichol-linked oligosaccharides in mammalian cells. J Biol Chem 256(15): 7774-7780.
- Hagan, I. M. C., A. M.; Grallert, A.; Nurse. P. (2016). Fission Yeast: A laboratory manual. Cold Spring Harbor Laboratory Press. ISBN: 978-1-621820-82-6.
- Ng, B. G. and Freeze, H. H. (2018). Perspectives on Glycosylation and Its Congenital Disorders. Trends Genet 34(6): 466-476.
- Ondruskova, N., Cechova, A., Hansikova, H., Honzik, T. and Jaeken, J. (2021). Congenital disorders of glycosylation: Still "hot" in 2020. Biochim Biophys Acta Gen Subj 1865(1): 129751.
- Parodi, A. J., Quesada Allue, L. A. and Cazzulo, J. J. (1981). Pathway of protein glycosylation in the trypanosomatid Crithidia fasciculata. Proc Natl Acad Sci U S A 78(10): 6201-6205.
- Stanley, P., Taniguchi, N. and Aebi, M. (2015). In: N-Glycans. rd, Varki, A., Cummings, R. D., Esko, J. D., Stanley, P., Hart, G. W., Aebi, M., Darvill, A. G., Kinoshita, T., Packer, N. H., et al. (Eds.) Essentials of Glycobiology. 99-111.
- Stigliano, I. D., Alculumbre, S. G., Labriola, C. A., Parodi, A. J. and D'Alessio, C. (2011). Glucosidase II and N-glycan mannose content regulate the half-lives of monoglucosylated species in vivo. Mol Biol Cell 22(11): 1810-1823.
- Wilson, M. P. and Matthijs, G. (2021). The evolving genetic landscape of congenital disorders of glycosylation. Biochim Biophys Acta Gen Subj 1865(11): 129976.
Article Information
Copyright
© 2022 The Authors; exclusive licensee Bio-protocol LLC.
How to cite
Valko, A., Gallo, G. L., Weisz, A. D., Parodi, A. J. and D'Alessio, C. (2022). Analysis of Lipid-linked Oligosaccharides Synthesized in vivo in Schizosaccharomyces pombe. Bio-protocol 12(18): e4508. DOI: 10.21769/BioProtoc.4508.
Category
Microbiology > Microbial biochemistry > Carbohydrate
Microbiology > Microbial biochemistry > Lipid
Biochemistry > Carbohydrate > Oligosaccharide > Labelling
Do you have any questions about this protocol?
Post your question to gather feedback from the community. We will also invite the authors of this article to respond.