- Protocols

- Articles and Issues
- For Authors
- About
- Become a Reviewer

Binding Affinity Quantifications of the Bacteriophage Mu DNA Modification Protein Mom Using Microscale Thermophoresis (MST)
Published: Vol 12, Iss 14, Jul 20, 2022 DOI: 10.21769/BioProtoc.4472 Views: 3740
Reviewed by: ASWAD KHADILKARMarc-Antoine SaniAnonymous reviewer(s)
Original research article
The authors used this protocol in:
Jun 2020
Advertisement


Protocol Collections
Comprehensive collections of detailed, peer-reviewed protocols focusing on specific topics


Related protocols
Abstract
Epigenetic modifications play diverse roles in biological systems. Nucleic acid modifications control gene expression, protein synthesis, and sensitivity to nucleic acid-cleaving enzymes. However, the mechanisms underlying the biosynthesis of nucleic acid modifications can be challenging to identify. Studying protein-ligand interactions helps decipher biosynthetic and regulatory pathways underlying biological reactions. Here, we describe a fluorescence labeling-based quantitative method for unraveling the biomolecular interactions of bacteriophage Mu DNA modification protein Mom with its ligands, using microscale thermophoresis (MST). Compared to traditional methods for studying protein-biomolecular interactions, MST requires significantly lower sample amounts, volumes, and analysis time, thus allowing screening of a large number of candidates for interaction with a protein of interest. Another distinguishing feature of the method is that it obviates the need for protein purification, often a time- and resource-consuming step, and works well with whole or partially purified cell extracts. Importantly, the method is sensitive over a broad range of molecular affinities while offering great specificity and can be used to interrogate ligands ranging from metal ions to macromolecules. Although we established this method for a DNA modification protein, it can easily be adapted to study a variety of molecular interactions engaged by proteins.
Keywords: Microscale thermophoresis (MST)Background
[Background] Biological background: Biological entities have evolved a plethora of epigenetic modifications in their nucleic acids, ranging from simple methylation to complex moieties derived from sugars, amino acids, polyamines, and other cellular metabolites (Boccaletto et al., 2018; Sood et al., 2019). Epigenetic modifications regulate gene expression, mRNA translation, and cellular stress responses, and protect bacteriophages from DNA-damaging immune systems of bacterial hosts (Kahmann, 1983; Hattman, 1999; Choi et al., 2014; Gu et al., 2014; Reynolds et al., 2014; Bryson et al., 2015; Hutinet et al., 2019). The ability to target nucleic acid modifications has broad applications in designing antibiotics and antifungal strategies through the impairment of modification pathways unique and essential to pathogens (Koh and Sarin, 2018). Similarly, the fields of phage therapy and microbiome engineering stand to benefit from the discovery of DNA modification pathways that can protect the DNA payload from a wide range of host immune systems. Novel DNA modifications are constantly being discovered in phages, presenting new puzzles surrounding their biosynthesis and function (Lee and Weigele, 2021; Lee et al., 2022). Studying molecular interactions opens a window into the inner workings of macromolecules, cells, and underlying mechanistic and regulatory pathways (Corbeski et al., 2018; Karambelkar et al., 2020). Here, we describe interaction studies of the DNA modification protein Mom in the context of its metal ion and small molecule cofactor interactions (Karambelkar et al., 2020) using the technique of microscale thermophoresis (MST).
Technical background: MST offers a simple method to quantitatively investigate protein-ligand interactions, and is based on thermophoresis, the movement of molecules across thermal gradients (Jerabek-Willemsen et al., 2011). Ligand-induced changes in size, charge, hydration shell, or conformation of a macromolecule alter its thermophoretic movement (Jerabek-Willemsen et al., 2011). Using a titration approach, MST enables the measurement of affinity constants of a wide variety of interactions in the binding equilibrium (Karambelkar et al., 2020; Osuna et al., 2020a, 2020b). MST requires extremely small sample amounts compared to conventional methods like isothermal calorimetry (ITC) or surface plasmon resonance (SPR), obviates ligand immobilization, and works over a broad range of binding affinities.
Another notable strength of MST over conventional approaches is its compatibility with complex mixtures and cell extracts (Lippok et al., 2012; Khavrutskii et al., 2013; Bartoschik et al., 2018). The ability to fluorescently tag a specific his-tagged protein of interest in a complex mixture of proteins, as highlighted in this protocol, not only obviates protein purification, often a rate limiting and cumbersome step, but also provides high sensitivity for detecting interactions in a near-native environment (Bartoschik et al., 2018).
Although MST measurements can be performed using intrinsic fluorescence of proteins (Seidel et al., 2012), labeling of the target proteins with a suitable fluorophore is required when using complex samples (Bartoschik et al., 2018). In routine labeling techniques for MST, fluorophores are covalently attached to lysine residues using NHS- or to cysteine residues using maleimide chemistry. However, these labeling methods require purified proteins and cannot be applied to a mixture of proteins. Moreover, it is not possible to predict where the fluorophore will bind to the protein—inhomogeneous protein-dye conjugates might even display destabilization, loss of functionality, or steric hindrance at the ligand binding site (Lindhoud et al., 2012). The above limitations are overcome by the selective and site-specific labeling of a protein of interest in a complex mixture. This can be achieved in various ways, such as by expressing in vivo a fusion of the protein of interest with a fluorescent protein like GFP (Khavrutskii et al., 2013; Magnez et al., 2017; Gao et al., 2021). However, such relatively large tags are not always desired for quantitative interaction analysis and also require the cloning of a suitable linker and fluorescence tag. Various other site-specific labeling strategies have been demonstrated, such as co-translational introduction of unnatural or modified amino acids, or labeling via specific amino acid sequences, including His-tags and tetracysteine motifs (Griffin et al., 1998; Krishnan et al., 2007; Nienberg et al., 2016). Among these, the His-tag is the most convenient, popular, and widely used affinity tag for purification, immobilization, or detection of proteins.
The tris-NTA/His-tag system comprises one of the smallest high-affinity recognition elements known to date (Braner et al., 2016). Fast, stoichiometric binding of tris-NTA conjugates enables in situ protein labeling of His-tagged proteins, making the system suitable for quantitative protein interaction analysis by MST (Lata et al., 2005). Because the tris-NTA/His-tag labeling is based on non-covalent coordinate bonds with the transition metal ion Ni(II), it is sensitive to reagents that compete or interfere with the labeling (Table 1).
Materials and Reagents
Protein Purification
15 mL Bioruptor TPX tubes (Diagenode, catalog number: NC1463349)
10 kDa dialysis membrane (Sigma-Aldrich, catalog number: 0530-100FT)
Isopropyl-β-D-thiogalactoside (Sigma-Aldrich, catalog number: 11411446001)
Lysozyme (Sigma-Aldrich, catalog number: L6876)
Phenylmethanesulfonyl fluoride (PMSF) (Sigma-Aldrich, catalog number: P7626)
Poly(ethyleneimine) (Sigma-Aldrich, catalog number: P3143)
NaCl (Sigma-Aldrich, catalog number: 746398)
Sodium phosphate dibasic (Sigma-Aldrich, catalog number: S5136)
Sodium phosphate monobasic (Sigma-Aldrich, catalog number: S3139)
EDTA (Sigma-Aldrich, catalog number: E5134)
2-Mercaptoethanol (Sigma-Aldrich, catalog number: M3148)
HEPES (Affymetrix USB, catalog number:16928)
Ammonium sulfate (Sigma-Aldrich, catalog number: A4418)
Cellulose phosphate (Sigma-Aldrich, catalog number: C3145)
Trizma base or Tris base (Sigma-Aldrich, catalog number: T6066)
NaOH (SDFCL, catalog number: 20252KO5)
HCl (Qualigens, catalog number: Q29147)
Amicon Ultra-15 centricon10 kDa NMWCO (Millipore, catalog number: UFC901008)
Bovine serum albumin (BSA), analytical standard (Millipore Sigma, catalog number: P5619)
Lysis buffer (see Recipes)
Phosphocellulose binding buffer (see Recipes)
Wash buffer 1 (see Recipes)
Wash buffer 2 (see Recipes)
Elution buffer (see Recipes)
Storage buffer (see Recipes)
MST Experiment
PCR plates (Axygen, catalog number: 14-222-320)
Ammonium Iron(II) sulfate (Sigma-Aldrich, catalog number: 09719)
Acetyl Coenzyme A (Sigma-Aldrich, catalog number: A2056)
MonolithTM NT.115 Series, Premium Capillaries (NanoTemper Technologies GmbH, catalog number: MO-K025–200 Count)
Monolith His-Tag Labeling Kit RED-Tris-NTA (NanoTemper Technologies GmbH, catalog number: MO-L008)
MST buffer (see Recipes)
1× PBS-T (see Recipes)
Equipment
Incubator (New Brunswick Scientific Innova 4230)
Bioruptor® Sonicator (Diagenode UCD 300)
Centrifuge (Kubota 6500)
Ultracentrifuge (Beckman L8-70M)
Magnetic Stirrer (IKA Big Squid)
Peristaltic pump (Pharmacia LKB pump P-1)
Pipettes (GilsonTM PIPETMAN ClassicTM Pipets P2, 20, 200, and 1000) (Gilson, catalog numbers: F144801, F123600G, F123601G, and F123602G)
Monolith NT.115 instrument (NanoTemper Technologies GmbH)
Software
MO.Control 2 from Nanotemper Technologies (https://nanotempertech.com/monolith-mo-control-software/)
MO.Affinity Analysis 3 from Nanotemper Technologies (https://nanotempertech.com/monolith/monolith-nt115/)
GraphPad Prism 5 version 5.03 (https://www.graphpad.com/scientific-software/prism/)
Procedure
Partial purification of His-tagged Mom for MST assays
Cell extract preparation
Note: Perform all steps at 4°C or on ice. Aliquot samples at each step for SDS PAGE analysis (Figure 1).
Resuspend 2 g of cell pellet (Escherichia coli C41 expressing Mom, Figure 1, lanes 1–2) in 12 mL of lysis buffer (see Recipe 1). Add PMSF to a final concentration of 1 mM.
Pre-cool the Diagenode Bioruptor. Distribute 2 mL of the cell suspension into six 15 mL TPX tubes and sonicate using at a high power setting for 20 cycles (30 s on, 45 s off).
Centrifuge the sonicated extract for 2 h at 4°C at 100,000 × g in the ultracentrifuge. The supernatant and pellet obtained after the spin are referred to as S100 supernatant and S100 pellet, respectively (Figure 1, lanes 3–4).
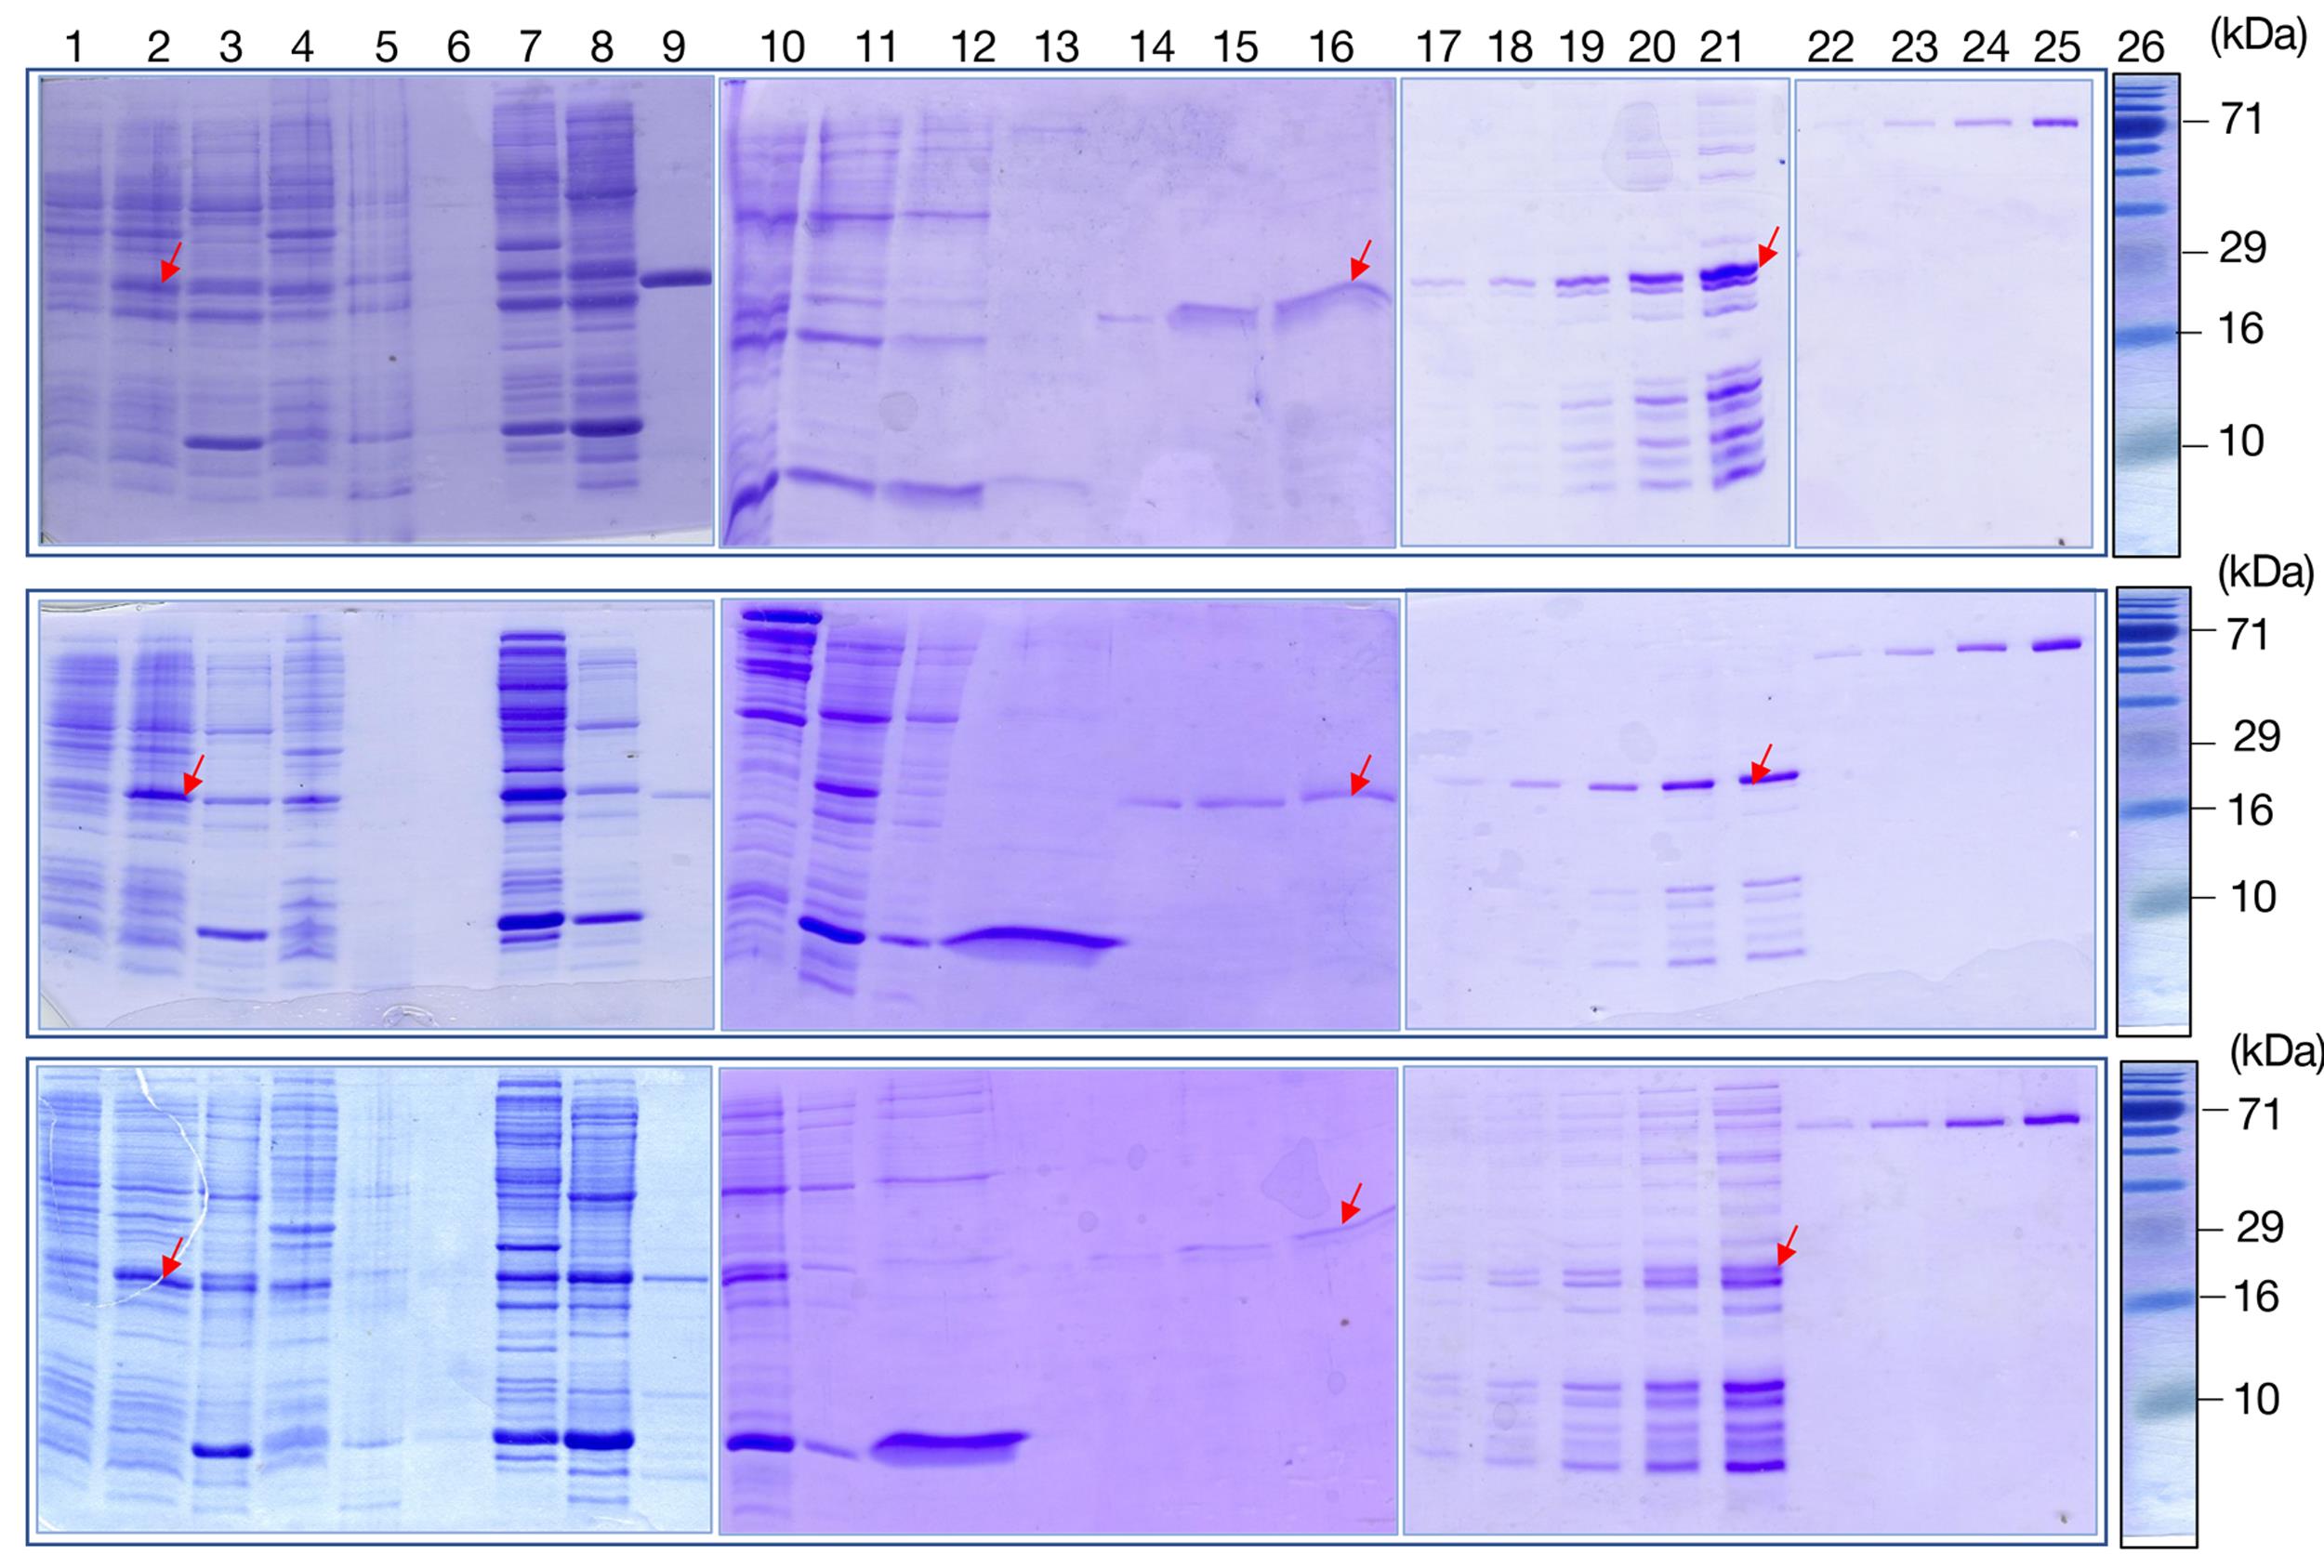
Figure 1. Partial purification of his-tagged wild-type (WT) and mutant Mom proteins for microscale thermophoresis (MST). His-tagged WT Mom (Upper panel), R101A Mom (middle panel), and Y149A Mom (lower panel) were overexpressed in E. coli C41 pNC1 cells and partially purified as follows. Crude cell extracts of uninduced (lane 1) and IPTG-induced (lane 2) cultures were subjected to ultracentrifugation at 100,000 × g, and the supernatant (lane 3) and pellet fractions (lane 4) analyzed. Nucleic acids were removed from the S100 supernatant using PEI precipitation (lanes 5–6), and cellular proteins were fractionated using 0–35% and 35–65% ammonium sulfate cuts (lanes 7–8). His-tagged Mom protein in various stages of purification is indicated using red arrowheads, and purified non-his-tagged Mom protein was loaded in lane 9. Buffer exchange was carried out to remove ammonium sulfate from the Mom-containing ammonium sulfate fraction (35–65%, lane 10), and the dialyzed fraction was loaded on PC column. Flowthrough fraction (lane 11) was collected, and the column washed to remove weakly bound protein (lanes 12–13). Elution was carried out with a high salt buffer (lanes 14–16). For protein quantitation using densitometry, PC elutions were dialyzed and concentrated; 1 μL, 2 μL, 4 μL, 8 μL, and 10 μL (lanes 17–21) of the concentrated protein were loaded alongside known amounts (100, 200, 400, and 800 ng) of BSA standard (lanes 22–25) and Genetix 3 color prestained protein marker (Lane 26). Samples were analyzed on 15% SDS PAGE gels.
Removal of nucleic acids
Add polyethyleneimine (PEI) pH 7.4 dropwise to the S100 supernatant from the above step to a final concentration of 1% while continuously stirring on a magnetic stirrer.
Centrifuge the resulting suspension at 20,000 × g for 10 min in Kubota centrifuge to precipitate PEI-nucleic acid complexes (Figure 1, lane 6).
Decant the supernatant (referred to as the PEI supernatant, Figure 1, lane 5) into a fresh tube.
Fractionation of cellular proteins
Ammonium sulfate precipitation is a technique used for fractionation of cellular proteins. It is based on an effect termed salting-out, wherein at higher salt concentrations, protein solubility usually decreases, leading to precipitation (Green and Hughes, 1995). Because precipitation is due to reduced solubility and not denaturation, pelleted protein can be readily resolubilized using standard buffers. After removal of ammonium sulfate using dialysis, the protein is well suited for further chromatographic fractionation or purification procedures.
Fractionate the PEI supernatant from the above step using two ammonium sulfate saturation cuts, 0–35% and 35–65% (Wingfield, 2001), as follows.
For 0–35% saturation, weigh the required amount of ammonium sulfate crystals and slowly, grain by grain, add it to the PEI supernatant while stirring it constantly on a magnetic stirrer, allowing the salt to dissolve completely.
After the appearance of a precipitate, incubate the suspension on ice for 10 min and centrifuge for 20,000 × g for 15 min at 4°C.
Collect the supernatant and subject it to 35–65% ammonium sulfate saturation as above. The pellets obtained after the ammonium sulfate precipitation (Figure 1, lanes 7–8) can be stored on ice overnight at 4°C.
Phosphocellulose activation/equilibration
Add 1 g of cellulose phosphate P1 swells to 3–4 mL resin. Wash approximately 25 g of phosphocellulose powder with 25 volumes of MilliQ water.
For all the washing steps, gently stir the resin by swirling it in a 1 L beaker and allowing it to stand for 10 min, followed by decanting the liquid. Wash volumes are calculated with respect to the dry weight of phosphocellulose processed, such that volume here is 25 × 25 = 625 mL.
Wash the resin with 10 volumes each of 95% and 50% distilled ethanol.
Subsequently, wash the resin with 25 volumes of 0.5 N NaOH.
Thereafter, wash the resin with 75–100 volumes of Milli Q water, until the pH of the decanted liquid is less than 10.
Add 25 volumes of 0.5 N HCl to resin and stir well. Allow the resin to settle for exactly the same time as in step 4.
Next, wash the resin with 75 volumes of MilliQ water.
Phosphocellulose chromatography
Resuspend the 35–65% ammonium sulfate pellet, which is enriched in Mom protein, in phosphocellulose binding buffer (see Recipe 2), and dialyze against 1 L phosphocellulose binding buffer, with two changes of the dialysis buffer over 3 h.
Centrifuge the dialyzed suspension at 20,000 × g for 10 min at 4°C.
Apply the supernatant (Figure 1, lane 10) onto a 50 mL pre-equilibrated phosphocellulose column using a peristaltic pump at a flow rate of 2.5–5.0 mL/min. Collect the flow-through (Figure 1, lane 11) and load it back on the column. Repeat this step two more times to ensure complete binding of Mom to resin.
Wash the resin with 3 column volumes each of wash buffers 1 and 2 (see Recipes 3 and 4) (Figure 1, lanes 12–13).
Elute Mom with 0.5 column volumes of high salt elution buffer (see Recipe 5) (Figure 1, lanes 14–16).
Dialyze the eluted protein against storage buffer (see Recipe 6) and concentrate using Amicon Ultra-15 with a 10 kDa MWCO membrane.
Aliquot the concentrated protein, snap freeze in liquid nitrogen, and store at -80°C.
Protein quantitation
Purified proteins were quantitated using SDS-PAGE densitometry. SDS PAGE-based protein quantitation, unlike spectrophotometric methods like the Bradford assay, carries the advantage of quantitating a specific protein of interest in a complex mixture of proteins and hence is more reliable for estimating protein concentrations for MST. A 2 mg/mL stock of BSA standard prepared in water was further diluted to 10 ng/μL, 20 ng/μL, 40 ng/μL, and 80 ng/μL; 10 μL of each of the dilutions was loaded in the gel (Figure 1, lanes 22–25) alongside a series of two-fold increasing volumes (1 μL, 2 μL, 4 μL, 8 μL,10 μL) of test sample (Figure 1, lanes 17–21). Concentration of the protein of interest within the test sample was estimated by comparing densities of the specific band of interest with those of the BSA standards.
MST Protocol
Labeling the protein with fluorescent dye
The instructions for this step are based on using the Red-Tris-NTA dye and consumables from NanoTemper Technologies. The Monolith NT His-tag Labeling Kit facilitates site-specific, purification-free labeling of small amounts of His-tagged proteins with the NT647 fluorescent dye. The kit can be used for the labeling of any protein or peptide carrying a polyhistidine tag (at least six histidines), and labeling can be completed within 30 min. The dye binds efficiently (subnanomolar affinity) to His-tags, and near-complete binding of the dye to His-tagged proteins obviates further purification steps or excess dye removal. Moreover, the specificity for His-tags allows for the method to work well with impure or partially purified protein preparations. An alternate approach to using the Tris-NTA dye is to tag the protein of interest with a fluorescent tag, e.g., GFP, in which case no further labeling should be required. Note that the dye (or tag) must be compatible with the filters installed in the Monolith instrument and that the dye or tag should not block any potential ligand-binding sites.
Some buffer components–e.g., imidazole, poly-His-tagged ligands, histidine, ATP, reducing agents like TCEP, DTT, and 2-Mercaptoethanol–might interfere with the labeling reaction, and their concentrations should not exceed the limits specified by Nanotemper (Table 1).
Add 8.0 mL of water to the vials containing 5× PBS-T to obtain 1× PBS-T (see Recipe 8)
Suspend 250 pmol RED-Tris-NTA dye in 50 μL of PBS-T to obtain a 5 μM dye solution.
Prepare a 100 nM dye solution by mixing 2 μL of dye (5 μM) and 98 μl 1× PBS-T.
Adjust the protein concentration to 200 nM in a volume of 100 μL.
Note: Protein concentration should be estimated using band densitometry on a Coomassie blue-stained SDS gel, and is particularly important when quantifying protein of interest in cell extracts or partially purified protein preparations.
Mix 100 μL of protein (200 nM) with 100 μL of dye (100 nM).
Incubate for 30 min at room temperature.
Centrifuge the sample for 10 min at 4°C and 15, 000 × g.
Note: This step is crucial in reducing the noise in the MST data. Noise in the MST data can result from precipitation or aggregation of proteins. Aggregation can occur owing to intrinsic instability of proteins or due to the absence of interacting partners, stabilizing agents, or optimal buffer conditions (unlike in a native cellular environment).
The protein is labeled and ready for the binding assay.
Table 1. Compatibility of Tris-NTA dye with commonly used buffer components (as recommended by Nanotemper Technologies).
Compound Maximum allowed concentration Histidine 1 mM Imidazole 1 mM EDTA 0.5 mM TCEP* 0.5 mM DTT 5 mM β-mercapto-ethanol** 1 mM GSH 10 mM GTP, GDP 1 mM AMP, ADP, ATP 5 mM Glycerol 10 % Zn2+, Co2+, Cu2+ preloaded protein only*** Polyhistidine-tagged ligand None * NanoTemper Technologies recommends avoiding the use of TCEP with red dyes in general.
**We found that 7 mM β-mercapto-ethanol was compatible with our microscale thermophoresis (MST) assays
*** Zn2+, Co2+, and Cu2+ ions compete for the binding with RED-tris-NTA. Because of that, only low nanomolar concentrations of listed ions are tolerated.
Binding assay
Prepare serial dilutions of ligand in PCR tubes or plates
Prepare 25 μL of the ligand at 2× concentration (e.g., for a final concentration of 5 mM, prepare the ligand at a concentration of 10 mM).
Note: The highest ligand concentration in the binding reaction should be at least 20× the Kd to cover enough data points in the saturation as well as in the baseline of the binding curve. For instance, the measured binding affinities of Mom for Fe2+/3+ and acetyl coenzyme A were in the 10–100 μm range, and to have a satisfactory binding curve, the ligands were prepared at concentrations of 1 mM and 10 mM, respectively, in MST buffer. In cases where the binding affinity is completely unknown, a few ligand concentration ranges can be empirically tested based on assumed Kd values. Refer to the NanoTemper Technologies Concentration Finder tool for the ligand concentration range estimation.
Add 10 μL of PBS-T into the PCR tubes 2–16.
Transfer 20 μL of the ligand into PCR-tube 1.
Transfer 10 μL of the ligand from PCR-tube 1 to PCR-tube 2 with a pipette and mix by pipetting up and down multiple times. Transfer 10 μL to PCR-tube 3 and mix. Repeat the procedure for PCR-tube 4–16. Discard the extra 10 μL from PCR-tube 16.
Add 10 μL of labeled protein to each well (1–16) and mix by pipetting. The final target protein concentration is 50 nM. This concentration should be used for the calculation of the Kd value. Incubate the samples at room temperature for 5 min.
Note: Inclusion of 2-Mercaptoethanol at a final concentration of 7 mM in the binding buffer reduced noise in the data. Also, the use of premium coated capillaries instead of standard capillaries solved the problem of protein sticking to the capillary glass surface. Spinning the samples at 15,000 × g for 10 min after the labeling also reduced data noise.
Load the capillaries and start sample measurement at 25°C using 40% LED power and medium MST power. For each measurement, repeat experiments three times and carry out data analysis using NanoTemper MO analysis software.
Notes:
Recommended settings are 40% LED and a medium MST power. At the final dye concentration of 25 nM, the expected fluorescence intensity at LED 40% is around 300 counts on a Monolith NT.115.
The concentration of the labeled protein should be lower than your expected Kd. The labeled protein can be diluted to 10 nM. With an LED power of 100%, fluorescence intensities of 200–250 counts are typically achieved. Nanotemper Technologies does not recommend working with fluorescent intensities < 200 counts for MST measurements.
Data analysis
The MO control software first performs a capillary scan to ensure that the concentration is within the detection limits and if the protein is sticking to the capillary walls, as evidenced by shoulders or double peaks in the capillary scan traces instead of a smooth, symmetrical curve (Figure 2).
Note: If the protein is sticking to the capillaries, optimize the binding conditions by adding detergents or additives such as Tween-20, 2-Mercaptoethanol, BSA, or changing the pH or ionic strength of your buffer, changing to a different buffer, or using the premium coated capillaries. For all Mom-ligand interaction measurements, premium coated capillaries were used, and the binding buffer included 2-Mercaptoethanol at a final concentration of 7 mM.
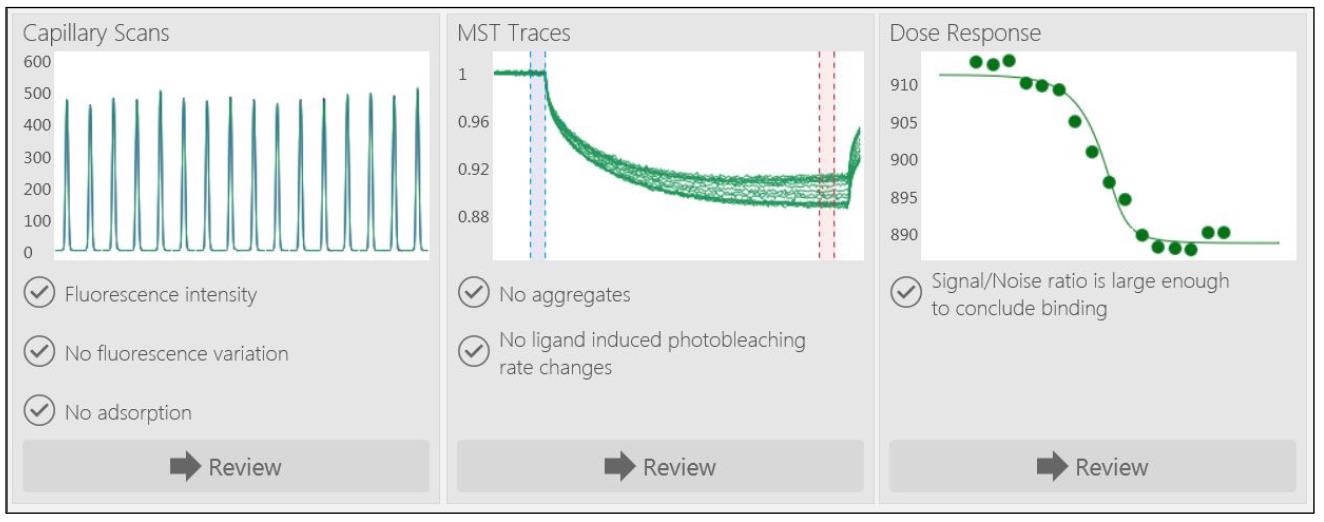
Figure 2. Capillary scan, microscale thermophoresis (MST) traces, and dose response of a representative experiment. Typical output of a representative MST experiment run using the MO control software is shown. A typical acquisition runs for 10 min.Data analysis was carried out using the MO.Affinity Analysis program (NanoTemper). Three replicates were merged to form one dataset.
Select the appropriate binding model. The Kd model is suitable for the vast majority of investigated interactions, while the Hill model is useful when the investigated interaction is known to be cooperative. We selected the Kd model, which is the standard fitting model derived from the law of mass action.
Tick the ‘TargetConc’ box to fix the concentration of the fluorescently labeled to 50 nM or other if diluted.
The program will compute the Kd value and the associated confidence. Within a confidence of 68%, Kd is within the given range. The lower this number, the more confident one can be about the given Kd.
MST evaluation strategy can be selected to default or manual to evaluate data along with either default or custom time points along the MST trace.
Inspect the binding curve. A signal-to-noise ratio of more than 5 is desirable, while more than 12 indicates an excellent assay. Free dye in the solution might impair the signal-to-noise ratio. In case the concentration of the protein prior to labeling has been overestimated, excess dye is present. Nanotemper Technologies recommends re-checking the concentration of the protein or increasing the ratio between the protein and the dye to, e.g., 4:1. Changing the laser power, which gives a better signal-to-noise ratio for the analysis, can also be helpful.
For comparing multiple datasets, such as for various Mom mutants, baseline-corrected normalized fluorescence, normalized for amplitude of each dataset was plotted by selecting the ‘Fraction bound’ option in the MO.Affinity Analysis program.
Data was exported to GraphPad Prism software, and the curves were re-plotted (Figure 3).
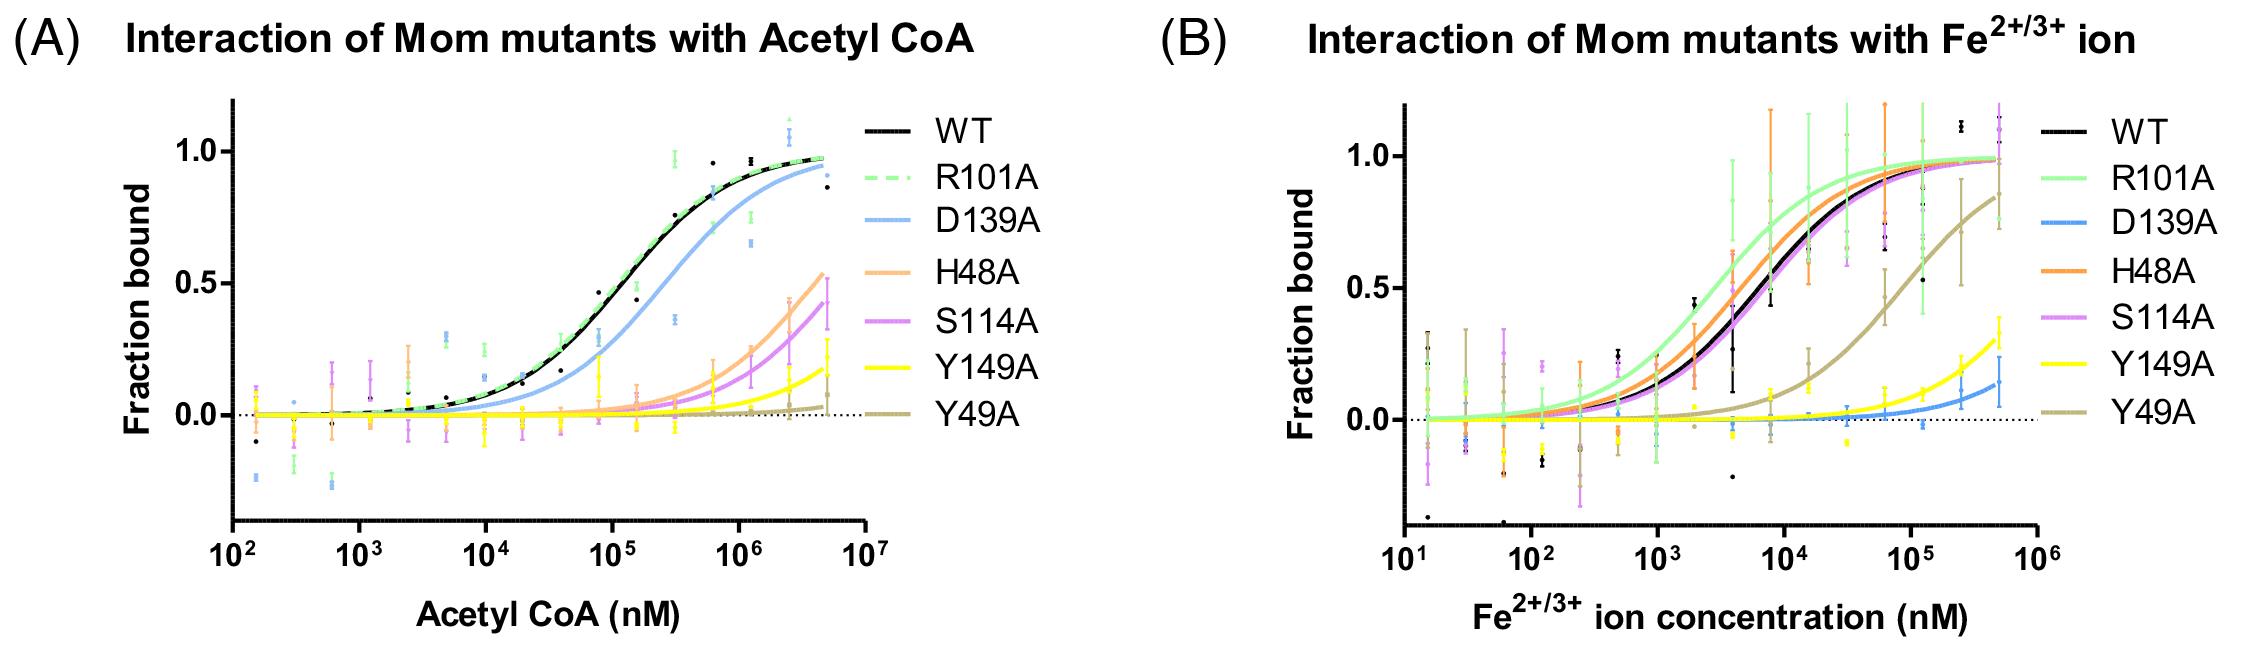
Figure 3. Microscale thermophoresis (MST) analysis of interactions of Mom with acetyl CoA and Fe2+/3+. His-tagged wild-type Mom (WT) and mutants were fluorescently labeled and titrated against indicated concentrations of ligands acetyl CoA (A) and Fe2+/3+(B). Normalized fluorescence is plotted for analysis of thermophoresis. Data shown are representative of three independent experiments. Error bars represent standard deviations of n = 3 measurements (adapted from Karambelkar et al., 2020).
Recipes
Lysis buffer
10 mM HEPES-NaOH pH 7.4
1 mM 2-Mercaptoethanol
1 M NaCl
1 mM PMSF
1 mg/mL lysozyme
Phosphocellulose binding buffer
10 mM HEPES-NaOH (pH 7.4)
1 mM 2-Mercaptoethanol
400 mM NaCl
Wash buffer 1
10 mM HEPES-NaOH (pH 7.4)
1 mM 2-Mercaptoethanol
400 mM NaCl
Wash buffer 2
10 mM HEPES-NaOH (pH 7.4)
1 mM 2-Mercaptoethanol
600 mM NaCl
Elution buffer
10 mM HEPES-NaOH (pH 7.4)
1 mM 2-Mercaptoethanol
1.5 M NaCl
Storage buffer
10 mM HEPES-NaOH (pH 7.4)
1 mM 2-Mercaptoethanol
300 mM NaCl
MST buffer
10 mM HEPES–NaOH (pH 7.4)
300 mM NaCl
7 mM 2-Mercaptoethanol
1× PBS-T (Phosphate buffered saline-Tween)
137 mM NaCl
2.7 mM KCl
10 mM Na2HPO4
1.8 mM KH2PO4
0.05% Tween 20
Acknowledgments
Dedicated to the memory of Stanley Hattman (1938-2020), whose pioneering work laid the foundation for many exciting discoveries in the field of bacteriophage Mu DNA modification. This protocol reports in detail the sample preparation and quantitative analysis of biomolecular interactions of the bacteriophage Mu DNA modification protein Mom using MST and is derived from our work published earlier (Karambelkar et al., 2020). The work was funded by various grants to V.N. from the Department of Science and Technology, Department of Biotechnology, Government of India. VN is a J.C. Bose Fellow of Department of Science and Technology, Government of India. S.K. was supported by fellowship from the Council of Scientific and Industrial Research, India. We thank Ujjwal Rathore for assisting with data analysis and are grateful to Saji Menon and Sivaramaiah Nallapeta of Nanotemper technologies for providing technical assistance with microscale thermophoresis.
Competing interests
The authors declare no conflict of interest or competing interest.
References
- Bartoschik, T., Galinec, S., Kleusch, C., Walkiewicz, K., Breitsprecher, D., Weigert, S., Muller, Y. A., You, C., Piehler, J., Vercruysse, T., et al. (2018). Near-native, site-specific and purification-free protein labeling for quantitative protein interaction analysis by MicroScale Thermophoresis. Sci Rep 8(1): 4977.
- Boccaletto, P., Machnicka, M. A., Purta, E., Piatkowski, P., Baginski, B., Wirecki, T. K., de Crecy-Lagard, V., Ross, R., Limbach, P. A., Kotter, A., et al. (2018). MODOMICS: a database of RNA modification pathways. 2017 update. Nucleic Acids Res 46(D1): D303-D307.
- Braner, M., Kollmannsperger, A., Wieneke, R. and Tampé, R. (2016). ‘Traceless’ tracing of proteins - high-affinity trans-splicing directed by a minimal interaction pair. Chem Sci 7: 2646-2652.
- Bryson, A. L., Hwang, Y., Sherrill-Mix, S., Wu, G. D., Lewis, J. D., Black, L., Clark, T. A. and Bushman, F. D. (2015). Covalent Modification of Bacteriophage T4 DNA Inhibits CRISPR-Cas9. mBio 6(3): e00648.
- Choi, I., Kim, R., Lim, H. W., Kaestner, K. H. and Won, K. J. (2014). 5-hydroxymethylcytosine represses the activity of enhancers in embryonic stem cells: a new epigenetic signature for gene regulation. BMC Genomics 15: 670.
- Corbeski, I., Horn, V., van der Valk, R. A., le Paige, U. B., Dame, R. T. and van Ingen, H. (2018). Microscale Thermophoresis Analysis of Chromatin Interactions. In: Bacterial Chromatin: Methods and Protocols. (Ed. Dame, R. T. (Ed.). pp 177-197, Springer, New York.
- Gao, Y., Cao, D., Pawnikar, S., Akhter, S., Miao, Y. and Liang, B. (2021). Efficient purification and assembly of ribonucleoprotein complex for interaction analysis by MST assay coupled with GaMD simulations. STAR Protoc 2(1): 100315.
- Green, A. A. and Hughes, W. L. (1995). [10] Protein fractionation on the basis of solubility in aqueous solutions of salts and organic solvents. In: Methods in Enzymology vol. 1 67-90 Academic Press.
- Griffin, B. A., Adams, S. R. and Tsien, R. Y. (1998). Specific covalent labeling of recombinant protein molecules inside live cells. Science 281(5374): 269-272.
- Gu, C., Begley, T. J. and Dedon, P. C. (2014). tRNA modifications regulate translation during cellular stress. FEBS Lett 588(23): 4287-4296.
- Hattman, S. (1999). Unusual transcriptional and translational regulation of the bacteriophage Mu mom operon. Pharmacol Ther 84(3): 367-388.
- Hutinet, G., Kot, W., Cui, L., Hillebrand, R., Balamkundu, S., Gnanakalai, S., Neelakandan, R., Carstens, A. B., Fa Lui, C., Tremblay, D., et al. (2019). 7-Deazaguanine modifications protect phage DNA from host restriction systems. Nat Commun 10(1): 5442.
- Jerabek-Willemsen, M., Wienken, C. J., Braun, D., Baaske, P. and Duhr. S. (2011). Molecular interaction studies using microscale thermophoresis. Assay Drug Dev Technol 9(4): 342-53.
- Kahmann, R. (1983). Methylation regulates the expression of a DNA-modification function encoded by bacteriophage Mu. Cold Spring Harb Symp Quant Biol 47 Pt 2: 639-646.
- Karambelkar, S., Udupa, S., Gowthami, V. N., Ramachandra, S. G., Swapna, G. and Nagaraja, V. (2020). Emergence of a novel immune-evasion strategy from an ancestral protein fold in bacteriophage Mu. Nucleic Acids Res 48(10): 5294-5305.
- Khavrutskii, L., Yeh, J., Timofeeva, O., Tarasov, S. G., Pritt, S., Stefanisko, K. and Tarasova, N. (2013). Protein purification-free method of binding affinity determination by microscale thermophoresis. J Vis Exp(78): 50541.
- Koh, C. S. and Sarin, L. P. (2018). Transfer RNA modification and infection - Implications for pathogenicity and host responses. Biochim Biophys Acta Gene Regul Mech 1861(4): 419-432.
- Krishnan, B., Szymanska, A. and Gierasch, L. M. (2007). Site-specific fluorescent labeling of poly-histidine sequences using a metal-chelating cysteine. Chem Biol Drug Des 69(1): 31-40.
- Lata, S., Reichel, A., Brock, R., Tampe, R. and Piehler, J. (2005). High-affinity adaptors for switchable recognition of histidine-tagged proteins. J Am Chem Soc 127(29): 10205-10215.
- Lee, Y. J. and Weigele, P. R. (2021). Detection of Modified Bases in Bacteriophage Genomic DNA. Methods Mol Biol 2198: 53-66.
- Lee, Y. J., Dai, N., Muller, S. I., Guan, C., Parker, M. J., Fraser, M. E., Walsh, S. E., Sridar, J., Mulholland, A., Nayak, K., et al. (2022). Pathways of thymidine hypermodification. Nucleic Acids Res 50(6): 3001-3017.
- Lindhoud, S., Westphal, A. H., Visser, A. J., Borst, J. W. and van Mierlo, C. P. (2012). Fluorescence of Alexa fluor dye tracks protein folding. PLoS One 7(10): e46838.
- Lippok, S., Seidel, S. A., Duhr, S., Uhland, K., Holthoff, H. P., Jenne, D. and Braun, D. (2012). Direct detection of antibody concentration and affinity in human serum using microscale thermophoresis. Anal Chem 84(8): 3523-3530.
- Magnez, R., Thiroux, B., Taront, S., Segaoula, Z., Quesnel, B. and Thuru, X. (2017). PD-1/PD-L1 binding studies using microscale thermophoresis. Sci Rep 7: 17623.
- Nienberg, C., Retterath, A., Becher, K. S., Saenger, T., Mootz, H. D. and Jose, J. (2016). Site-Specific Labeling of Protein Kinase CK2: Combining Surface Display and Click Chemistry for Drug Discovery Applications. Pharmaceuticals (Basel) 9(3): 36.
- Osuna, B. A., Karambelkar, S., Mahendra, C., Christie, K. A., Garcia, B., Davidson, A. R., Kleinstiver, B. P., Kilcher, S. and Bondy-Denomy, J. (2020a). Listeria Phages Induce Cas9 Degradation to Protect Lysogenic Genomes. Cell Host Microbe 28(1): 31-40 e39.
- Osuna, B. A., Karambelkar, S., Mahendra, C., Sarbach, A., Johnson, M. C., Kilcher, S. and Bondy-Denomy, J. (2020b). Critical Anti-CRISPR Locus Repression by a Bi-functional Cas9 Inhibitor. Cell Host Microbe 28(1): 23-30 e25.
- Reynolds, D., Cliffe, L., Forstner, K. U., Hon, C. C., Siegel, T. N. and Sabatini, R. (2014). Regulation of transcription termination by glucosylated hydroxymethyluracil, base J, in Leishmania major and Trypanosoma brucei. Nucleic Acids Res 42(15): 9717-9729.
- Seidel, S. A., Wienken, C. J., Geissler, S., Jerabek-Willemsen, M., Duhr, S., Reiter, A., Trauner, D., Braun, D. and Baaske, P. (2012). Label-free microscale thermophoresis discriminates sites and affinity of protein-ligand binding. Angew Chem Int Ed Engl 51(42): 10656-10659.
- Sood, A. J., Viner, C. and Hoffman, M. M. (2019). DNAmod: the DNA modification database. J Cheminform 11(1): 30.
- Wingfield, P. (2001). Protein precipitation using ammonium sulfate. Curr Protoc Protein Sci Appendix 3, Appendix 3F.
Article Information
Copyright
© 2022 The Authors; exclusive licensee Bio-protocol LLC.
How to cite
Udupa, S., Nagaraja, V. and Karambelkar, S. (2022). Binding Affinity Quantifications of the Bacteriophage Mu DNA Modification Protein Mom Using Microscale Thermophoresis (MST). Bio-protocol 12(14): e4472. DOI: 10.21769/BioProtoc.4472.
Category
Microbiology > Microbial biochemistry
Biochemistry > Protein > Interaction > Protein-ligand interaction
Do you have any questions about this protocol?
Post your question to gather feedback from the community. We will also invite the authors of this article to respond.