- Protocols

- Articles and Issues
- For Authors
- About
- Become a Reviewer

Evaluation of Urine Proteins by Capillary Electrophoresis
(*contributed equally to this work) Published: Vol 12, Iss 15, Aug 5, 2022 DOI: 10.21769/BioProtoc.4466 Views: 2196
Reviewed by: Manjula MummadisettiSaptashati BiswasAnonymous reviewer(s)
Original research article
The authors used this protocol in:

2021
Advertisement


Protocol Collections
Comprehensive collections of detailed, peer-reviewed protocols focusing on specific topics


Abstract
Capillary electrophoresis (CE) is a laboratory method usually used to separate proteins in body fluids such as serum, cerebrospinal fluid, or urine. Separation of proteins in urine can have clinical applications for evaluating samples from healthy dogs and dogs with proteinuria in a qualitative way, which would not be possible with gel electrophoresis. Other advantages of CE over gel electrophoresis in serum include the reduced separation time (2 min vs. 20 min in a gel), reduction of waste harmful to humans and the environment, and ability to obtain a curve without the need for additional staining. This protocol is divided into four steps. Firstly, urine needs to be prepared prior to dialysis. Secondly, urine needs to undergo dialysis to eliminate compounds that could interfere with separation, and to concentrate the urine. The third step is CE using specific equipment. The last step is to separate the fractions of the phoretograms obtained in the previous step. This method is mostly an automatized process, easily reproducible, and that can be performed in any laboratory, as a part of the diagnostic or follow-up of patients with renal disease.
Graphical abstract:
Background
Serum protein analysis by capillary electrophoresis (CE) is a well-established laboratory method used for the diagnosis and follow up of infectious, inflammatory, immune-mediated, and neoplastic conditions in human and veterinary medicine (Jenkins, 2009; Giordano and Paltrinieri, 2010). CE is one of the most frequent techniques used to separate serum proteins, as it is a simple, adaptable, and quick technique, and does not require a large sample amount. The CE laboratory technique is based on the separation of charged molecules by their electrophoretic mobility in an alkaline buffer at a specific pH. The separation occurs according to the electrolyte pH and electroosmotic flow, yielding different electrophoretic fractions (Osatinsky, 2007). In serum, the phoretogram is commonly divided into five different fractions, from low to high molecular weight and charge: albumin, alpha1 globulin, alpha2 globulin, beta globulin, and gamma globulin (Gay-Bellile et al., 2003; Tappin et al., 2011).
Recently, the analysis of proteins in urine by CE has proven to be a suitable method in human medicine to detect the presence of characteristic electrophoretic patterns in renal and extrarenal disorders, such as myelomas (Jenkins, 1997; Theodorescu et al., 2005; Mischak et al., 2010). Although quantitative proteinuria can only be assessed by calculation of the urine protein/creatinine ratio (UPC), electrophoretic techniques can be used as a qualitative method to assess the loss of proteins through the urine, as different patterns can be identified (Lees et al., 2005). CE associated with mass spectrophotometry techniques is also useful to identify peptide biomarkers associated with chronic kidney disease (Pelander et al., 2019). The use of urine to identify such abnormalities represents a great advantage over the use of blood, because urine can be collected in quantity, does not require trained staff for its collection, and urinary proteins remain stable for at least 3 days at 4ºC or 3 months at -20°C (Théron et al., 2017). They can provide information about kidney functionality earlier than blood biomarkers, such as SDMA or Cystatin C (Yalçin and Çetin, 2004; Pelander et al., 2019).
Comparison with other electrophoretic techniques that evaluate proteinuria could be challenging because the principle of migration is different. In sodium dodecyl sulfate agarose/polyacrylamide gel (SDS-AGE or SDS-PAGE) electrophoretic techniques, particle migration is only based on their molecular weight. Initially, it might be easier to identify proteins that migrate in the different phoretogram fractions (Yalçin and Çetin, 2004; Zini et al., 2004; Giori et al., 2011; Lavoue et al., 2015; Chacar et al., 2017; Hokamp et al., 2017). Nevertheless, the result of the technique presented in this manuscript is a profile, where abnormalities associated with protein excretions can be easily detected when compared against curves from healthy dogs and any other mammals.
The aim of this study is to establish a standardized protocol to prepare urine adequately, to evaluate the proteins in dog urine by CE on an instrument normally used for serum samples. It can be a useful tool to assess pathological proteinuria in dogs, alongside quantitative methods such as UPC.
Materials and Reagents
Ultrafiltration column 4 mL Vivaspin Turbo 4 10000 MWCO (Sartorius, Vivaspin Turbo 4, catalog number: VS04T02)
Eppendorfs 1.5 mL (Lambda, Eppendorf, catalog number: 1003/G)
Polystyrene tube for urine 12 mL (Lambda, catalog number: 301402)
10–200 μL tips (Lambda, catalog number: 18260)
Kit Minicap Protein (Sebia Hispania S. A., Sebia, catalog number: 2203). Storage temperature between 2 °C and 30 °C
Kit Urine Dialysis Capillarys (Sebia Hispania S.A., Sebia, catalog number: 2013). Storage temperature between 2 °C and 30 °C
Capiclean (Sebia Hispania S.A., Sebia, catalog number: 2058). Storage temperature between 2 °C and 30 °C
Reconstituted buffer for 4 samples (see Recipes)
Equipment
Minicap + Phoresis system (Sebia Hispania, S.A., catalog number Minicap: 1232; Phoresis. Software version 8.6.3)
Centrifuge Nahita 2650 (Nahita, Nahita 2650, catalog number: 200352650000)
Software
Minicap computer program (Sebia Hispania S.A. www.sebia.com)
Procedure
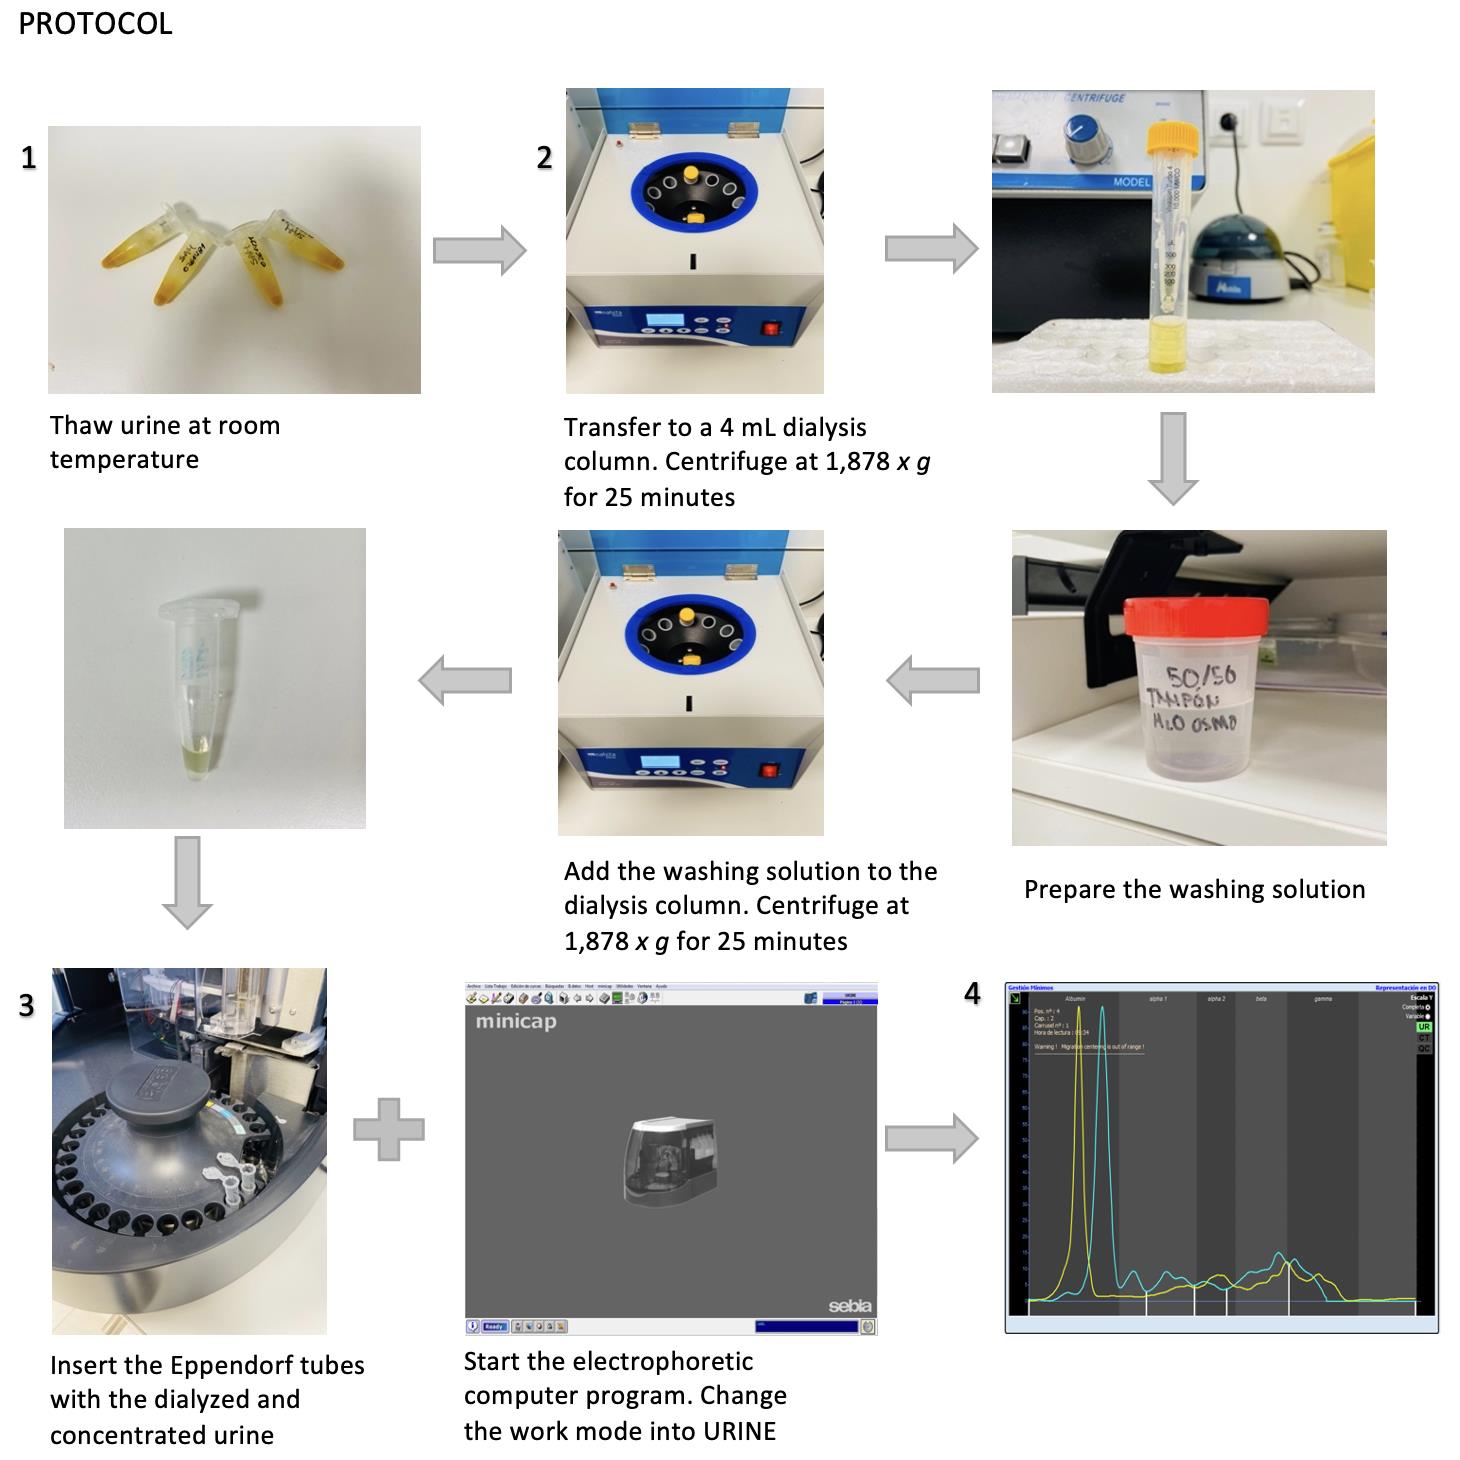
Preparation of the urine prior to dialysis
Centrifuge 10 mL of urine in a rounded bottom tube at 1,342 × g for 10 min. Identify the tube.
Label the Eppendorf tubes. Transfer and aliquot supernatants obtained in 1.5 mL Eppendorf tubes with a Pasteur pipette. Aliquot a minimum of 4 mL, at 1 mL per Eppendorf. Freeze samples at -20 °C until dialysis.
Note: As many supernatants as possible should be frozen, in case the dialysis process needs to be repeated. Additionally, 8 mL would be ideal, in case electrophoresis needs to be repeated.
Dialysis and concentration of the samples prior to capillary electrophoresis
Note: Urine is dialyzed and concentrated using 10 kDa molecular weight cut-off ultrafiltration columns, which are double membranous. This step is necessary not only to concentrate proteins, but also to avoid artifacts from contaminants (Figure 1).
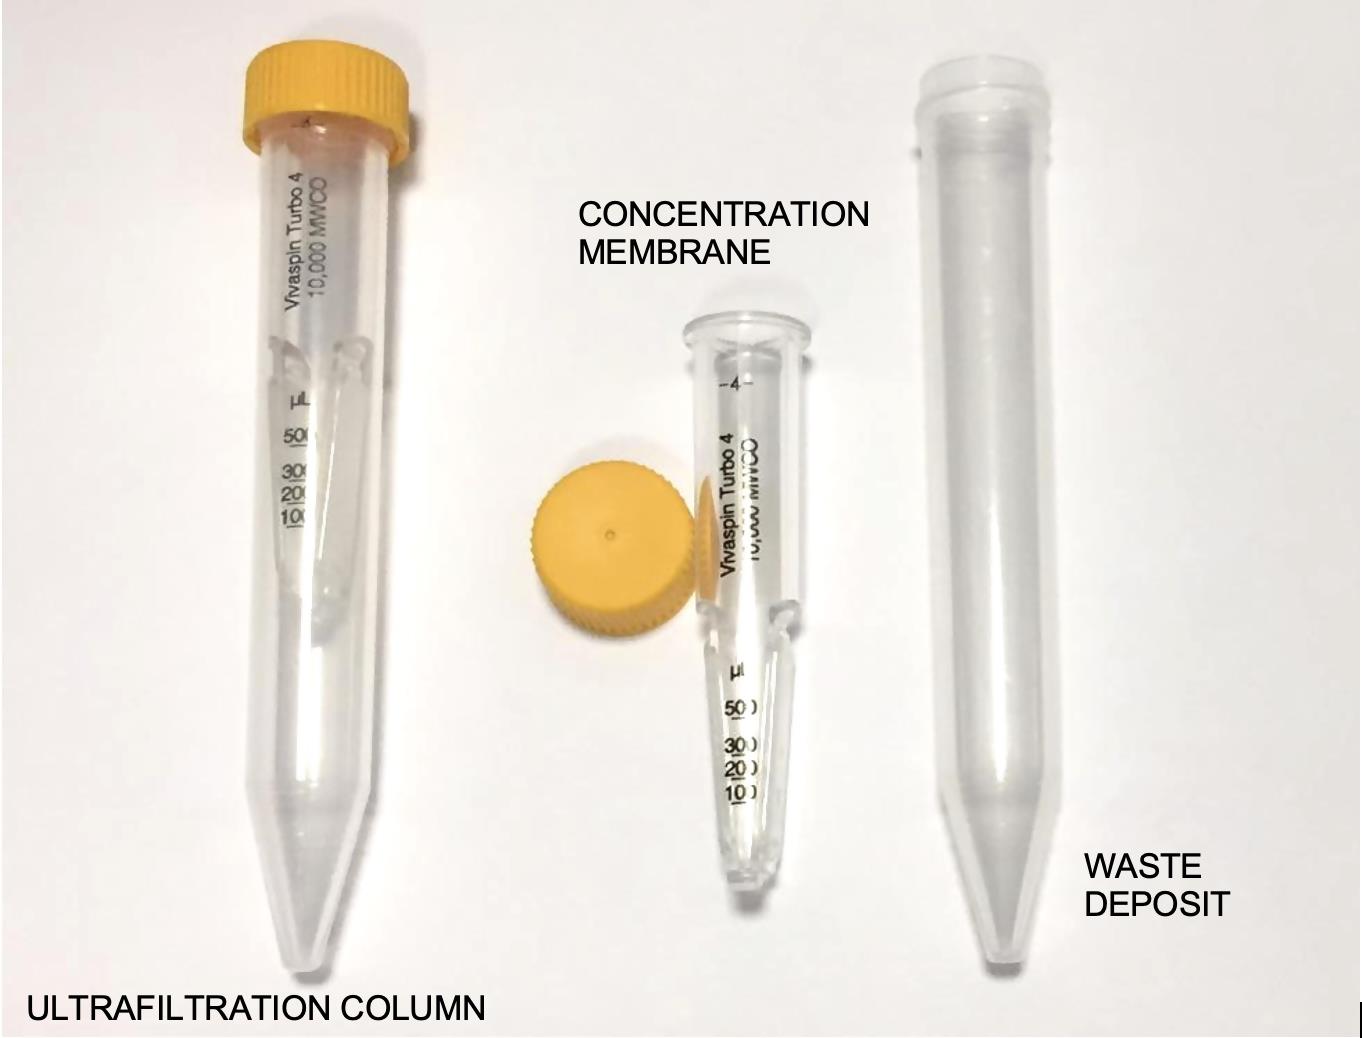
Figure 1. Different parts of an ultrafiltration colums tube 4 mL capacity. The concentration membrane where proteins are retained, and waste deposit where disposals are collected.Thaw 4 mL of urine supernatant from each individual to study at room temperature, and centrifuge the Eppendorf tubes at 1,609 × g for 10 min.
Transfer this sample to a 4-mL ultrafiltration column. Identify the ultrafiltration columns.
Note: Columns with 15 mL of capacity are available. In this work, due to the difficulty obtaining a large amount of urine, 4-mL columns are preferred.
Centrifuge the ultrafiltration column with the urine at 1,878 × g for 25 min, or until a maximum volume of 500 μL is left in the column.
Simultaneously, prepare a solution containing 50% distilled water and 50% dialysis buffer (see table of materials) in a sterile container. Use two 10-mL syringes to prepare the solution. Mix this solution prior to its use.
Discard the urine that emerges at the bottom of the column (waste deposit, Figure 1). With a Pasteur pipette, add the washing solution prepared in point 4 to the ultrafiltration column (concentration membrane, Figure 1) with the urine, up to the 4 mL mark.
Centrifuge the column with the urine and the buffer solution at 1,878 × g for 20 min, or until a maximum of 400–500 μL are left in the column.
Homogenize the dialyzed urine with a fine tip micropipette (maximum capacity: 200 mL), and transfer the dialyzed urine to an Eppendorf.
Note: The capillary electrophoresis equipment (see table of materials) requires a minimum of 100 μL.
Capillary electrophoresis of dialyzed samples
Start the electrophoretic computer program provided by the equipment manufacturer (Phoresis software version 8.6.3). Make sure that the analytical equipment is on too. Enter the program password: a pop-up window will appear and ask to continue with the current technique (protein) or change it to urine. You must change the work mode to urine. Make sure to check reagents and waste deposit before running the samples. A notification will appear on screen when the equipment is ready to process the samples.
Note: This can be done during the dialysis and concentration of the samples, since the start-up process of the analytical equipment takes 15 min.
Once the equipment is ready, insert the Eppendorf tubes with the dialyzed and concentrated urine into the electrophoresis instrument. Insert samples in pairs to reduce reagent wastage. As soon as the samples are inside, the electrophoretic instrument starts automatically. Do not open the instrument’s door until the CE process is finished.
Note: The analytical instrument can process 26 samples at the same time, and takes 10 min per sample.
Fraction separation
Phoretograms appear on the screen once the CE process is complete. Identify each phoretogram in the program with the patient’s number. Manually divide the phoretogram into five fractions—although the program establishes predetermined divisions, they are not designed for dog urine (Figure 2).
Note: The computer program allows manipulations of the profile, such as changing the size or superposition of curves, to be done manually on the phoretograms obtained (Video 1).
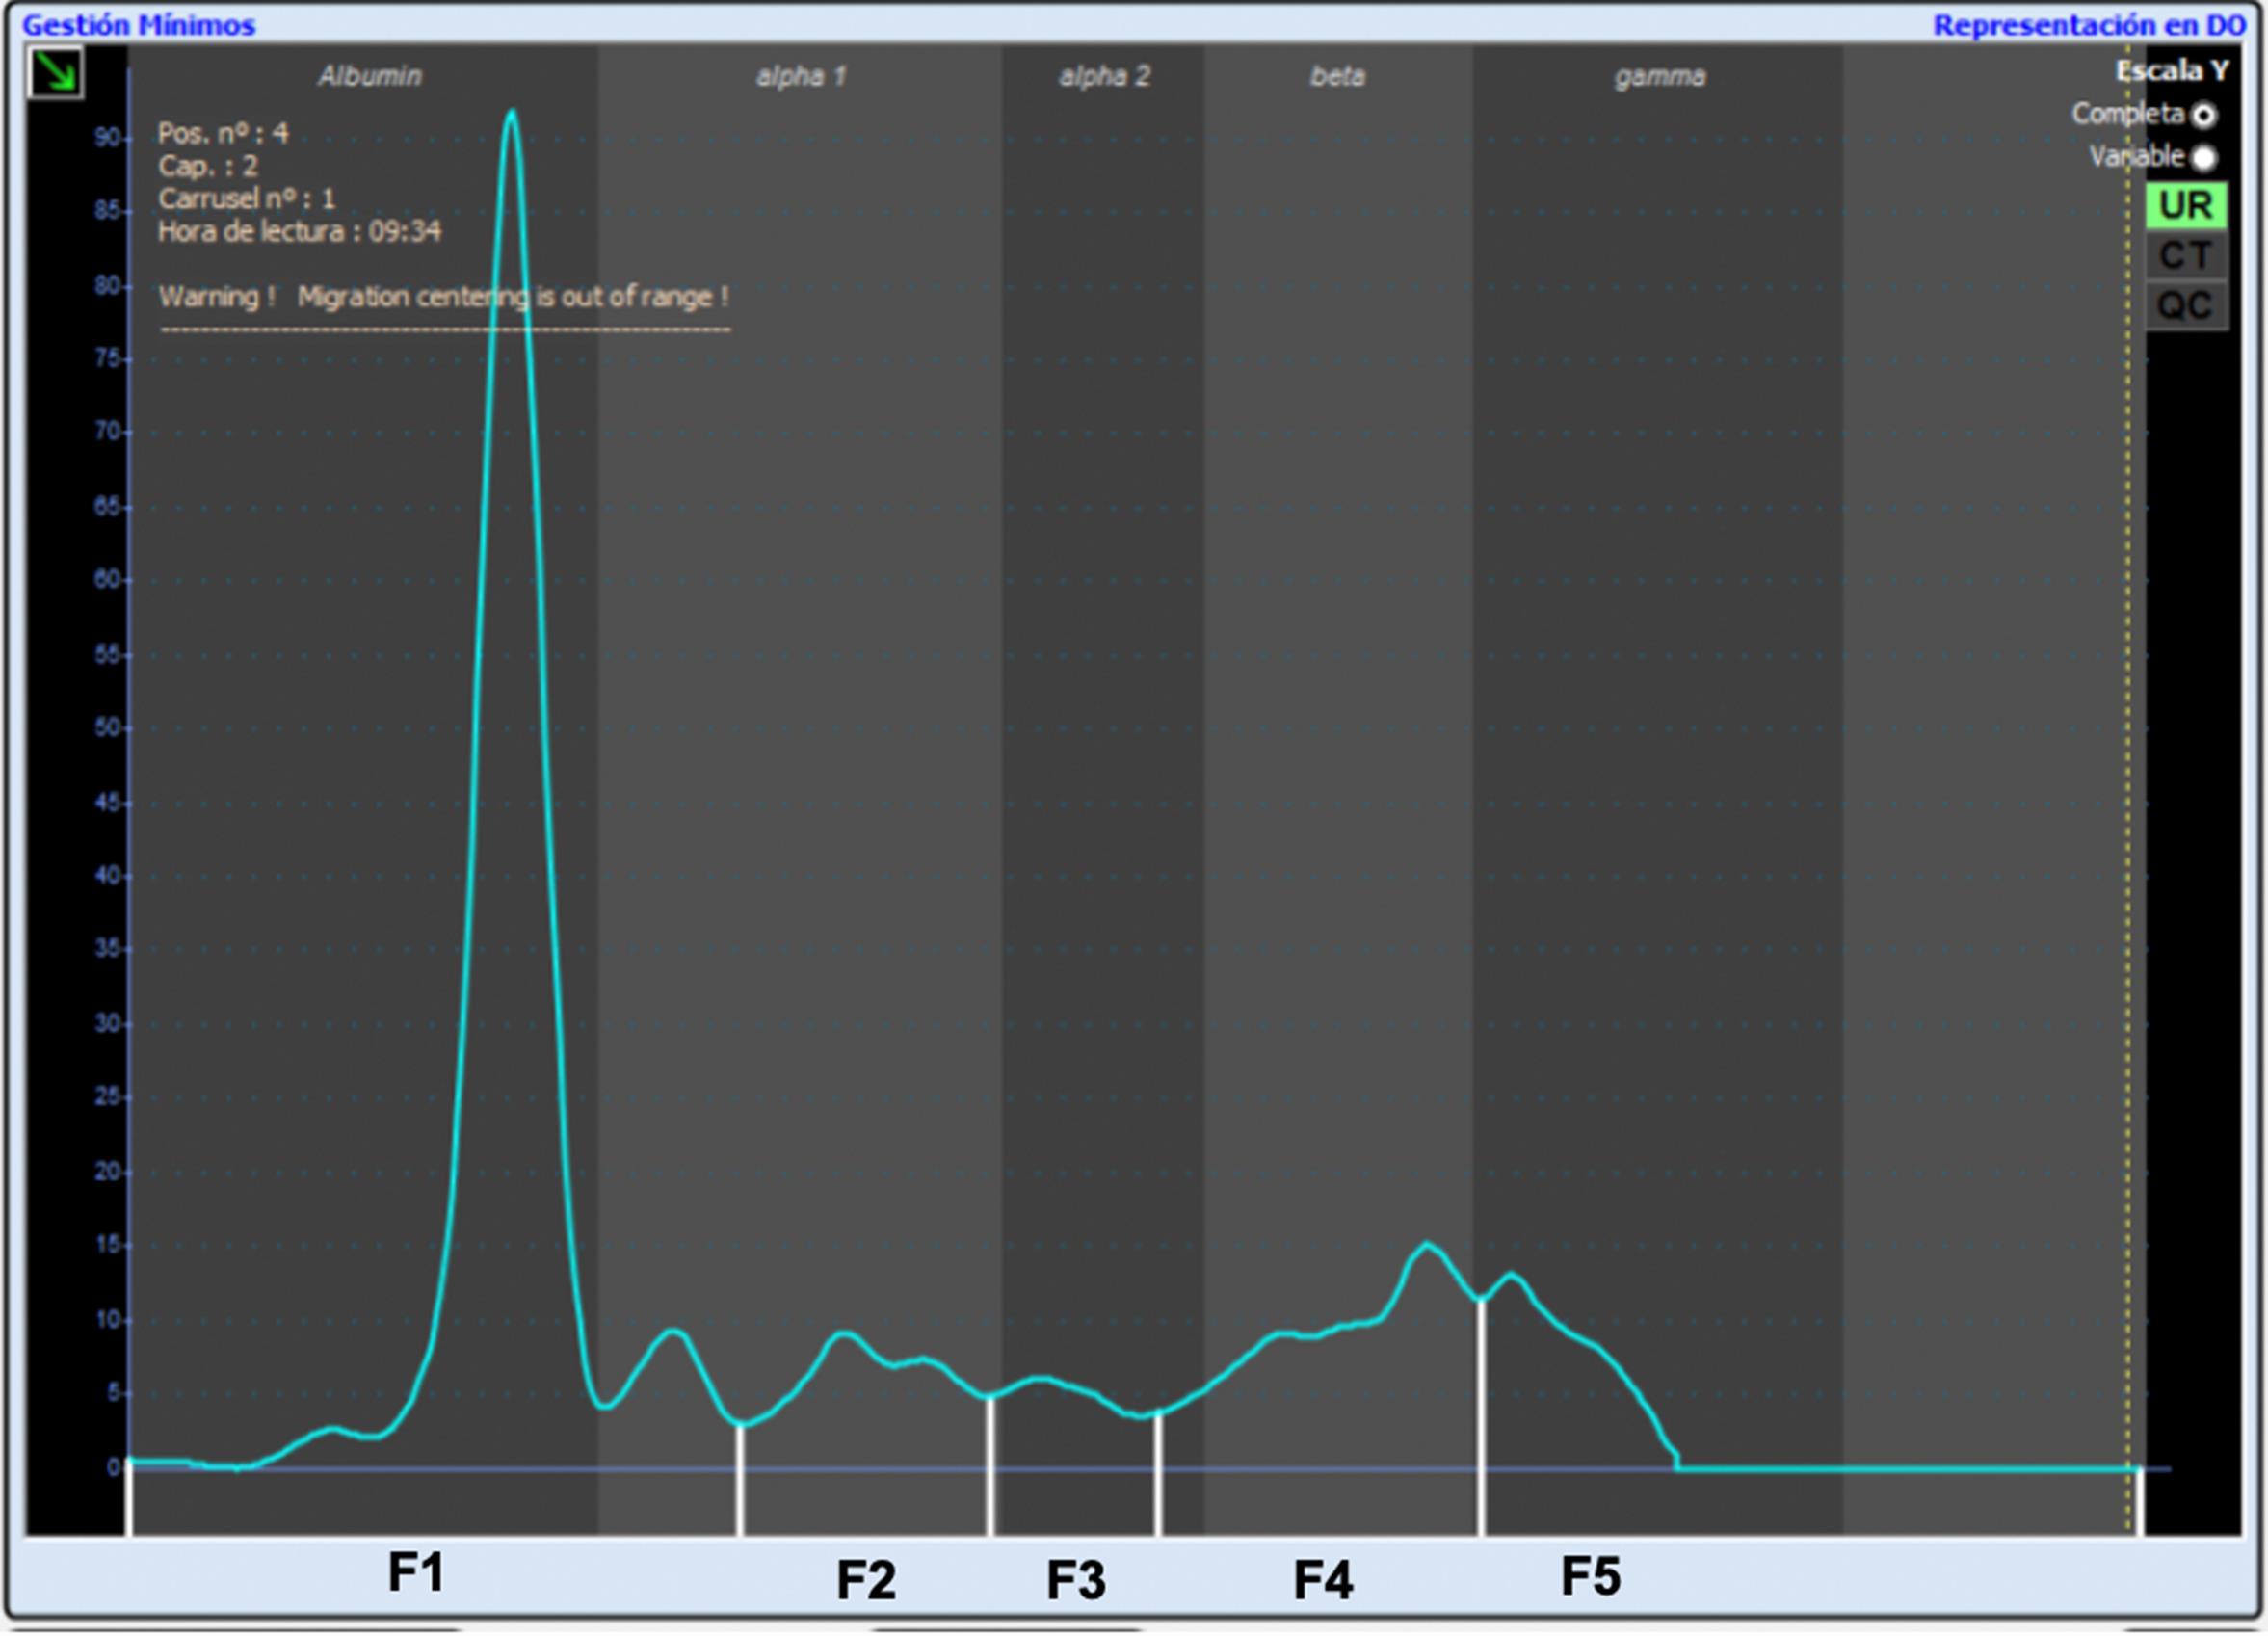
Figure 2. Final result of capillary electrophoresis in urine. Phoretogram with the five divisions indicated, from a healthy 2 year entire female Border Collie. Health check was assessed by hematology, biochemistry, serum phoretogram, and complete urinalysis. Video 1. Video of how a phoretogram can be divided and how quality control serum (yellow) is superimposed to the study curve (pink).
Recipes
Reconstituted buffer for 4 samples
Reagent Final concentration Amount Dialysis Buffer n/a 8 mL Distilled H2O n/a 2 mL Total 16 mL
Data analysis
The final result of CE in urine is a profile that represents the different protein fractions contained in dog urine, which varies depending on the amount of protein excreted.
The phoretogram was divided into five fractions based on serum CE. The different fractions that are obtained in each profile are F1—corresponding to albumin, F2—corresponding to alpha1 globulin, F3—corresponding to alpha2 globulin, F4—corresponding to beta globulin, and F5—corresponding to gamma globulin. These fractions were determined by superimposing a normal canine serum sample, diluted 1:49, and used as quality control, over the electrophoretic urine samples (Figure 3). Protein fractions were verified and, if necessary, corrected by visual inspection of the electrophoretogram.
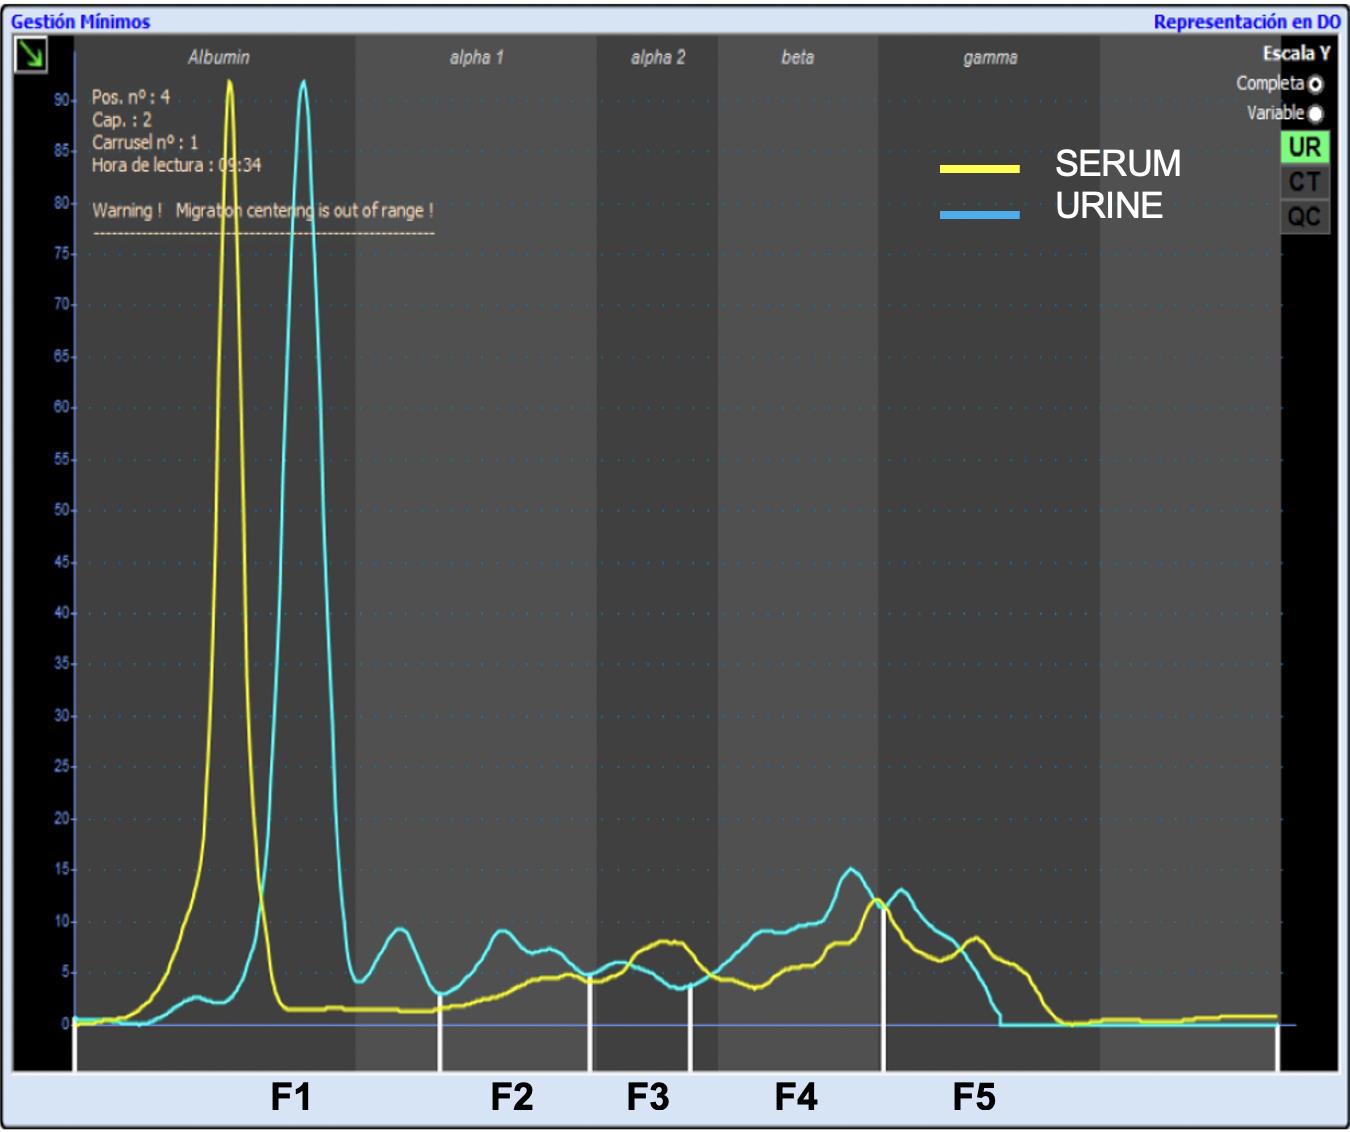
Figure 3. Normal canine diluted serum (yellow) superimposed on the study curve (blue). The phoretogram is divided into five fractions (F1–F5) according to the diluted canine serum.
Notes
As quality control material, frozen aliquoted serum from a healthy dog was included, diluted 1:49 in running buffer, and migrated prior to any run and in each batch. Internal verification experiments were also performed; within-run and between-run experiments were performed, using urine from a healthy dog. This urine was stored at 4°C during the entire experiment, and dialyzed and concentrated for every run following the manufacturer’s protocol. Three migrations per sample and day (repeatability) were made for five consecutive days (reproducibility), with the objective of calculating the CV for each of the fractions of the urinary proteinogram (Table 1). The CV results were 3.38%, 3.84%, 7.25%, 4.43%, and 7.31% for F1, F2, F3, F4, and F5, respectively. In the between-run experiment, the CV results were 4.78%, 5.17%, 10.0%, 6.09%, and 9.66% for F1, F2, F3, F4, and F5, respectively (Figure 4).
Table 1. Daily coefficient of variation and total coefficient of variation obtained from repeatability (R1, R2, and R3) and reproducibility (Days 1–5) experiments from each fraction (F1–F5).
| F1 | R1(%) | R2(%) | R3(%) | CVD(%) | CVT(%) |
| Day 1 | 54 | 53.2 | 54 | 0.86 | 4.77 |
| Day 2 | 45.3 | 49.8 | 55 | 9.70 | |
| Day 3 | 54.2 | 52.1 | 53.5 | 2.00 | |
| Day 4 | 53.5 | 53.4 | 51.3 | 2.35 | |
| Day 5 | 54.8 | 53.2 | 55.3 | 2.01 | |
| F2 | R1(%) | R2(%) | R3(%) | CVD(%) | CVT(%) |
| Día 1 | 9.6 | 9.6 | 9.7 | 0.60 | 5.72 |
| Día 2 | 11.2 | 11.2 | 9.6 | 8.66 | |
| Día 3 | 10.5 | 9.9 | 9.4 | 5.54 | |
| Día 4 | 10.9 | 10.4 | 10.1 | 3.86 | |
| Día 5 | 10.1 | 10 | 10.1 | 0.57 | |
| F3 | R1(%) | R2(%) | R3(%) | CVD(%) | CVT(%) |
| Día 1 | 5.8 | 5.7 | 5.2 | 5.77 | 10 |
| Día 2 | 6.8 | 5.7 | 5.8 | 9.97 | |
| Día 3 | 5.2 | 5.6 | 4.9 | 6.71 | |
| Día 4 | 5.1 | 5 | 5.2 | 1.96 | |
| Día 5 | 6.6 | 5.9 | 5.2 | 11.86 | |
| F4 | R1(%) | R2(%) | R3(%) | CVD(%) | CVT(%) |
| Día 1 | 20.6 | 21 | 21 | 1.10 | 6.09 |
| Día 2 | 23.3 | 22.2 | 20 | 7.69 | |
| Día 3 | 20.3 | 22.2 | 22.1 | 4.96 | |
| Día 4 | 19.5 | 21.2 | 21.2 | 4.75 | |
| Día 5 | 18.6 | 20 | 19.3 | 3.62 | |
| F5 | R1(%) | R2(%) | R3(%) | CVD(%) | CVT(%) |
| Día 1 | 10 | 10.5 | 10.1 | 2.59 | 9.66 |
| Día 2 | 13.4 | 11.1 | 9.6 | 16.83 | |
| Día 3 | 9.8 | 10.2 | 10.1 | 2.07 | |
| Día 4 | 11 | 10 | 12.2 | 9.95 | |
| Día 5 | 9.9 | 10.9 | 10.1 | 5.13 |
CVD= Daily Coeficient of Variation; CVT= Total Coeficient of Variation; R= Repetition
The limit of detection (LOD) was determined with the urine sample of the same healthy dog. Briefly, 1:2, 1:4, 1:8, and 1:16 dilutions of the dialyzed urine in running buffer were run. The LOD was selected as the last dilution with an electrophoretic pattern equal to the undiluted urine, which was 1:8. The sensitivity obtained in the LOD experiment was 2.1 mg/L, and the initial sample protein concentration was 17.5 mg/L.
Figure 4. Reproducibility and repeatability experiment using a urine from a healthy dog during five consecutive days. Urine from a healthy dog should be stored at 4 °C, to be dialyzed and concentrated prior to every run.
Acknowledgments
This work was supported by Universidad Católica de Valencia San Vicente Mártir grant (UCV 2016-226-001) (to LG).
This work has been adapted from previous work (Navarro et al., 2021).
Competing interests
The authors have no competing interests to disclose.
Ethics
All experimental procedures have been approved by the research and ethics committee of the Universidad Católica de Valencia San Vicente Mártir (Valencia, Spain; UCV 2017-2018-33).
References
- Chacar, F., Kogika, M., Sanches, T. R., Caragelasco, D., Martorelli, C., Rodrigues, C., Capcha, J. M. C., Chew, D. and Andrade, L. (2017). Urinary Tamm-Horsfall protein, albumin, vitamin D-binding protein, and retinol-binding protein as early biomarkers of chronic kidney disease in dogs. Physiol Rep 5(11): e13262.
- Gay-Bellile, C., Bengoufa, D., Houze, P., Le Carrer, D., Benlakehal, M., Bousquet, B., Gourmel, B. and Le Bricon, T. (2003). Automated multicapillary electrophoresis for analysis of human serum proteins. Clin Chem 49(11): 1909-1915.
- Giordano, A. and Paltrinieri, S. (2010). Interpretation of capillary zone electrophoresis compared with cellulose acetate and agarose gel electrophoresis: reference intervals and diagnostic efficiency in dogs and cats. Vet Clin Pathol 39(4): 464-473.
- Giori, L., Tricomi, F. M., Zatelli, A., Roura, X. and Paltrinieri, S. (2011). High-resolution gel electrophoresis and sodium dodecyl sulphate-agarose gel electrophoresis on urine samples for qualitative analysis of proteinuria in dogs. J Vet Diagn Invest 23(4): 682-690.
- Hokamp, J. A., Leidy, S. A., Gaynanova, I., Cianciolo, R. E. and Nabity, M. B. (2018). Correlation of electrophoretic urine protein banding patterns with severity of renal damage in dogs with proteinuric chronic kidney disease. Vet Clin Pathol 47(3): 425-434.
- Jenkins, M. A. (1997). Clinical application of capillary electrophoresis to unconcentrated human urine proteins. Electrophoresis 18(10): 1842-1846.
- Jenkins, M. A. (2009). Serum and urine electrophoresis for detection and identification of monoclonal proteins. Clin Biochem Rev 30(3): 119-122.
- Lavoue, R., Trumel, C., Smets, P. M., Braun, J. P., Aresu, L., Daminet, S., Concordet, D., Palanche, F. and Peeters, D. (2015). Characterization of Proteinuria in Dogue de Bordeaux Dogs, a Breed Predisposed to a Familial Glomerulonephropathy: A Retrospective Study. PLoS One 10(7): e0133311.
- Lees, G. E., Brown, S. A., Elliott, J., Grauer, G. E., Vaden, S. L. and American College of Veterinary Internal, M. (2005). Assessment and management of proteinuria in dogs and cats: 2004 ACVIM Forum Consensus Statement (small animal). J Vet Intern Med 19(3): 377-385.
- Mischak, H., Delles, C., Klein, J. and Schanstra, J. P. (2010). Urinary proteomics based on capillary electrophoresis-coupled mass spectrometry in kidney disease: discovery and validation of biomarkers, and clinical application. Adv Chronic Kidney Dis 17(6): 493-506.
- Navarro, P. F., Gil, L., Martin, G. and Fernandez-Barredo, S. (2021). Reference intervals for electrophoretograms obtained by capillary electrophoresis of dialyzed urine from healthy dogs. J Vet Diagn Invest 33(4): 632-639.
- Osatinsky, R. (2007). ¿Qué es la electrophoresis capilar? [What is capillary electrophoresis?] Bioquímica y patología clínica. 71: 60-66 Spanish.
- Pelander, L., Brunchault, V., Buffin-Meyer, B., Klein, J., Breuil, B., Zurbig, P., Magalhaes, P., Mullen, W., Elliott, J., Syme, H., et al. (2019). Urinary peptidome analyses for the diagnosis of chronic kidney disease in dogs. Vet J 249: 73-79.
- Tappin, S. W., Taylor, S. S., Tasker, S., Dodkin, S. J., Papasouliotis, K. and Murphy, K. F. (2011). Serum protein electrophoresis in 147 dogs. Vet Rec 168(17): 456.
- Theodorescu, D., Fliser, D., Wittke, S., Mischak, H., Krebs, R., Walden, M., Ross, M., Eltze, E., Bettendorf, O., Wulfing, C., et al. (2005). Pilot study of capillary electrophoresis coupled to mass spectrometry as a tool to define potential prostate cancer biomarkers in urine. Electrophoresis 26(14): 2797-2808.
- Théron, M. L., Piane, L., Lucarelli, L., Henrion, R., Layssol-Lamour, C., Palanche, F., Concordet, D., Braun, J. D., Trumel, C. and Lavoue, R. (2017). Effects of storage conditions on results for quantitative and qualitative evaluation of proteins in canine urine. Am J Vet Res 78(8): 990-999.
- Yalcin, A. and Çetin, M. (2004). Electrophoretic separation of urine proteins of healthy dogs and dogs with nephropathy and detection of some urine proteins of dogs using immunoblotting. Revue de Medecine Veterinaire 155: 104-112.
- Zini, E., Bonfanti, U. and Zatelli, A. (2004). Diagnostic relevance of qualitative proteinuria evaluated by use of sodium dodecyl sulfate-agarose gel electrophoresis and comparison with renal histologic findings in dogs. Am J Vet Res 65(7): 964-971.
Article Information
Copyright
© 2022 The Authors; exclusive licensee Bio-protocol LLC.
How to cite
Navarro, P. F., Gil, L. and Férnandez-Barredo, S. (2022). Evaluation of Urine Proteins by Capillary Electrophoresis. Bio-protocol 12(15): e4466. DOI: 10.21769/BioProtoc.4466.
Category
Biochemistry > Protein > Electrophoresis
Do you have any questions about this protocol?
Post your question to gather feedback from the community. We will also invite the authors of this article to respond.