- Protocols

- Articles and Issues
- For Authors
- About
- Become a Reviewer

Plasma Membrane Wounding and Repair Assays for Eukaryotic Cells
Published: Vol 12, Iss 11, Jun 5, 2022 DOI: 10.21769/BioProtoc.4437 Views: 3242
Reviewed by: Alka MehraAnonymous reviewer(s)
Original research article
The authors used this protocol in:

Jul 2021
Advertisement


Protocol Collections
Comprehensive collections of detailed, peer-reviewed protocols focusing on specific topics


Related protocols

Abstract
Damage to the plasma membrane and loss of membrane integrity are detrimental to eukaryotic cells. It is, therefore, essential that cells possess an efficient membrane repair system to survive. However, the different cellular and molecular mechanisms behind plasma membrane repair have not been fully elucidated. Here, we present three complementary methods for plasma membrane wounding, and measurement of membrane repair and integrity. The first protocol is based on real time imaging of cell membrane repair kinetics in response to laser-induced injury. The second and third protocols are end point assays that provide a population-based measure of membrane integrity, after either mechanical injury by vortex mixing with glass beads, or by detergent-induced injury by digitonin in sublytic concentrations. The protocols can be applied to most adherent eukaryotic cells in culture, as well as cells in suspension.
Keywords: Cell injuryBackground
Unlike prokaryotic cells, which are protected by a cell wall, eukaryotic cells lack this shield, and are thus more vulnerable to membrane lesions (Cooper and McNeil, 2015). The plasma membrane of eukaryotic cells is composed of a phospholipid bilayer with integrated transmembrane proteins, which essentially constitutes the physical barrier separating the cell from the extracellular environment, and sustains an essential osmotic gradient to the outside (Khan et al., 2013). The integrity of the plasma membrane is frequently compromised during the lifetime of most cells by different means. Cells that reside in mechanically active tissue environments, e.g., muscle and lung cells, frequently experience injuries to their plasma membrane (McNeil and Khakee, 1992; Gajic et al., 2003). Both mechanical stresses and chemical stresses, such as pore-forming toxins secreted by invading pathogens (Bischofberger et al., 2009), can each induce membrane damage, which poses an immediate threat to cell survival if not repaired. Hence, cells have developed effective plasma membrane repair mechanisms to cope with membrane injuries and ensure cellular homeostasis. Repair mechanisms are strictly dependent on the influx of extracellular calcium ions (Ca2+) into the cell through the wound, and involve several cellular processes, including cytoskeleton reorganization (Abreu-Blanco et al., 2011b), exocytosis (Bi et al., 1995; Andrews et al., 2014), endocytosis (Idone et al., 2008), and membrane shedding (Scheffer et al., 2014; Jimenez et al., 2014; Sønder et al., 2019). The different repair mechanisms appear to be utilized in combination, depending on the kind of injury imposed on the membrane (Cooper and McNeil, 2015; Boye and Nylandsted, 2016). Furthermore, the influx of extracellular Ca2+ triggers rapid recruitment of various Ca2+-activated repair proteins to the damaged membrane, including members of the annexin family, which are directly involved in the immediate repair response, to seal the hole within seconds (A. K. McNeil et al., 2006; Bouter et al., 2011; Jaiswal et al., 2014; Boye et al., 2017; Sønder et al., 2019). The early repair responses occur within seconds to a few minutes after injury, and both the efficiency and underlying mechanisms of repair determine cellular fate: either cell death, or successful cell repair and restructuring. After initial membrane resealing, where annexins play a major role, cells need to restructure and remove damaged membrane, involving both exocytic and endocytic events, including macropinocytosis. To this end, we recently found that breast cancer cells use macropinocytosis coupled to components of the non-canonical autophagy system (a process termed LC3-associated macropinocytosis), to remove damaged parts of the plasma membrane, and restore membrane integrity (Sønder et al., 2021).
As loss of cell membrane integrity in vivo occurs due to a variety of physiological stressors, several experimental methods have been developed to mimic these conditions. These methods include cell-confined induced injury by passing cells through a narrow bore syringe, scraping attached cells from the substrate, or exposing cell monolayers to rolling glass beads (P. L. McNeil, 2001; P. L. McNeil et al., 2001; Corrotte et al., 2015; Jaiswal et al., 2014). However, these injury methods can be challenging to reproduce exactly, as they depend, for example, on the forces that are applied to the syringe, the cell confluency before scraping, or rolling with glass beads, resulting in great variability in the population of injured cells between samples. On the other hand, more controlled membrane lesions can be obtained using bacterial pore-forming toxins, e.g., Streptolysin O (SLO), which results in approximately 30 nm pores (Tweten, 2005; Idone et al., 2008). However, approaches using pore-forming toxins do not mimic mechanically-induced injuries in vivo, as these toxins chemically alter the cell membrane, by extracting lipids such as cholesterol (Gonzalez et al., 2008; Babiychuk et al., 2011). Thus, the choice of injury type is of great importance, since it can affect what can be learned about the repair response.
The first protocol presented here (Protocol A) is a method to monitor cell membrane repair kinetics in living cells, following UV ablation laser-induced plasma membrane injury. The two following protocols (Protocol B and Protocol C) are end point assays that can be used to identify, e.g., a deficit in the repair ability in different cellular conditions. Laser-induced injury is a very useful experimental approach, as it creates localized and well controlled injuries, which can be combined with live-cell imaging to follow fluorescently tagged proteins during the repair process (Jaiswal et al., 2014; Sønder et al., 2019). The laser injury approach has been used for monitoring cell membrane repair in various studies, in both mammalian and invertebrate organisms (McNeil et al., 2003; Abreu-Blanco et al., 2011a).
To analyze the extent of membrane damage and the kinetics of membrane repair, different fluorescent membrane impermeable dyes can be applied, including Hoechst 33258, propidium iodide (PI), FM1-43, and FM4-64. When the membrane is breached, Hoechst 33258 and PI, which are both membrane impermeant, can enter the cell and bind to nucleic acids. Here, the resulting fluorescence in the nuclei can be quantified as a measure of increased membrane permeability, i.e., poor membrane integrity. The FM dyes are styryl lipophilic dyes that increase in fluorescence intensity upon phospholipid binding. They will enter the cell through a membrane breach, thereby functioning as a read-out of the extent of injury and healing response, from which the repair kinetics can be calculated (Betz et al., 1996; Corrotte et al., 2015). However, FM dyes bind to the plasma membrane and are also taken up by the cell via endocytic mechanisms, which results in intense intracellular staining independent of membrane lesions over the long term. Thus, FM dyes are best suitable for measuring repair kinetics in short term assays. For long term assays, impermeable Hoechst 33258 or PI should be used instead, since these dyes only stain nucleic acids, and do not appear in internalized vesicles, as FM dyes do. For the laser-induced injury protocol, the cell membrane is injured by a high intensity single photon nanosecond pulsed laser, in presence of cell impermeant dye. The injury causes the impermeant dye to enter the cell, and repair restricts further dye entry, resulting in a fluorescence plateau. In contrast, failure to repair causes a continuous entry of the dye into the injured cell, and intracellular dye fluorescence will steadily increase.
The last two protocols presented here are end point assays, and provide a population-based measure for monitoring plasma membrane repair. End point assays are used to gain insight into the involvement of cellular and molecular processes in membrane repair. Their simplicity is an advantage when investigating novel repair proteins, and mechanisms involved in cellular repair, especially when investigating several conditions at the same time. However, the cellular repair response is a complex process that cannot be fully monitored without temporal resolution, which can be achieved using methods that enable controlled local injury of the cell membrane, and allow real time monitoring of the repair response. In both end point assays presented here, membrane integrity is measured using the membrane permeant dye Hoechst 33342, and membrane impermeant dye PI. By using a microscopy-based plate reader (Celigo® Imaging Cytometer), the number of total cells (Hoechst 33342 positive cells) and permeabilized cells (PI positive cells) are measured per well. An advantage of using image-based assays, to quantify membrane permeabilization and cell death, is that it provides information at the single cell level, as compared to enzymatic assays. In the first protocol, cells are mechanically injured by vortex mixing with glass beads (Protocol B), and in the second assay the cells are chemically injured using the detergent digitonin (Protocol C). Digitonin, a saponin from Digitalis purpurea (Sudji et al., 2015), is typically used in most laboratories to completely lyse cell membranes. However, it can also be used in sublytic concentrations, creating plasma membrane damage that can be repaired by cells (Boye et al., 2017; Heitmann et al., 2021). The exact mechanism of digitonin hole formation is still not clear, but known to be dependent on cholesterol in the membrane (Sudji et al., 2015). Therefore, the extent of membrane damage is dependent both on the cholesterol content in the plasma membrane, and digitonin concentration.
With these three protocols, we describe different plasma membrane wounding methods and membrane integrity assays. We have used these methods combined with siRNA knockdown of genes of interest, and pharmacological treatments [e.g., 5-(N-Ethyl-N-isopropyl) amiloride (EIPA), and trifluoperazine (TFP)], to elucidate the role of different repair proteins, including S100A11, and members of the annexin protein family, in membrane repair response to different types of injury (Jaiswal et al., 2014; Sønder et al., 2019; Boye et al., 2017; Heitmann et al., 2021; Sønder et al., 2021).
Protocol A: Plasma membrane repair kinetics upon laser injury in live cells
Materials and Reagents
RPMI 1640, without Phenol Red (Gibco® by Life Technologies, purchased via Thermo Fisher Scientific, catalog number: 32404014)
Trypsin, TrypLETM Express Enzyme (1×), no phenol red (Gibco® by Life Technologies, purchased via Thermo Fisher Scientific, catalog number: 12604013) (storage 4°C)
Fetal Bovine Serum (FBS) (Gibco® by Life Technologies, purchased via Thermo Fisher Scientific, catalog number: 10270106, 6%, storage 4°C)
GlutaMax (Gibco® by Life Technologies, purchased via Thermo Fisher Scientific, catalog number: 35050061, 2 mM, storage 4°C)
HEPES buffer solution stock 1 M (Sigma-Aldrich, catalog number: H3375, dissolved in H2O, storage 4°C)
Calcium-free imaging media (e.g., Hanks’ balanced salt solution (HBSS), without calcium, magnesium, nor phenol red (Gibco® by Life Technologies, purchased via Thermo Fisher Scientific, catalog number: 14175095, storage 4°C, use pre-heated to 37°C)
Cells tested in the current protocol
MCF7 human breast carcinoma cells
HeLa human cervix carcinoma cells
SH-SY5Y is a thrice-subcloned human cell line derived from the SK-N-SH neuroblastoma cell line
FM1-43 (Invitrogen, catalog number: T3163, 1.6 µM, store in aliquots -20°C)
FM4-64 (Invitrogen, catalog number: T13320, 2.5 µM, store in aliquots -20°C)
Propidium iodide (PI) (Sigma-Aldrich, catalog number: P4864, 0.5 µg/mL, stock 1 mg/mL, dissolved in H2O, storage 4°C)
Hoechst 33258 (Sigma-Aldrich, catalog number: 861405, 2.5 µg/mL, storage 4°C)
Cell imaging media (CIM) (see Recipes)
Equipment
Cell culture incubator set at 37°C, 5% CO2
35 mm, No. 1.0 Coverslip, 14 mm glass bottom, uncoated MatTek dish (MatTek Corporation, p35G-1.0-14-C)
Confocal microscope equipped with a spinning disk, ablation laser and a 63× water objective. In this protocol we use the following microscope and equipment:
Inverted microscope Eclipse Ti-E (Nikon) with a 63× water objective
UltraVIEW VoX Spinning Disk (PerkinElmer)
355 nm UV ablation laser (Rapp OptoElectronic)
Heated chamber (37°C) for live cell imaging
Software
Volocity software (PerkinElmers)
SysCon software (Rapp OptoElectronic)
Prism (GraphPad Software, Inc) or Microsoft Excel (Microsoft)
Procedure
A. Real time kinetics of plasma membrane repair following laser injury using live cell imaging
Seed 1 × 10⁵ cells in a 35-mm MatTek imaging-culture dish with a glass bottom, and allow cells to adhere overnight in a cell culture incubator at 37°C.
Set up 2–3 dishes per condition. Depending on the cell line, the number of seeded cells should be adjusted to obtain approximately 50% confluency on the day of the experiment.
Optional step: Pretreat cells with an inhibitor, or apply siRNA to knockdown a gene of interest.
Next day (on the day of experiment) prepare imaging media: preheat cell imaging media (CIM, see Recipes) at 37°C.
Prepare FM dye solution in preheated CIM.
The optimal dye concentration varies between dyes and cell lines, and should be optimized. For MCF7 and HeLa cells, FM1-43 at 1.6 µM works well. In this example, we use the FM1-43 dye in MCF7 cells.
Note: Depending on your experimental setup, other impermeable dyes, such as FM4-63, impermeable Hoechst 33258, or PI, can be used as well.
Wash cells with preheated CIM, and add 1–2 mL of CIM containing the FM dye to the dish.
Place the dish in the microscope holder in the stage maintained at 37°C, and set the focus to visualize plasma membrane-associated FM dye (Figure 1A; and Videos 1 & 2). We use a 63× water objective in an inverted microscope Eclipse Ti-E (Nikon) equipped with a top incubator, to maintain a steady temperature.
Note: The following steps provide a general outline of the experiment. Details will change depending on the microscope used, so the user should get training for their particular setup before performing the experiment.
Select a 1–2 µm region of interest within the plasma membrane of any intact single cell, orient the laser to that region, and irradiate with a 355 nm UV ablation laser for <4 ns, using an optimal laser power. The laser power of the instrument should be adjusted, to obtain a reproducible and non-lethal injury.
Notes:
The ablation laser is always calibrated before starting the experiments. Settings of the ablation laser are instrument- and cell line-dependent, and must be optimized. In our laboratory, we use the following setting at our system for MCF7 and HeLa cells: 2.6% power, 200 Hz repetition rate, pulse energy >60 µJ, and pulse length <4 ns.
Our system allows making laser stripes, rectangles, and spot injuries. We use the spot laser injury consistently (laser injury site indicated by arrow in Figure 1A, or star on videos), with the laser settings indicated above. However, in other systems, e.g., 3i laser ablation system, the injury area can be adjusted at will.
When working with lasers, you should always have laser safety in place, especially when working with pulsed lasers, as these can reach very high power in each short pulse, making them very dangerous. Some safety precautions include having an incubation chamber with laser interlock, and laser safety goggles, which should be used when there is a risk of potential exposure to the eyes.
Monitor the repair kinetics by imaging every 5 s in bright field and epifluorescence, starting prior to injury, and continuing for 5 min following injury.
For a negative control (i.e., no repair), repeat steps A4–A8 using Ca2+-free CIM containing the FM dye. Repeat steps A7–A8 for at least 10 cells per condition, obtained in three independent experiments.
Note: If the assay is combined with any pre-treatment, the researcher should include samples with control cells without laser injury, to rule out plasma membrane injury resulting from the pre-treatment alone.
Images are acquired with the inverted microscope Eclipse Ti-E (Nikon) paired with the UltraVIEW VoX Spinning Disk (PerkinElmer), using the 63× water objective.
Data analysis
Representative data
Protocol A describes how to measure the kinetics of plasma membrane repair upon laser injury and subsequent repair in live cells, by monitoring the entry of FM dye in the cells.
To quantify plasma membrane permeability (a read-out of membrane integrity), measure the intracellular FM dye fluorescence intensity at a single cell level across time points, using appropriate imaging software, e.g., Volocity. The intracellular FM dye fluorescence intensity is measured by selecting a specific region of interest inside the cell at the site of injury (the region where FM dye starts entering the cell: area outlined by the white dashed line in Figure 1A). Calculate the change in fluorescence intensity (F/F0) during the course of imaging, by normalizing the fluorescence intensity for each time point (F) to the fluorescence intensity before injury (F0). At least 10 cells per condition should be measured.
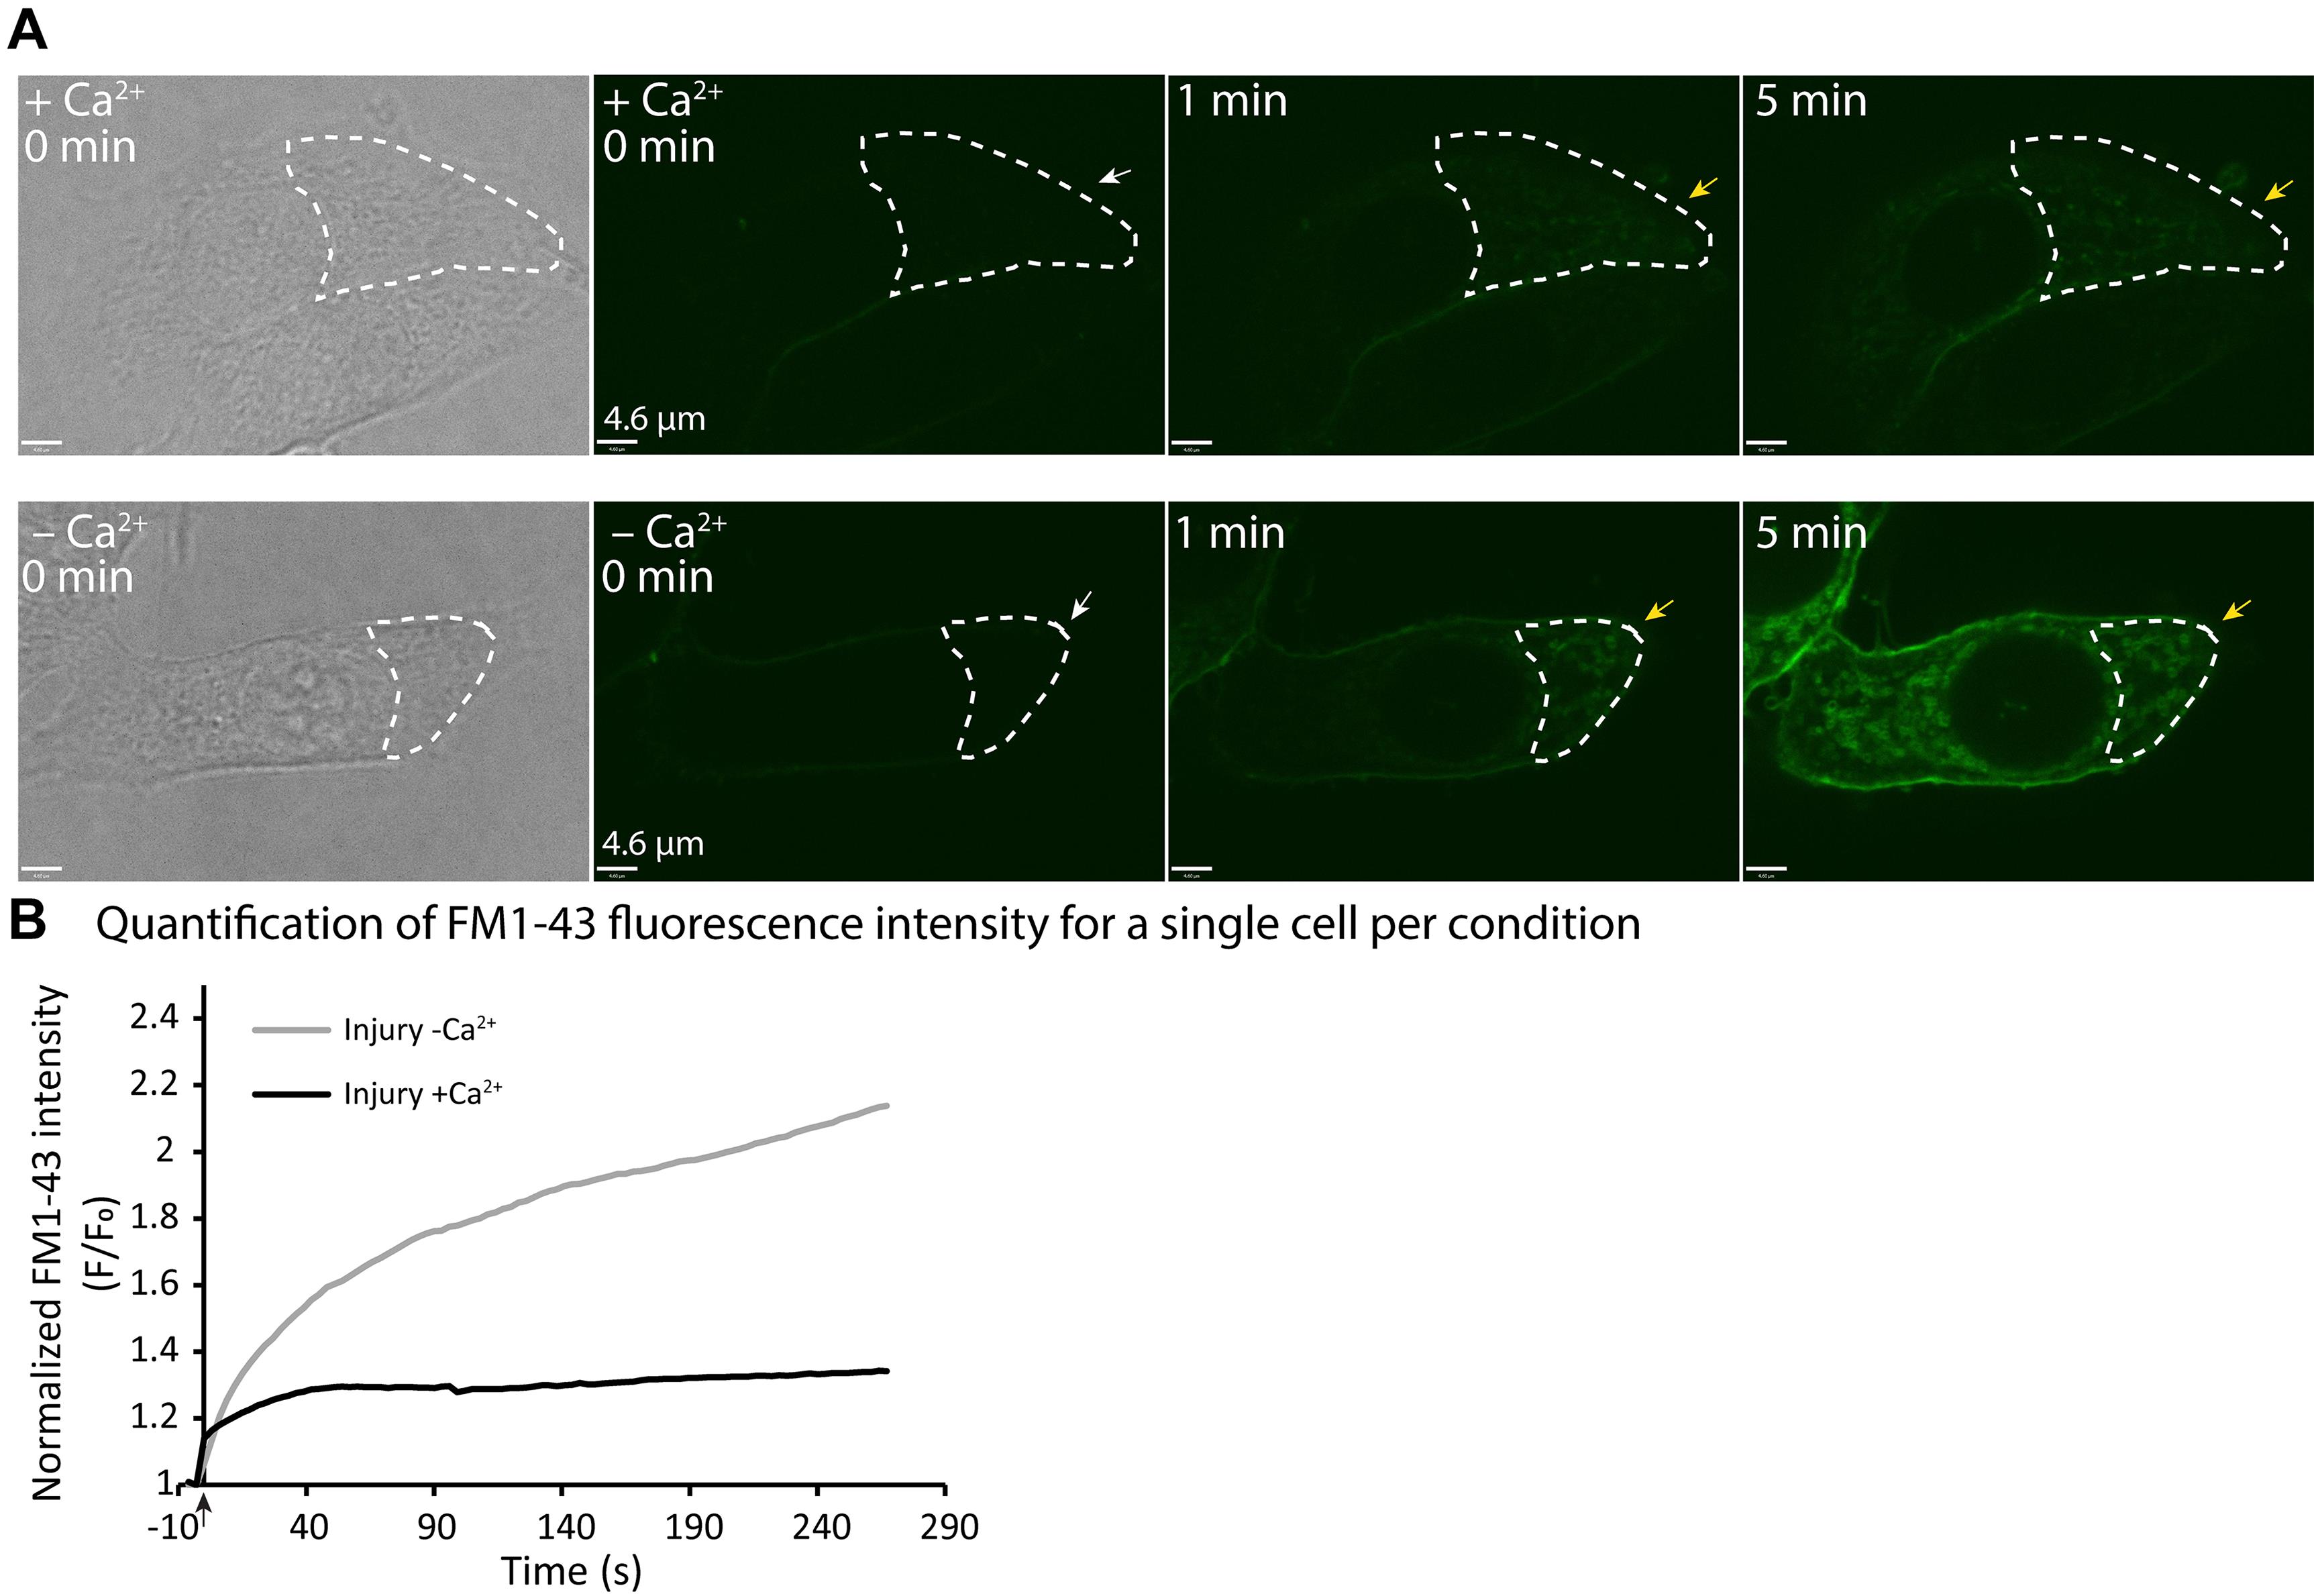
Figure 1. Example of real time imaging of cell membrane repair in response to laser injury.(A) MCF7 cells were injured by ablation with an UV laser in media containing FM1-43, and in the presence (top panel), or absence (bottom panel) of Ca2+. Representative images of injured MCF7 cells showing intracellular FM1-43 accumulation over time (before and after the injury). White arrows indicate injury sites, while yellow arrows indicate FM1-43 accumulation. The area outlined by the white dashed line illustrates the area used for FM1-43 fluorescence intensity quantification. See Videos 1 & 2. (B) Quantification of single cell membrane repair kinetics upon laser injury in a MCF7 cell, in media with or without Ca2+, measured as the change in FM1-43 dye fluorescence intensity (F/F0) over time, in the region where FM1-43 dye enters the cell (site of damage). The black arrow indicates the injury time point. Scale bar =4.6 µm.
Plot the mean or individual cell changes in fluorescence intensity (F/F0: y-axis) over time (x-axis) (Figure 1B). When representing as means, at least 10 cells per condition obtained from three independent experiments must be considered, and the standard error of mean (SEM) must be plotted. For statistical analysis, area under the curve (AUC) analysis followed by unpaired t-test with Welch’s correction are calculated. For example of quantification of more cells, and a plot representing mean fluorescence intensity, see Figure 1A in Sønder et al. (2021).
Representative images for each condition are selected at different time points starting before injury, to assemble a panel of images showing the influx of FM dye under the different conditions (with or without Ca2+) (Figure 1A). The representative images are annotated to demonstrate how the region of interest is selected (Figure 1A).
 Video 1. Uptake of FM1-43 dye after laser injury in media with Ca2+ in a MCF7 cell Video 2. Uptake of FM1-43 dye after laser injury in media without Ca2+ in a MCF7 cell
Notes
The FM dyes bind to lipid membranes, but does not diffuse across intact plasma membranes. However, FM dyes are also taken up by the cell via endocytosis, making the assay for measuring repair kinetics only suitable for short term assays. The timescale for performing the experiment depends on how fast the cell of choice is taking up the FM dye without any damage. In our laboratory, where we use MCF7 or HeLa cells, we normally only use a dish for laser-induced injury experiments for 20–30 min after addition of FM-dye; after this time, it becomes difficult to measure the additional influx of FM-dye after injury.
For long term assays, impermeable Hoechst 33258 or PI should be used. The assay can also be combined with different pre-treatments, such as trifluoperazine (TFP), or knockdown of a gene of interest by siRNAs. For examples where the assay is combined with different pre-treatments, see Sønder et al. (2019), Heitmann et al. (2021), and Sønder et al. (2021).
Recipes
Cell imaging media (CIM)
Colorless RPMI 1640 supplemented with 6% FBS, 2 mM GlutaMax, and 25 mM HEPES.
Protocol B: Membrane integrity following mechanical injury using vortex mixing with glass beads
Materials and Reagents
6-well cell culture plates or 10-cm cell culture dishes
Eppendorf tubes
Falcon tubes
96-well cell culture plates clear flat bottom
Multichannel pipette
RPMI 1640 (Gibco® by Life Technologies, purchased via Thermo Fisher Scientific, catalog number: 11875085)
Fetal Bovine Serum (Gibco® by Life Technologies, purchased via Thermo Fisher Scientific, catalog number: 10270106) (6%, storage 4°C)
Hanks’ balanced salt solution (HBSS), no calcium, no magnesium, no phenol red (Gibco® by Life Technologies, purchased via Thermo Fisher Scientific, catalog number: 14175095) (storage 4°C, use pre-heated to 37°C)
Trypsin, TrypLETM Express Enzyme (1×), no phenol red (Gibco® by Life Technologies, purchased via Thermo Fisher Scientific, catalog number: 12604013) (storage 4°C)
DPBS, no calcium, no magnesium (Gibco® by Life Technologies, purchased via Thermo Fisher Scientific, catalog number: 14190144) (storage 4°C)
Cells tested in the current protocol
MCF7 human breast carcinoma cells
HeLa human cervix carcinoma cells
MDA-MB-231 cells, originating from breast carcinoma
425-600 µm glass beads (Sigma-Aldrich, catalog number: G8772) (Storage RT)
bisBenzimide H 33342 trihydrochloride (hereafter Hoechst, catalog number: 33342) [Sigma-Aldrich, catalog number: B2261, 6.25 µg/mL, stock (25 mg/mL), dissolved in H2O}. Store at -20°C long term, and at 4°C for a short time, where it is stable for 1 month.
Propidium iodide (PI) [Sigma Aldrich, P4864, 0.25 µg/mL, stock (1 mg/mL), dissolved in H2O]. Store at 4°C.
Equipment
Balance
Cell culture incubator set at 37°C, 5 % CO2
V-shape reservoirs
Vortex mixer
Timer
Plate-based bright field and fluorescent imaging cytometer, with minimum two fluorescent channels (excitation 377/50 and emission 477/22, and excitation 531/40 and emission 629/53), e.g., Celigo® Imaging Cytometer (Brooks Life Science Systems).
Software
Celigo Software (Brooks Life Science Systems)
Prism (GraphPad Software, Inc), or Microsoft Excel (Microsoft)
Procedure
B. Membrane integrity following mechanical injury using vortex mixing with glass beads
Note: All cell culture incubations should be performed in a humidified 37°C, 5% CO2 incubator, unless otherwise specified. See Figure 2A for flowchart of the protocol.
Prepare 1.5-mL Eppendorf tubes with 250 mg glass beads (425–600 µm).
Note: Prepare at least three Eppendorf tubes per cell line per condition.
Seed an appropriate amount of cells in either a 6-well culture plate, or 10-cm culture dish, depending on the experiment.
Note: The cells should not be more than 80% confluent on the day of the experiment.
Optional step: Pretreat cells with an inhibitor, or perform siRNA knockdown of a gene of interest.
On the day of experiment, trypsinize adherent cells of interest.
Remove all media from the cell culture dish.
Wash the adherent cell monolayer once, with a small volume of DPBS without Ca2+ and Mg2+, to remove any residual FBS that may inhibit the action of trypsin.
Note: Wash cells in a buffered salt solution that is Ca2+- and Mg2+-free, as Ca2+ and Mg2+ in the salt solution can cause cells to stick together.
Add enough trypsin to the cell culture, to cover the adherent cell layer.
Incubate cells in a cell culture incubator for 2–5 min.
Tap the bottom of the plate on the countertop to dislodge cells.
Note: Check the cell culture with an inverted microscope to be sure that cells are rounded up and detached from the surface. If cells are not sufficiently detached, return the cell culture to the incubator for an additional minute or two.
Add appropriate culture media, and resuspend the cells.
Count cells and separate them into two falcon tubes, one tube for cells in media with Ca2+, and one tube for cells in media without Ca2+
Note: If the cells have been pretreated with an inhibitor or by siRNA knockdown of a gene of interest, they should be counted for each condition.
Spin the cells down at 300 × g at room temperature for 4 min, and resuspend cells in media, either with or without Ca2+. HEPES is added to both falcon tubes to a final concentration of 25 mM.
Load 7 × 10⁴ cells in suspension with 250 mg glass beads (425–600 µm) in a 1.5-mL Eppendorf tube, at a density of 200,000 cells/mL.
Notes:
The number of cells should be optimized for different cell lines. The appropriate number of cells needs to be loaded to the glass beads in a volume of 350–400 µL. For MCF7 and HeLa cells, we use 7 × 10⁴ cells in suspension with 250 mg glass beads (425–600 µm), loading 350 µL resuspended cells at a density of 200,000 cells/mL on the glass beads.
As negative control of no repair, include samples with cells in Ca2+-free media loaded on glass beads.
Incubate tubes in a cell culture incubator for 10 min.
Note: The cells are incubated to maintain optimal cell conditions, including temperature (37°C), before injury by vortex mixing.
Meanwhile, add 50 µL of media, either with or without Ca2+, to the respective wells in a 96-well plate.
Injure the cells by vortex mixing at maximum speed for 0, 30, or 60 s.
The vortex time might need optimization, as some types of cells are more fragile than others, and the repair efficiency also varies between different cell lines. The optimal vortex time should result in 10–30% permeabilized cells in media with Ca2+ without any other pre-treatment, since most cells need to be able to repair their membrane damage in this condition. This balance results from the fact that a certain amount of cells need to be permeabilized to ensure that the cells have been damaged, but, on the other hand, there should still be room for an increase in permeabilized cells, when other conditions where the cells are compromised in their membrane repair are included in the assay.
Immediately after injury, plate 10,000 cells per well in a 96-well plate. Make triplicates for each condition. Shake the plate by hand to distribute the cells in the wells.
Note: Each 96-well should contain 50 µL of media with resuspended cells (10,000 cells), and the 50 µL culture media added in step B9.
Incubate the 96-well plate in a cell culture incubator for 5 min, for the cells to repair.
Prepare PI and Hoechst 33342 dye mix, in media with and without Ca2+.
Note: Final concentrations should be 0.25 µg/mL PI, and 6.25 µg/mL Hoechst 33342.
Carefully add 50 µL of the respective PI/Hoechst dye mix to the respective wells in the 96-well plate, and incubate in a cell culture incubator for 5 min.
Measure membrane integrity using an imaging cell cytometer (e.g., Celigo®), by determining membrane integrity using the number of total cells (Hoechst 33342 positive cells: excitation 350 nm, emission 461 nm), and the number of permeabilized cells (PI positive cells: excitation 535 nm, emission 617 nm) per well.
The Celigo® is a multichannel imaging cell cytometer that can be used to perform whole-well live cell analysis, using optical microscopy. In this experiment, cells are labeled with permeable Hoechst 33342 dye, and impermeable PI dye, prior to scanning and analysis. The cytometer scans the selected area, e.g., a 96-well in the selected channels. The software can then be used to identify labeled cells in the selected channel, thereby calculating the number of total cells (Hoechst positive cells), and the number of permeabilized cells (PI positive cells).
Note: The user should get particular training in their equipment before setting up the experiment.
Data analysis
Representative data
Protocol B describes how to monitor membrane integrity after mechanical-induced injury by vortex mixing with glass beads.
Calculate the mean values of the triplicate measurements for PI (permeabilized cells) and Hoechst 33342 (total cells) positive cells.
Calculate the percentage of permeabilized cells per condition, by relating the total number of PI positive cells to the total number of Hoechst 33342 positive cells per condition. For statistical analysis, at least three independent experiments should be performed, and standard deviations should be plotted. For examples where statistical analysis has been applied, and the assay is combined with different pre-treatments, see Heitmann et al. (2021), and Sønder et al. (2021).
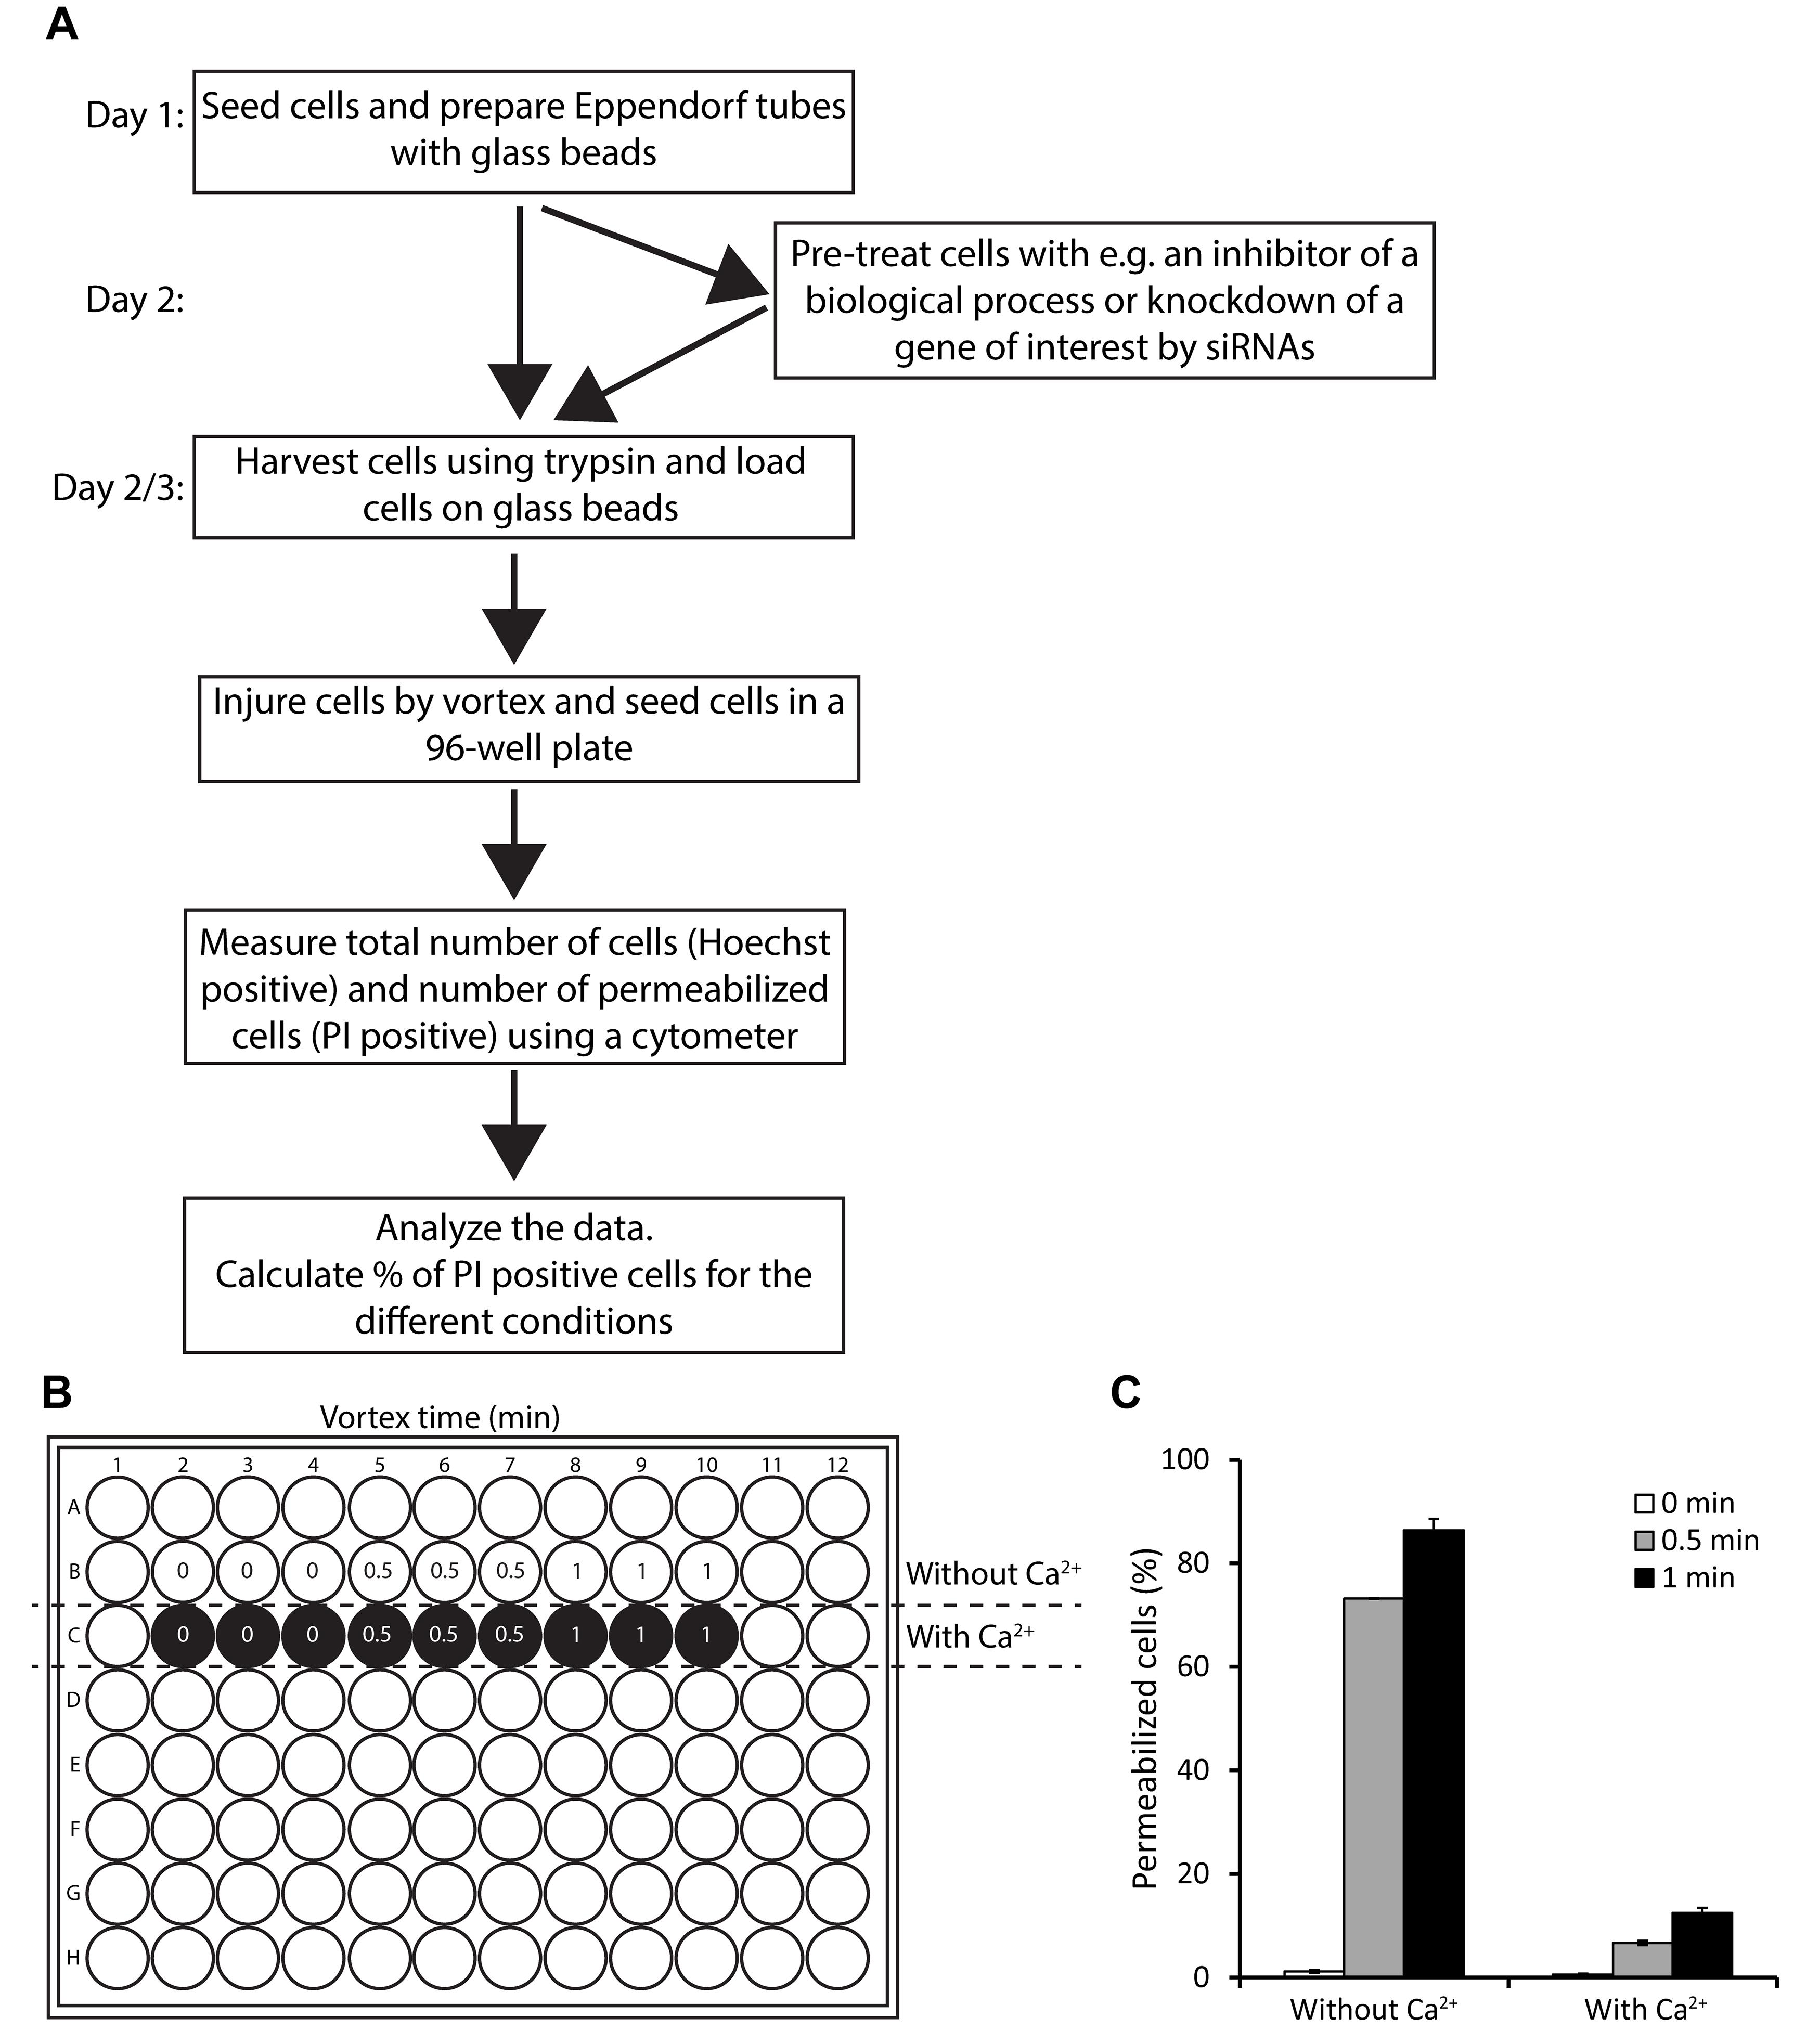
Figure 2. Example of membrane integrity assay, following mechanically-induced injury by vortex with glass beads.(A) Flowchart of the protocol. (B) Membrane integrity assay sample setup in a typical 96-well format in media with and without Ca2+. (C) Plasma membrane integrity in MCF7 cells in suspension exposed to vortex with glass beads for 0, 0.5, or 1 min, in media with or without Ca2+. The percentage of permeabilized cells is calculated based on the number of cells containing impermeable PI, and the total number of cells (detected by the permeable Hoechst 33342 dye). Data represent means of triplicate measurements, and error bars indicate SD values. The optimal vortex time is the time that results in 10–30% permeabilized cells for cells in media with Ca2+ without any other pre-treatment, since most cells need to be able to repair their membrane damage in this condition. Here, 1 min of vortex mixing is the optimal vortex time for MCF7 cells, as this results in approximately 12% permeabilized cells in media with Ca2+ after vortex mixing with glass beads.
Notes
The assay can also be combined with different pre-treatments, e.g., inhibitors of different biological processes, such as 5-(N-Ethyl-N-isopropyl) amiloride (EIPA), that inhibits macropinocytosis, or e.g., knockdown of a gene of interest by siRNAs. For examples where the assay is combined with different pre-treatments, see Heitmann et al. (2021), and Sønder et al. (2021).
Protocol C: Membrane integrity following detergent induced injury using digitonin
It should be noted that the ability of digitonin to permeabilize cellular membranes depends not only on the digitonin concentration, but also on the total amount of digitonin molecules per cell. Thus, digitonin should always be used in the same volume per cell.
Materials and Reagents
Eppendorf tubes
96-well cell culture plates clear flat bottom
Multichannel pipette
RPMI 1640 (Gibco® by Life Technologies, purchased via Thermo Fisher Scientific, 11875085)
Fetal Bovine Serum (Gibco® by Life Technologies, purchased via Thermo Fisher Scientific, catalog number: 10270106) (6%, storage 4°C)
Cells tested in the current protocol
MCF7 human breast carcinoma cells
HeLa human cervix carcinoma cells
NCI-H1299 originating from non-small-cell lung cancer
MDA-MB-231 cells originating from breast carcinoma
Digitonin (Sigma-Aldrich), Digitonin Stocks (5 and 50 mg/mL), dissolved in H2O. Store at -20°C. Digitonin usually precipitates, and must be redissolved by heating and occasional vortexing. Immediately before use, heat the digitonin stock to 95°C for 5 min, to dissolve precipitates.
Hoechst 33342 (Sigma-Aldrich, catalog number: B2261, 6.25 µg/mL, stock (25 mg/mL), dissolved in H2O. Store at -20°C long term, and 4°C short time (stable for 1 month).
Propidium iodide (PI) (Sigma-Aldrich, catalog number: P4864, 0.25 µg/mL, stock (1 mg/mL), dissolved in H2O. Store at 4°C.
Equipment
Cell culture incubator set at 37°C, 5% CO2
V-shape reservoirs
Vortex mixer
Heat block
Timer
Plate-based bright field and fluorescent imaging cytometer, with a minimum of two fluorescent channels (excitation 377/50 and emission 477/22, and excitation 531/40 and emission 629/53), e.g., Celigo® Imaging Cytometer (Brooks Life Science Systems)
Software
Celigo Software (Brooks Life Science Systems)
Prism (GraphPad Software, Inc) or Microsoft Excel (Microsoft)
Procedure
C. Membrane integrity following detergent induced injury using digitonin
Part 1: Determining the optimal digitonin concentration for creating plasma membrane damage that most cells are able to repair (see Figure 3A for flowchart of the protocol).
The following procedure is necessary to determine the optimal digitonin concentration for creating plasma membrane damage that can be repaired by most cells (~80%) in Ca2+ containing media, without any pre-treatments. The procedure should be performed regularly, as reagents (e.g., digitonin stocks) and cellular conditions may change over time. Performing this procedure ensures consistency of the number of injured cells, and reproducibility of the results obtained. The procedure should be performed for each cell line separately.
Seed 6 × 10³ cells per well in 100 µL of culture media in a 96-well plate, and allow cells to adhere overnight in a cell culture incubator at 37°C. Make two plates: one plate is used for determining optimal digitonin concentration, and the other plate is used for measuring membrane integrity.
Adjust the number of cells per well for each cell line, as the cells need to be 50% confluent on the day of the experiment.
Immediately before use, heat up the digitonin stock (5 µg/µL) to 95°C for 5 min to dissolve any precipitates.
Note: Digitonin usually precipitates and needs to be redissolved by heating and occasional mixing by vortexing.
Prepare the following ten dilutions of digitonin in preheated culture media (37°C): 0, 5, 7.5, 10, 12.5, 15, 20, 25, 30, and 100 µg/mL digitonin,
Note: A digitonin solution of 100 µg/mL is used for total/complete permeabilization of cells.
Add 100 µL of digitonin dilutions per well in triplicates. Add the digitonin solution to the side of the well to avoid detachment of adherent cells.
Incubate in a cell culture incubator at 37°C for 30 min. In the meanwhile, prepare media with PI and Hoechst 33342 dye dilutions; the final concentrations should be: 0.25 µg/mL PI, and 6.25 µg/mL Hoechst 33342.
Carefully add 50 µL of PI/Hoechst dye mix to each well in the 96-well plate, and incubate in a cell culture incubator for 5 min.
Measure membrane integrity using the Celigo® cytometer, by measuring the number of total cells [Hoechst 33342 (excitation 350 nm, emission 461 nm) positive cells] and the number of permeabilized cells [PI (excitation 535 nm, emission 617 nm) positive cells] per well.
Determine optimal digitonin concentration.
Calculate the percentage of PI positive cells for the different conditions. The digitonin concentration that enables approximately 80% of the cells to repair [i.e., around 20 % of permeabilized cells (PI positive)] is optimal.
In this example, where MCF7 cells are treated with digitonin for 30 min, an optimal digitonin concentration is 7.5–10 µg/mL (see Figure 3C).
Part 2: Measuring membrane integrity following detergent induced injury using digitonin
In the following procedure, the membrane integrity is measured for cells treated with digitonin in media with or without Ca2+. The assay can also be combined with different pre-treatments, such as trifluoperazine (TFP), or knockdown of a gene of interest by siRNAs. For examples where the assay is combined with different pre-treatments, see Sønder et al. (2019), and Heitmann et al. (2021). See Figure 4A for a flowchart of the protocol.
Optional step: pretreat cells with an inhibitor.
Prepare digitonin solutions (using the optimal concentration obtained in step C8) in media containing Ca2+ and in Ca2+-free media. Immediately before use, heat up the digitonin stock (5 µg/µL) to 95°C for 5 min, to dissolve any precipitates.
Notes:
Digitonin usually precipitates and needs to be redissolved by heating and occasional mixing by vortexing.
As negative control (i.e., no repair) include samples with cells in Ca2+-free media.
Wash cells twice in HBSS without Ca2+. In the final wash, only add HBSS without Ca2+ to the wells that will be treated with digitonin in media without Ca2+. The rest of the wells should contain normal culture media.
Add 100 µL of each digitonin dilution per well, in triplicates, as descripted in step C4. Add the digitonin solution to the side of the well to avoid detachment of adherent cells.
Incubate in a cell culture incubator at 37°C for 30 min. In the meanwhile, prepare PI and Hoechst 33342 dye dilutions, in media with and without Ca2+. The final concentrations should be 0.25 µg/mL PI, and 6.25 µg/mL Hoechst 33342.
Carefully add 50 µL of the respective PI/Hoechst dye mixes to the respective wells in the 96-well plate, and incubate in a cell culture incubator for 5 min.
Measure membrane integrity using an imaging cell cytometer (e.g., Celigo®) by determining membrane integrity using the number of total cells (Hoechst 33342 positive cells: excitation 350 nm, emission 461 nm) and the number of permeabilized cells (PI positive cells: excitation 535 nm, emission 617 nm) per well.
The Celigo® is a multichannel imaging cell cytometer that can be used to perform whole-well live cell analysis using optical microscopy. In this experiment, cells are labeled with permeable Hoechst 33342 dye and impermeable PI dye, prior to scanning and analysis. The cytometer scan the selected area, e.g., a 96-well in the selected channels. Then, the software can be used to identify labeled cells in the selected channel, and thereby calculating the number of total cells (Hoechst positive cells) and the number of permeabilized cells (PI positive cells).
Note: The user should get particular training in their equipment before setting up the experiment.
Data analysis
Representative data
Protocol C describes how to monitor membrane integrity of cells after chemical-induced injury by the detergent digitonin. First, the optimal digitonin concentration for creating plasma membrane damage that can be repaired by the cells is determined.
Calculate the mean values of the triplicate measurements for PI (permeabilized cells) and Hoechst (total cells) positive cells per condition.
Calculate the percentage of permeabilized cells per condition, by relating the total number of PI positive cells to the total number of Hoechst positive cells. For statistical analysis, at least three independent experiments should be performed, and standard deviations should be plotted. For examples where statistical analysis has been applied, and the assay is combined with a pre-treatment, see Heitmann et al. (2021).
Representative images for each condition are selected to assemble a panel of images showing the incorporation of Hoechst 33342 and PI dye at a single cell level in the presence and absence of Ca2+, before and after digitonin treatment (Figure 4D).
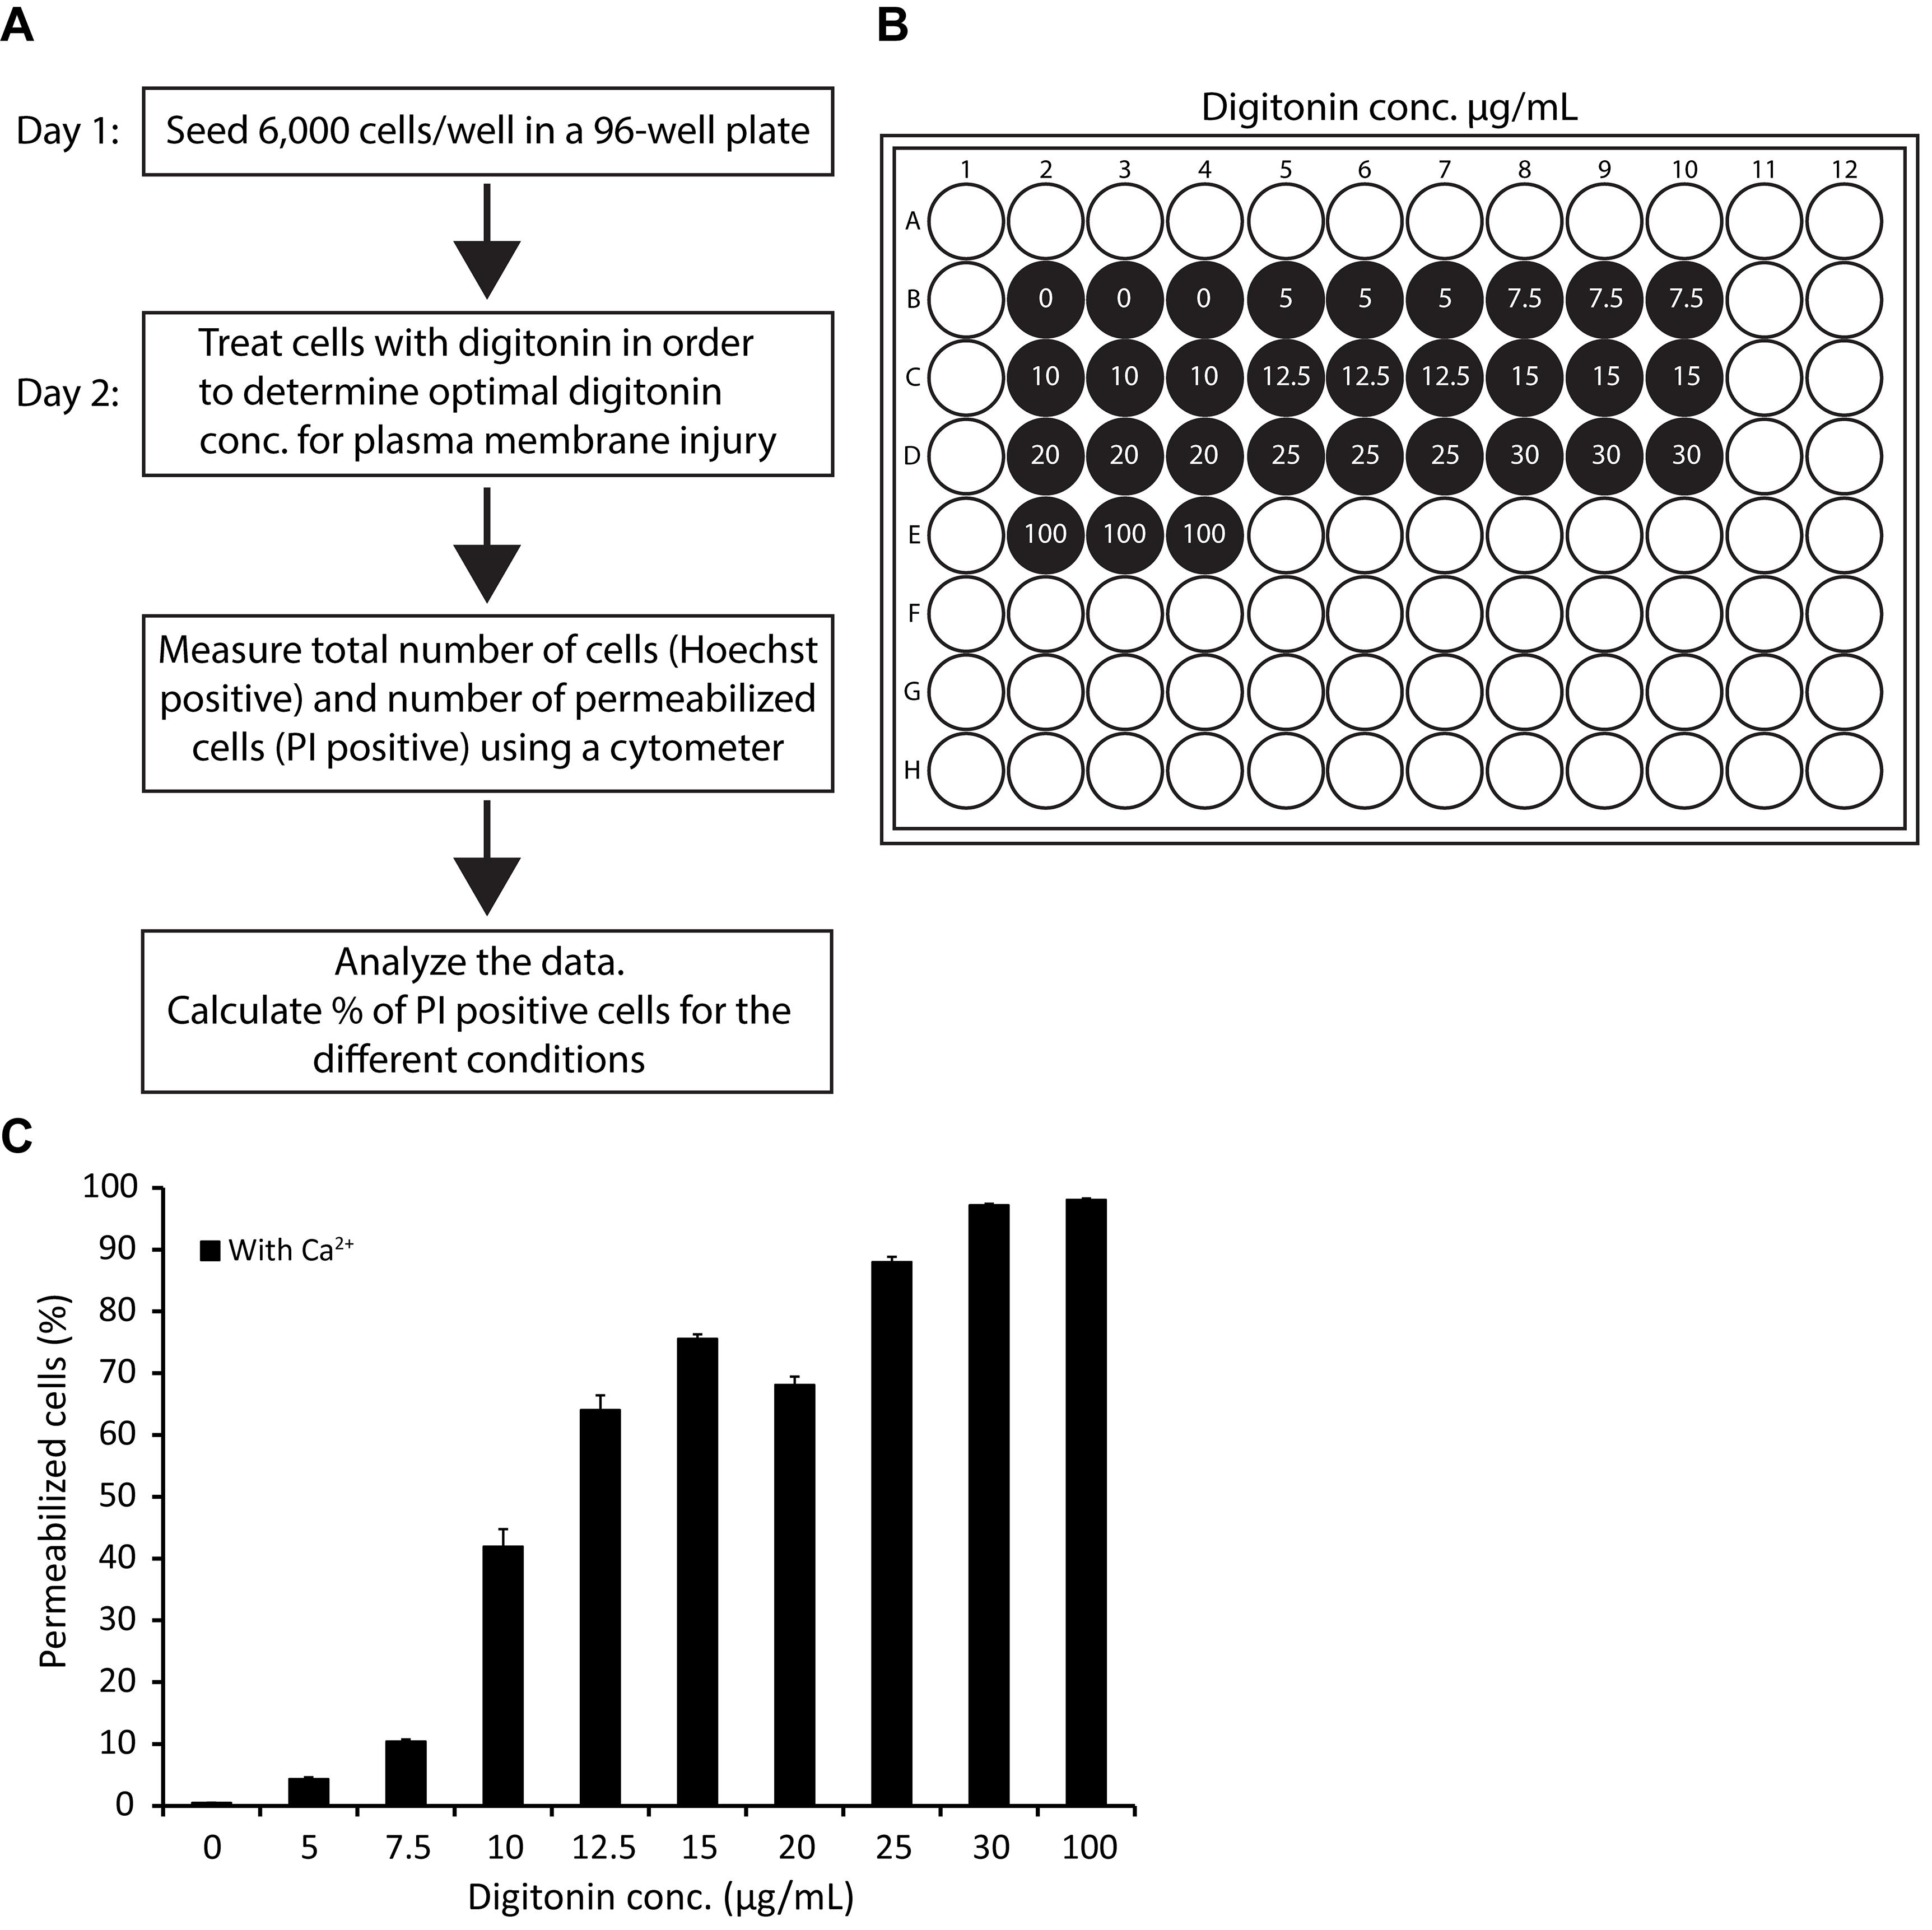
Figure 3. Example of an optimization experiment, used to determine the optimal digitonin concentration for a membrane integrity assay using MCF7 cells.(A) Flowchart of the protocol. (B) Membrane integrity assay sample setup in a typical 96-well format for determining optimal digitonin concentration. 6 × 10³ MCF7 cells per well were seeded in a 96-well plate. (C) Plasma membrane integrity in MCF7 cells treated with digitonin in indicated concentrations, or left untreated in media with Ca2+ for 30 min. The percentage of permeabilized cells is assayed using cell impermeable PI and permeable Hoechst 33342 dye (i.e., by calculating the number of PI positive cells relative to the total number of Hoechst 33342 positive cells) for each condition. Numbers represent mean of triplicate measurements, and error bars indicate SD values. All cells were permeabilized already at 30 µg/mL digitonin. A digitonin concentration that creates plasma membrane damage that can be repaired by most cells (approximately 80%) is determined. Here, 7.5–10 µg/mL is optimal for MCF7 cells.
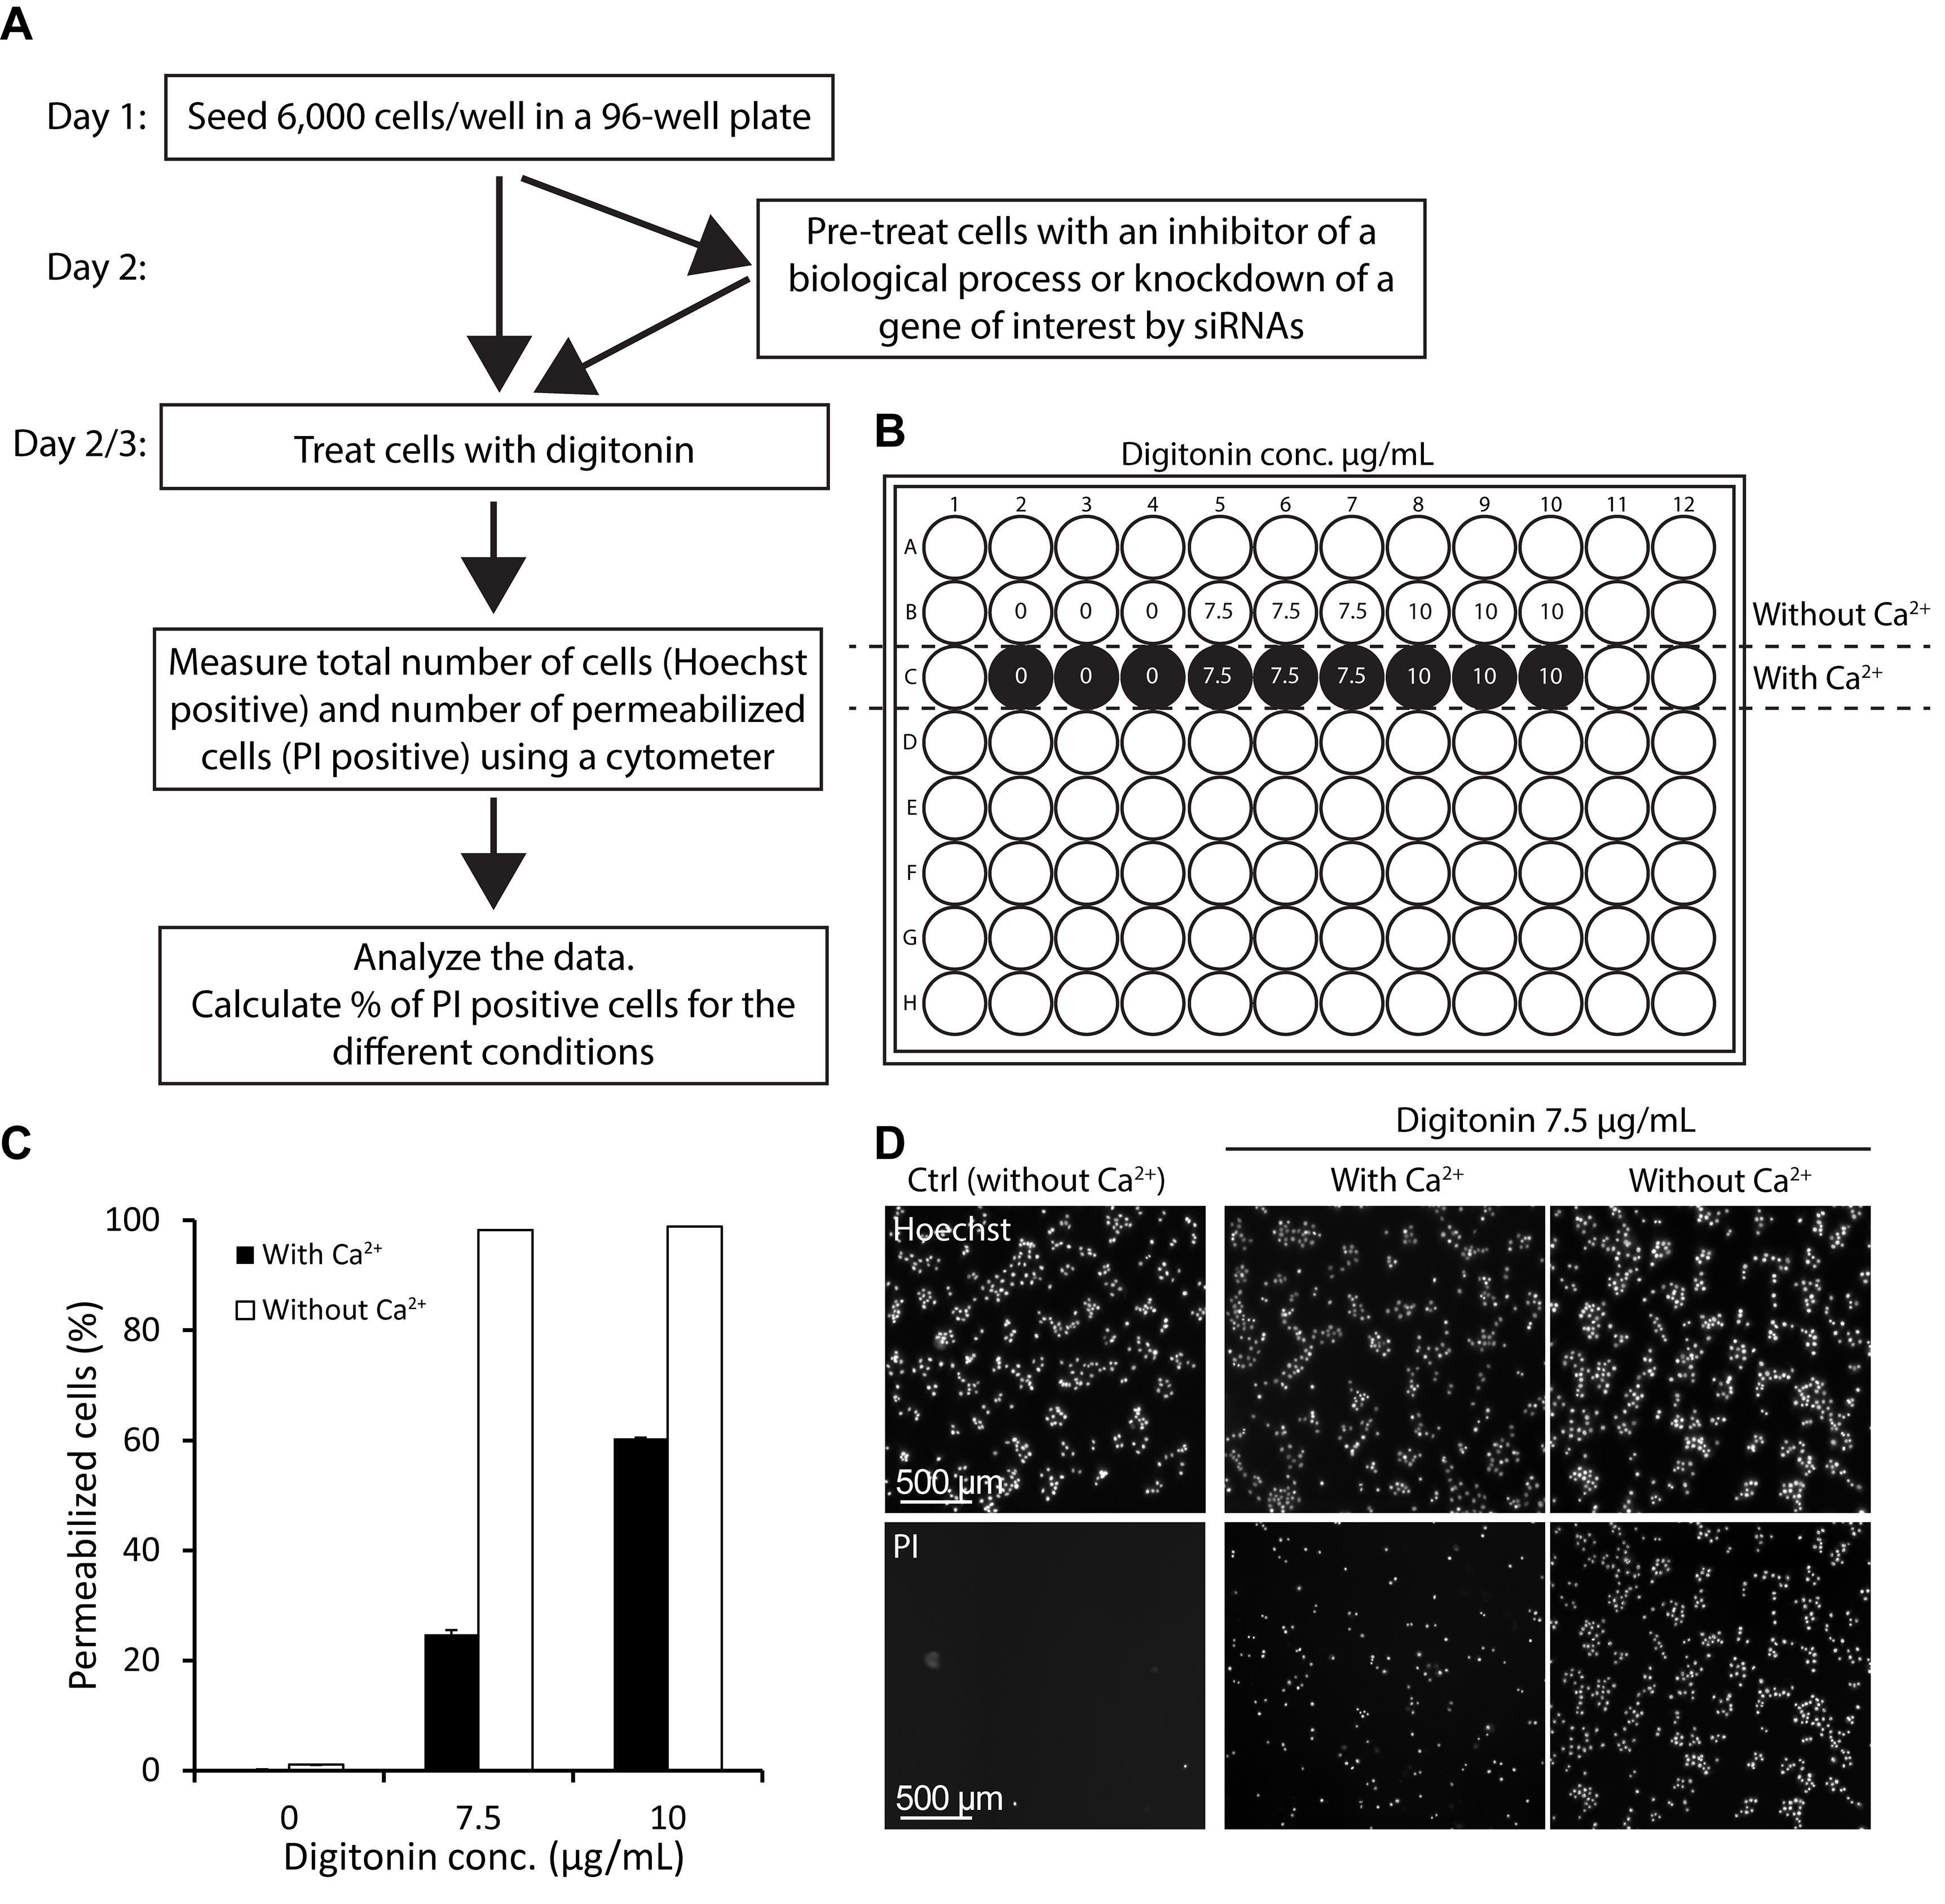
Figure 4. Example of membrane integrity assay following digitonin-induced injury.(A) Flowchart of the protocol. (B) Membrane integrity assay sample setup in a typical 96-well format in media without and with Ca2+. (C) Plasma membrane integrity in MCF7 cells treated with 7.5 or 10 µg/mL digitonin, or left untreated in media with or without Ca2+ for 30 min. The percentage of permeabilized cells is assayed using cell impermeable PI and permeable Hoechst 33342 dyes, and calculated by relating the measurement for PI to the measurement for Hoechst positive cells for each condition. Numbers represent means of triplicate measurements, and error bars indicate SD values. (D) Representative images showing the incorporation of Hoechst 33342 and PI dyes at a single cell level in the presence and absence of Ca2+, before and after digitonin treatment (7.5 µg/mL digitonin for 30 min). Scale bar = 500 µm.
Notes
The above methods must be used with care, when using treatment that influences cellular cholesterol content, or drugs that have detergent-like properties, such as cationic amphiphilic drugs (CADs) (Petersen et al., 2013), as such treatment may interfere with the digitonin damaging ability. Protocol C describes how membrane integrity following detergent induced injury using digitonin is measured. However, this protocol can also be adjusted to study membrane integrity following toxin-induced injury, by substituting digitonin treatment with treatment with SLO, or another pore-forming toxin.
Acknowledgments
The protocols presented here were applied in our recent papers (Sønder et al., 2021; Heitmann et al., 2021; and Sønder et al., 2019). We thank both present and former colleagues from the Membrane Integrity Group, Danish Cancer Society Research Center, for optimizing and fine tuning the methods presented here. Further, we thank colleagues and collaborators within the membrane repair field for sharing their methods and knowledge, in particular Jyoti K. Jaiswal, Children’s National Research Institute. The work was supported by the Danish Council for Independent Research (6108-00378A, 9040-00252B), the Novo Nordisk Foundation (NNF18OC0034936), and the Scientific Committee Danish Cancer Society (R90-A5847-14-S2, R269-A15812).
Competing interests
The authors have nothing to disclose.
References
- Abreu-Blanco, M. T., Verboon, J. M. and Parkhurst, S. M. (2011a). Cell wound repair in Drosophila occurs through three distinct phases of membrane and cytoskeletal remodeling. J Cell Biol 193(3): 455-464.
- Abreu-Blanco, M. T., Verboon, J. M. and Parkhurst, S. M. (2011b). Single cell wound repair: Dealing with life's little traumas. Bioarchitecture 1(3): 114-121.
- Andrews, N. W., Almeida, P. E. and Corrotte, M. (2014). Damage control: cellular mechanisms of plasma membrane repair. Trends Cell Biol 24(12): 734-742.
- Babiychuk, E. B., Monastyrskaya, K., Potez, S. and Draeger, A. (2011). Blebbing confers resistance against cell lysis. Cell Death Differ 18(1): 80-89.
- Betz, W. J., Mao, F. and Smith, C. B. (1996). Imaging exocytosis and endocytosis. Curr Opin Neurobiol 6(3): 365-371.
- Bi, G. Q., Alderton, J. M. and Steinhardt, R. A. (1995). Calcium-regulated exocytosis is required for cell membrane resealing. J Cell Biol 131(6 Pt 2): 1747-1758.
- Bischofberger, M., Gonzalez, M. R. and van der Goot, F. G. (2009). Membrane injury by pore-forming proteins. Curr Opin Cell Biol 21(4): 589-595.
- Bouter, A., Gounou, C., Berat, R., Tan, S., Gallois, B., Granier, T., d'Estaintot, B. L., Poschl, E., Brachvogel, B. and Brisson, A. R. (2011). Annexin-A5 assembled into two-dimensional arrays promotes cell membrane repair. Nat Commun 2: 270.
- Boye, T. L., Maeda, K., Pezeshkian, W., Sonder, S. L., Haeger, S. C., Gerke, V., Simonsen, A. C. and Nylandsted, J. (2017). Annexin A4 and A6 induce membrane curvature and constriction during cell membrane repair. Nat Commun 8(1): 1623.
- Boye, T. L. and Nylandsted, J. (2016). Annexins in plasma membrane repair. Biol Chem 397(10): 961-969.
- Cooper, S. T. and McNeil, P. L. (2015). Membrane Repair: Mechanisms and Pathophysiology. Physiol Rev 95(4): 1205-1240.
- Corrotte, M., Castro-Gomes, T., Koushik, A. B. and Andrews, N. W. (2015). Approaches for plasma membrane wounding and assessment of lysosome-mediated repair responses. Methods Cell Biol 126: 139-158.
- Gajic, O., Lee, J., Doerr, C. H., Berrios, J. C., Myers, J. L. and Hubmayr, R. D. (2003). Ventilator-induced cell wounding and repair in the intact lung. Am J Respir Crit Care Med 167(8): 1057-1063.
- Gonzalez, M. R., Bischofberger, M., Pernot, L., van der Goot, F. G. and Freche, B. (2008). Bacterial pore-forming toxins: the (w)hole story? Cell Mol Life Sci 65(3): 493-507.
- Heitmann, A. S. B., Zanjani, A. A. H., Klenow, M. B., Mularski, A., Sønder, S. L., Lund, F. W., Boye, T. L., Dias, C., Bendix, P. M., Simonsen, A. C., et al. (2021). Phenothiazines alter plasma membrane properties and sensitize cancer cells to injury by inhibiting annexin-mediated repair. J Biol Chem 297(2): 101012.
- Idone, V., Tam, C., Goss, J. W., Toomre, D., Pypaert, M. and Andrews, N. W. (2008). Repair of injured plasma membrane by rapid Ca2+-dependent endocytosis. J Cell Biol 180(5): 905-914.
- Jaiswal, J. K., Lauritzen, S. P., Scheffer, L., Sakaguchi, M., Bunkenborg, J., Simon, S. M., Kallunki, T., Jaattela, M. and Nylandsted, J. (2014). S100A11 is required for efficient plasma membrane repair and survival of invasive cancer cells. Nat Commun 5: 3795.
- Jimenez, A. J., Maiuri, P., Lafaurie-Janvore, J., Divoux, S., Piel, M. and Perez, F. (2014). ESCRT machinery is required for plasma membrane repair. Science 343(6174): 1247136.
- Khan, M. S., Dosoky, N. S. and Williams, J. D. (2013). Engineering lipid bilayer membranes for protein studies. Int J Mol Sci 14(11): 21561-21597.
- McNeil, A. K., Rescher, U., Gerke, V. and McNeil, P. L. (2006). Requirement for annexin A1 in plasma membrane repair. J Biol Chem 281(46): 35202-35207.
- McNeil, P. L. (2001). Direct introduction of molecules into cells. Curr Protoc Cell Biol Chapter 20: Unit 20 21.
- McNeil, P. L., Clarke, M. F. and Miyake, K. (2001). Cell wound assays. Curr Protoc Cell Biol Chapter 12: Unit 12 14.
- McNeil, P. L. and Khakee, R. (1992). Disruptions of muscle fiber plasma membranes. Role in exercise-induced damage. Am J Pathol 140(5): 1097-1109.
- McNeil, P. L., Miyake, K. and Vogel, S. S. (2003). The endomembrane requirement for cell surface repair. Proc Natl Acad Sci U S A 100(8): 4592-4597.
- Petersen, N. H., Olsen, O. D., Groth-Pedersen, L., Ellegaard, A. M., Bilgin, M., Redmer, S., Ostenfeld, M. S., Ulanet, D., Dovmark, T. H., Lonborg, A., et al. (2013). Transformation-associated changes in sphingolipid metabolism sensitize cells to lysosomal cell death induced by inhibitors of acid sphingomyelinase. Cancer Cell 24(3): 379-393.
- Scheffer, L. L., Sreetama, S. C., Sharma, N., Medikayala, S., Brown, K. J., Defour, A. and Jaiswal, J. K. (2014). Mechanism of Ca2+-triggered ESCRT assembly and regulation of cell membrane repair. Nat Commun 5: 5646.
- Sudji, I. R., Subburaj, Y., Frenkel, N., Garcia-Saez, A. J. and Wink, M. (2015). Membrane Disintegration Caused by the Steroid Saponin Digitonin Is Related to the Presence of Cholesterol. Molecules 20(11): 20146-20160.
- Sønder, S. L., Boye, T. L., Tölle, R., Dengjel, J., Maeda, K., Jäättelä, M., Simonsen, A. C., Jaiswal, J. K. and Nylandsted, J. (2019). Annexin A7 is required for ESCRT III-mediated plasma membrane repair. Sci Rep 9(1): 6726.
- Sønder, S. L., Häger, S. C., Heitmann, A. S. B., Frankel, L. B., Dias, C., Simonsen, A. C. and Nylandsted, J. (2021). Restructuring of the plasma membrane upon damage by LC3-associated macropinocytosis. Sci Adv 7(27): eabg1969
- Tweten, R. K. (2005). Cholesterol-dependent cytolysins, a family of versatile pore-forming toxins. Infect Immun 73(10): 6199-6209.
Article Information
Copyright
© 2022 The Authors; exclusive licensee Bio-protocol LLC.
How to cite
Readers should cite both the Bio-protocol article and the original research article where this protocol was used:
- Sønder, S. L., Ebstrup, M. L., Dias, C., Heitmann, A. S. B. and Nylandsted, J. (2022). Plasma Membrane Wounding and Repair Assays for Eukaryotic Cells. Bio-protocol 12(11): e4437. DOI: 10.21769/BioProtoc.4437.
- Sønder, S. L., Häger, S. C., Heitmann, A. S. B., Frankel, L. B., Dias, C., Simonsen, A. C. and Nylandsted, J. (2021). Restructuring of the plasma membrane upon damage by LC3-associated macropinocytosis. Sci Adv 7(27): eabg1969
Category
Cancer Biology > General technique
Cell Biology > Tissue analysis > Injury model
Do you have any questions about this protocol?
Post your question to gather feedback from the community. We will also invite the authors of this article to respond.