- Protocols

- Articles and Issues
- For Authors
- About
- Become a Reviewer

Application of Cadaverine to Inhibit Biotin Biosynthesis in Plants
Published: Vol 12, Iss 8, Apr 20, 2022 DOI: 10.21769/BioProtoc.4389 Views: 2347
Reviewed by: Wenrong HeYuan WangYe Xu
Original research article
The authors used this protocol in:
Sep 2021
Advertisement


Protocol Collections
Comprehensive collections of detailed, peer-reviewed protocols focusing on specific topics


Related protocols
Abstract
Biotin is an essential vitamin in plants. However, characterization of biotin deficiency has been limited by embryo lethality in mutants, which can only be rescued by supplementation of biotin. Here, we describe a protocol to characterize biotin deficiency in Arabidopsis thaliana through application of the polyamine cadaverine. Cadaverine induces changes in primary root growth. Protein biotinylation in Arabidopsis seedlings can be quantified through an assay similar to a western blot, in which protein biotinylation is detected by a streptavidin probe. This technique provides a chemical means of inhibiting biotin synthesis, allowing for further characterization of biotin deficiency on a physiological and molecular level.
Keywords: CadaverineBackground
Polyamines, like cadaverine, are small organic compounds with functions in the development and environmental sensing processes in plants (reviewed in Jancewicz et al., 2016). Previous studies have shown an effect of cadaverine on root growth architecture, through inhibition of primary root growth, increased lateral root branching, altered root skewing, and root waving (Strohm et al., 2015). To identify the molecular mechanism of cadaverine response, a forward genetic screen was carried out on Arabidopsis seedlings, which identified a mutation in the biotin synthesis gene BIO3-BIO1 leading to a short-root, cadaverine-hypersensitive response (Gibbs et al., 2021). From this study, we learned that cadaverine is able to inhibit biotin synthesis through interference with BIO3-BIO1 enzymatic function. Biotin is a necessary vitamin that is required for gluconeogenesis, amino acid homeostasis, and de novo fatty acid biosynthesis (Alban and Douce, 2000). The decrease in biotin derived from cadaverine treatment yields a deficit in the biotinylation of acetyl-CoA carboxylase (ACCase) component of biotin carboxyl carrier protein 1 (BCCP1), resulting in decreased fatty acid production. The depletion of biotin also results in cell death, within both shoot and root tissues (Li et al., 2012; Gibbs et al., 2021). Using cadaverine, we can deplete the amount of biotin within seedlings, which is a useful way to characterize the physiological role played by biotin deficiency. Biotin depletion in plant tissue can be confirmed through analysis of biotinylation of proteins using a streptavidin probe (Figure 1) (Wurtele and Nikolau, 1990; Guan et al., 1999; Che et al., 2003; Li et al., 2012). Streptavidin can detect at least three biotin-containing proteins: ACCase components BCCP1 and BCCP2, and methylcrotonoyl-CoA carboxylase (MCCA).
Materials and Reagents
225 mL flask
Stir bars
100 mm square Petri plates (Midwest Science, catalog number: PD115)
Filter paper (Whatman, catalog number: WHA1001055)
Seal-Rite 1.5 mL microcentrifuge tube, natural, sterile (USA Sci, catalog number: 1615-5510)
2 mL microfuge tubes (USA Scientific, catalog number: NC9558509)
4.5 mm steel beads (Daisy 40 BBS, 4000 CT, 0.177 Caliber, Zinc-Plated Steel, 4.5 mm)
Micropore tape (3M, Fisher Scientific, catalog number: 19-061-655)
Imminobilon-FL PVDF membrane (Merck Millipore Ltd., catalog number: IPFL00010)
3M blocking paper (Fisher Scientific, catalog number: 05-716-3T)
Arabidopsis thaliana seeds (Col-0 background, ABRC)
Linsmaier and Skoog (LS) basal salts with buffer and sucrose (Caisson Labs, catalog number: LSP04-1LT)
Agar (Fisher BioReagents, 800-199 Mesh, catalog number: BP26411),
Cadaverine dihydrochloride (Sigma-Aldrich, catalog number: 22330-10F)
Biotin (Sigma-Aldrich, catalog number: B4639)
95% Ethanol (Pharmco, catalog number: 111000190)
Liquid nitrogen
Pierce BCA Protein Assay Kit (Thermo Scientific, catalog number: 23225)
NuPAGE LSD Sample Buffer (4×) (Invitrogen, catalog number: NP0007)
NuPAGE Novex 12% Bis-Tris Gel, 1.0 mm, 10 well (Invitrogen, catalog number: NP0321BOX)
NuPAGE MOPS SDS BUFFER 20×, 500 mL (Invitrogen, catalog number: NP0001)
Color Prestained Protein Standard, Broad Range (11-245 kDa) (New England Biolabs, catalog number: P7719)
NuPAGE Transfer buffer (1 L) (Invitrogen, catalog number: NP0006)
NuPage antioxidant (Invitrogen, catalog number: NP0005)
Blocking buffer (LI-COR, catalog number: 927-600001)
BCCP1 antibody (Generated by Basil Nikolau’s lab, Plant Antibody Facility, Ohio State)
MCCA antibody (Generated by Basil Nikolau’s lab, Plant Antibody Facility, Ohio State)
RPT4A antibody (Provided by Richard Vierstra's lab, University of Wisconsin-Madison, currently Washington University, St Louis, MO)
IRDye 800CW Streptavidin (VWR, catalog number: 102673-342)
Protein extraction buffer (see Recipes)
20× TBS solution (see Recipes)
TBST (see Recipes)
Streptavidin dye solution (see Recipes)
Equipment
Plant growth chamber (Conviron TC30 or equivalent)
Milli-Q water system (MilliQ Plus PF)
Stir plate (Fisher Scientific)
Oven (Lab Line, model: 403)
Document scanner with 300+ DPI resolution (Epson Perfection, model: V33)
Mixmill (Reisch, model: MM200)
X-cell SureLock Mini-Cell Electrophoresis system (Invitrogen, model: EI0001)
Power block (BioRad, model: 200/2.0)
Electrophoresis power supply (Amersham Pharmacia Biotech, model: EPS 601)
Centrifuge (Eppendorf, model: 5424)
Autoclave (AMSCO, model: 3021-S)
Shaker/rotator (Bellco Biotech, model: 7744-01010)
Imaging system (LI-COR Odyssey)
Software
ImageJ (National Institutes of Health, https://imagej.nih.gov/ij/download.html)
Image Studio (LI-COR, https://www.licor.com/bio/image-studio)
Procedure
Preparation of seedling growth media
Prepare Milli-Q water for the desired amount of plant growth media and dispense it into a large beaker with a stir bar: 35 mL of media will be required per plate.
Place beaker with water on a stir plate, and add packets of LS while stirring, to generate a 0.5× solution of LS media. Allow LS to completely dissolve.
Prepare 1 L-screwcap bottles filled with 500 mL of LS liquid media.
Weigh 7.5 g of agar and place into each bottle, to make a 1.5% agar-based media.
Place a stir bar into each bottle, and mix the agar with the LS solution.
Loosely tighten the caps, and autoclave on a liquid cycle for 30 min.
Following sterilization, place media bottles in a 65°C oven until the media has cooled sufficiently to handle.
If desired, add cadaverine at a concentration ranging from 2 µM to 2 mM, from a 1 M cadaverine stock solution prepared in water (see Notes). Biotin may also be added up to 1 µM, from a 1 mM stock in water (see Notes).
Pour 35 mL of media into 100 mm square Petri plates in a laminar flow hood. After the plates have cooled, cover with a lid, and wrap in plastic. Store plates in the cold room for up to one month.
Plating Arabidopsis seeds
Use 95% ethanol to sterilize the lab bench or laminar flow hood.
Aliquot the desired amount of seeds into a 1.5 mL microfuge tube, add 1 mL of 95% ethanol, and vortex the seeds in ethanol for 1 min.
Pipette the seeds and ethanol onto a piece of filter paper, and allow them to dry completely.
After the seeds and filter paper have dried, using a sterile toothpick or a pipette tip, plate 12 seeds on the surface of the agar, in a straight line, and 1 cm from the top of the plate.
Wrap the plates in micropore tape.
Place the plates in a blackout bin, or cover them with aluminum foil, to block all light.
Place the plates at 4°C for 3 days.
Growing Arabidopsis seeds
After the 3-day cold treatment program: place the plates in a growth chamber, at a temperature of 22°C, and relative humidity of 65%, subjected to an illumination of 60 μmol/m2/s cool white light, 16 h-day/8 h-night cycles.
Remove the plates from the cold, unwrap and place them in the plant growth chamber, either vertically or tilted backward at a 30° angle from the vertical, to stimulate root waving (Rutherford and Masson, 1996).
To analyze root growth following cadaverine and/or biotin treatment, scan plates daily with a document scanner at a resolution of 300 dpi or greater.
Measure root growth using the segmented line function in ImageJ.
Preparation of Arabidopsis tissue for protein biotinylation quantification
Plate seedlings as described above.
Following the desired growth period (we used 8 days after placing stratified seeds into the growth chamber), dissect seedlings, or harvest whole seedlings, and place the samples into a 2 mL-microfuge tube with one 4.5 mm steel bead. Immediately freeze in liquid nitrogen. Approximately 200 mg of tissue is required.
Grind the tissue to a powder. Quickly place frozen tubes into the Mixmill and homogenize at 25 beats per second for 45 s. Place back into liquid nitrogen, then reload sample into the Mixmill, to repeat once more.
Take tubes out of liquid nitrogen and place onto ice, to allow the tubes to gently thaw.
Add protein extraction buffer (a volume in microliter equal to four times the amount of tissue in microgram, e.g., for 200 mg of tissue, add 800 µL of protein extraction buffer). Mix gently.
Gently agitate (by rotation, for instance) the tubes of homogenate at 4°C for 30 min.
Centrifuge the homogenate at top speed and 4°C for 30 min.
Remove the supernatant and place the tubes on ice.
Using the Pierce BCA Protein Assay Kit, determine the amount of protein in each sample, following the manufacturer’s instructions.
Normalize the protein such that each protein sample is the same concentration, using the protein extraction buffer to dilute samples as needed.
Prepare the protein homogenate for SDS Page, by adding 4× LSD Sample Buffer.
Heat the samples at 65–70°C for 15 min, to linearize the protein. At this point, samples can be frozen at -20°C if needed.
Detection of biotinylated proteins with Streptavidin
Prepare the protein gel. We use the Invitrogen X-cell lock system. Prepare 500 mL of MOPS-SDS running buffer by diluting from stock. Separate 200 mL into a flask and add antioxidant.
Set up the gel running box and add a stir bar. If running only one gel, use the filler plate.
Open the wrapping from the gel and remove the white tape on the bottom.
Add the protein gel to the box and clamp it in place. Add 200 mL of running buffer with the antioxidant to the inner well, and the remaining 300 mL to the outside.
Carefully remove the gel comb.
Using a pipette, gently rinse out wells with running buffer.
Load gel, making sure to include 4 µL of protein standard in one of the wells.
Place the lid on and run the gel at 50 V, on ice. Once the dye front has passed the stacking phase, the voltage can be increased to 100 V.
While the gel is running, prepare the transfer buffer. In a 225 mL-flask, add 12.5 mL of NuPAGE transfer buffer. Fill up to 225 mL with ddH2O. Add 20–25 mL of methanol and antioxidant, and mix.
Fill a flask with 500–600 mL of cold water, which will be used for the exterior chamber. Cover the flask and place it at 4°C until the gel is finished.
Prepare the membrane and blocking paper, by cutting one piece of membrane paper and two pieces of 3M paper in rectangles of 8.9 x 5.7 cm. Using a pencil, the membrane can be labeled on a corner.
At least 30 min before the gel has finished running (when the gel front has reached 75% of the way down to the bottom), cover the membrane in methanol to activate the PVDF membrane.
After the gel has finished, using a spatula, crack the plastic cassette of the gel. With a scalpel, carefully cut away the dye front and combs from the gel.
Place the gel in transfer buffer solution.
Wash out the gel box.
Prepare sponges. Do not overpack the sponges, as it will damage the transfer apparatus. Using a large dish, pour transfer buffer over to wet the sponges, making sure they are soaked in transfer buffer. Squeeze any excess air out of sponges.
Wet a piece of 3M paper and place on 2–3 of the sponges. Place the gel on top of the 3M blocking paper, with the protein marker on the right side.
Place the membrane on top of the gel with the label face down, and remove any air bubbles.
Add another piece of soaked 3M blocking paper, and the remaining wet sponges.
Close the transfer cassette and place in the gel box. Add the remaining transfer buffer, until the chamber is filled to the top.
Fill the outer chamber with cold water.
Run the transfer at 15 V, 160 mA, 3 W, on ice, overnight (16 h).
Block the membrane with blocking buffer, at 4°C for 1 h.
Wash the membranes with TBST buffer three times for 5 min.
Incubate the membrane to streptavidin dye solution (see Recipes) for 1 h.
Wash the membrane with TBST three times for 7 min.
Dry the membrane in the dark (such as covering with aluminum foil), and image it using Image Studio software in a LI-COR Odyssey imaging system. Biotinylated proteins and their molecular weights are listed in Table 1.
Table 1. Biotinylated proteins detected by streptavidin.
Major Biotinylated Proteins Size Role Localization MCCA 80 kDa Leucine degradation Mitochondria BCCP1 35 kDa Lipogenesis Plastid BCCP2 25 kDa Lipogenesis Plastid 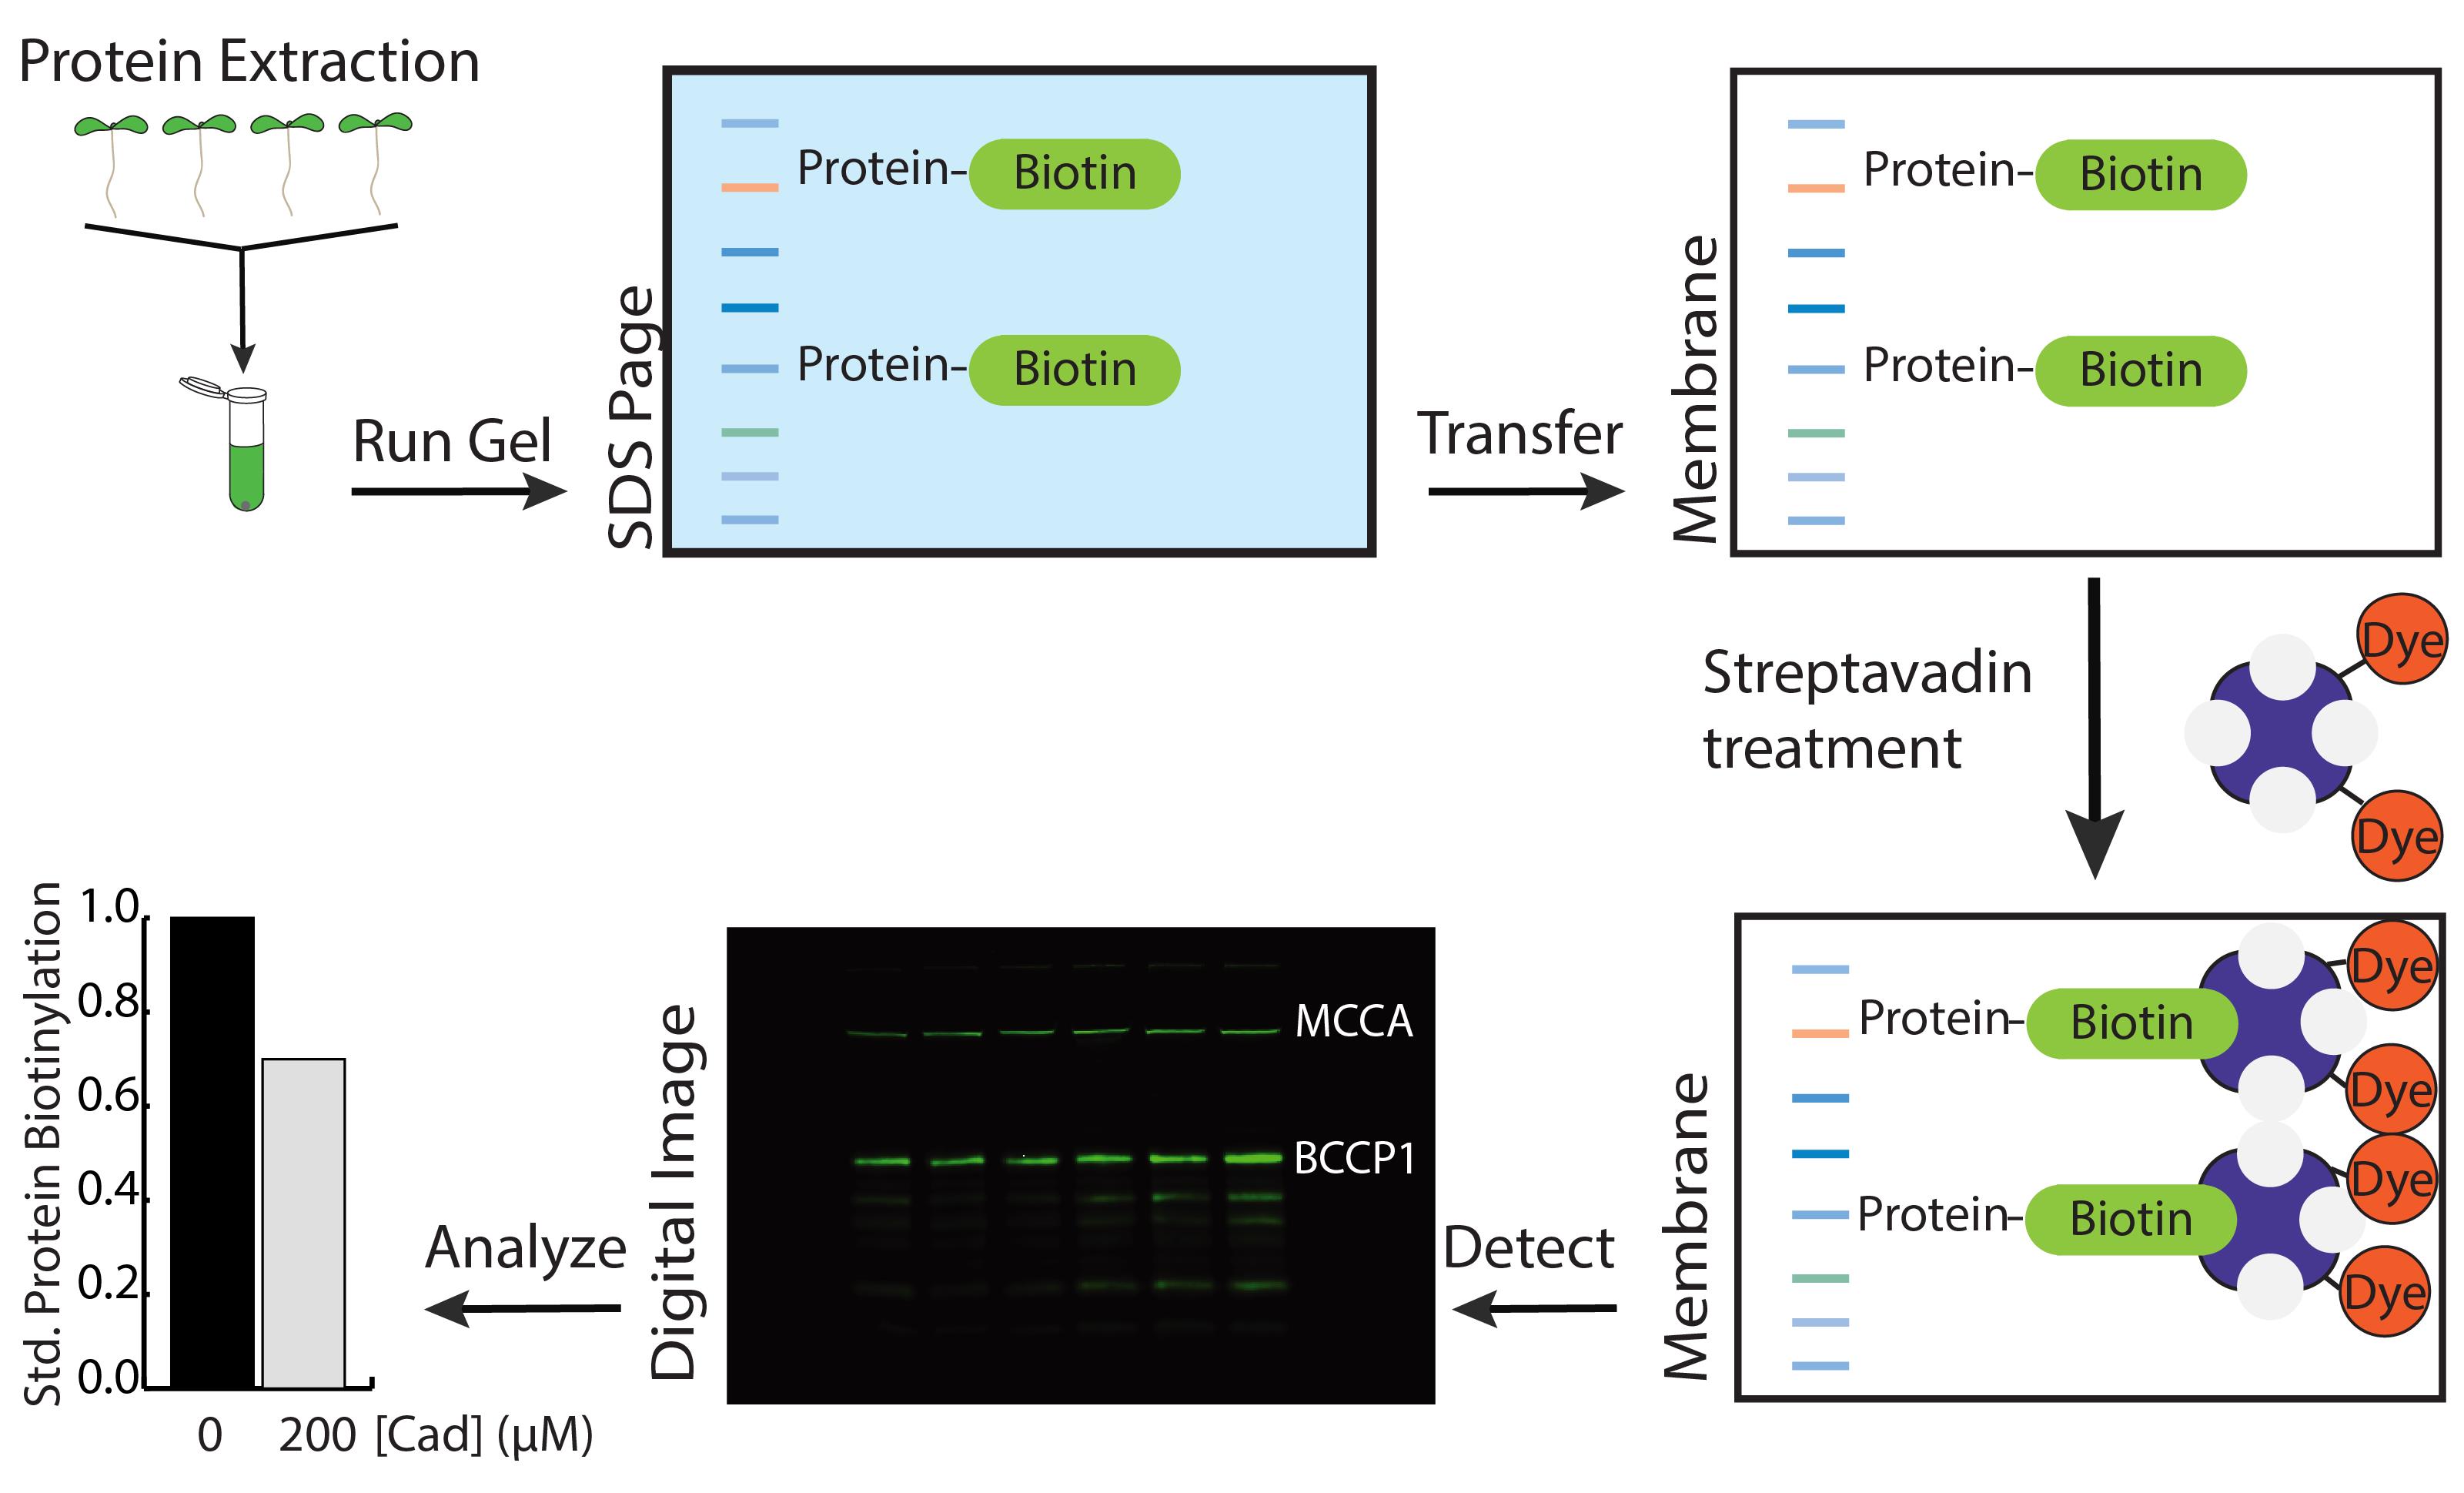
Figure 1. Experimental scheme for detection of biotinylated proteins in Arabidopsis. To analyze the biotinylation of Arabidopsis proteins, seedlings are homogenized in protein extraction buffer and separated by SDS Page. Following transfer to a membrane, the membrane is probed with a streptavidin dye, which allows for visualization of the biotinylated proteins on the membrane. The signal intensity of each band on the membrane can be quantified, to determine the level of biotinylated protein in the corresponding sample.
Data analysis
Seedling root growth analysis
Following root growth quantification, group all samples with a similar treatment in Excel.
Calculate the average and standard error, and plot the results.
To determine if there is a statistically significant difference between two treatment groups, carry out a Student’s t-test, using a p-value of 0.05 as the threshold for significance (Student, 1908). If there are more than two samples, an ANOVA test is required.
Protein biotinylation analysis
Following three separate biological replicates, statistical analysis can be performed on biotinylated proteins.
Using Image Studio software, measure the densitometry of each band.
Carry out a Student’s t-test to determine if there is a statistical difference between the three biological replicates of treatment and control-treated samples.
To account for any differences in protein amount due to gel loading errors, we recommend using a standard western blot protocol and probing with an antibody that can be used as a loading control. We use an antibody for proteasomal protein RPT4A (45 kDa), but tubulin alpha chain (50 kDa) can also be used as a loading control.
To determine the effect on apoprotein, standard western blot analysis should be carried out using antibodies specific to MCCA, BCCP1, or BCCP2 proteins. The changes in biotinylation and apoprotein should be compared, to determine if signal changes are associated with changes in protein amounts versus changes in biotinylation levels.
Notes
Biotin solution should be autoclaved prior to use (Schneider et al., 1989). Biotin is insoluble in solution without autoclaving, and can lead to medium contamination.
Streptavidin dye solution for probing membranes should not be reused. In our hands, the signal is depleted if reused, either through loss of stability or through contamination of the solution with biotin-producing microbes, which may quench the signal.
Loading control proteins should be tested, to ensure cadaverine treatment does not alter their expression.
Protein extraction buffer should be made fresh.
Loading control proteins should have a distinct molecular weight from the biotinylated proteins.
In lieu of blocking buffer, 1% nonfat milk (Sigma M7409) in TBST can be used to dissolve the streptavidin dye.
Cadaverine stock solution should be stored at 4°C. We have used the stock solution with similar results for up to one year.
Recipes
Protein extraction buffer
Stock Solutions Volume/Amount Final Concentration MOPS/NaOH, pH 7.5 0.04184 g in 9.3 mL of ddH2O 20 mM MgCl2 0.0475 g 5 mM KCl 0.03728 g 5 mM Sucrose 0.171 g 50 mM 0.1 M DTT 100 μL 1 mM Roche inhibitor cocktail 1 tablet glycerol 0.7 mL 7% Total 10 mL in ddH2O 20× TBS solution
Stock Solutions Amount 20× Concentration NaCl 163.63 g 2.8 M KCl 4.473 g 60 mM Tris-base 60.57 g 0.5 M Total 1 L in ddH2O TBST solution
Stock Solutions Volume Concentration 20× TBS 25 mL 1× Tween-20 5 mL 1% Add up to 500 mL of ddH2O Streptavidin dye solution
Stock Solutions Volume/Amount Concentration Blocking buffer 50 mL 1× Streptavidin dye 25 µL 25 µg 50 mL total
Acknowledgments
This work was supported by HATCH award #WIS10338 from the College of Agriculture and Life Sciences, Fall Competition Award #MSN226688 from Office of the Vice Chancellor for Research and Graduate Education, University of Wisconsin-Madison, and grant #80NSSC19K1483 from the National Aeronautics and Space Administration. This protocol was derived from Gibbs et al. (2021). The protocol for detection of biotinylated proteins was adapted from Li et al. (2012).
Competing interests
The authors have no competing interests to declare.
References
- Alban, C., Job, D. and Douce, R. (2000). Biotin Metabolism In Plants. Annu Rev Plant Physiol Plant Mol Biol 51: 17-47.
- Che, P., Weaver, L. M., Wurtele, E. S. and Nikolau, B. J. (2003). The role of biotin in regulating 3-methylcrotonyl-coenzyme a carboxylase expression in Arabidopsis. Plant Physiol 131(3): 1479-1486.
- Gibbs, N. M., Su, S. H., Lopez-Nieves, S., Mann, S., Alban, C., Maeda, H. A. and Masson, P. H. (2021). Cadaverine regulates biotin synthesis to modulate primary root growth in Arabidopsis. Plant J 107(5): 1283-1298.
- Guan, X., Diez, T., Prasad, T. K., Nikolau, B. J. and Wurtele, E. S. (1999). Geranoyl-CoA carboxylase: a novel biotin-containing enzyme in plants. Arch Biochem Biophys 362(1): 12-21.
- Jancewicz, A. L., Gibbs, N. M. and Masson, P. H. (2016). Cadaverine’s Functional Role in Plant Development and Environmental Response. Front Plant Sci 7: 870.
- Li, J., Brader, G., Helenius, E., Kariola, T. and Palva, E. T. (2012). Biotin deficiency causes spontaneous cell death and activation of defense signaling. Plant J 70(2): 315-326.
- Rutherford, R. and Masson, P. H. (1996). Arabidopsis thaliana sku mutant seedlings show exaggerated surface-dependent alteration in root growth vector. Plant Physiol 111(4): 987-998.
- Schneider, T., Dinkins, R., Robinson, K., Shellhammer, J. and Meinke, D. W. (1989). An embryo-lethal mutant of Arabidopsis thaliana is a biotin auxotroph. Dev Biol 131(1): 161-167.
- Strohm, A. K., Vaughn, L. M. and Masson, P. H. (2015). Natural variation in the expression of ORGANIC CATION TRANSPORTER 1 affects root length responses to cadaverine in Arabidopsis. J Exp Bot 66(3): 853-862.
- STUDENT. (1908). THE PROBABLE ERROR OF A MEAN. Biometrika6(1): 1-25.
- Wurtele, E. S. and Nikolau, B. J. (1990). Plants contain multiple biotin enzymes: discovery of 3-methylcrotonyl-CoA carboxylase, propionyl-CoA carboxylase and pyruvate carboxylase in the plant kingdom. Arch Biochem Biophys 278(1): 179-186.
Article Information
Copyright
© 2022 The Authors; exclusive licensee Bio-protocol LLC.
How to cite
Gibbs, N. M., Su, S. H. and Masson, P. H. (2022). Application of Cadaverine to Inhibit Biotin Biosynthesis in Plants. Bio-protocol 12(8): e4389. DOI: 10.21769/BioProtoc.4389.
Category
Plant Science > Plant molecular biology > Protein
Molecular Biology > Protein > Expression
Do you have any questions about this protocol?
Post your question to gather feedback from the community. We will also invite the authors of this article to respond.