- Protocols

- Articles and Issues
- For Authors
- About
- Become a Reviewer

Small Molecule Screening of Primary Human Acute Myeloid Leukemia Using Co-culture and Multiplexed FACS Analysis
Published: Vol 12, Iss 6, Mar 20, 2022 DOI: 10.21769/BioProtoc.4353 Views: 3096
Reviewed by: Alak MannaAnonymous reviewer(s)
Original research article
The authors used this protocol in:
Oct 2021
Advertisement


Protocol Collections
Comprehensive collections of detailed, peer-reviewed protocols focusing on specific topics


Related protocols


Abstract
Ex vivo culture of primary acute myeloid leukemia (AML) cells is notoriously difficult due to spontaneous differentiation and cell death, which hinders mechanistic and translational studies. To overcome this bottleneck, we have implemented a co-culture system, where the OP9-M2 stromal cells support the growth, but most notably limit the differentiation of primary AML cells, thus allowing for mechanistic studies in vitro. Additionally, the co-culture on OP9-M2 stromal is superior in preserving surface marker expression of primary (adult and pediatric) AML cells in comparison to stroma-free culture. Thus, by combining the co-culture with multicolor, high-throughput FACS, we can evaluate the effect of hundreds of small molecules on multi-parametric processes including: cell survival, stemness (leukemic stem cells), and myeloid differentiation on the primary AML cells at a single-cell level. This method streamlines the identification of potential therapeutic agents, but also facilitates combinatorial screening aiming, for instance, at dissecting the regulatory pathways in a patient-specific manner.
Graphic abstract:

Schematic representation of the ex vivo small molecule screening of primary human acute myeloid leukemia. Irradiated, sub-confluent OP9-M2 stromal cells are plated in half-area 96 wells plates 4–16 h prior to adding primary AML cells. Compounds are added 36–48 h later and effects on cell number, leukemic stem cell population, and myeloid differentiation are quantifed by FACS after 4 days of treatment.
Background
Acute myeloid leukemia (AML) is a malignant hemopathy, characterized by the accumulation of immature myeloid cells with unrestrained self-renewal and a blocked differentiation (Saultz and Garzon, 2016). The standard-of-care conventional chemotherapy initially promotes remission in the majority of patients, but a substantial fraction will experience relapse, since the therapy fails to eradicate the leukemic stem cells (LSC), a population that is believed to drive the disease (Reya et al., 2001).
Recently, alternative therapies have been developed that target disease-specific molecular events (Kalmanti et al., 2015, Lim et al., 2017), with the promise of increased specificity and thus being superior to chemotherapy. However, these targeted therapies have only met moderate clinical success due to the development of drug resistance and disease relapse, partially by the expansion of malignant clone(s) that do not rely on the targeted mutation (Kasi et al., 2016). The complexity of genetic, epigenetic, and cellular heterogeneity in AML (Cancer Genome Atlas Research et al., 2013) further indicates that single-agent targeted therapy would not be sufficient for leukemia clearance, highlighting the need for combinatorial therapeutic strategies.
A general problem in developing therapies for AML is the lack of robust preclinical models (Estey et al., 2015). The gold standard to evaluate leukemic function is patient-derived xenograft models that are time- and resource-consuming, and thus incompatible with high-throughput strategies. On the other hand, the culture of primary AML samples leads to spontaneous cell death, differentiation, and immunophenotypic changes unrelated to functional output. Strategies targeting specific pathways, such as AhR signaling, using small molecules have greatly improved the culture of AML cells (Pabst et al., 2014), but with unspecific changes of surface markers.
To overcome these hurdles, we took advantage of a co-culture system where OP9-M2 stromal cells were reported to support the fitness of healthy human hematopoietic stem cells (HSC) (Magnusson et al., 2013). It is thought that LSC (like HSC) receive survival signals from the supporting cells in the bone marrow niche (Meads et al., 2008)—which can be mimicked in this artificial bone marrow niche co-culture platform. In line, our findings show that primary LSC can be preserved in our co-culture system in comparison to stroma-free culture. In fact, as stem cells can be preserved for weeks, the implementation of this protocol allowed for molecular studies and interventions on human primary hematopoietic cells, that resulted in multiple novel discoveries (Magnusson et al., 2013; Baudet et al., 2016; Prashad et al., 2015; Komorowska et al., 2017; Calvanese et al., 2019).
Finally, this system can be scaled up to a small molecule multiplex screening platform, in combination with flow cytometry (96-well plates recommended) on primary patient (adult and pediatric) AML cells, that can assess the effect of each molecule on multiparametric processes, including proliferation, stemness, and cell differentiation. In this way, our protocol can be used to reveal pathways driving AML (mechanisms), and to identify novel compounds (drug discovery), as well as for drug repurposing, and delineation of combination therapies in a patient-specific manner (Hultmark et al., 2021).
Materials and Reagents
500 mL vacuum filters, 0.22 μm PES (TPP, catalog number: 99500)
Non sterile, 96 round-bottom wells polystyrene plates (ThermoFisher Scientific, catalog number: 268152)
UltraComp eBeadsTM Compensation Beads (ThermoFisher Scientific, catalog number: 01-2222-42)
Tissue culture plates
100 mm tissue culture plates (Corning, catalog number: 430167)
150 mm tissue culture plates (Corning, catalog number: 430599)
15 mL centrifuge tubes (Sarstedt, catalog number: 62.547.205)
50 mL centrifuge tubes (Sarstedt, catalog number: 62.547.205)
2 mL sterile serological pipettes
Sterile 40 µm cell strainers (Corning, catalog number: 431750)
Sterile 50 mL reagent reservoirs (Corning, catalog number:4870)
10 mL reagent reservoirs (Vistalab Technologies, catalog number: 30541012)
Sterile 96-well half area cell culture plates with lids (VWR, catalog number: 392-0060)
Non sterile U/V-bottom 96 wells plate
Polypropylene round-bottom FACS tubes (Falcon, catalog number: 352063)
7-Aminoactinomycin D (Merck, catalog number: A9400-5MG)
Cytarabine 10 mM in DMSO (Selleckchem, catalog number: U-19920A)
Dimethyl sulfoxide (DMSO) (Sigma-Aldrich, catalog number: D8418)
Trypan blue (Sigma, catalog number: T8154)
HyClone Phosphate Buffered Saline solution (PBS) (GE Healthcare, catalog number: SH30256.01)
OP9-M2 stromal cell line (Magnusson et al., 2013) or OP9 retrieved from Vendor (ATCC)
IgG from human serum (Merck, catalog number: I4506)
RPMI 1640 medium without L-glutamine (GE Healthcare, catalog number: SH30096.01)
EDTA (0.5 M), pH 8.0, RNase-free (Thermo Fisher Scientific, catalog number: AM9260G)
Trypsin-EDTA (0.25%), phenol red (ThermoFisher Scientific, catalog number: 25200-056)
HyClone Bovine Calf Serum (BCS), US Origin, 500 mL (GE Healthcare, catalog number: SH30073.03)
10% Bovine Serum Albumin in Iscove’s MDM (BSA) (Stem Cell Technologies, catalog number: 09300)
Fetal Bovine Serum, tested (ThermoFisher, catalog number: A4766801)
HyClone Penicillin/Streptomycin/Glutamine solution (Cytiva, catalog number: SV30082.01)
Hyclone MEM/Alpha modification without L-glutamine, ribo- and deoxyribonucleosides (GE Healthcare, catalog number: SH30568.FS)
Recombinant human Stem cell factor (SCF) 20 ng/μL (Peprotech, catalog number: 300-07)
Recombinant human Thrombopoietin (TPO) 20 ng/μL (Peprotech, catalog number: 300-18)
Recombinant human Flt3-ligand (FL) 20 ng/μL (Peprotech, catalog number: 300-19)
Recombinant human Interleukin-3 (IL3) 20 ng/μL (Peprotech, catalog number: 200-03)
Recombinant human Interleukin-6 (IL6) 20 ng/μL (Peprotech, catalog number: 200-06)
APC/Cyanine7 anti-human CD34 antibody (Biolegend, catalog number: 343514)
APC anti-human CD38 antibody (Biolegend, catalog number: 303510)
PE/Cyanine7 anti-human GPR56 antibody (Biolegend, catalog number: 358206)
PE anti-human CD123 antibody (Biolegend, catalog number: 306006)
Brilliant Violet 421TM anti-human CD11b antibody (Biolegend, catalog number: 301324)
Brilliant Violet 605TM anti-human CD15 (SSEA-1) antibody (Biolegend, catalog number: 323032)
FITC anti-human CD14 antibody (Biolegend, catalog number: 367116)
APC anti-human CD64 antibody (Biolegend, catalog number: 305014)
APC/Cyanine7 anti-human HLA-DR antibody (Biolegend, catalog number: 307618)
IgG1, Kappa from murine myeloma (Merck, catalog number: M7894)
PE/Cyanine7 anti-human CD117 (c-kit) Antibody (Biolegend, catalog number: 313212)
Wash solution (see Recipes)
Freezing medium (see Recipes)
Thawing medium (see Recipes)
OP9-M2 culture medium (see Recipes)
LSC culture media (see Recipes)
LSC staining solution (see Recipes)
7-AAD solution (see Recipes)
Equipment
Hemacytometer cell counting chamber (Marienfeld Superior, catalog number: 13444890)
Refrigerated centrifuge (Sigma, catalog number: 4-16KS)
FACSCanto II flow cytometry analyzer (8-color, blue/red/violet) (BD Biosciences) equipped with HTS unit
Heracell 150i CO2 incubator (Thermo Scientific)
Cell irradiator (Precision X-Ray, catalog number: CellRad)
Multichannel stepper pipettes—digital if possible (1 mL and 200 μL)
Orbital shaker (IKA, catalog number: KS130)
Storage box with lid (VWR, catalog number: SEMA0882)
Software
FlowJo (https://www.flowjo.com)
Excel (https://www.microsoft.com)
GraphPad PRISM 7 (https://www.graphpad.com)
Procedure
AML phenotyping
Recover viable AML cells
Remove a vial of leukemia primary cells from storage and place it on dry ice or in liquid nitrogen.
Carefully wipe the still-frozen vial with 70% ethanol.
In the LAF bench, use a 1 mL sterile tip to scrap frozen bits of the sample directly into a FACS tube, previously filled with 4 mL of thawing medium and kept on ice.
Spin down at 250 × g and 4°C for 5 min, and carefully aspirate the supernatant, by slowing tilting the tube and letting the liquid run on the tube wall into the aspiration pipette.
During the centrifugation, transfer the vial back to storage.
Add 2 mL of wash buffer, and repeat the centrifugation step, at 350 × g this time.
Stain the cells
Add 50 μL of LSC staining solution.
Incubate in the dark at 4°C for 30 min.
Add 1 mL of wash buffer.
Spin down at 350 × g and 4°C for 5 min.
During the staining time, prepare the compensation controls with beads.
FACS and analyze.
Note: The goal is to establish which epitopes are expressed by each individual sample, when this information is not provided by the clinic. The cell numbers/recovery at the surface of the frozen vial is generally poor and does not necessarily reflect the overall sample. Even over a short period of time, the use of liquid nitrogen for transport is better than dry ice to preserve the cells.
Stroma thawing
On ice, cool down 20 mL of OP9-M2 medium in a 50 mL tube.
Collect and transport a vial of frozen OP9-M2 (or OP9) on dry ice. Carefully wipe the still-frozen vial with 70% ethanol.
In the LAF bench, pipette about 0.5 mL of ice-cold OP9-M2 medium on the frozen cells. Immediately, collect and pipette the cells back into the tube of thawing solution, which was kept on ice.
Repeat until complete thawing of the cell pellet.
Spin at 300 × g, and 4°C for 5 min.
Aspirate supernatant.
Resuspend the cell pellet, first with 1 mL of OP9-M2 medium, then up to 5–10 mL.
For cell count, collect 50 μL in an Eppendorf tube prefilled with 50 μL of trypan blue.
Spin at 350 × g and 4°C for 5 min .
Count cells during spinning.
Resuspend the cell pellet first with 1 mL of ice-cold OP2-M2 culture medium.
For seeding a 10 cm2 dish, collect about 850,000 cells in a 15 mL tube. Add up to 10 mL of OP2-M2 culture medium.
Mix well, seed, and transfer to an incubator overnight.
Check for survival the day after. If cells are over 50% confluent, replate (see section C).
Stroma maintenance
Aspirate the supernatant by gently tilting the dish to one side. Avoid touching the cells, but stay as far away as possible from the dish’s rim.
Wash away any trace of FCS by gently adding 10 mL of PBS at room temperature (RT)/ pre-warmed at 37°C .
Aspirate as described in step C1.
Add 1 mL of Trypsin EDTA. Transfer to an incubator.
After 4–5 min, check for cell rounding under a microscope.
Gently tap the side of the dish to help detaching cells.
As soon as all cells are detached, use a 1 mL pipette to quickly break down cell clusters.
Add 1 mL of FCS, and transfer to a 50 mL tube. Complete the volume up to 10 mL with PBS.
For cell counting, collect 50 μL in an Eppendorf tube prefilled with 50 μL of trypan blue.
Spin at 350 × g and 4°C for 5 min.
Count cells during spinning.
For seeding a 10 cm2 dish, collect about 500,000 cells in a 15 mL tube. Add up to 10 mL of OP2-M2 culture medium.
Mix well, seed, and transfer to an incubator.
Note: Doubling time is approximately 24 h. Cells must be kept under 90% confluence, as they are sensitive to cell-cell contact inhibition that triggers adipocytic differentiation (Figure 1A) and loss of hematopoietic support potential. On the other hand, too few cells will present the risk of clonal selection.
Stroma plating
Prepare single cell suspension as described in steps C1–C11.
Aspirate supernatant.
Resuspend pellet with 1 mL of ice-cold OP9-M2 media into a single cell suspension, fill up to 2.5 mL with ice-cold OP9-M2 media, and transfer to a 15 mL tube.
Keep on ice and irradiate with 2000 rad.
Add OP9-M2 medium to a total of 10 mL, and filter the resuspended cells through a 40 μm cell strainer into a 50 mL tube.
For cell counting, collect 50 μL in an Eppendorf tube prefilled with 50 μL of trypan blue.
Spin at 350 × g and 4°C for 5 min. Aspirate supernatant.
Ressupend pellet with 1 mL of ice-cold OP9-M2 media into a single cell suspension.
Collect the appropriate cell number for the experiment and adjust the volume with OP9-M2 medium to a cell concentration of 5 × 10⁵ cells/mL.
Transfer cell suspension into a sterile reservoir and, using a digital multichannel stepper, distribute 50 μL/well in 96 half-area well plates.
Incubate at 37°C for 4–16 h prior to AML plating.
Note: Half-area 96 wells plates will help in limiting corner effect by reducing evaporation, as well as reducing cell numbers, which often is limited, still being compatible with standard multichannel pipettes. After irradiation, the OP9-M2 should be close to confluence (90%) since we observed that the hematopoietic cell to stromal cell contact is essential for the supportive effect of OP9-M2 cells (Figure 1B). To best this, each individual researcher has to establish their own cell concentration before plating.
AML plating
Thaw cells as described in steps B1–B6 using thawing medium.
Resuspend cell pellet with 1 mL of cold PBS, then fill up to 5–10 mL.
For cell count, collect 50 μL in an Eppendorf tube prefilled with 50 μL of trypan blue.
Spin at 350 × g and 4°C for 5 min. Aspirate supernatant.
Resuspend cell pellet first with 1 mL of ice-cold 3× LIC culture medium into a single cell suspension. Adjust the volume to the desired cell concentration (0.04 × 10⁶ –2 × 10⁶ cell/mL).
Transfer cell suspension into a sterile reservoir and using a digital stepper, carefully distribute 25 μL/well in 96 half-area well plates.
Place the plates in a humid chamber (built by placing an opened 10 cm dish filled with PBS) within the incubator and grow at 37°C for 36–48 h prior to compound addition, to avoid culture shock (Magnusson et al., 2013).
Compound addition
Prepare serial dilutions of the libraries in LSC medium so that each compound is 4× the assay concentration.
Using a multichannel pipette, dispense 25 μL/well.
Place plates back in the humid chamber, and keep them in the 37°C incubator for 4 days.
Note: If possible, randomly distribute the control wells over the 96 well plate (a minimum of 4 wells/plate) to avoid any bias. At this level of irradiation, OP9-M2 cells continue to grow and will present signs of differentiation at the time of analysis (Figure 1C). When considering compound concentration, bear in mind that the co-culture appears to have a clearance/dilution effect, as illustrated by the increased IC50 of cytarabine in the presence of OP9-M2 cells (Figure 1D).
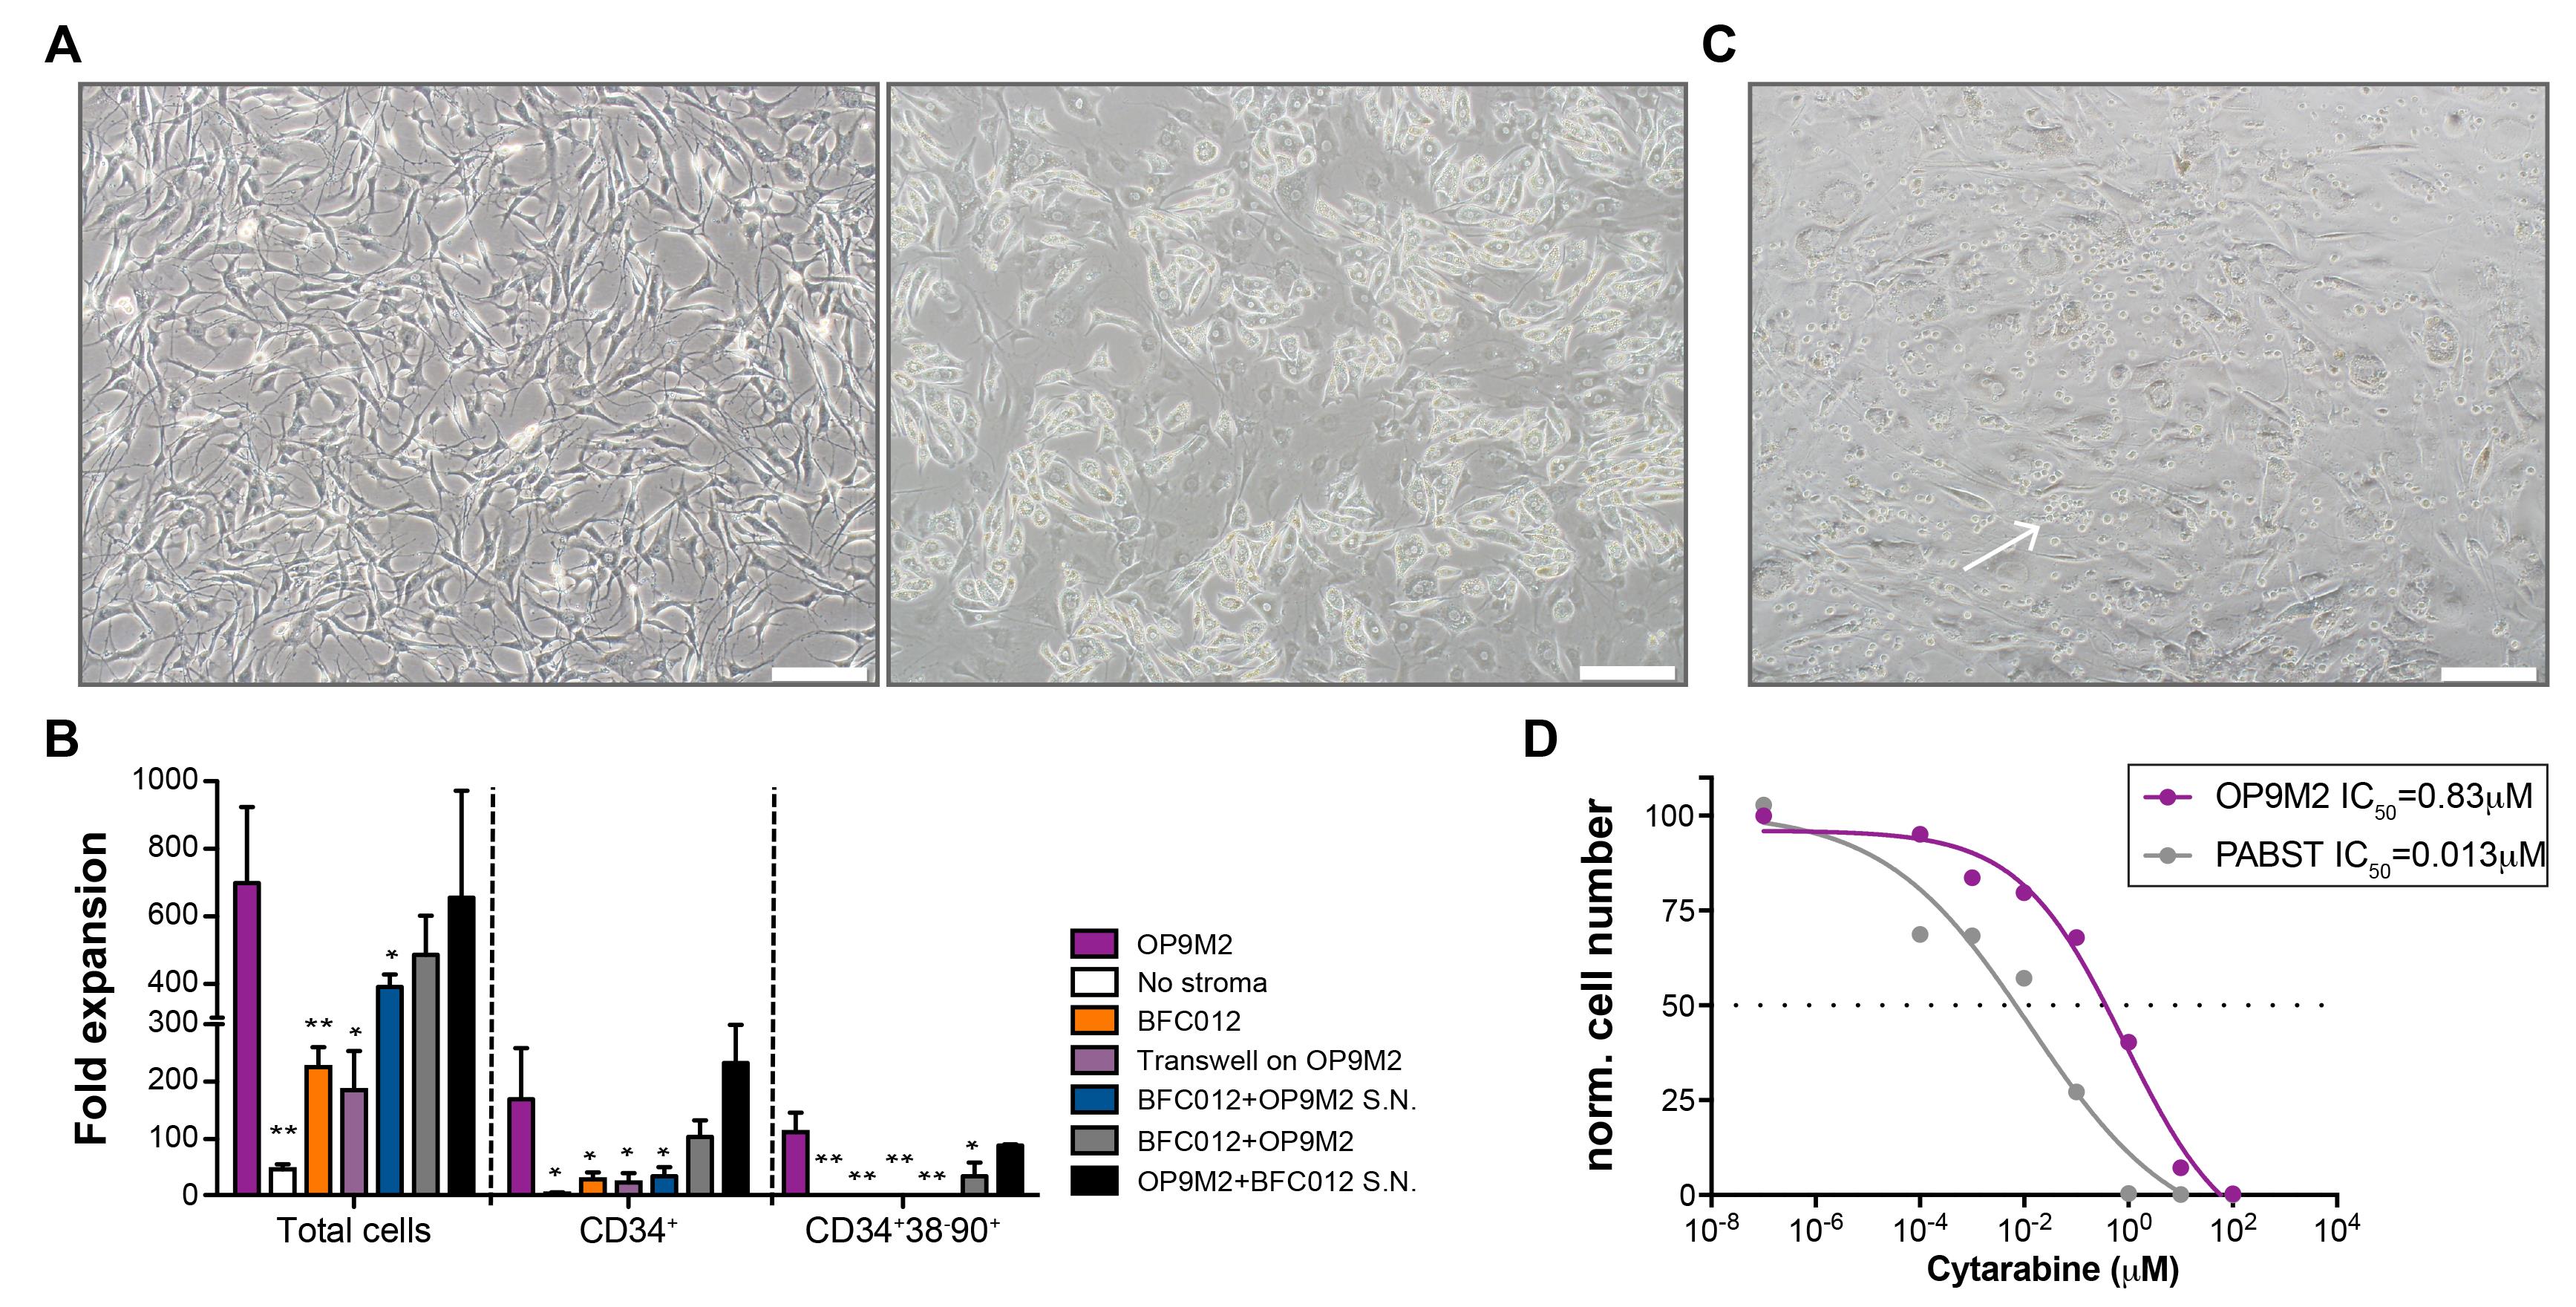
Figure 1. Stromal co-culture alters the ex vivo behaviour of healthy and malignant hematopoietic cells. OP9-M2 cells were photographed at A) optimal confluence (left) and one week later (right). B) Representative change in hematopoietic stem and progenitor cells (HSPC) markers from CD34+ umbilical cord blood cells cultured for 10 days with OP9-M2 or BFC012 cells and/or supernatant (S.N.). Statistical significance was calculated with a t-test. *P < 0.05, **P < 0.001. C) Hematopoietic cells (arrow) were cultured for 6 days in the presence of irradiated OP9-M2 cells. D) Graph shows the non linear fit regression of normalized cell number of primary pediatric AML cells after 4 days of treatment with cytarabine in the presence or absence of irradiated OP9-M2 cells. Volumetric cell count was acquired by FACS and the IC50 of cytarabin was calculated using Prism software. Scale bars: 100 μm.FACS
Prepare staining and control mix
The day before analysis, visually check for live cells on the control plate and prepare staining and control mixes according to Tables 1 and 2.
Sample collection
On the day of analysis, collect the entire well content by pipetting up and down using a multichannel pipette, to a 96 V-shape plate. Carefully mark lids and collecting plates.
With a multichannel stepper, add 100 μL of ice-cold wash buffer to each well.
Spin at 350 × g and 4°C for 5 min.
Empty the plates by returning them ONCE over absorbing paper placed in a biological waste bin in a swift but firm move.
Samples staining
Transfer the staining mix to a reagent reservoir.
With a multichannel stepper, add 25 μL/well of LSC staining solution from a 10 mL reagent reservoir. Prepare the single stain and FMO controls in tubes or a separate plate.
Gently shake plates on a shaker until pellets are re-suspended and incubate at 4°C in the dark for 30 min.
With a multichannel stepper, add 125 μL of ice-cold wash buffer to each well.
Spin at 350 × g and 4°C for 5 min.
Empty the plates by returning them ONCE over absorbing paper placed in a biological waste bin in a swift but firm move.
With a multichannel stepper, add 150 μL of ice-cold 7AAD solution from a reservoir to each well.
Keep plates on ice/4°C in the dark until FACS.
FACS
When setting the HTS unit, set the stopping gate on a very high event (1,000,000) to acquire the same volume (100 μL for HTS connected to BD analyzers), and therefore extract the volumetric count at the analysis.
Data analysis
From FlowJo, export cell counts from the live cells gate, the percentage of the leukemic stem cell population (i.e., CD34+GPR56+ from CD34+ AML), and the percentage of the different myeloid markers included in the analysis (i.e., CD11b, CD14, CD15). In addition, extract the mean fluorescence intensity from the myeloid markers, since these are often expressed on the cells at diagnosis, but can be increased in expression as a sign of differentiation.
Next, extract data from the control wells to highlight variations in the experiment, especially the volumetric cell count, which in our hands is the most sensitive parameter. The reproducibility of plating can be influenced by sample cell heterogeneity, cell numbers, and growth potential of plated cells, as well as personal skills. We find that, while the average of controls in each plate can significantly vary when compared to the overall experiment, that is not the case between the control wells within a plate (Figure 2).
Therefore, in Excel, for each plate, calculate:
The proliferation index (PI = cell numberwell/average cell numbercontrols × 100),
The leukemic stem cell index (SI = LSC percentagewell/average LSC percentagecontrols × 100),
The maturation index (MI = myeloid markerwell/myeloid markerconttrols × 100).
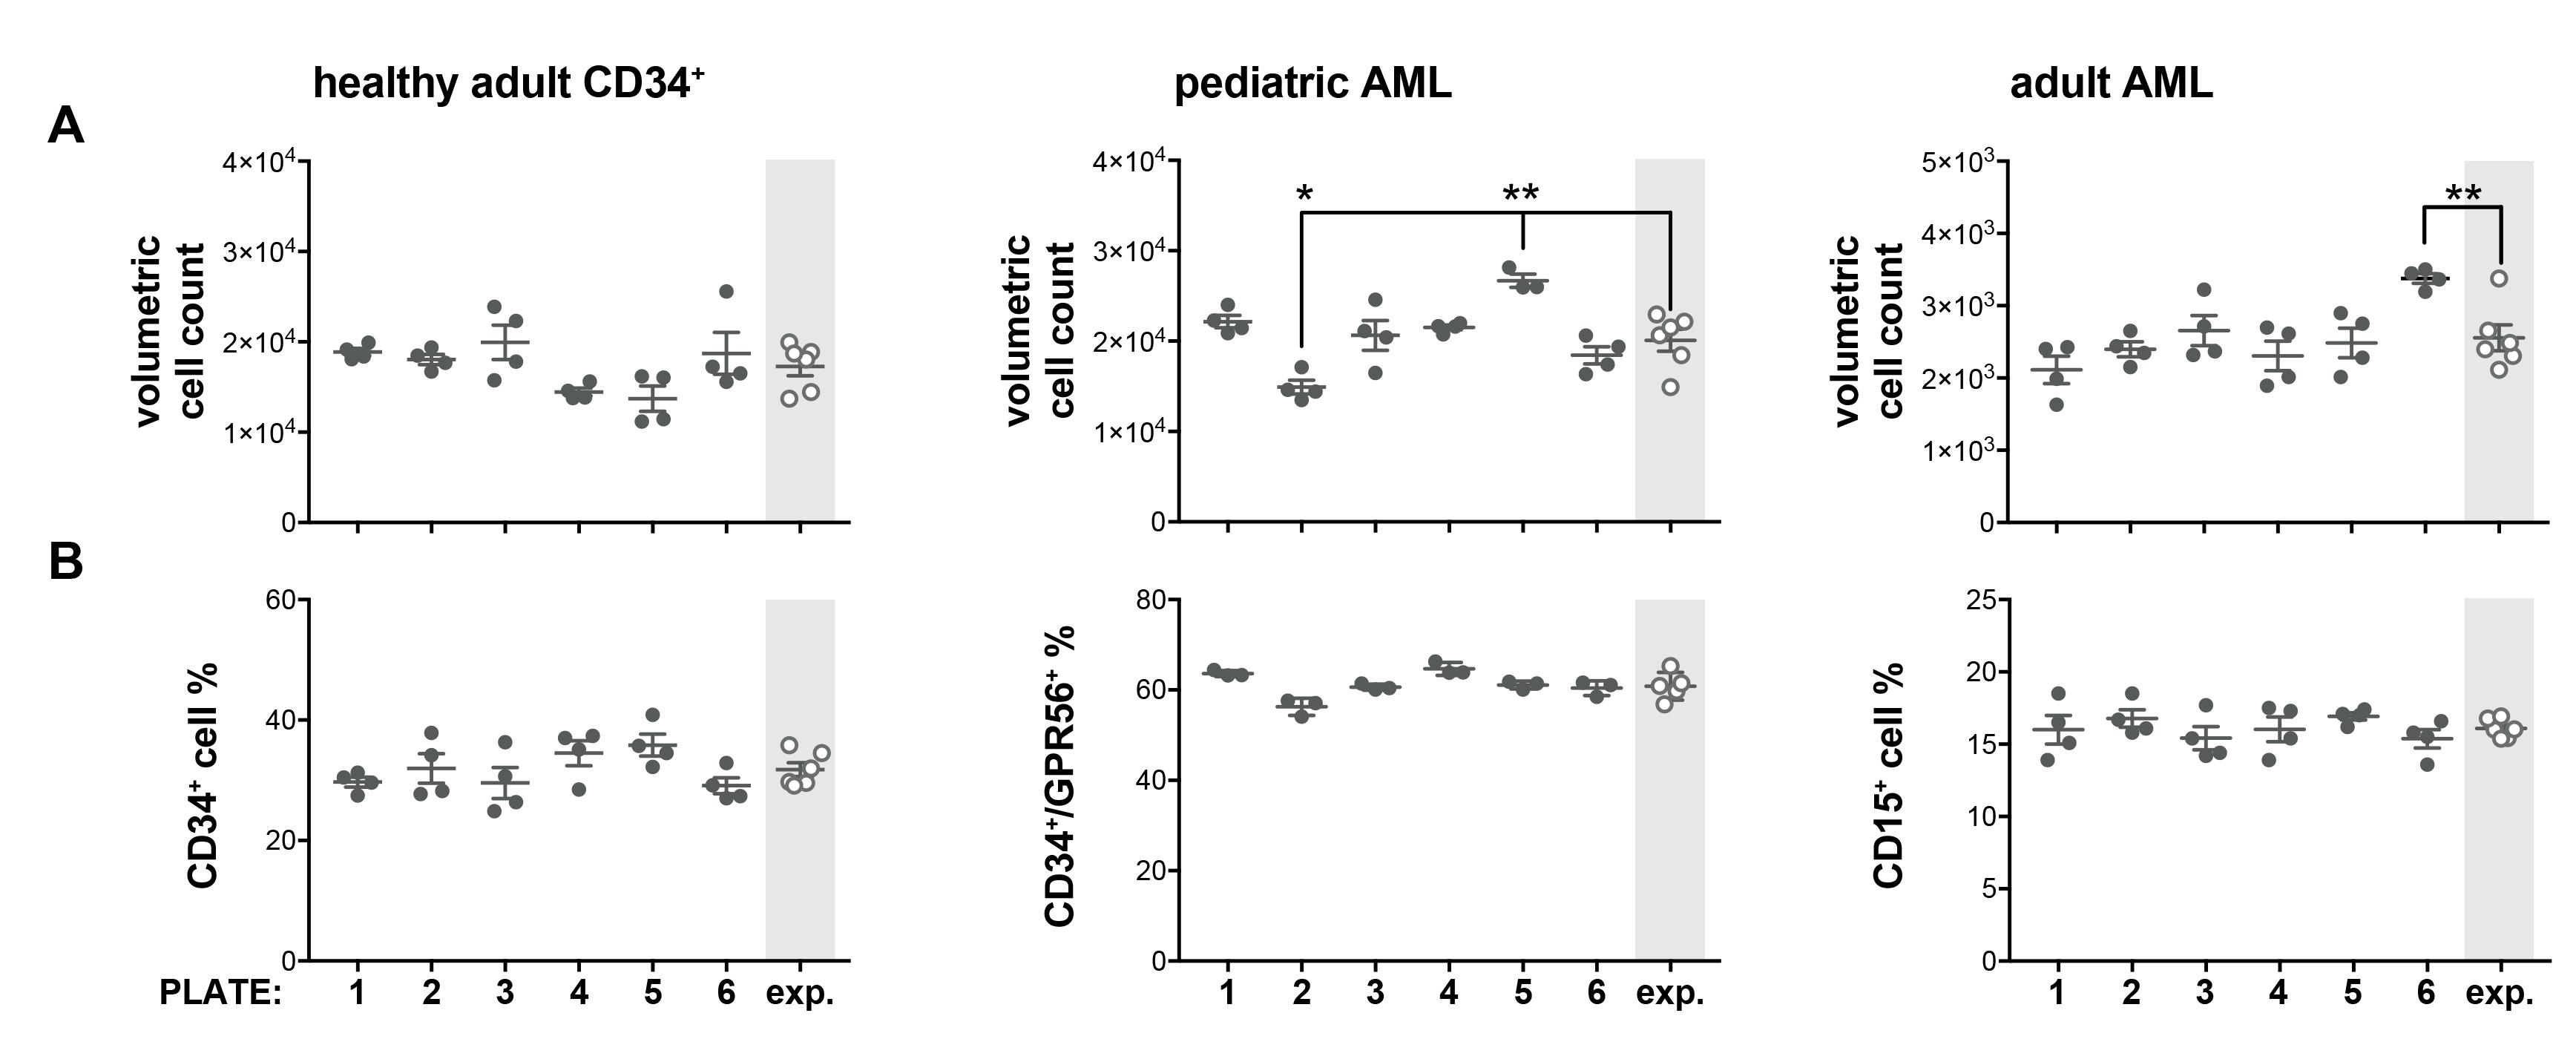
Figure 2. Inter-plate variability affects volumetric cell count but not cell surface markers quantification. The average value of control wells of each plate (numbered 1 to 6) was compared to the average of averages of all 6 plates (exp.) for A) volumetric cell count and B) surface marker expression of 3 primary hematopoietic cells of various origin. Statistical significance was calculated with an unpaired t-test. *P < 0.05, **P < 0.01.To identify candidate molecules, sort data in Excel for each of the relevant parameters. The threshold for significance depends mainly on the heterogeneity of the control wells but we found that, at this stage, false positives (over false negatives) are acceptable, as they would be eliminated at the validation step (dose-response experiment). The identification of hits additionally depends on the aim of your study. For instance, our lab has primarily focused on the discovery of differentiation-inducing compounds and not on molecules that are severely impacting cell number (PI < 25). In proceeding so, we eliminated wells where the cell count is too low for robust FACS analysis, or wells containing autofluorescent, dying cells, and non-specific events. For illustration purposes, in Graphpad prism, plot PI vs. MI/SI (Figure 3A). Finally, we recommend to specifically look at the FlowJo plots for each candidate molecule to check that gating is appropriate (Figure 3B), as well as for potential auto-fluorescence (Figure 3C).
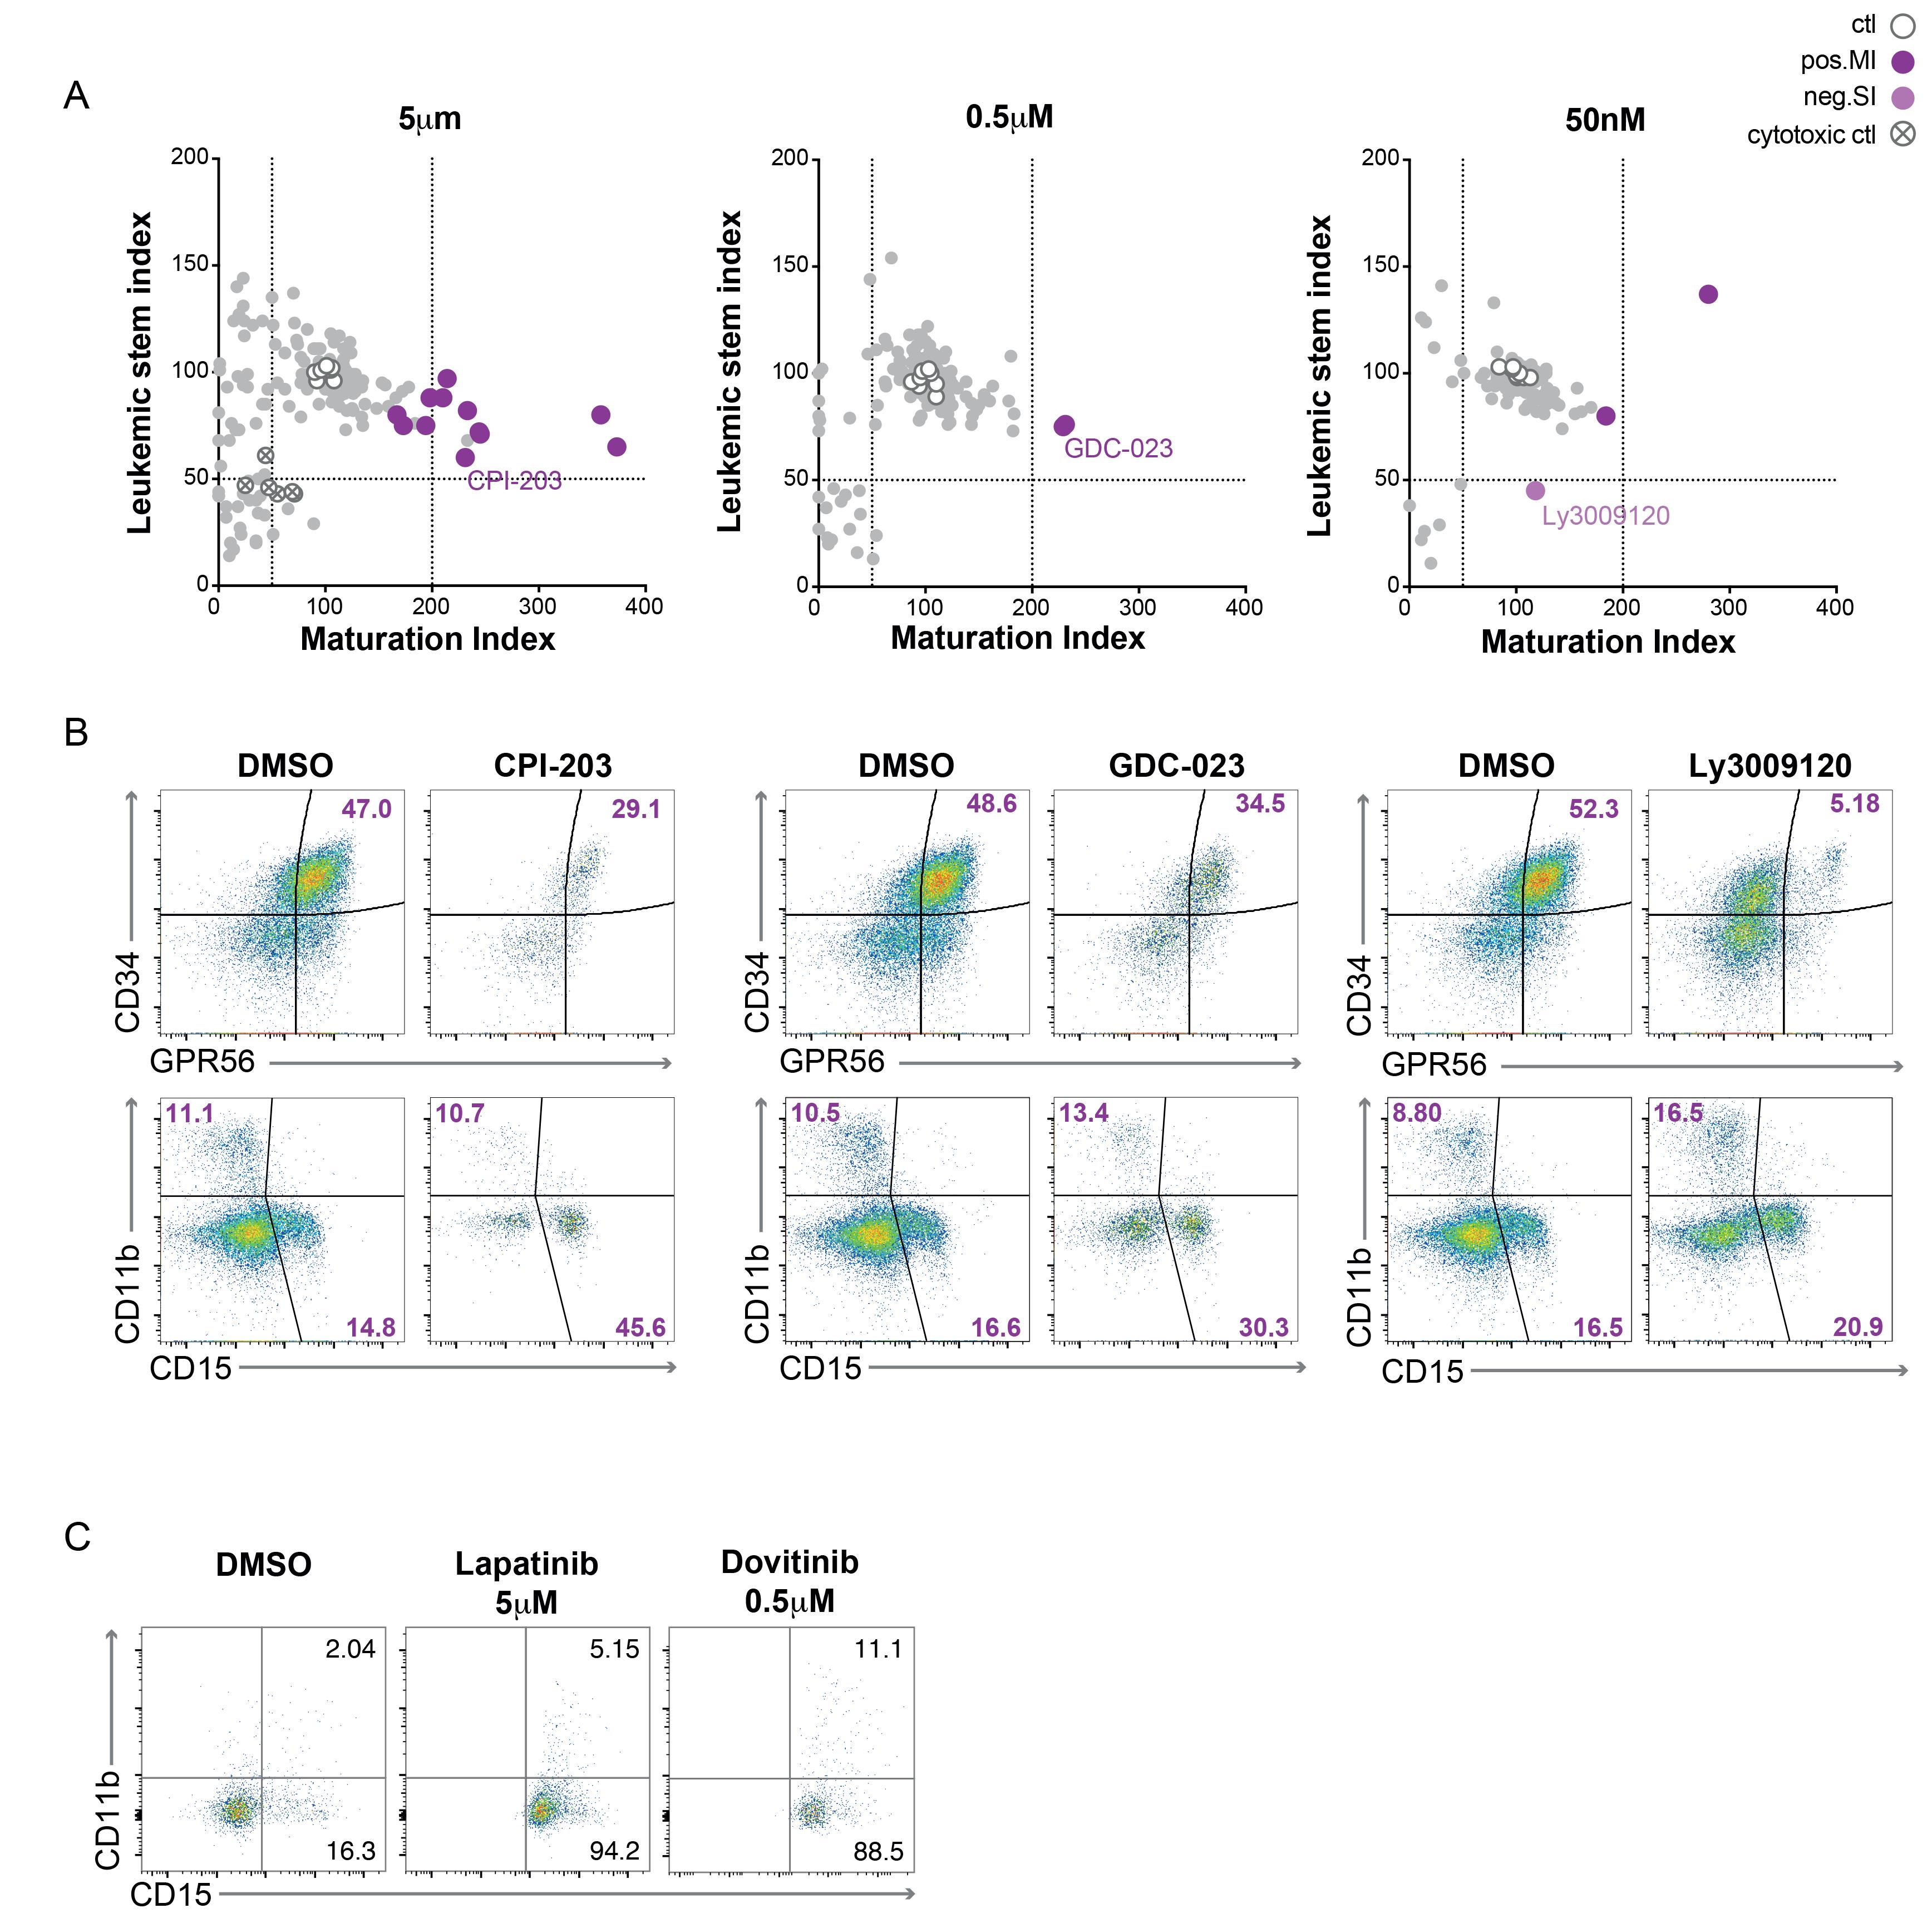
Figure 3. Multi-parameters analysis allows the identification of multiple compounds affecting AML biology. A) Each dot plot displays the effect of about 180 compounds from a cytotoxics library (at the three specified concentrations) on both the maturation and the leukemic stem index of a primary pediatric AML sample. B) The FACS plots display the effect of the candidate drugs highlighted in A, on the expression profile of surface markers for stem (CD34 and GRP56) and myeloid (CD11b and CD15) populations, illustrating the decrease/increase of the stem cell/maturation indexes displayed in A. C) The FACS plots illustrated a total shift in fluorescence of the CD15 expression level upon treatment by two compounds, indicative of their potential auto-fluorescence in the BV421 channel (confirmed in the litterature).
Notes
The antigen panel described here provides a thorough phenotype for most AML samples, but can be increased/decreased depending on the capacity of the FACS analyzer and the phenotype at diagnostic. For instance, 30% of AML are CD34-, which also means that GPR56 may not be relevant as a stem cell marker, while cells undergoing (myeloid) differentiation can be expected to acquire previously undetectable markers, such as CD14 or CD64. AML phenotype varies a lot from sample to sample and so does survival from freezing. For instance, a dead cell exclusion kit or size exclusion on lymphoprep are alternatives to remove excess dead cells. Overall, the very low count of false positives (which effect could not be reproduced in an independent titration experiment) indicates that despite the cellular heterogeneity of AML, our strategy provides a robust assay to identify compounds affecting the biology of primary AML cells.
Recipes
Wash solution
PBS supplemented with 2% heat-inactivated FCS and 2 mM EDTA.
Thawing medium
RPMI supplemented with 20% heat-inactivated FCS.
OP9-M2 culture medium
MEM supplemented with 20% tested FCS and 1% PSG.
LIC culture media
OP9-M2 culture media supplemented with 50 ng/mL SCF, and 25 ng/mL each IL3, TPO, FLT3, and IL6. “3× LIC culture medium” means that the cytokine concentration should be three times the final one, but other components are unchanged.
LSC staining solution – See Tables 1 and 2.
Table 1. LSC staining solution for CD34+ AML samples
Antigen Conjugate Dilution Per well Per ss/fmo* Company Catalog # CD34 AC7 1:100 0.5 5 Biolegend 343514 CD38 APC 1:100 0.5 5 Biolegend 303510 GPR56 PC7 1:200 0.25 2,5 Biolgend 358206 CD123 PE 1:100 0.5 5 Biolegend 306006 CD11b BV421 1:100 0.5 5 Biolegend 301324 CD15 BV605 1:50 1 10 Biolegend 323032 CD14 FITC 1:100 0.5 5 Biolegend 367116 CD64 FITC 1:100 0.5 5 Biolegend 305014 IgG NA 1:100 0.5 0.5 Merck M7894 Wash solution NA NA 20.25 Up to 25 μL NA NA Table 2. LSC staining solution for CD34+ AML samples
Antigen Conjugate Dilution Per well Per ss/fmo* Company Catalog # HLA-DR AC7 1:100 0.5 5 Biolegend 307618 CD38 APC 1:100 0.5 5 Biolegend 303510 CD117 PC7 1:200 0.25 2,5 Biolgend 313212 CD123 PE 1:100 0.5 5 Biolegend 306006 CD11b BV421 1:100 0.5 5 Biolegend 301324 CD15 BV605 1:50 1 10 Biolegend 323032 CD14 FITC 1:100 0.5 5 Biolegend 367116 CD64 FITC 1:100 0.5 5 Biolegend 305014 IgG NA 1:100 0.5 0.5 Merck M7894 Wash solution NA NA 20.25 Up to 25 μL NA NA *From 1:10 dilution of the antibody in wash buffer
7-AAD solution
Wash solution supplemented with 10 μg/mL 7-AAD.
Acknowledgments
This work was supported by the Swedish Cancer Foundation, the Swedish Childhood Cancer Foundation, Swedish Research Council, the Swedish Society for Medical Research, the Crafoord Foundation and the Kamprad Foundation. The protocol described above is derived from Baudet et al. (2016) and Hultmark et al. (2021).
Competing interests
The authors have no financial and/or non-financial competing interests to disclose.
Ethics
Informed consent was obtained from all patients prior to sample collection according to ethical permit dnr 826/2004 approved by Ethical Committee, Lund, Sweden.
References
- Baudet, A., Ek, F., Davidsson, J., Soneji, S., Olsson, R., Magnusson, M., Cammenga, J. and Juliusson, G. (2016). Small molecule screen identifies differentiation-promoting compounds targeting genetically diverse acute myeloid leukaemia. Br J Haematol 175(2): 342-346.
- Calvanese, V., Nguyen, A. T., Bolan, T. J., Vavilina, A., Su, T., Lee, L. K., Wang, Y., Lay, F. D., Magnusson, M., Crooks, G. M., et al. (2019). MLLT3 governs human haematopoietic stem-cell self-renewal and engraftment. Nature 576(7786): 281-286.
- Cancer Genome Atlas Research, N., Ley, T. J., Miller, C., Ding, L., Raphael, B. J., Mungall, A. J., Robertson, A., Hoadley, K., Triche, T. J., Jr., Laird, P. W., et al. (2013). Genomic and epigenomic landscapes of adult de novo acute myeloid leukemia. N Engl J Med 368(22): 2059-2074.
- Estey, E., Levine, R. L. and Löwenberg, B. (2015). Current challenges in clinical development of "targeted therapies": the case of acute myeloid leukemia. Blood 125(16): 2461-2466.
- Hultmark, S., Baudet, A., Schmiderer, L., Prabhala, P., Palma-Tortosa, S., Sanden, C., Fioretos, T., Sasidharan, R., Larsson, C., Lehmann, S., et al. (2021). Combinatorial molecule screening identified a novel diterpene and the BET inhibitor CPI-203 as differentiation inducers of primary acute myeloid leukemia cells.Haematologica 106(10): 2566-2577.
- Kalmanti, L., Saussele, S., Lauseker, M., Muller, M. C., Dietz, C. T., Heinrich, L., Hanfstein, B., Proetel, U., Fabarius, A., Krause, S. W., et al. (2015). Safety and efficacy of imatinib in CML over a period of 10 years: data from the randomized CML-study IV. Leukemia 29(5): 1123-1132.
- Kasi, P. M., Litzow, M. R., Patnaik, M. M., Hashmi, S. K. and Gangat, N. (2016). Clonal evolution of AML on novel FMS-like tyrosine kinase-3 (FLT3) inhibitor therapy with evolving actionable targets. Leuk Res Rep 5: 7-10.
- Komorowska, K., Doyle, A., Wahlestedt, M., Subramaniam, A., Debnath, S., Chen, J., Soneji, S., Van Handel, B., Mikkola, H. K. A., Miharada, K., et al. (2017). Hepatic Leukemia Factor Maintains Quiescence of Hematopoietic Stem Cells and Protects the Stem Cell Pool during Regeneration. Cell Rep 21(12): 3514-3523.
- Lim, S. H., Dubielecka, P. M. and Raghunathan, V. M. (2017). Molecular targeting in acute myeloid leukemia. J Transl Med 15(1): 183.
- Magnusson, M., Sierra, M. I., Sasidharan, R., Prashad, S. L., Romero, M., Saarikoski, P., Van Handel, B., Huang, A., Li, X. and Mikkola, H. K. (2013). Expansion on stromal cells preserves the undifferentiated state of human hematopoietic stem cells despite compromised reconstitution ability. PLoS One 8(1): e53912.
- Meads, M. B., Hazlehurst, L. A. and Dalton, W. S. (2008). The bone marrow microenvironment as a tumor sanctuary and contributor to drug resistance.Clin Cancer Res 14(9): 2519-2526.
- Pabst, C., Krosl, J., Fares, I., Boucher, G., Ruel, R., Marinier, A., Lemieux, S., Hébert, J. and Sauvageau, G. (2014). Identification of small molecules that support human leukemia stem cell activity ex vivo. Nat Methods 11(4): 436-442.
- Prashad, S. L., Calvanese, V., Yao, C. Y., Kaiser, J., Wang, Y., Sasidharan, R., Crooks, G., Magnusson, M. and Mikkola, H. K. (2015). GPI-80 defines self-renewal ability in hematopoietic stem cells during human development. Cell Stem Cell 16(1): 80-87.
- Reya, T., Morrison, S. J., Clarke, M. F. and Weissman, I. L. (2001). Stem cells, cancer, and cancer stem cells. Nature 414(6859): 105-111.
- Saultz, J. N. and R. Garzon. (2016). Acute myeloid leukemia: A concise review. J Clin Med 5(3): 33.
Article Information
Copyright
© 2022 The Authors; exclusive licensee Bio-protocol LLC.
How to cite
Baudet, A., Hultmark, S., Ek, F. and Magnusson, M. (2022). Small Molecule Screening of Primary Human Acute Myeloid Leukemia Using Co-culture and Multiplexed FACS Analysis. Bio-protocol 12(6): e4353. DOI: 10.21769/BioProtoc.4353.
Category
Cancer Biology > Cancer stem cell > Drug discovery and analysis
Cell Biology > Cell-based analysis > Flow cytometry
Do you have any questions about this protocol?
Post your question to gather feedback from the community. We will also invite the authors of this article to respond.