- Protocols

- Articles and Issues
- For Authors
- About
- Become a Reviewer

Normalized Ribo-Seq for Quantifying Absolute Global and Specific Changes in Translation
(*contributed equally to this work) Published: Vol 12, Iss 4, Feb 20, 2022 DOI: 10.21769/BioProtoc.4323 Views: 5267
Reviewed by: Chiara AmbrogioVaibhav B. ShahAnonymous reviewer(s)
Original research article
The authors used this protocol in:
Mar 2020
Advertisement


Protocol Collections
Comprehensive collections of detailed, peer-reviewed protocols focusing on specific topics


Abstract
Ribosome profiling (Ribo-Seq) is a highly sensitive method to quantify ribosome occupancies along individual mRNAs on a genome-wide scale. Hereby, ribosome-protected fragments (= footprints) are generated by nuclease digestion, isolated, and sequenced together with the corresponding randomly fragmented input samples, to determine ribosome densities (RD). For library preparation, equal amounts of total RNA are used. Subsequently, all transcript fragments are subjected to linker ligation, cDNA synthesis, and PCR amplification. Importantly, the number of reads obtained for every transcript in input and footprint samples during sequencing depends on sequencing depth and library size, as well as the relative abundance of the transcript in the sample. However, the information pertaining to the absolute amount of input and footprint sequences is lost during sample preparation, hence ruling out any conclusion whether translation is generally suppressed or activated in one condition over the other. Therefore, the RD fold-changes determined for individual genes do not reflect absolute regulation, but have to be interpreted as relative to bulk mRNA translation. Here, we modified the original ribosome profiling protocol that was first established by Ingolia et al. (2009), by adding small amounts of yeast lysate to the mammalian lysates of interest as a spike-in. This allows us to not only detect changes in the RD of specific transcripts relative to each other, but also to simultaneously measure global differences in RD (normalized ribosome density values) between samples.
Graphic abstract:

Global changes in translation efficiency can be detected with polysome profiling, where the proportion of polysomal ribosomes is interpreted as a proxy for ribosome density (RD) on bulk mRNA. Ribo-Seq measures changes in RD of specific mRNAs relative to bulk mRNA. The addition of a yeast-lysate, as a spike-in for normalization of read counts, allows for an absolute measurement of changes in RD.
Background
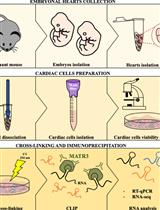
Changes in gene expression of protein coding genes are controlled at the level of mRNA transcription and stability, as well as at the level of protein synthesis and degradation (Schwanhausser et al., 2011). While RNA sequencing provides a very sensitive and quantitative means to also detect subtle changes in mRNA transcription and degradation on a global scale, adaptations in nascent and total protein levels, which are commonly measured by mass spectrometric approaches, cannot be quantified as faithfully, due to lower detection and temporal resolution (Dermit et al., 2017). Currently, mostly three different methods are applied to directly measure the rate of newly synthesized proteins by mass spectrometry on a genome-wide scale, including a) pulse-chase stable isotope labeling with amino acids in cell culture (pSILAC) (Schwanhausser et al., 2009), b) SILAC in combination with incorporation of modified amino acids [for example, azidohomoalanine (AHA)] into newly synthesized proteins followed by purification (called BONCAT/QuaNCAT, for quantitative bio-orthogonal non-canonical amino acid tagging) (Dieterich et al., 2007), and c) puromycin incorporation into newly synthesized peptides and purification (PUNCH-P) (Aviner et al., 2014). Alternatively, polysome fractionation in combination with RNA isolation and transcript detection by quantitative real time PCR, microarray analysis, or RNA sequencing has been used to detect changes in the translational status of transcripts. Here, the amount of every transcript per fraction is commonly normalized using equal amounts of spike-in RNA per fraction (Melamed et al., 2009). This approach, however, is either very labor- and/or cost-intensive, or involves the pooling of different polysomal fractions, which obscures especially weak translational changes characterized by small shifts in the polysomal profile. In addition, transcripts with a long coding sequence (CDS) tend to shift less within the polysome profile than those with a short CDS, which distorts the overall analysis. Only with the establishment of ribosome profiling (Ribo-Seq), a highly quantitative and single-codon resolved snap-shot of the current translational status of specific transcripts could be achieved (Ingolia et al., 2009). Unfortunately, with this technique only relative differences in RD of transcripts can be reported, when comparing different samples or conditions. The information regarding absolute changes in the translation rate of a cell is lost. Here, we present a method that we call normalized Ribo-Seq, which allows for the comparison of the relative and absolute occupancies of mRNAs with ribosomes between samples, by normalizing Ribo-seq to a spike-in control. The use of an evolutionarily distant species as spike-in has already been successfully applied to normalize Ribo-Seq datasets in different experimental settings (Cattie et al., 2016; Wang et al., 2018; Haneke et al., 2020; Wang and Gilbert, 2021). For our approach, we add yeast lysate to human lysates as spike-in, after careful quantification by UV absorbance (Figure 1, Note 1). After Ribo-Seq and alignment of sequencing reads to a joint reference of yeast and human transcriptomic sequences, we normalize the number of human ORF-aligned reads to the sum of yeast ORF-aligned reads, to retain information about global changes in RD between conditions.
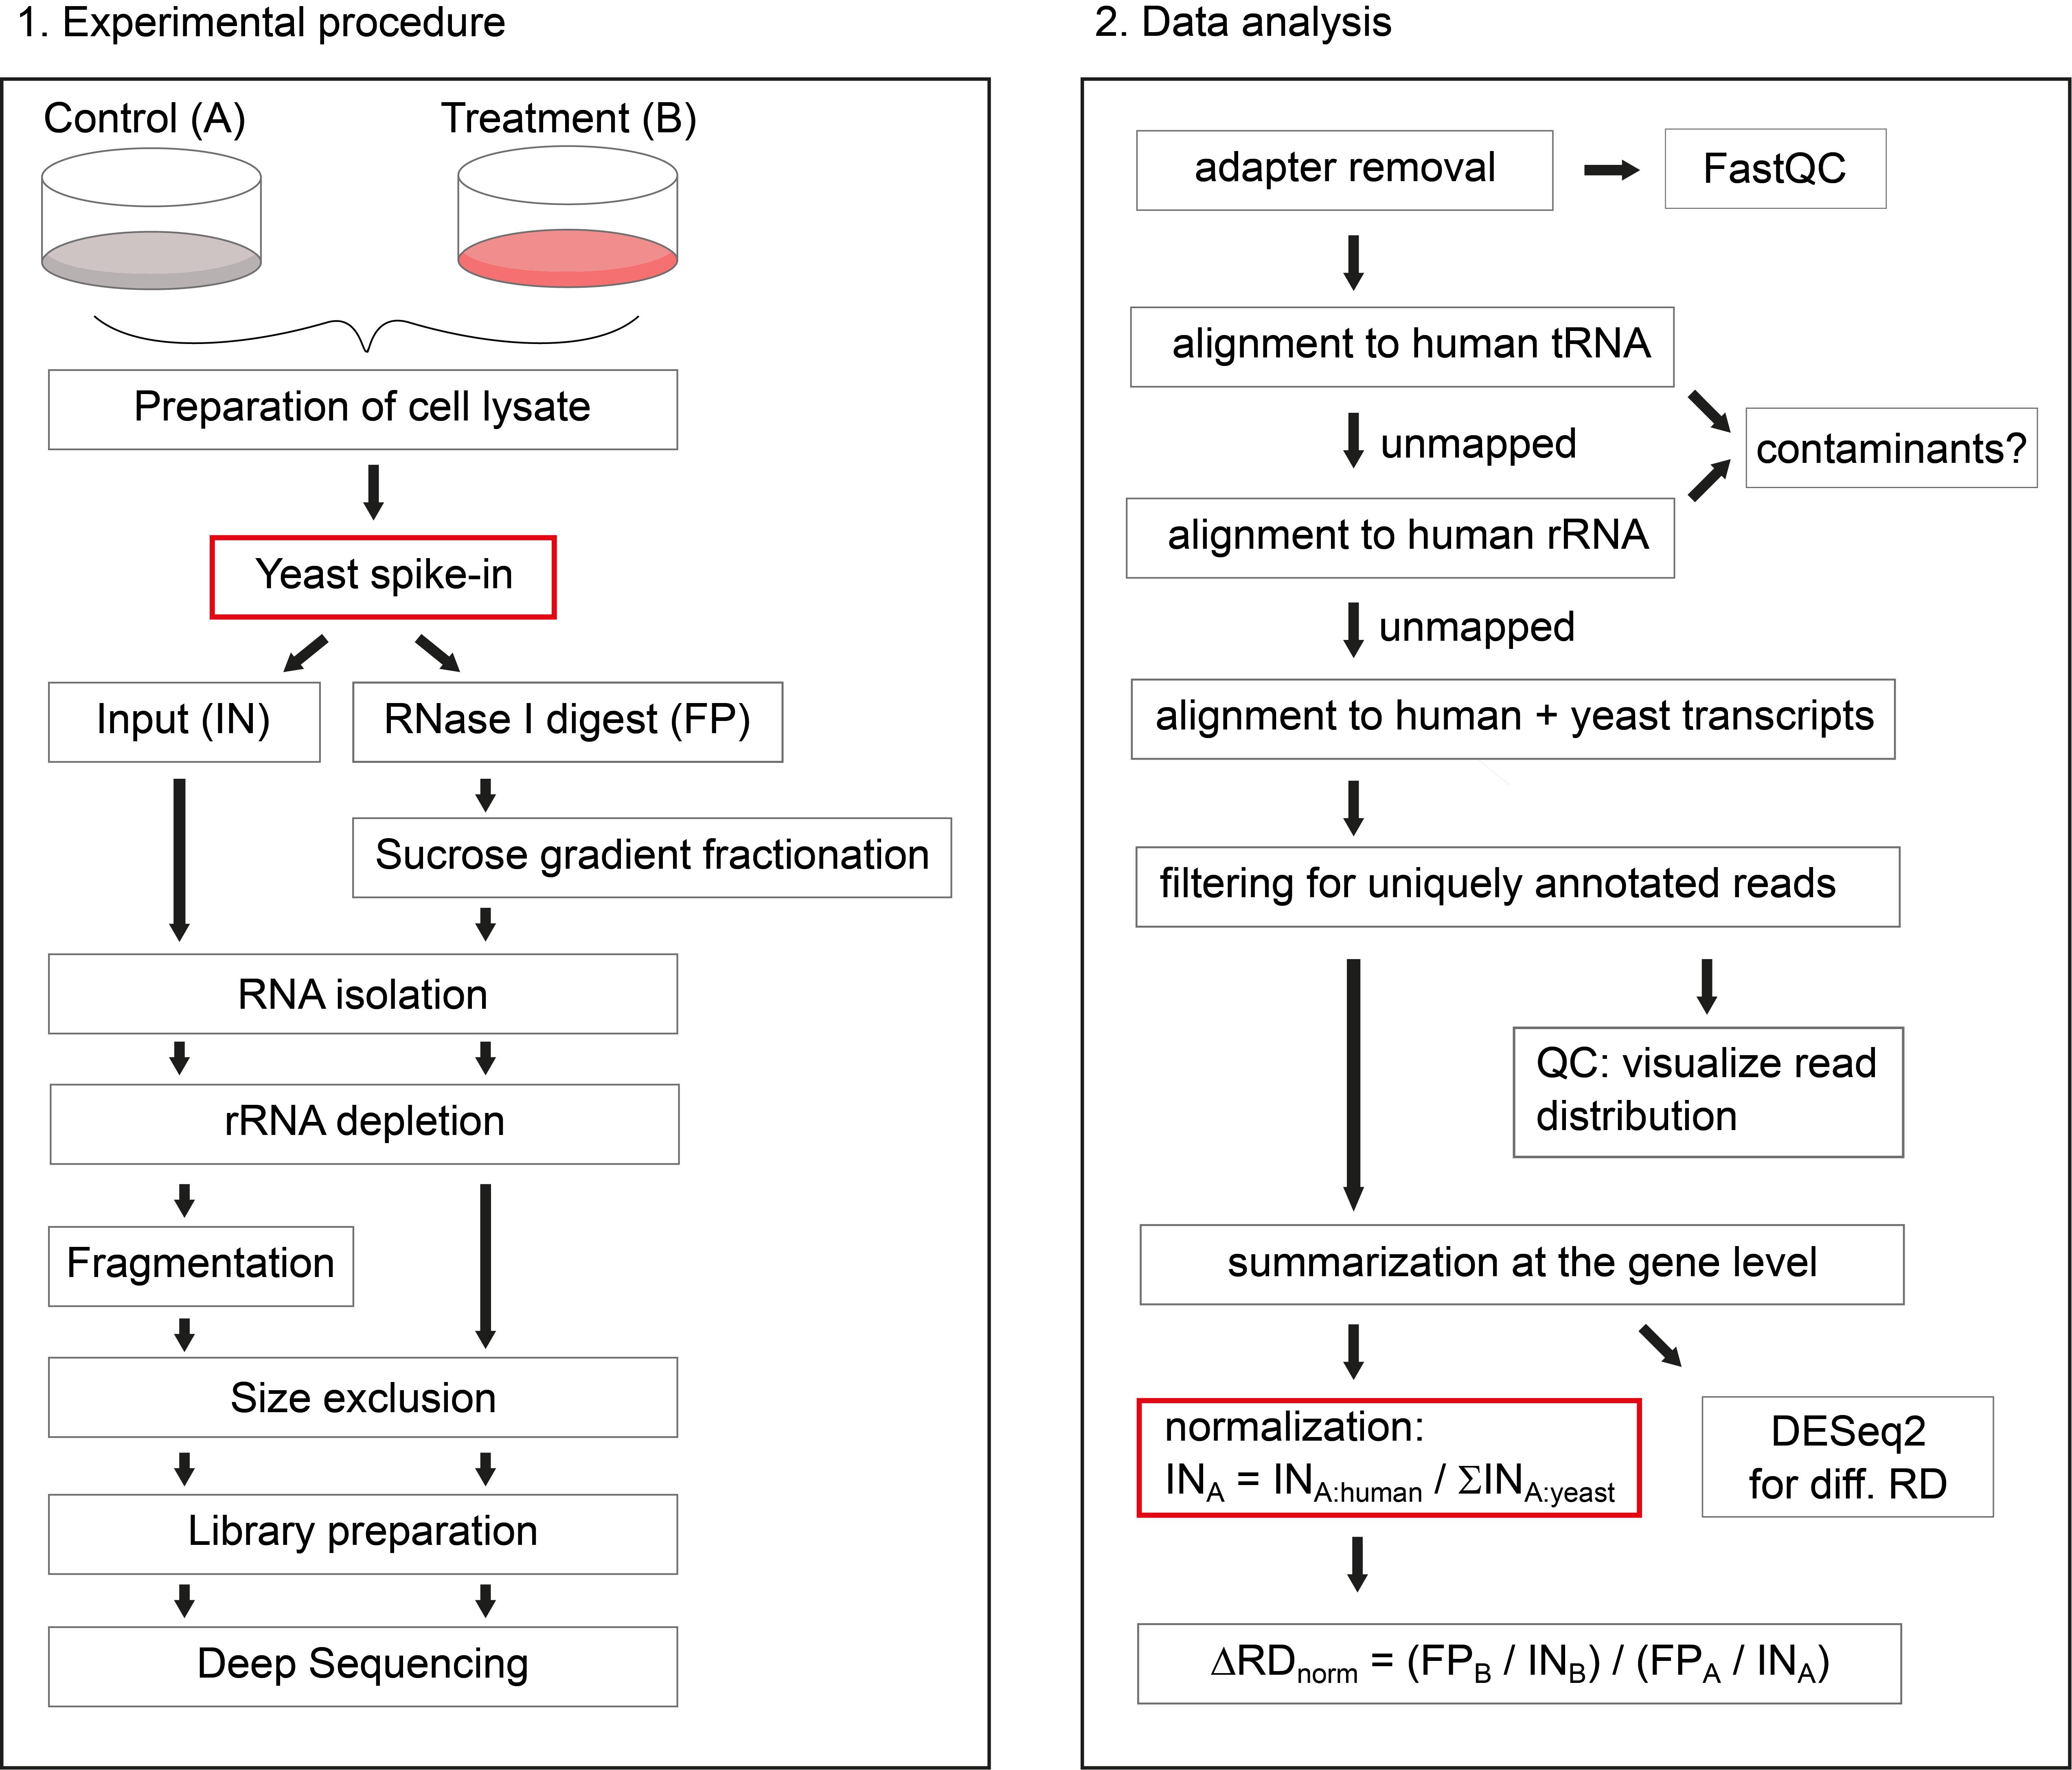
Figure 1. Schematic overview of the protocol. On the left side, the experimental procedure is illustrated, highlighting the addition of yeast lysate as spike-in, after preparation of human cell lysates. On the right side, the data analysis workflow is depicted, highlighting the sample-wise normalization to the sum of yeast ORF reads, to retrieve information about global changes in RD.
Materials and Reagents
Materials
Whole cell Saccharomyces cerevisiae lysate (BY4741 WT strain), flash frozen in liquid nitrogen and stored at -80°C (see Note 2)
10 cm or 15 cm sterile cell culture plates (Sarstedt, catalog numbers: 83.3902 and 83.3903)
Cell lifter (Santa Cruz, catalog number: sc-395252)
Pre-sterilized, RNase-free 1,250 µL, 200 µL, 20 µL, and10 µL micropipette filter tips
Pre-sterilized, RNase-free 0.5 mL, 1.5 mL, and 2 mL microcentrifuge tubes
4 mL open-top thinwall polypropylene tubes 11 × 60 mm (Beckman, catalog number: 328874)
RiboZero Gold Kit for rRNA removal (Illumina, catalog number: MRZG126, see Note 3)
DynaMagTM-2 Magnetic stand (Invitrogen, catalog number: 12321D)
Cutfix stainless scalpel (Braun, catalog number: 5518040)
0.45 µm NanoSep MF tubes (PALL, catalog number: ODM45C34)
21 G syringe needle (Terumo Neolus, catalog number: NN-2150R)
MicroAmp optical 384-well reaction plate (Applied Biosystems, catalog number: 4309849)
MicroAmp optical adhesive film (Applied Biosystems, catalog number: 431971)
Agilent High Sensitivity DNA kit (Agilent, catalog number: 5067-4626)
Agilent small RNA kit (Agilent, catalog number: 5067-1548)
DeNovix dsDNA High Sensitivity kit (Biozym, catalog number: 31DSDNA-HI2)
Qubit microRNA kit (ThermoFisher Scientific, catalog number: Q32880)
NEXTflex small RNA-Seq Kit v3 (Hiss Diagnostics, catalog number: NOVA-5132-06)
NextSeq 500/550 High Output Kit v2.5 (Illumina, catalog number: 20024906)
DMEM (Gibco, catalog number: 41965-039) (in case of RPE1 cells use DMEM/ F12 (Ham’s) medium 1:1 (Gibco, catalog number: 11320-033))
L-glutamine (PAN Biotech, catalog number: P04-80100)
Penicillin/ Streptomycin (PAN Biotech, catalog number: P06-07100)
Fetal bovine serum (FBS, Sigma, catalog number: F7524)
Cycloheximide (CHX, AppliChem, catalog number: A0897)
Nuclease-free water (Ambion, catalog number: AM9937)
Tris
MgCl2
NaCl
KCl
Triton X-100 (Roth, catalog number: 3051.A)
NP-40 (Genaxxon Bioscience, catalog number: M3165)
DTT (AppliChem, catalog number: A2948)
Complete Protease inhibitor, EDTA-free (Roche, catalog number: 11836170001)
Superase Inhibitor (Invitrogen, catalog number: AM2694)
RNase I (Ambion, catalog number: AM2294)
Sucrose
Urea
EDTA
SDS
Phenol:chloroform:isoamylalcohol (PCI, 25:24:1, AppliChem, catalog number: A0944)
Isopropanol
GlycoBlue (15 mg/mL, Ambion, catalog number: AM9515)
Ethanol
NaHCO3
Na2CO3
Glycerol
Bromphenol Blue (AppliChem, catalog number: A2331)
Xylencyanol (AppliChem, catalog number: A4976)
Boric acid
NaOAc
Rotiphorese Gel 30 (37.5:1) polyacrylamide (Roth, catalog number: 3029.1)
Tetramethylethylenediamine (TEMED, AppliChem, catalog number: A1148)
Ammonium peroxodisulfate (APS, AppliChem, catalog number: 131138)
Small RNA ladder (Abnova, catalog number: R0007)
SybrGold (Invitrogen, catalog number: S11494)
RNase OUT (40 U/µL, Invitrogen, catalog number: 10777019)
ATP (Thermo Fisher Scientific, catalog number: R0441)
T4 Polynucleotide kinase (10 U/µL, NEB, catalog number: M0201S) and reaction buffer (10×, NEB, catalog number: B0201S)
SybrGreen Master Mix (Applied Biosystems, catalog number: A25742)
Phosphate buffered saline (PBS) (see Recipes)
Polysome buffer A (2×) (see Recipes)
Polysome buffer B (2×) (see Recipes)
Polysome lysis buffer A (see Recipes)
Polysome lysis buffer B (see Recipes)
Urea buffer (see Recipes)
Random fragmentation buffer (see Recipes)
Stop/Precipitation solution (see Recipes)
Tris-Borate-EDTA (TBE, 10×) (see Recipes)
RNA loading dye (3×) (see Recipes)
25 nt size marker oligo (GCGCGUUACAUCUGGAGUACGAUAC)
35 nt size marker oligo (GGUCCGUCCGGUCUUCUAAUGAACUAGCGAACGAA)
forward primer for test qPCR (GTTCAGAGTTCTACAGTCCGA)
reverse primer for test qPCR (CCTTGGCACCCGAGAATTCCA)
Equipment
Refrigerated tabletop microcentrifuge
End-over-end rotator
Spectrofluorometer (DeNovix, model: DS-11FX+)
Optional: Gradient Master Station (BioComp)
Swinging bucket ultracentrifuge rotor (Hitachi, model: P56ST)
Ultracentrifuge (Hitachi, model: CP80NX)
Continuous UV light monitor and fractionator (Teledyne Isco Foxy Jr)
Fume hood
Thermoblock
Vortex
Thermocycler (Eppendorf Mastercycler)
Mini Protean Tetra Cell polyacrylamide gel box (Bio-Rad) and electrophoresis power supply
Shaker
UV transilluminator or blue light table
Quant Studio Real-Time PCR System (LifeTech, model: 5384)
Bioanalyzer (Agilent, model: 2100 Bioanalyzer)
Sequencer (Illumina, NextSeq500)
Software
We performed all sequencing data analysis steps under Ubuntu 16.04 LTS. The gzip package, perl, and R (with RScript under /usr/bin) must be installed. Depending on the steps that you would like to perform, not all tools might be necessary. For reproducing the analysis exactly as we presented it in our article (Haneke et al., 2020), you can download the directory “tools” from our OSF project page, which contains the versions that we used. For the analysis of new data, it might be preferable to download the newest versions of these tools:
Bowtie (http://bowtie-bio.sourceforge.net/index.shtml) (Langmead et al., 2009)
DESeq2 (http://www.bioconductor.org/packages/release/bioc/html/DESeq2.html) (Love et al., 2014)
FastQC (https://www.bioinformatics.babraham.ac.uk/projects/fastqc/)
fastx (http://hannonlab.cshl.edu/fastx_toolkit/download.html)
PeakTrak v1.10 (Teledyne ISCO, see Note 4)
perl (https://www.perl.org/)
samtools (https://www.htslib.org/)
seqinr (http://seqinr.r-forge.r-project.org/)
sratoolkit (https://github.com/ncbi/sra-tools/wiki/02.-Installing-SRA-Toolkit)
Databases
The code shown in this protocol, our in-house developed scripts, and further required files are available from our OSF project page. Other versions of tRNA, rRNA, transcriptomic, and genomic sequences can be downloaded from the Table Browser of the UCSC Genome Browser. Unprocessed read sequences of our own study are available from GEO via SRA (see Data Analysis, D):
UCSC Genome Browser (https://genome.ucsc.edu/)
OSF (https://osf.io/wr23s/?view_only=1f6fafb4f1d144f8a6093730ebe50f2a)
GEO (https://www.ncbi.nlm.nih.gov/geo/query/acc.cgi?acc=GSE128538)
Procedure
Prepare the spike-in sample
Thaw whole-cell Saccharomyces cerevisiae lysate on ice and centrifuge at 20,000 × g and 4°C for 5 min, to remove cell debris.
Pre-dilute the supernatant in five times the volume of polysome lysis buffer A (see Recipes). After dilution, we obtained a concentration of ~7 A260 units per mL, which approximately corresponds to the concentration of the RPE1 lysates, and is therefore convenient for pipetting (see step D2). Aliquot and flash freeze again at -80°C. Aliquots should be used only once after thawing.
Seeding and treatment of cells
One day before the experiment, seed mammalian cells into one 10 or 15 cm cell culture dish per condition. We seeded 3 × 10⁶ RPE1 cells per 15 cm dish prior to starvation (Haneke et al., 2020). For HeLa cells, seed 1.2 × 10⁶ cells into a 10 cm cell culture dish. Amount and appropriate cell numbers need to be tested for all cell lines beforehand, to obtain enough material for sequencing and to ensure that the cells are always kept at sub-confluency, thereby preventing translation suppression by contact inhibition (see Note 5).
For cell treatment, pre-dilute the drug of interest and the appropriate control solvent (for a 10 cm dish) in 10 mL of pre-warmed DMEM containing 10% FBS, 2 mM L-glutamine, 100 U/mL penicillin, and 100 µg/mL streptomycin. (For RPE1 cells use Ham’s F12 medium instead of DMEM). Treat the cells and incubate them for the appropriate time at 37°C in 5% CO2. Even if no drug treatment is performed, it is generally still advisable to exchange the cell culture medium for fresh medium for a few hours, to obtain cells with a high translation rate.
Preparation of mammalian cell lysate
Note: Cell lysis should be performed at 4°C in a cold room or on ice.
Optional: Treat cells with 100 µg/mL cycloheximide (CHX) for 5 min at RT to arrest ribosomes (see Note 6).
Remove the supernatant and wash cells with 1× PBS containing 100 µg/mL CHX. Take off the washing solution completely.
Lyse cells in 150–250 µL (depending on the size of the plate) polysome lysis buffer A (see Recipes, see Note 7) by directly scraping the plate with a cell lifter. Transfer the lysate to a 1.5 mL reaction tube.
Incubate the lysate with end-over-end rotation at 4°C for 10 min.
Clear lysate by centrifugation at 10,000 × g and 4°C in a tabletop centrifuge for 10 min, to remove cell nuclei. Transfer the supernatant to a new tube.
Yeast spike-in
Measure absorbance of the cell lysate at 260 nm in a spectrophotometer, using polysome lysis buffer for blanking the instrument. Adjust samples to the same A260 and fill the volume up to 300 µL total with polysome lysis buffer.
Add equal amounts of yeast lysate to each sample. The yeast lysate should be 2% (w/w) of the mammalian cell lysate (adjusted according to the A260 measurement). For example, if you use 2 A260 units of mammalian lysate per sample, add 0.04 A260 units of yeast lysate. Make sure to pipet at least 5 µL of yeast lysate to reduce variations due to pipetting error. This might require further pre-dilution of the yeast lysate with polysome lysis buffer A.
For input samples, take approximately 10% of the lysate (mammalian plus yeast spike-in) into a new tube, and fill up to 300 µL with polysome lysis buffer. Add 300 µL of urea buffer (see Recipes) and 300 µL of phenol:chloroform:isoamylalcohol (PCI). Vortex and store samples at -20°C until further processing or directly proceed to section G.
RNase I digestion
Add 60 U of RNase I (60 U/µL) per A260 unit to the cell lysate.
Incubate at 4°C with end-over-end rotation for 5 min (see Note 8).
Stop the digestion by addition of Superase inhibitor (6 units per sample).
Polysome fractionation
Pre-cool the ultracentrifuge to 4°C. The ultracentrifuge rotor and buckets, as well as the sucrose gradients, should be kept at 4°C prior to usage. The sucrose gradients should be prepared prior or during cell lysis.
Prepare sucrose gradients (see Note 9) either with an automated gradient maker (steps F3–F8), or by step-wise preparation (steps F9–F13).
Prepare two sucrose solutions (17.5% and 50%) by dissolving the sucrose in the polysome buffer, which was also used for cell lysis. Approximately 2 mL of each solution is required per gradient.
Mark 4 mL polypropylene tubes according to the marker block of the Gradient Master Station from Biocomp.
Fill the tubes with 17.5% sucrose solution until you reach the mark.
Using a syringe, underlay the 17.5% sucrose with 50% sucrose, until you see the interface reaching the mark.
Put the tubes into the magnetic holder and run the Gradient Master System using the following settings:
Number of steps: 1
Time: 1 min 25 s
Angle: 82°
Speed: 19 rpm
Transfer the freshly prepared gradients to 4°C and use within the next couple of hours.
Prepare sucrose solutions with five different concentrations (17.5%, 25.6%, 33.8%, 41.9%, and 50%) by dissolving the sucrose in the polysome buffer, which was also used for cell lysis.
Pipette 780 µL of the 50% sucrose solution into a 4 mL polypropylene tube and freeze the tube at -80°C, until the solution is completely frozen.
Add 780 µL of the 41.9% sucrose on top of the frozen solution and freeze it again at -80°C.
Repeat the steps until all of the sucrose solutions have been layered in the gradient. Work quickly to avoid thawing of the previous sucrose layer. Completed gradients can be stored at -80°C for several months.
Transfer the gradients to 4°C for thawing several hours or the day before the experiment.
Load 250–300 μL of the digested lysate on the prepared sucrose gradients. Adjust the volume of individual gradients to the same level with polysome lysis buffer and balance the gradients using a scale, before transferring the gradients to the buckets of the ultracentrifuge rotor.
Spin samples in the ultracentrifuge at 40,000 rpm (corresponding to a maximum g-force of 208,600 × g and an average g-force of 157,600 × g in a SW60 rotor) for 2 h, with acceleration setting at 7 and deceleration setting at 1. Retrieve the buckets and place on ice until use.
Prepare the gradient fractionator according to the manufacturer’s instructions. Prepare 2 mL reaction tubes containing 300 µL of urea buffer (see Recipes) each for collecting the gradient fractions.
Place the gradient in the holding device of the fractionator and pierce the bottom of the tube with the needle pump. Place the tubes containing urea buffer in the corresponding places in the fraction holder. Pump in 60% sucrose (dissolved in water) from the bottom with 50% pump speed, so that the gradient is eluted from the top. Simultaneously record the UV absorbance of the gradient at sensitivity 2.0 or 1.0 with the PeakTrak software (see Note 4), to identify the 80S monosome peak. Figure 2 shows example profiles of RPE1 cells, as used in Haneke et al. (2020), and of RAW264.7 cells, a mouse macrophage cell line with a higher translation rate. Collect fractions every 14 s (approximately 300 µL per fraction), close the tubes, and mix by inverting. Once the gradient is completely eluted (around 12–14 fractions in total), transfer the tubes to the fume hood and add 300 µL of PCI to each tube. Vortex and freeze the samples at -20°C until all the gradients are processed or until further usage. Extended storage of samples is possible at this step.
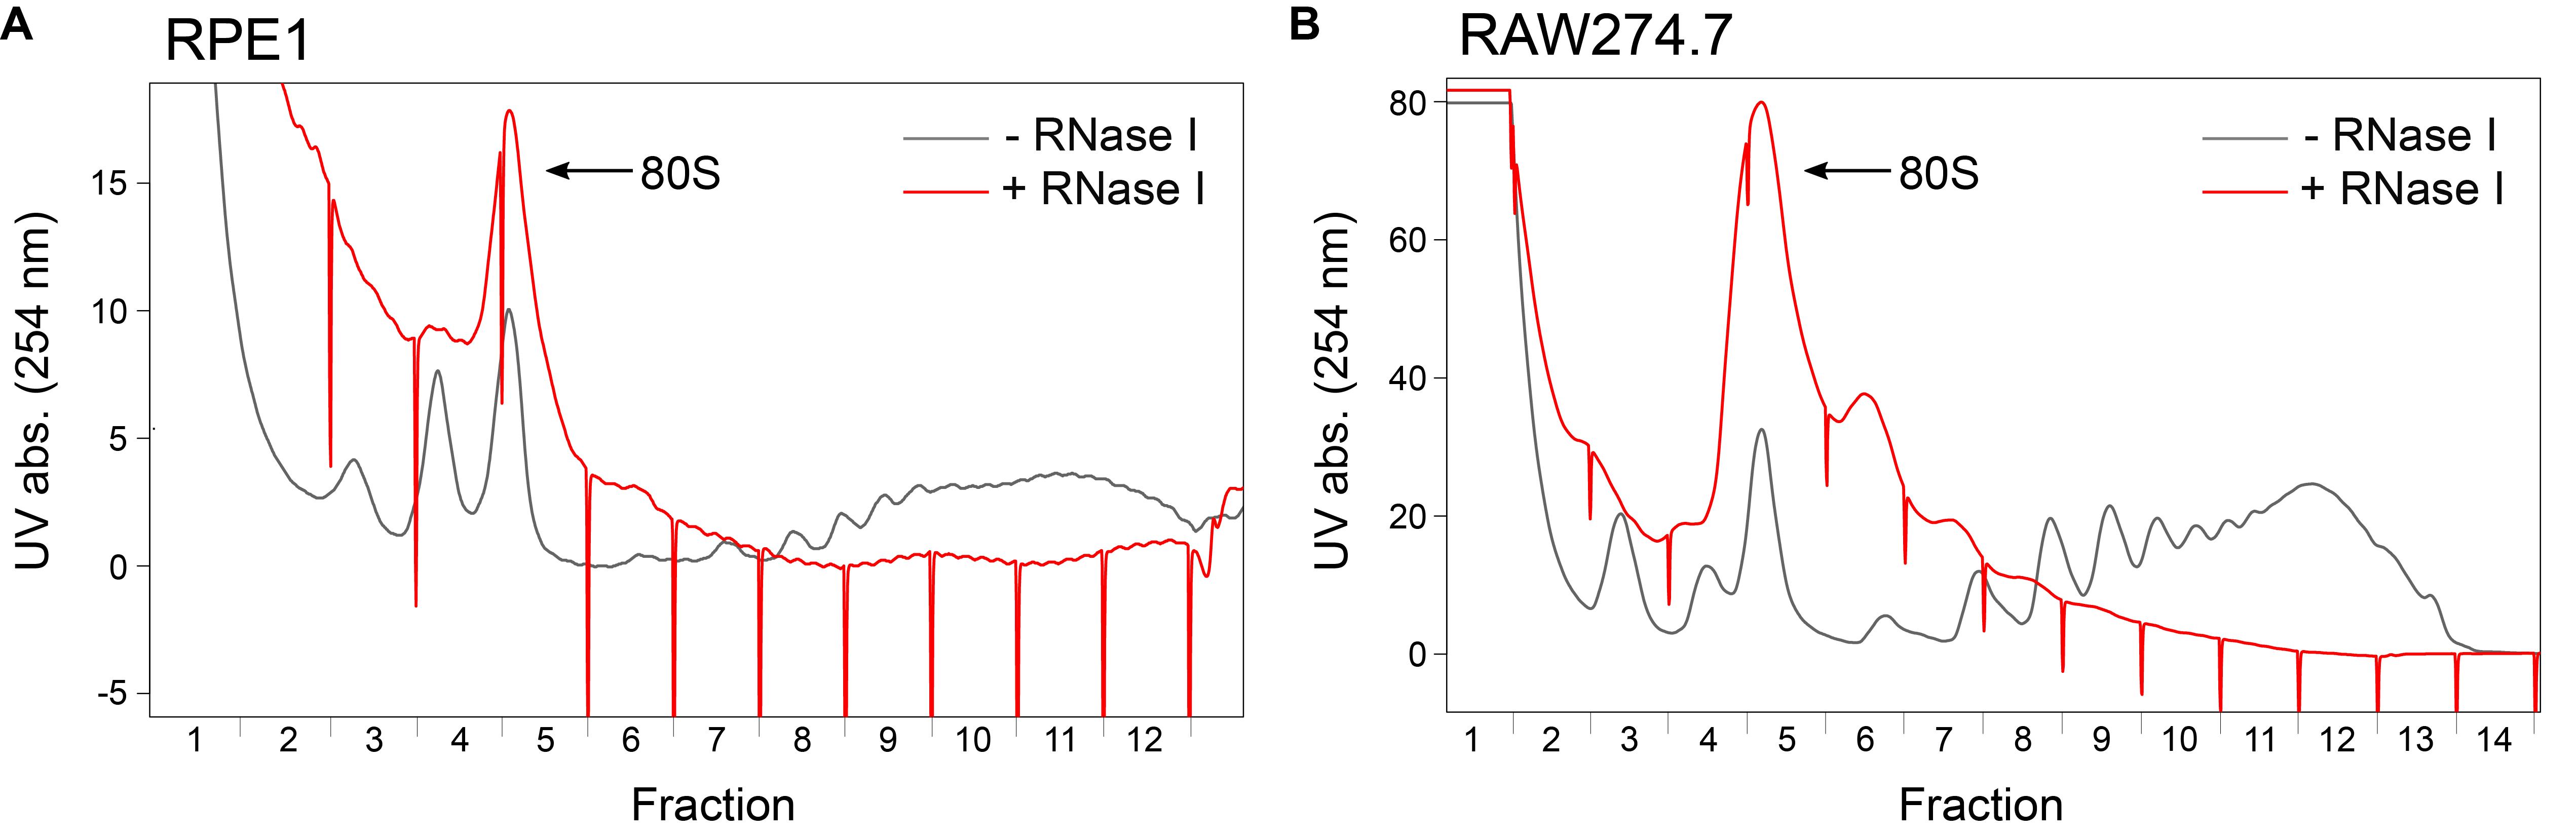
Figure 2. Identification of monosomal fractions after sucrose density gradient centrifugation. A. UV absorbance at 254 nm during gradient elution with and without RNase I digestion of RPEI lysates. The position of fraction borders is marked by sharp drops in the profile. B. As in A, for RAW264.7 cells.
RNA isolation
Identify the tubes containing monosomal ribosomes according to the UV absorbance profile, which is typically in fractions 4 and 5 (Figure 2). Process input samples in parallel.
Heat the samples at 65°C for 10 min in a thermoblock. Open the tubes once under the fume hood, to release pressure.
Spin for 20 min at 17,000 × g at RT in a tabletop centrifuge.
In the fume hood, move the upper aqueous phase (approximately 600–700 µL) into a new tube, while carefully avoiding touching the interphase. Add 1 µL of GlycoBlue to each sample before the addition of 700 µL of isopropanol. Vortex and precipitate the RNA at -20°C overnight.
Briefly vortex and centrifuge at 17,000 × g in a pre-cooled 4°C tabletop centrifuge for 20 min.
Discard the supernatant and wash pellet with 800 µL of ice-cold 70% ethanol. Spin again at 17,000 × g and 4°C for 10 min.
Take supernatant off completely and dry pellets at RT for 10–30 min.
Resuspend pellet in 10–20 µL of RNase-free water (depending on the size of the pellet) and dissolve it by incubation at 65°C in a thermoblock for 10–20 min, with occasional vortexing. If monosomal ribosomes were contained in more than one tube, RNA should be pooled at this point. Store the RNA at -80°C or directly process the samples further.
Removal of rRNA from input and ribosome footprints
Remove rRNA from samples using the RiboZero Gold rRNA removal kit (see Note 3) according to the manufacturer’s protocol.
Determine the concentration of the pooled RNA by Nanodrop measurement. Use up to 5 µg RNA per sample.
At the last step, transfer 90 µL of the supernatant containing rRNA depleted RNA to a new tube.
Add 89 µL of RNase-free water, 1 µL of GlycoBlue, and 20 µL of 3 M NaCl before precipitation with 200 µL of isopropanol at -20°C overnight.
Briefly vortex and centrifuge at 17,000 × g in a pre-cooled 4°C tabletop centrifuge for 20 min.
Discard supernatant and wash pellet with 800 µL of ice-cold 70% ethanol. Spin again at 17,000 × g and 4°C for 10 min.
Take supernatant off completely and dry pellets at RT for 10–30 min.
Resuspend pellet in 10 µL of RNase-free water and dissolve it by incubation at 65°C in a thermoblock for 10–20 min, with occasional vortexing.
Random RNA fragmentation of input material
Note: To generate RNA fragments that have a similar length as the ribosome protected fragments from the ribosome footprint samples, input RNA is processed by random alkaline fragmentation. Important: Process samples in PCR tubes and incubate samples in a thermocycler as precise setting of the temperature is crucial at this step!
Use all of the rRNA depleted RNA from the previous step (10 µL) and mix with 10 µL of 2× fragmentation buffer (see Recipes).
Incubate at 95°C for 12 min in a thermocycler (heat the lid!).
Stop the fragmentation by addition of 180 µL of stop/precipitation buffer (see Recipes) and immediately add 200 µL of isopropanol.
Precipitate the RNA at -20°C overnight.
Vortex briefly and centrifuge at 17,000 × g in a pre-cooled 4°C tabletop centrifuge for 20 min.
Discard supernatant and wash pellet with 800 µL of ice-cold 70% ethanol. Spin again at 17,000 × g and 4°C for 10 min.
Take supernatant off completely and dry pellets at RT for 10–30 min.
Resuspend pellet in 10 µL of RNase-free water and dissolve it by incubation at 65°C in a thermoblock for 10–20 min, with occasional vortexing.
Size-selection
Prepare a 15% polyacrylamide TBE-urea gel as follows (for 2 gels):
5 mL of Rotiphorese polyacrylamide (30%)
1 mL of 10× TBE
4.24 g urea (final concentration 8 M)
Fill up with H2O to 10 mL
Add 50 µL of 10% APS and 7 µL of TEMED
Mix and pour into pre-assembled Mini Protean Tetra Cell polyacrylamide gel boxes. Allow the gel to set.
Pre-run gel at 100–200 V in 1× TBE for 15–30 min.
While pre-running the gel, prepare RNA samples for loading. Add 5 µL of 3× RNA loading dye (see Recipes) to samples. At the same time, prepare the small RNA ladder and/or the size marker oligonucleotides (25 nt and 35 nt, see Note 10) for loading. For the marker, mix 2 µL of small RNA ladder with 8 µL of RNase-free water and 5 µL of 3× RNA loading dye (enough for two lanes). For the oligonucleotides, fill 5 pmol of the oligonucleotide up with RNase-free water to 10 µL and add 5 µL of 3× RNA loading dye.
Denature samples for 10 min at 65°C.
Before loading, rinse pockets of gels with a syringe to remove excess urea. Load the samples, the small RNA ladder and/or the size marker oligonucleotides on the gel; if possible, leave one free lane between the samples.
Run the gel at 150 V in 1× TBE, until the bromophenol blue running front is approximately 1 cm from the bottom of the gel.
Disassemble the gel and stain it with SybrGold (diluted 1:10,000 in 1× TBE) by gentle shaking at RT for 5–10 min.
Visualize the staining in a UV transilluminator or a blue light table, and excise the region between 25 and 35 nt with a scalpel.
Pierce a hole into the bottom of a 0.5 mL RNA-free reaction tube with a 21 G needle and place the tube into a 1.5 mL reaction tube with an open lid. Transfer the gel slices into the 0.5 mL tube.
Centrifuge at maximum speed in a tabletop centrifuge for 5 min, to force the gel slices through the hole. If gel pieces remain in the upper tube, either repeat or transfer the remaining gel pieces with a pipette. Discard the 0.5 mL tube.
Add 300 µL of 0.3 M NaCl and 2 µL of RNase OUT to each tube and incubate overnight at 4°C, with end-over-end rotation.
Cut the tip of a 1,250 µL filter pipette tip and transfer the gel slurry to a 0.45 µm NanoSep MF tube. Centrifuge at maximum speed in a tabletop centrifuge at 4°C for 5 min.
Transfer the flowthrough to a new tube, add 1 µL of GlycoBlue and 300 µL of isopropanol, mix well, and precipitate the RNA at -20°C overnight.
Briefly vortex and centrifuge at 17,000 × g in a pre-cooled 4°C tabletop centrifuge for 20 min.
Discard supernatant and wash pellet with 800 µL of ice-cold 70% ethanol. Spin again at 17,000 × g and 4°C for 10 min.
Take supernatant off completely and dry pellets at RT for 10–30 min.
Resuspend pellet in 14 µL of RNase-free water and dissolve it by incubation at 65°C in a thermoblock for 5–10 min, with occasional vortexing.
End-repair
Set up the following reaction:
14 µL of RNA
2 µL of 10 mM ATP
2 µL of 10× T4 PNK buffer
1 µL of T4 PNK
1 µL of RNase OUT
Incubate for 1 h at 37°C in a thermoblock.
Add 159 µL of RNase-free water, 1 µL of GlycoBlue, and 20 µL of 3 M NaCl to each sample. Precipitate with 200 µL isopropanol at -20°C overnight.
Briefly vortex and centrifuge at 17,000 × g in a pre-cooled 4°C tabletop centrifuge for 20 min.
Discard supernatant and wash pellet with 800 µL of ice-cold 70% ethanol. Spin again at 17,000 × g and 4°C for 10 min.
Take supernatant off completely and dry pellets at RT for 10–30 min.
Resuspend pellet in 12 µL of RNase-free water and dissolve it by incubation at 65°C in a thermoblock for 5–10 min, with occasional vortexing.
Library preparation and deep sequencing
Determine the concentration of the RNA using the Qubit microRNA kit.
If you want to see the size distribution of your RNA, you can use the Agilent small RNA kit and the Agilent Bioanalyzer.
Prepare the sequencing library using the NEXTflex Small RNA-Seq Kit v3, according to the manufacturer’s instructions (see Note 11). Important: all reactions described in the manual should be performed in PCR tubes and incubated in a thermocycler, since precise setting of the temperature is crucial to these steps.
After step F of the manual, determine the number of necessary PCR cycles by qPCR:
Dilute 1 µL of cDNA with 7 µL of H2O.
Dilute forward and reverse primers to 10 pmol/µL.
Prepare a master mix containing per sample:
0.4 µL of forward primer
0.4 µL of reverse primer
1.7 µL of H2O
5 µL of SybrGreen master mix
In a 384 well plate, mix 2.5 µL of diluted cDNA with 7.5 µL of master mix and seal the plate. Measure samples in triplicate.
Run a qPCR with the following settings:
2 min at 95°C
30 cycles of:
20 s at 95°C
30 s at 60°C
18 s at 72°C
The number of cycles in the PCR of step G of the manual should be 3 cycles less than the Ct determined by the qPCR, to yield a library of ~20 nM concentration.
After step G of the manual, take 1 µL of PCR product, dilute it with 3 µL of water and check the size distribution with the Agilent High Sensitivity DNA kit. Unless there is a strong peak at 130 bp, gel-free size-selection can be used.
The finished libraries can be stored at -20°C for an extended period of time. We suggest adjusting all libraries to the same concentration. The higher the concentration (e.g., 20 nM is desired), the more stable the library.
Multiplex libraries as desired and sequence on a NextSeq500 device.
Data analysis
Make sure that perl, R (with RScript under /usr/bin), and the gzip package are installed in your Linux device.
Create a directory named “tools” in your working directory, where you store the required software (bowtie, fastx, FastQC, samtools, and STAR). The entire directory can be downloaded from our OSF project page.
Prepare the references for alignment:
Download the directory “ref_fasta” with the required fasta files from our OSF project page, which contains human tRNA and rRNA sequences, and a human and a yeast transcriptomic set of sequences.
Optional: If you prefer updated versions of these sequences, or if you work with a different species, you can download fasta files from the UCSC Genome Browser or other sources, and replace the respective sequences. In the third alignment step (see section G in Data analysis), you need a fasta file with transcriptomic sequences and headers that consists of a transcript ID and a gene ID separated by an underscore (e.g., ENSMUST00000169927.1_Adora1). This is necessary because reads are summarized at the gene level (see Note 12). For preparing this fasta file, you can use the R script create_fasta.R in the directory named scripts in our OSF project page. A yeast fasta file downloaded from the UCSC Genome Browser does not need to be modified, because it is sufficient to have a character string in the header that distinguishes yeast from human transcripts.
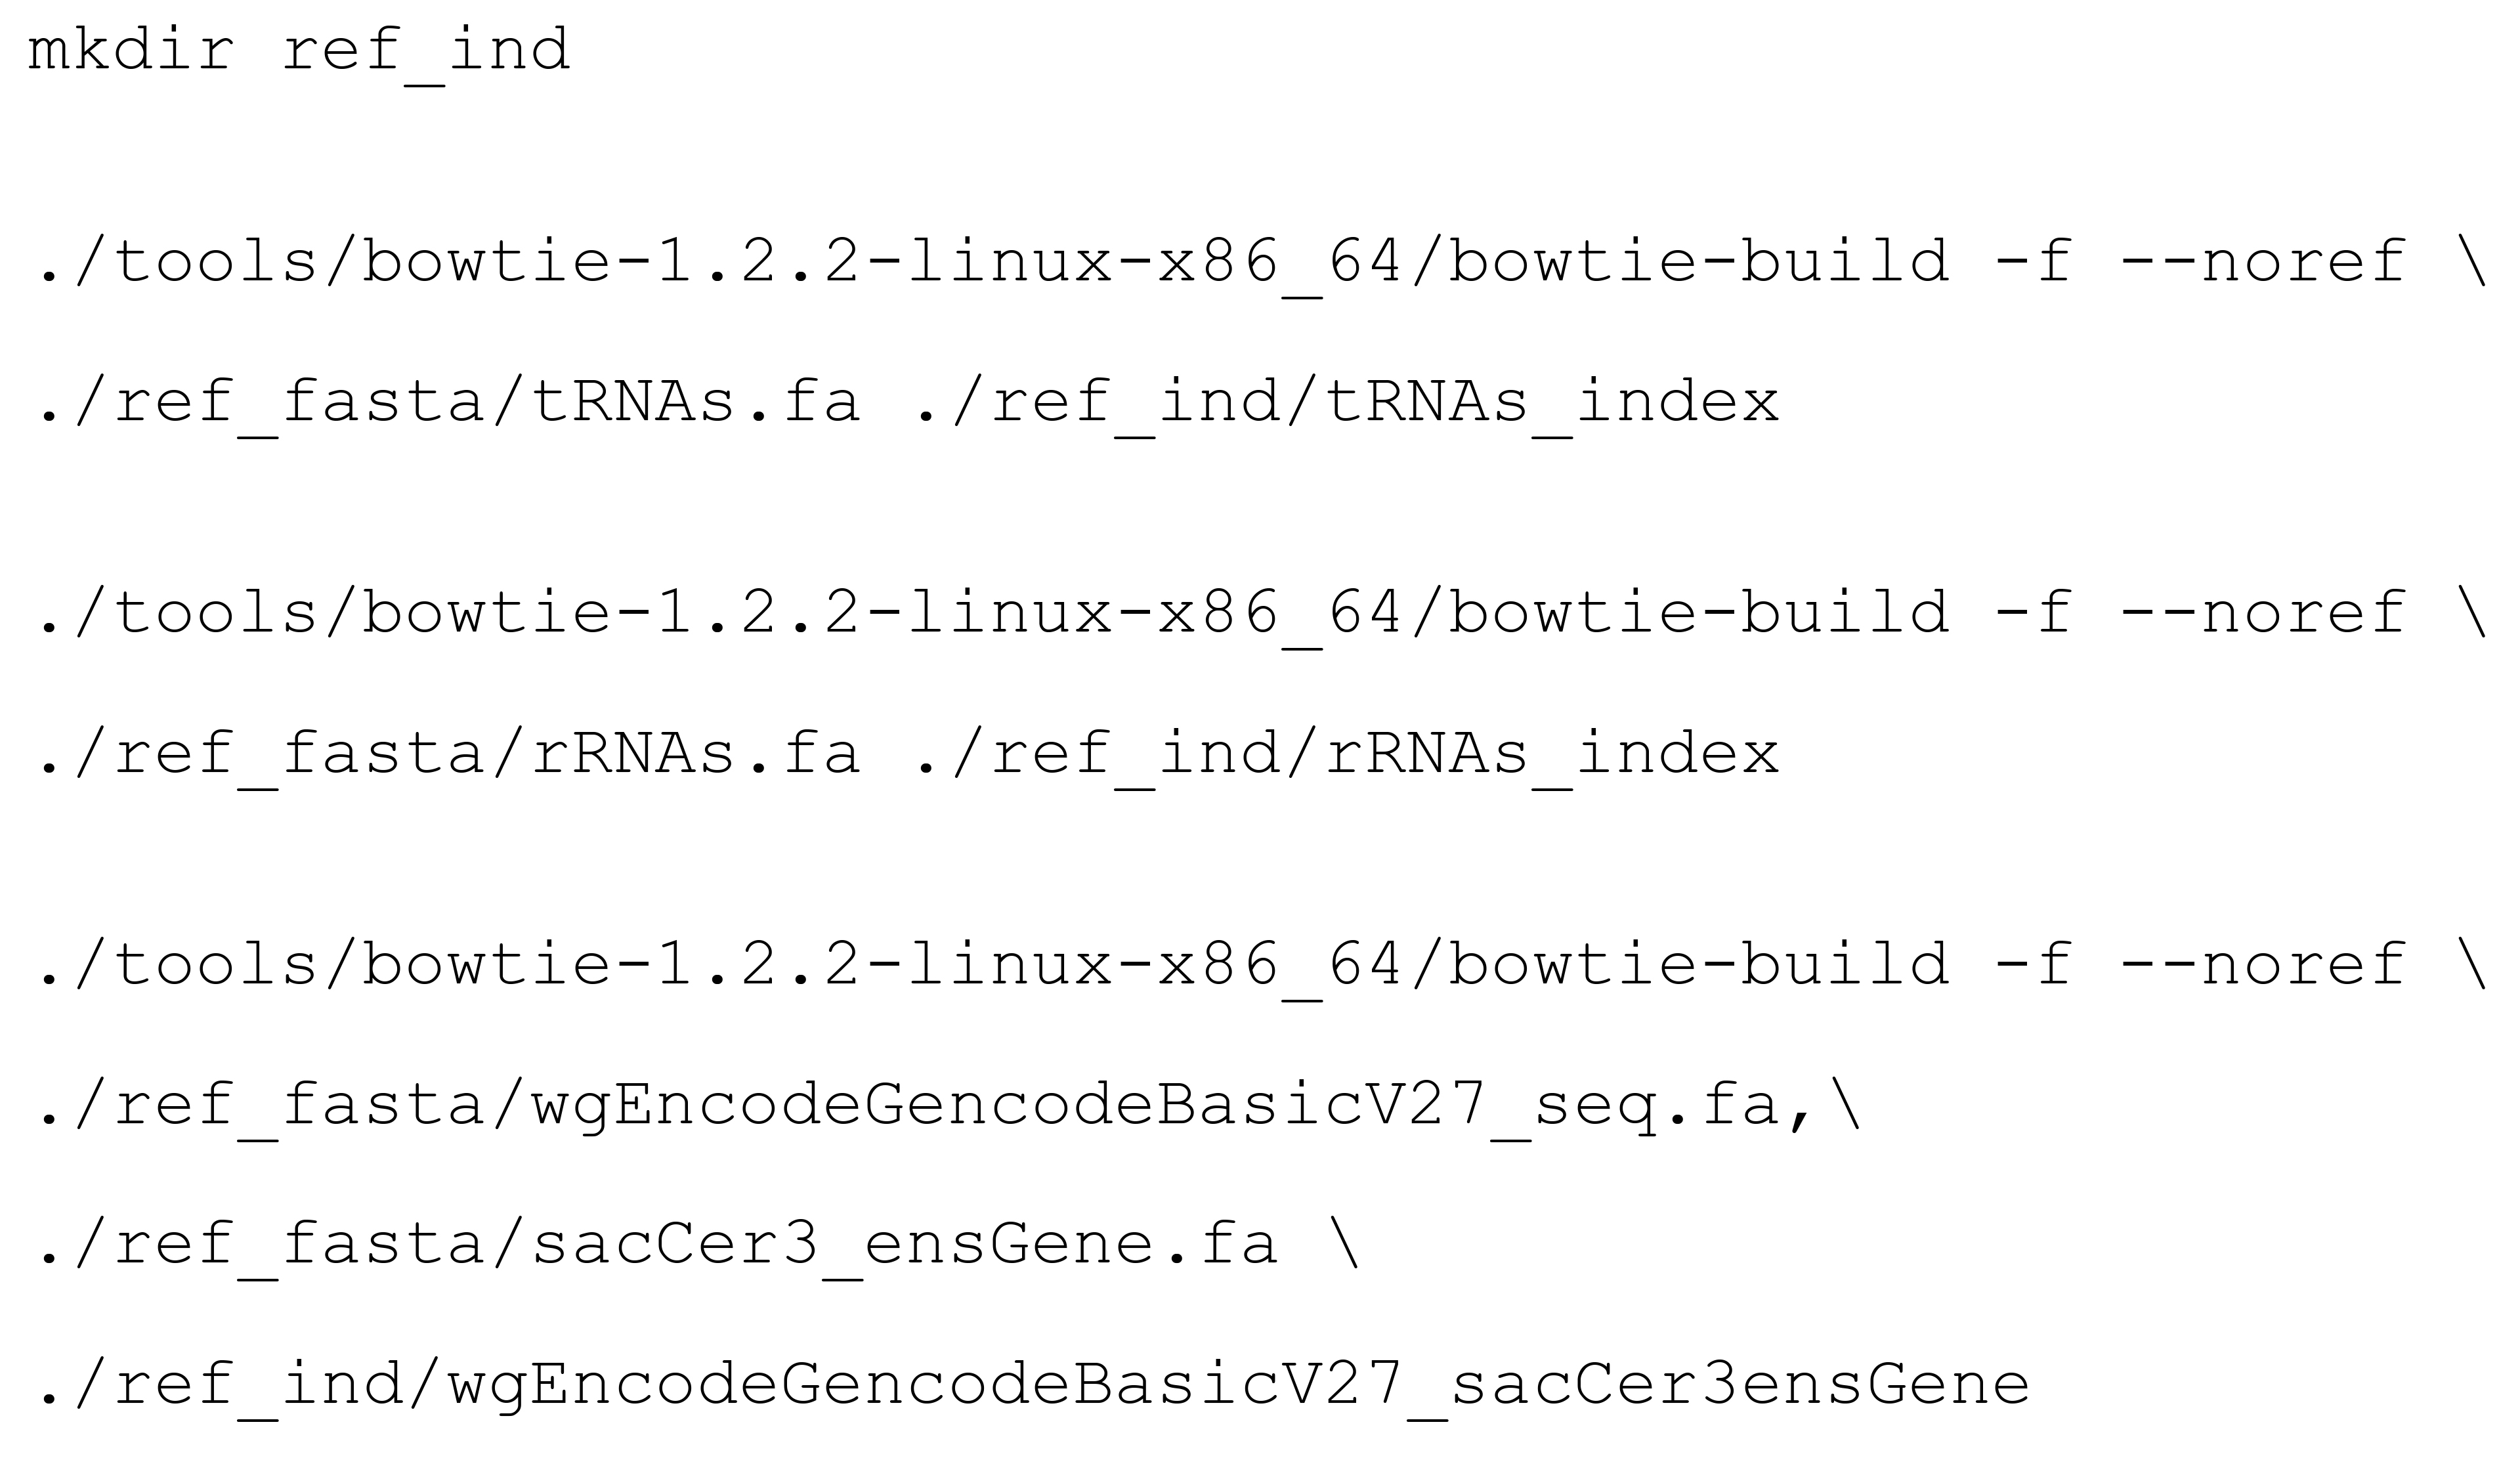
Create a directory for the indices and run bowtie-build:
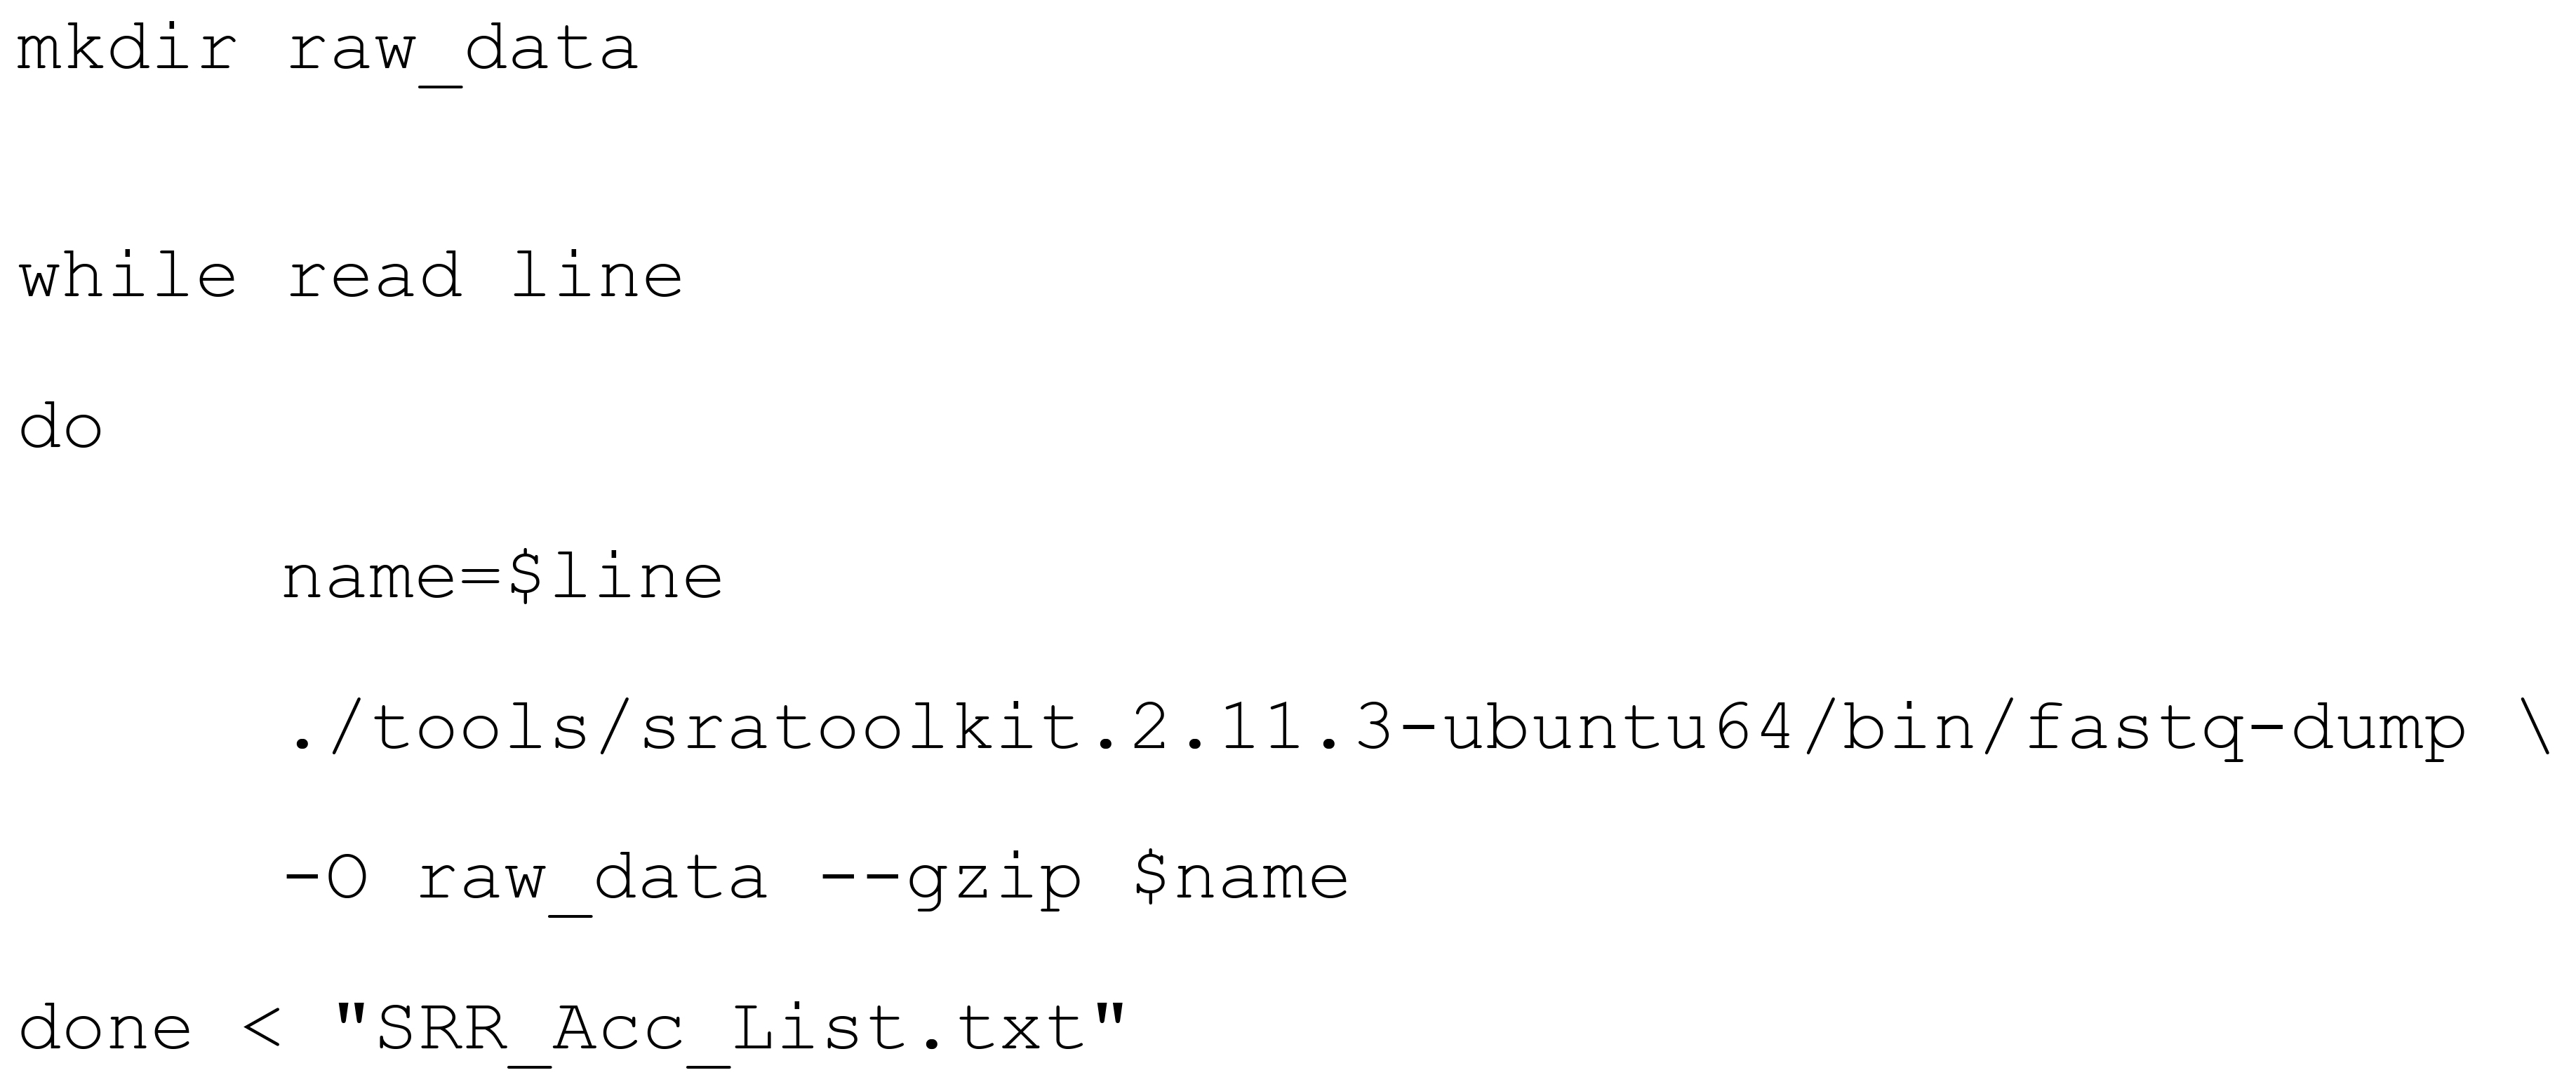
Store fastq files in a directory with the name “raw_data”.
If you would like to download the data presented in our original article (Haneke et al., 2020), use sratoolkit and the accession list that you can find on our OSF project page:
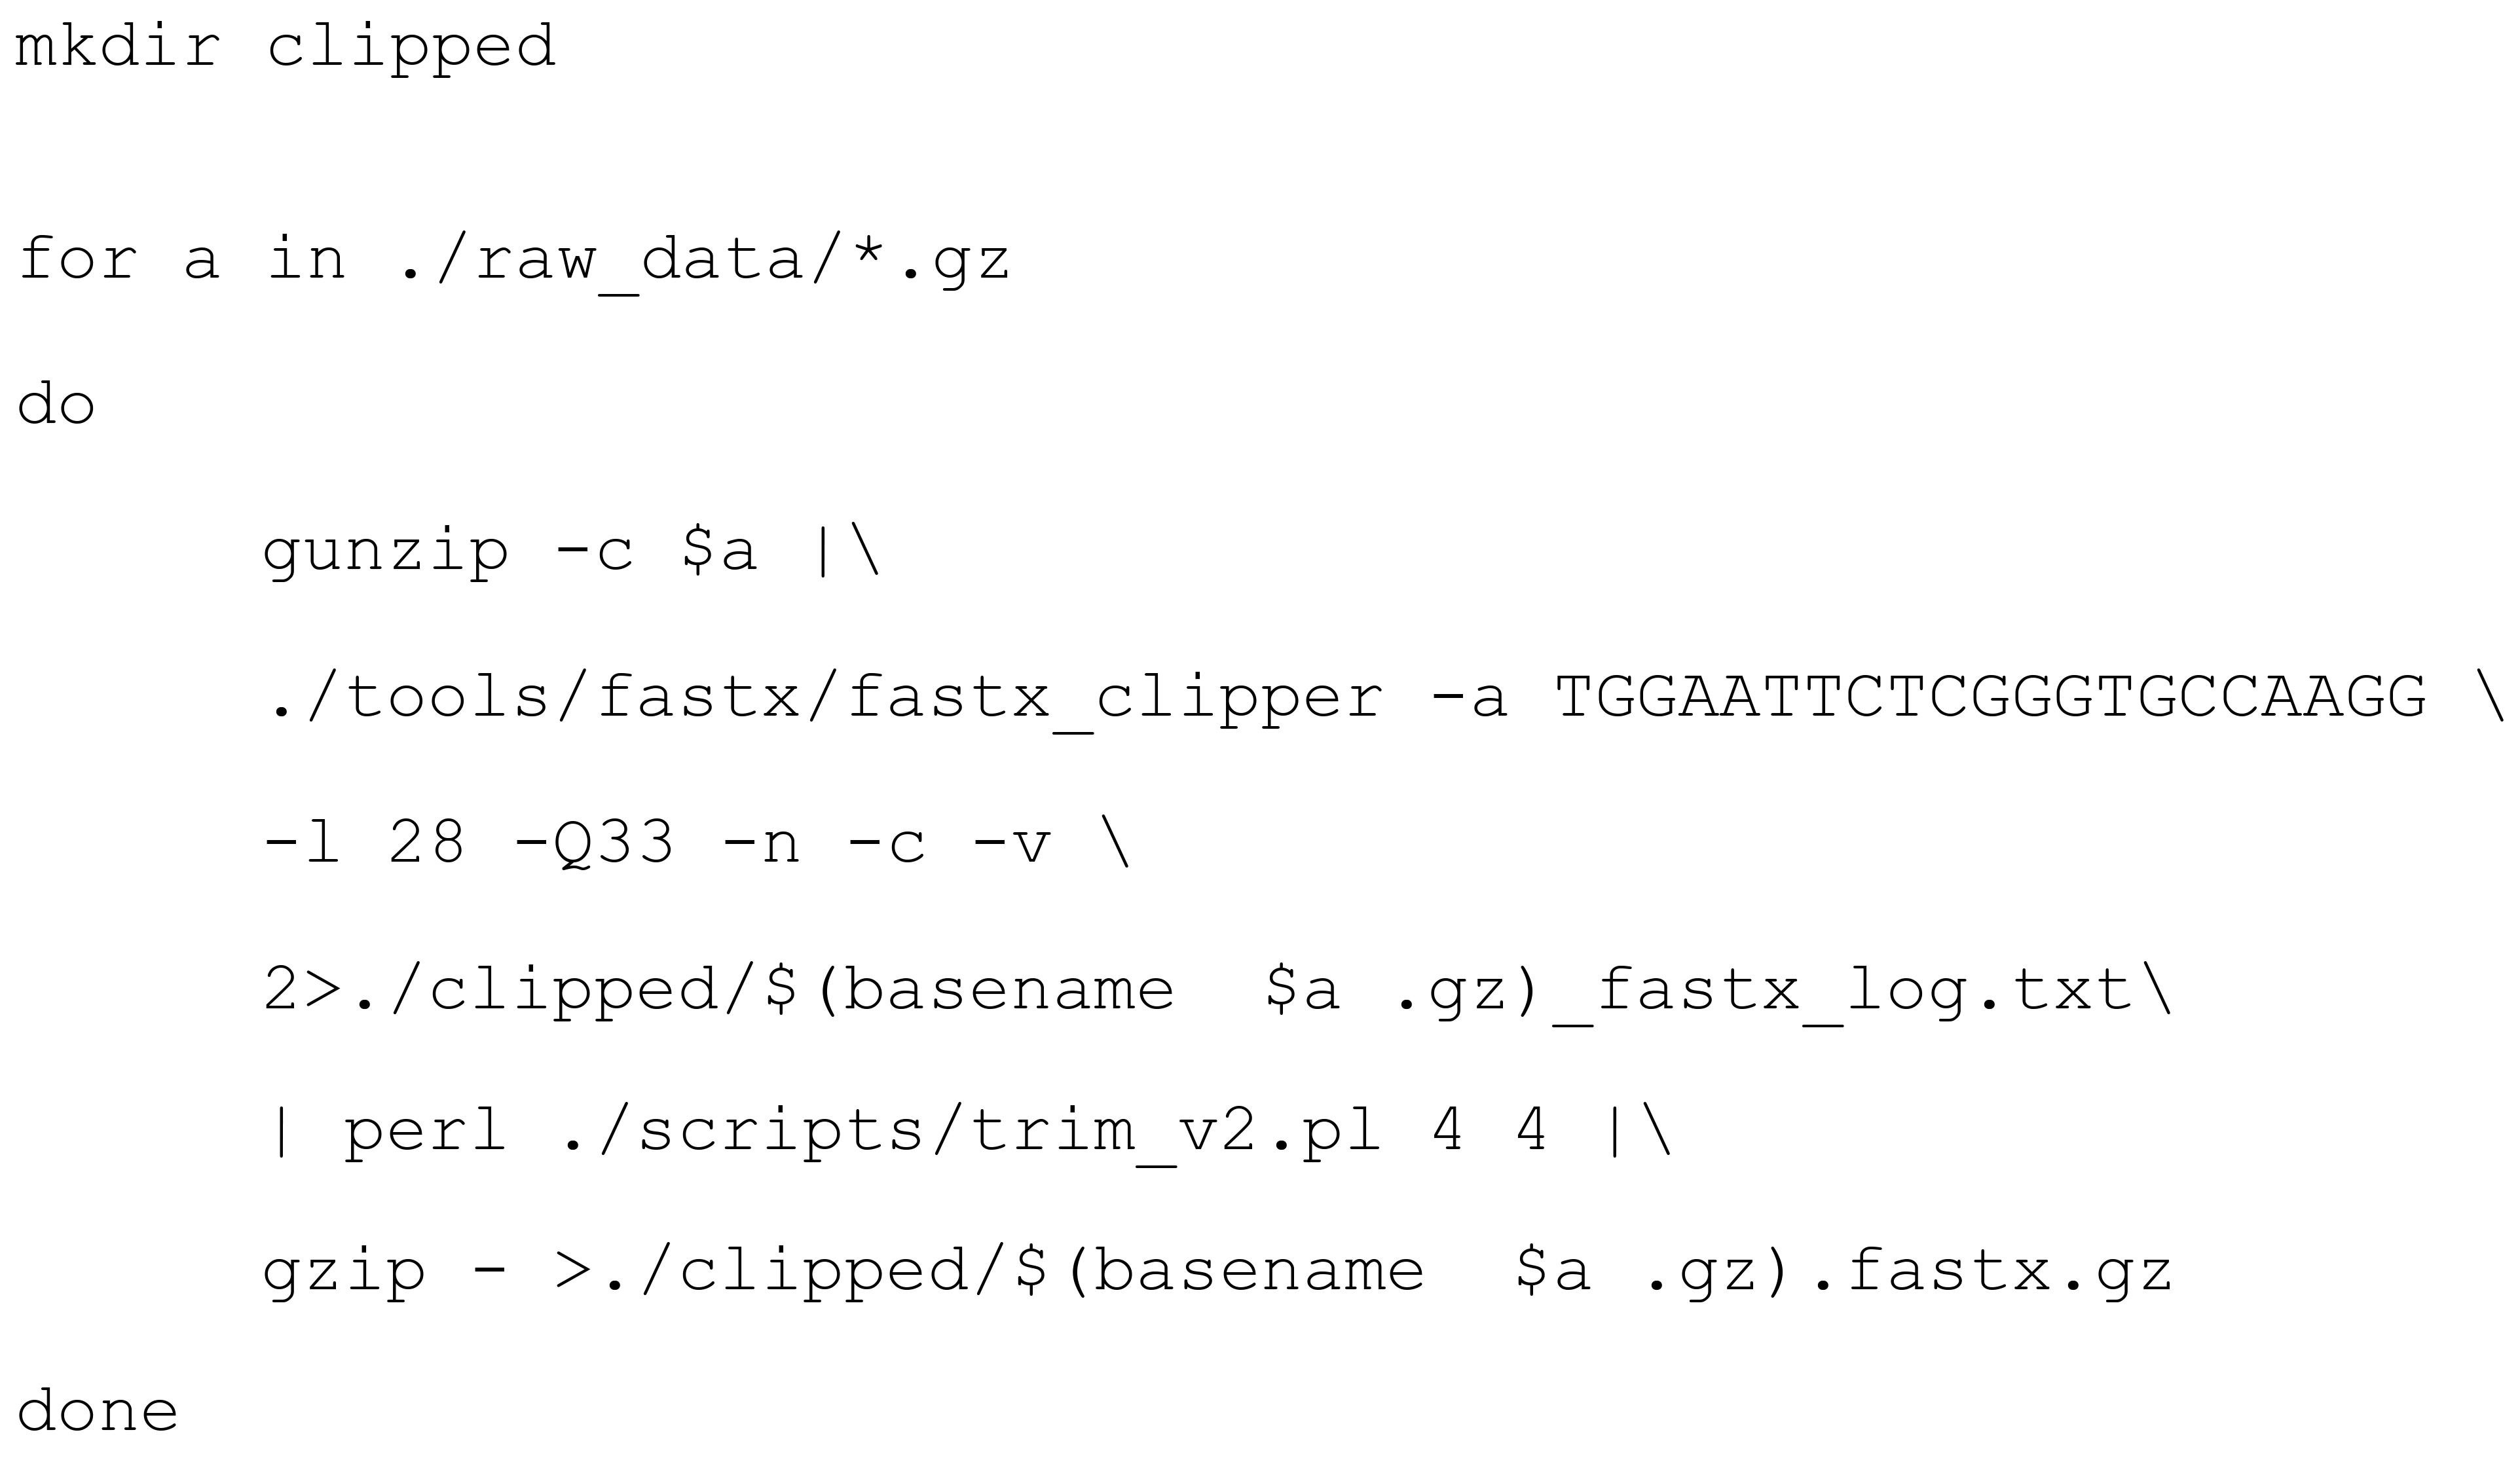
Remove the adapter with fastx and the first and last 4 nt (which are random sequences) with the perl script trim.pl. Only sequences that contain the adapter sequence and comprise at least 20 nt in the end will be retained.
Optional: Run FastQC on the clipped sequences to obtain information regarding the number, length, and quality of reads after adapter removal.

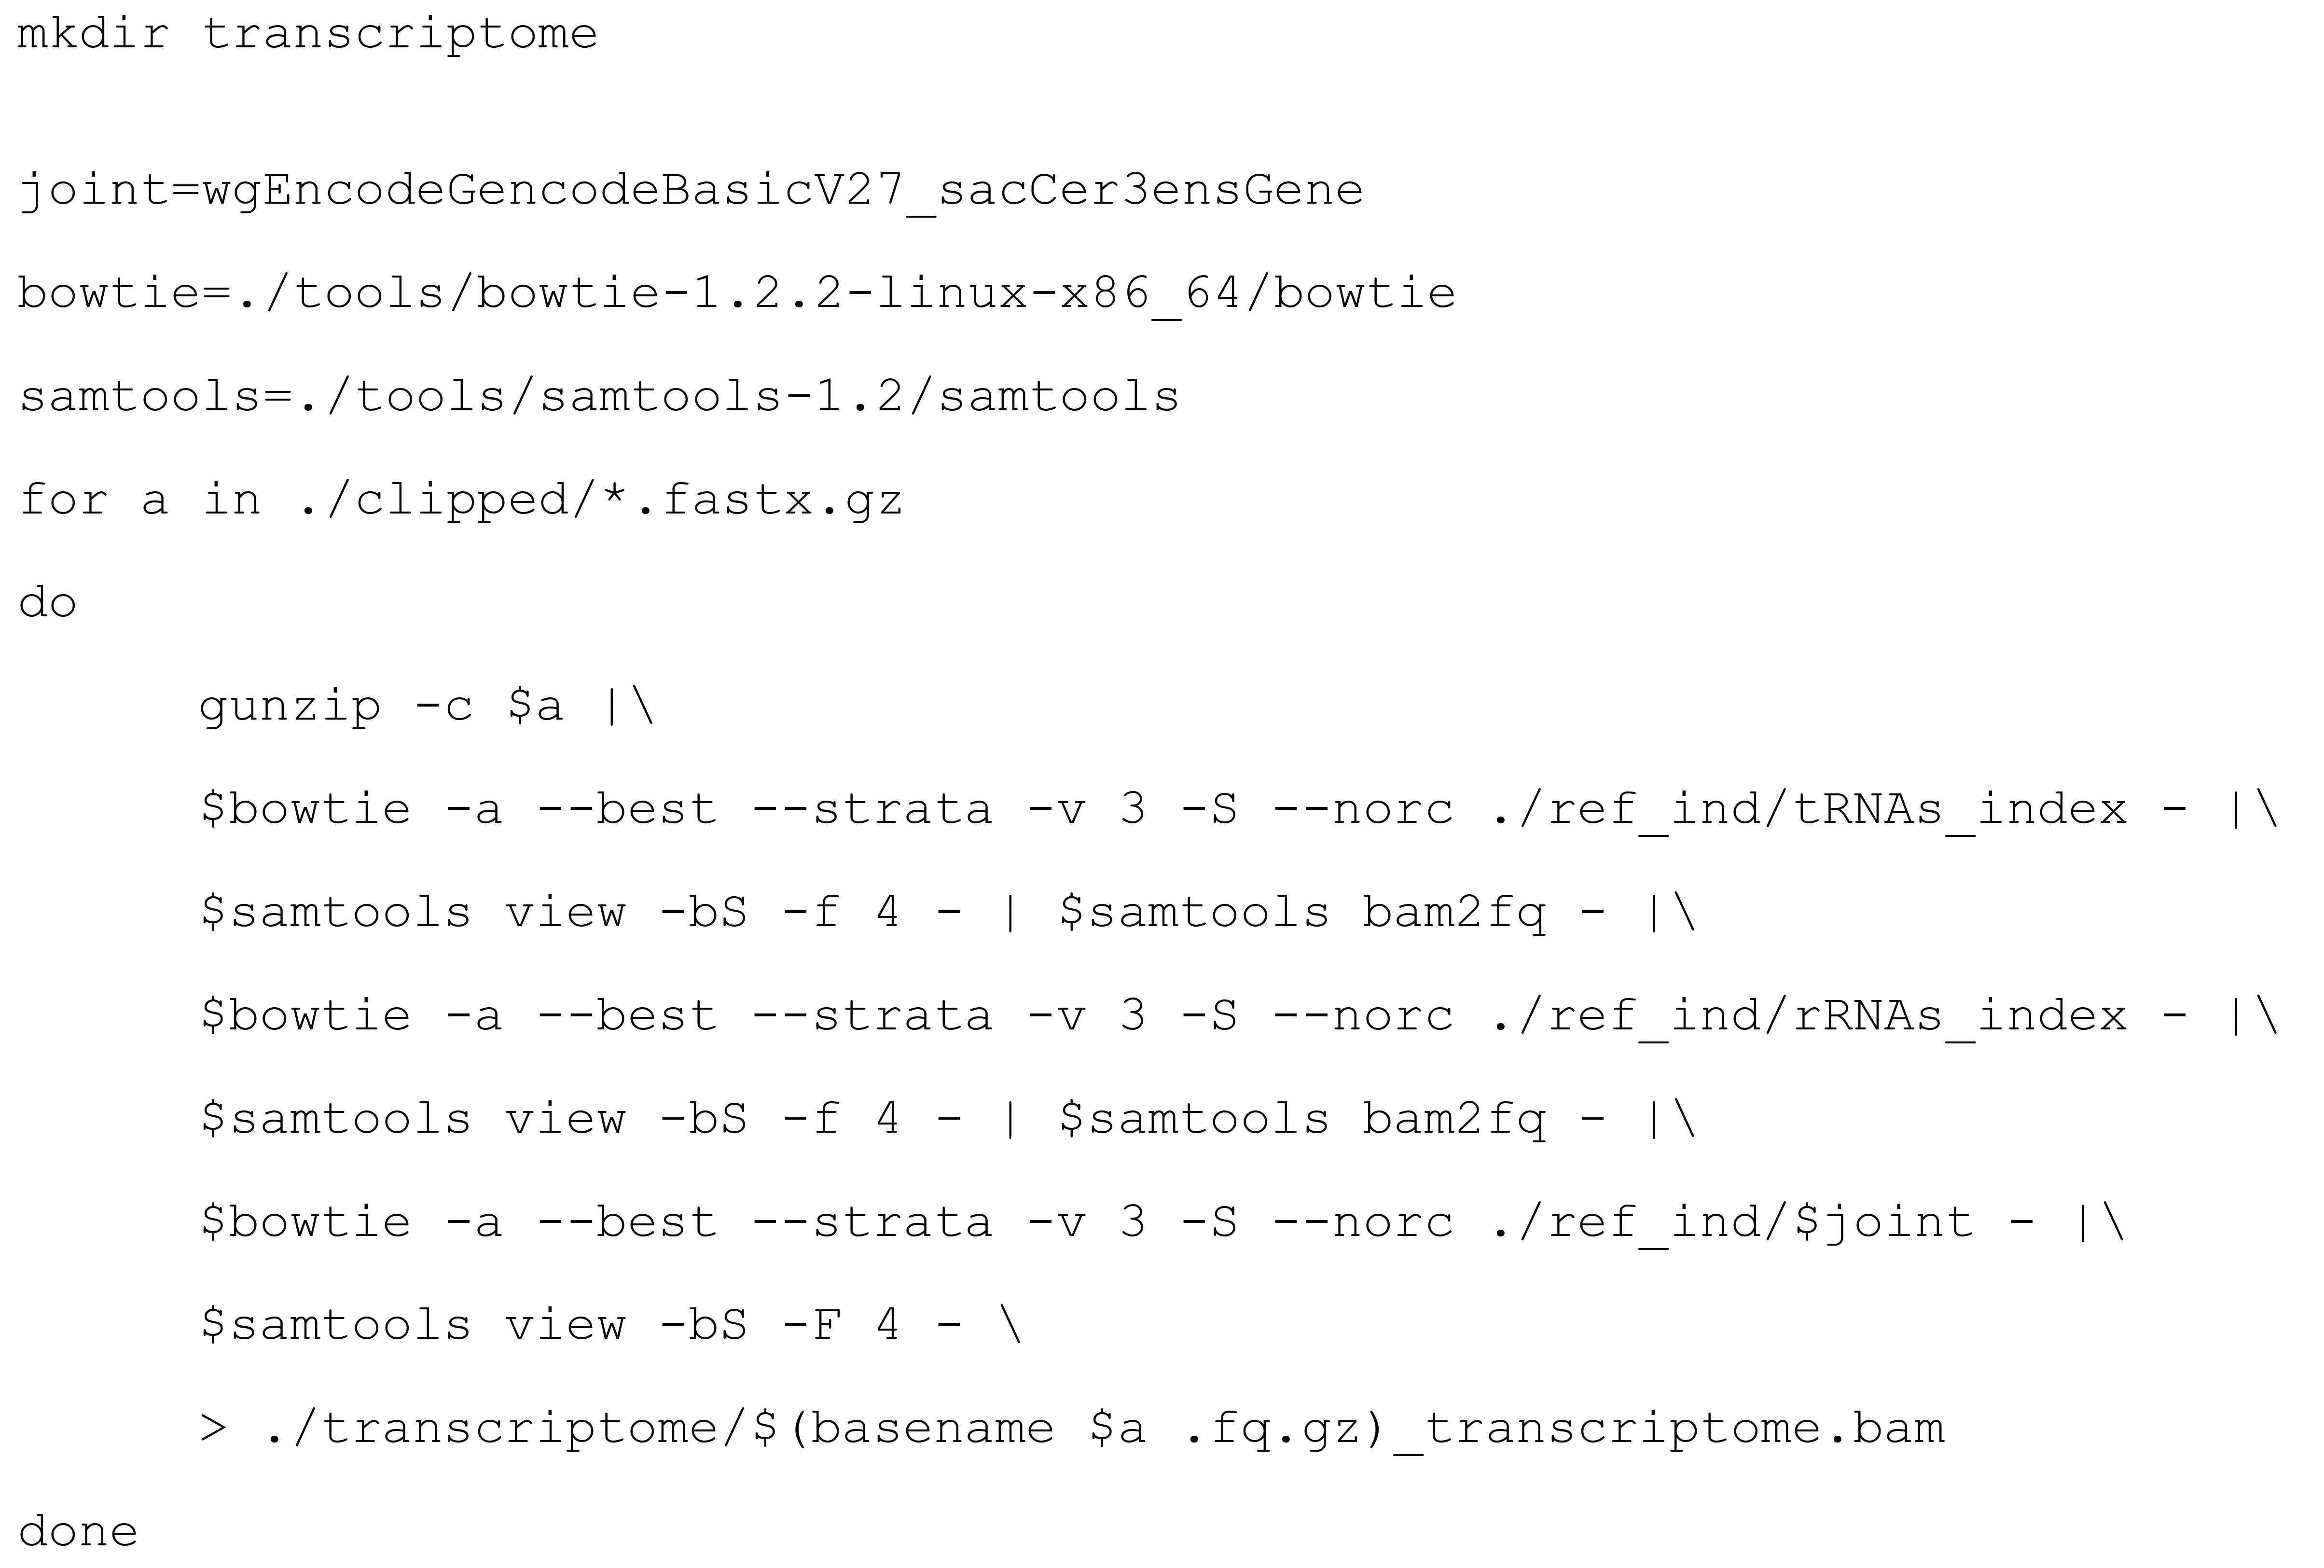
Align the clipped sequences consecutively to tRNA, rRNA, and the joint transcriptome of yeast and human. Only reads that do not align in one step will be passed on to the next step. The pre-fix of the transcriptomic index (joint) has to be adapted, if you work with your own sequences.
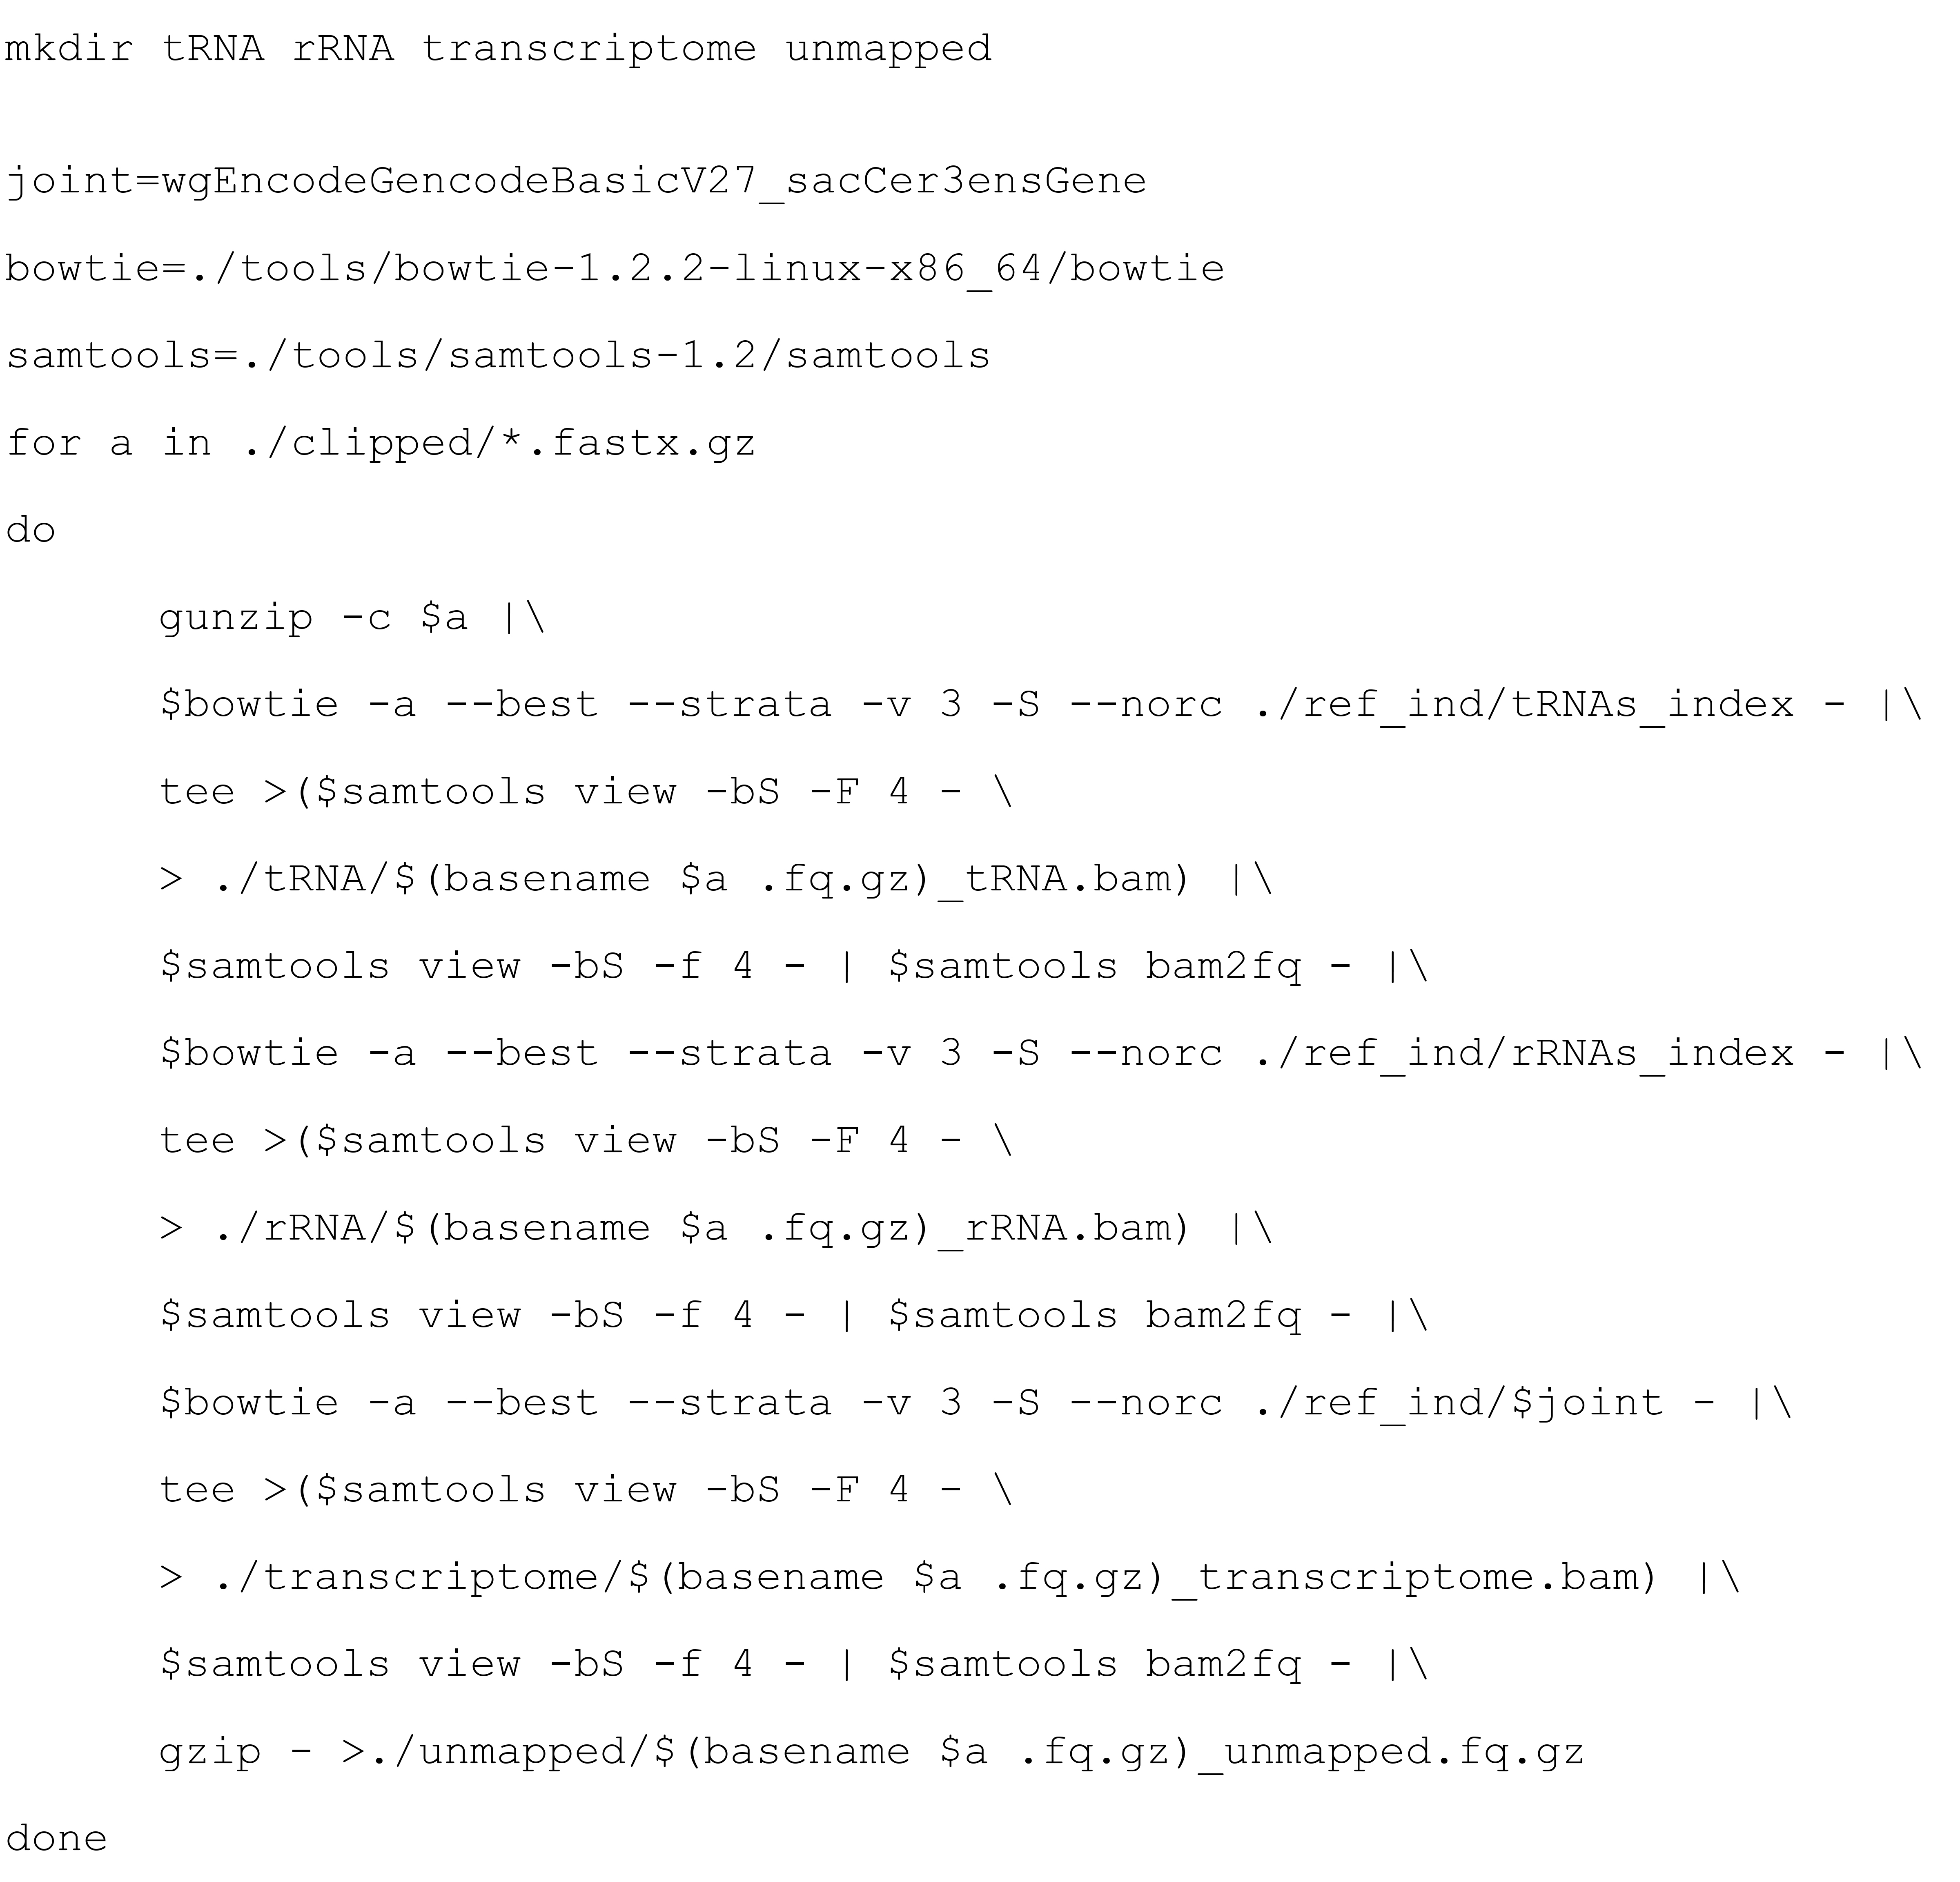
Alternatively, you can keep the sequences that mapped to tRNA or rRNA, and those that did not map at all. They might contain valuable information about possible unwanted contaminants.
Align the clipped sequences:
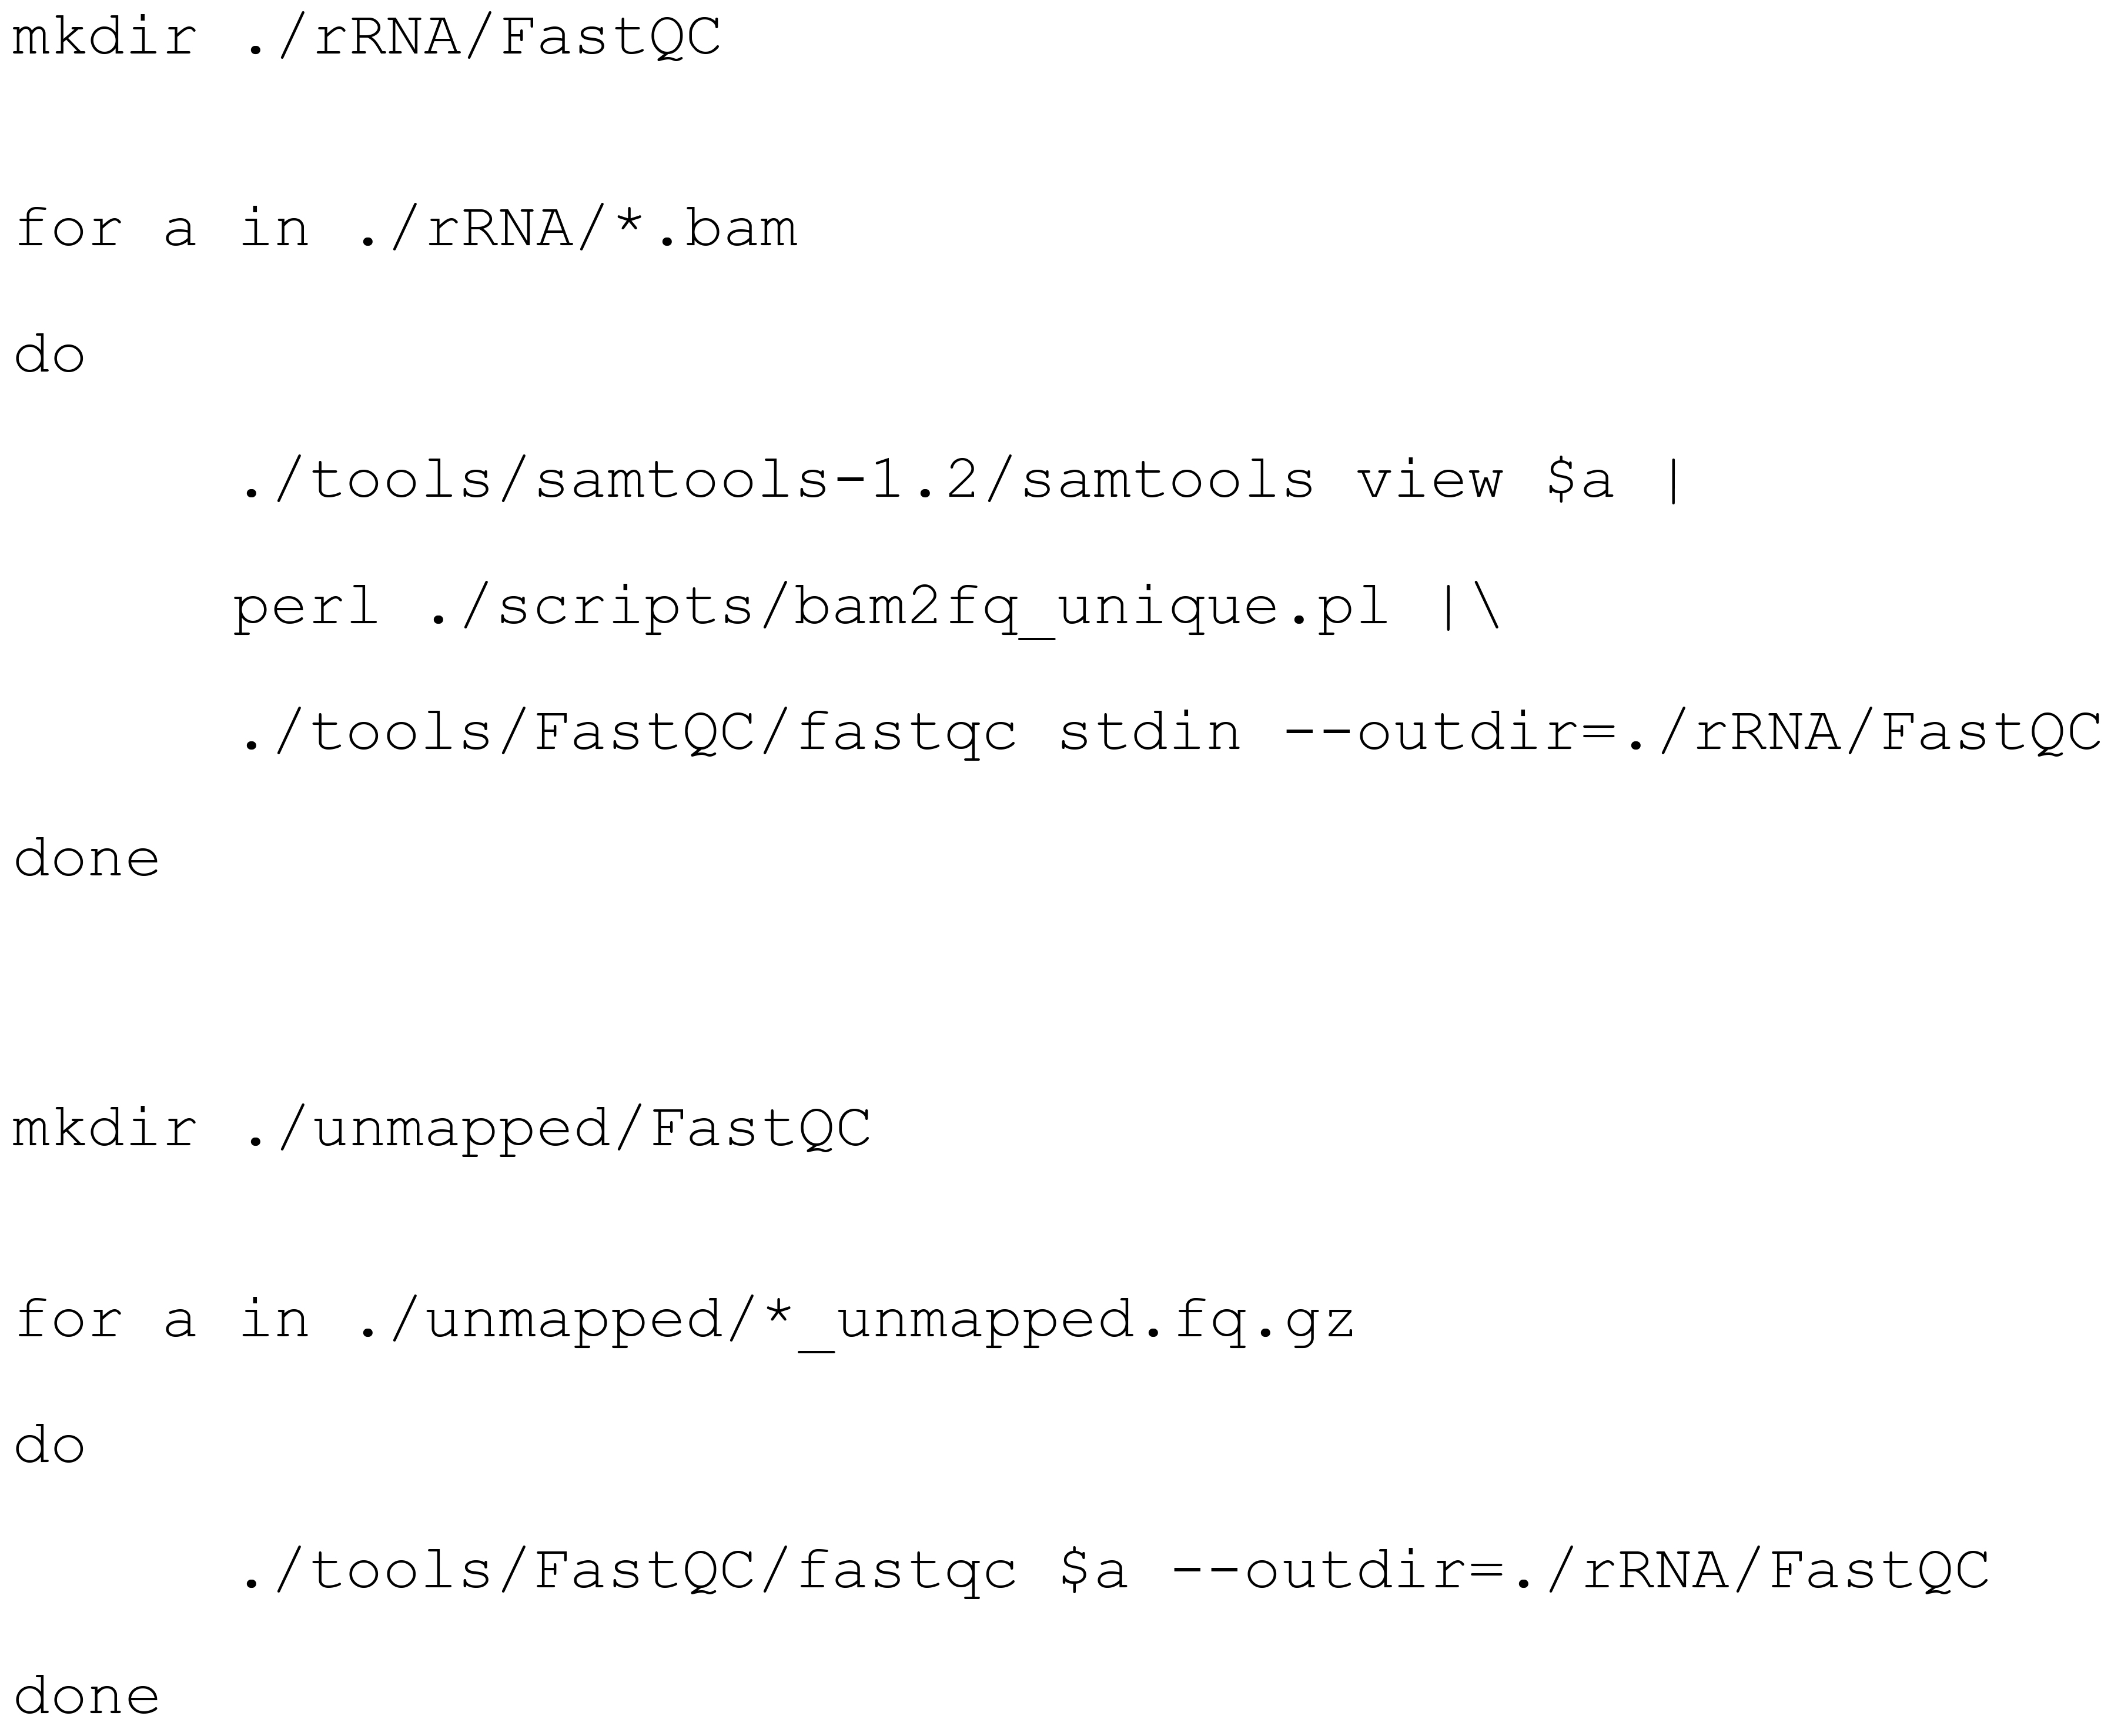
Now, you can inspect the number, size distribution, and sequences of reads in a set of bam files, for example of contaminating rRNA fragments, using FastQC and our in-house developed script bam2fq_unique.pl; this ensures that each read will be counted only once, even though it might be represented multiple times in the bam file:
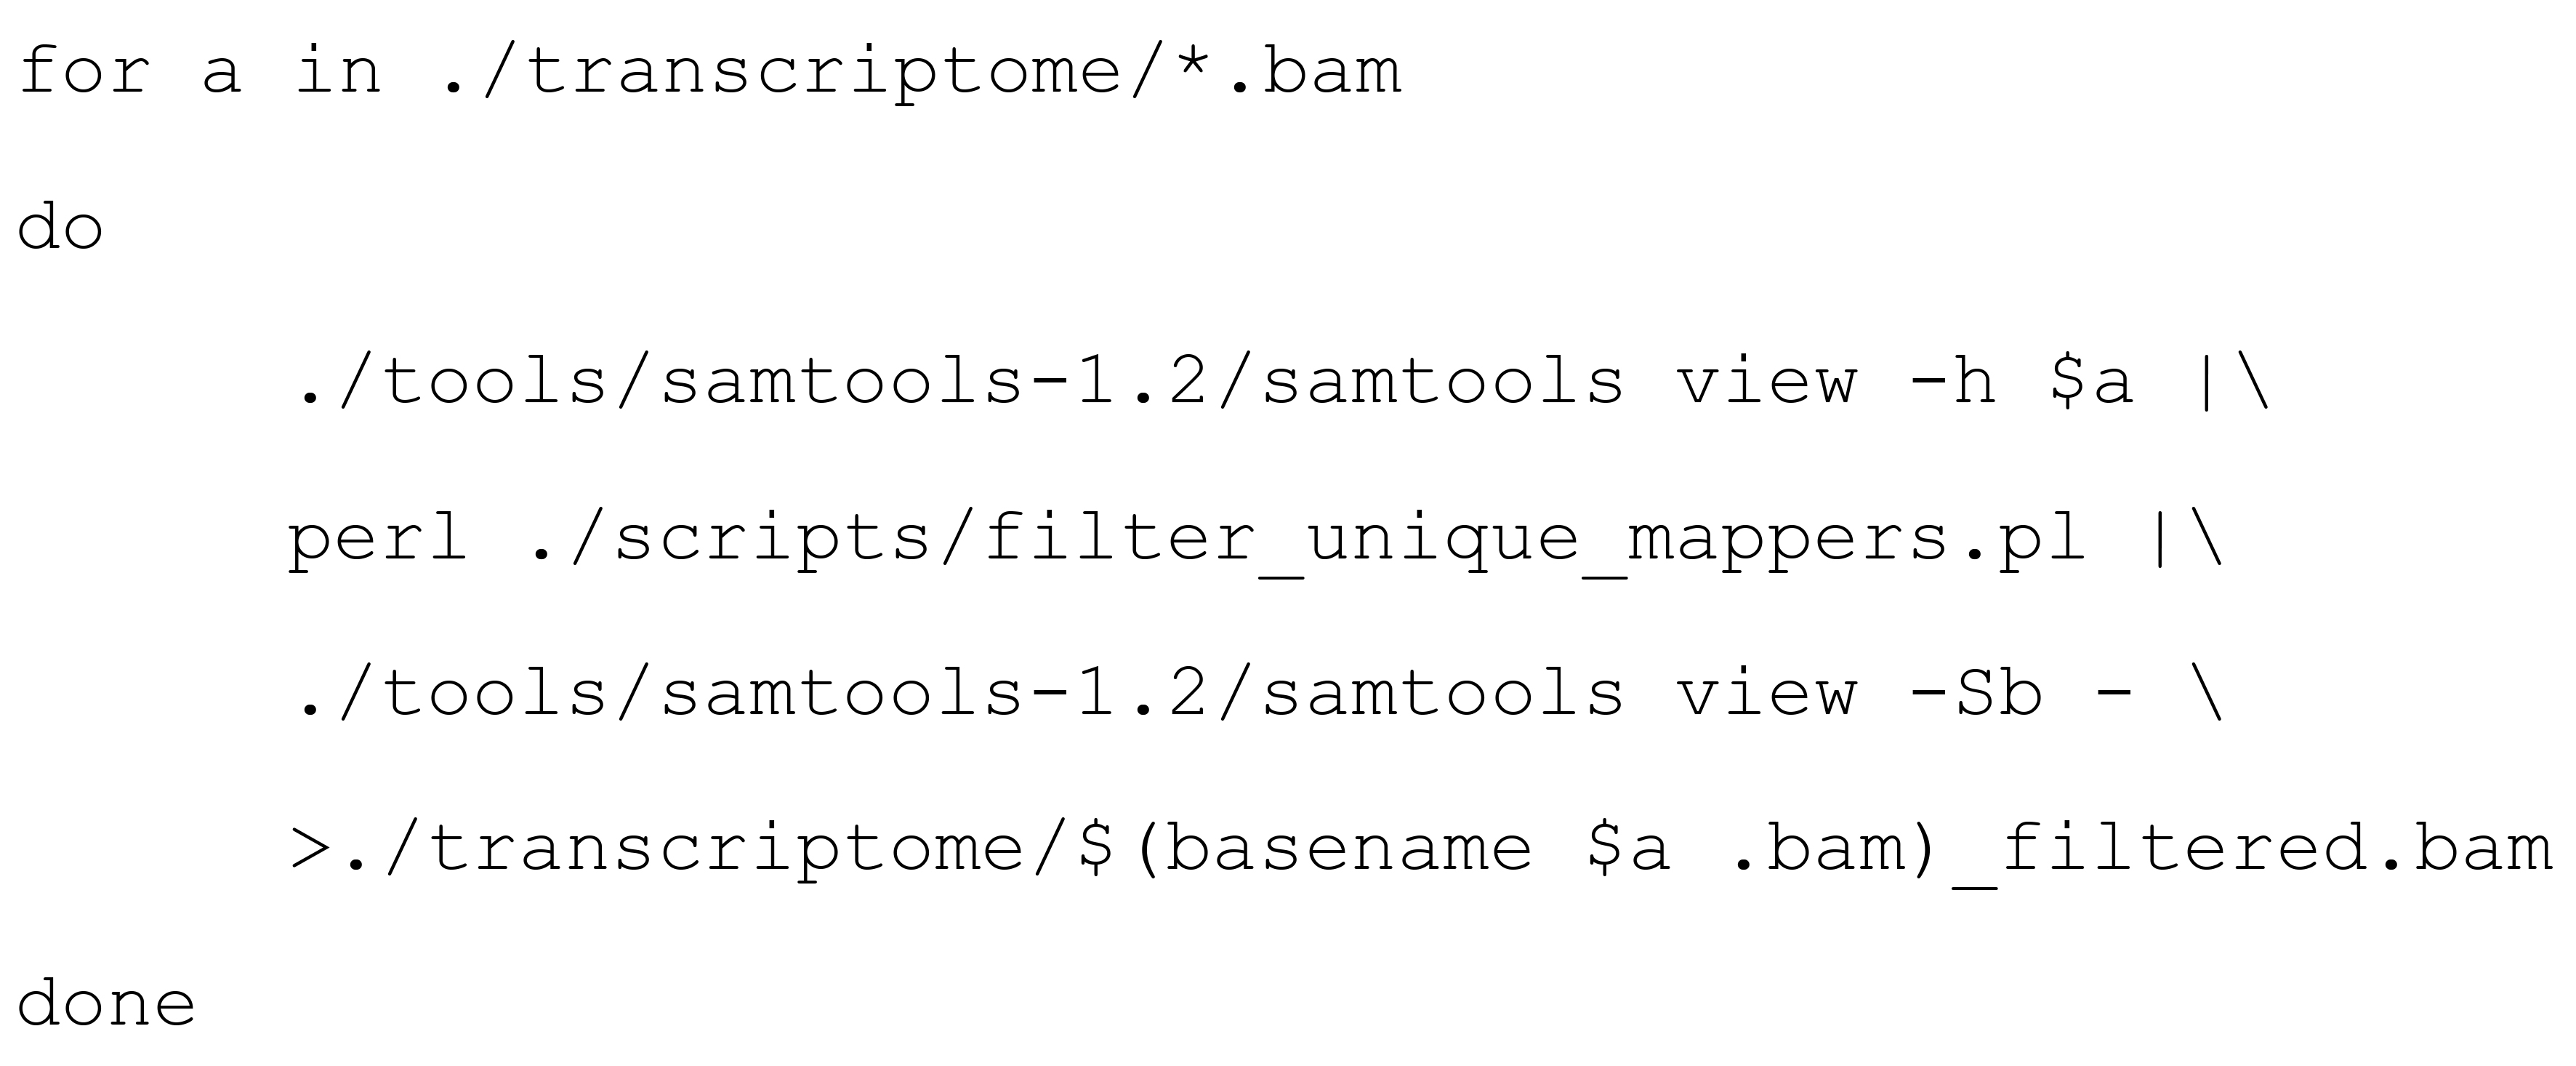
The transcriptomic bam files are filtered to remove all sequences that were aligned to isoforms of more than one gene (based on the common gene symbol). Therefore, also reads that align to both human and yeast sequences will be removed. Per read, only one alignment will be retained.
Prepare a csv file named start_stop.csv, with 1-based coordinates of the start and stop codon. The first column contains the transcript ID of the ORF, e.g., ENST00000371007.6 for ENST00000371007.6_C1orf141, the second column the position of the first nucleotide of the start codon on the transcript, and the third column the position of the first nucleotide of the stop codon. We provide this file for our reference transcriptome in the directory ref_fasta on our OSF project page. If you would like to produce this file yourself, you can follow the instructions given in the script start_stop.R on our OSF project page.
Optional: Periodicity and distribution of reads around the start and stop codon can be visualized separately for different read lengths as quality control and to determine the P-site offset at the start codon (see Note 13).
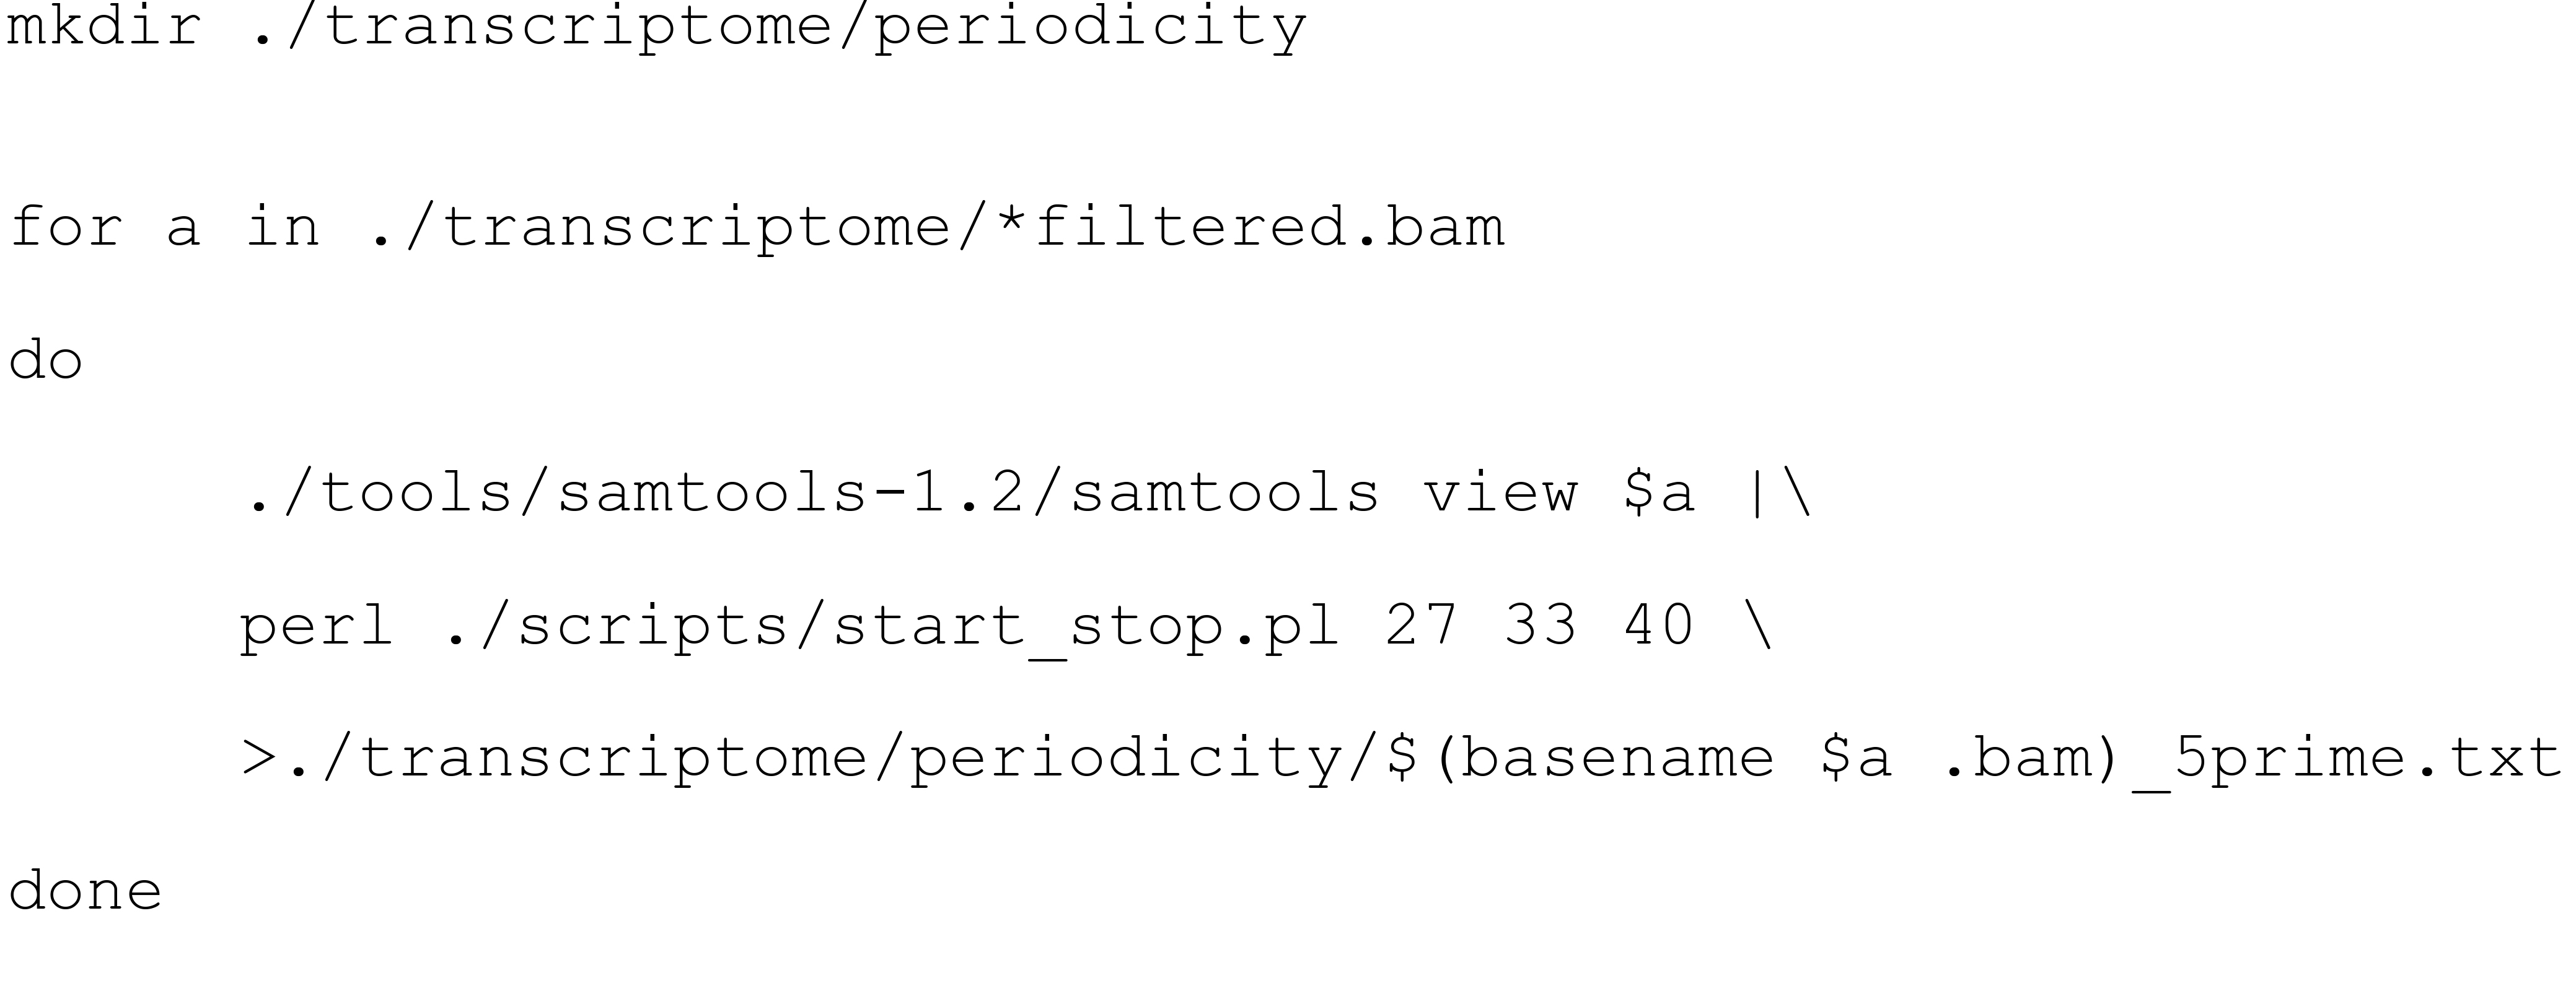
Produce files containing the number of reads with a specific distance between their 5’ ends and the start or stop codon. We usually inspect reads of 27–33 nt length and only consider mRNAs with UTRs of at least 40 nt.
Produce PDFs visualizing the read distribution, as shown in Figure 3 for 29-31 nt long reads as an example:
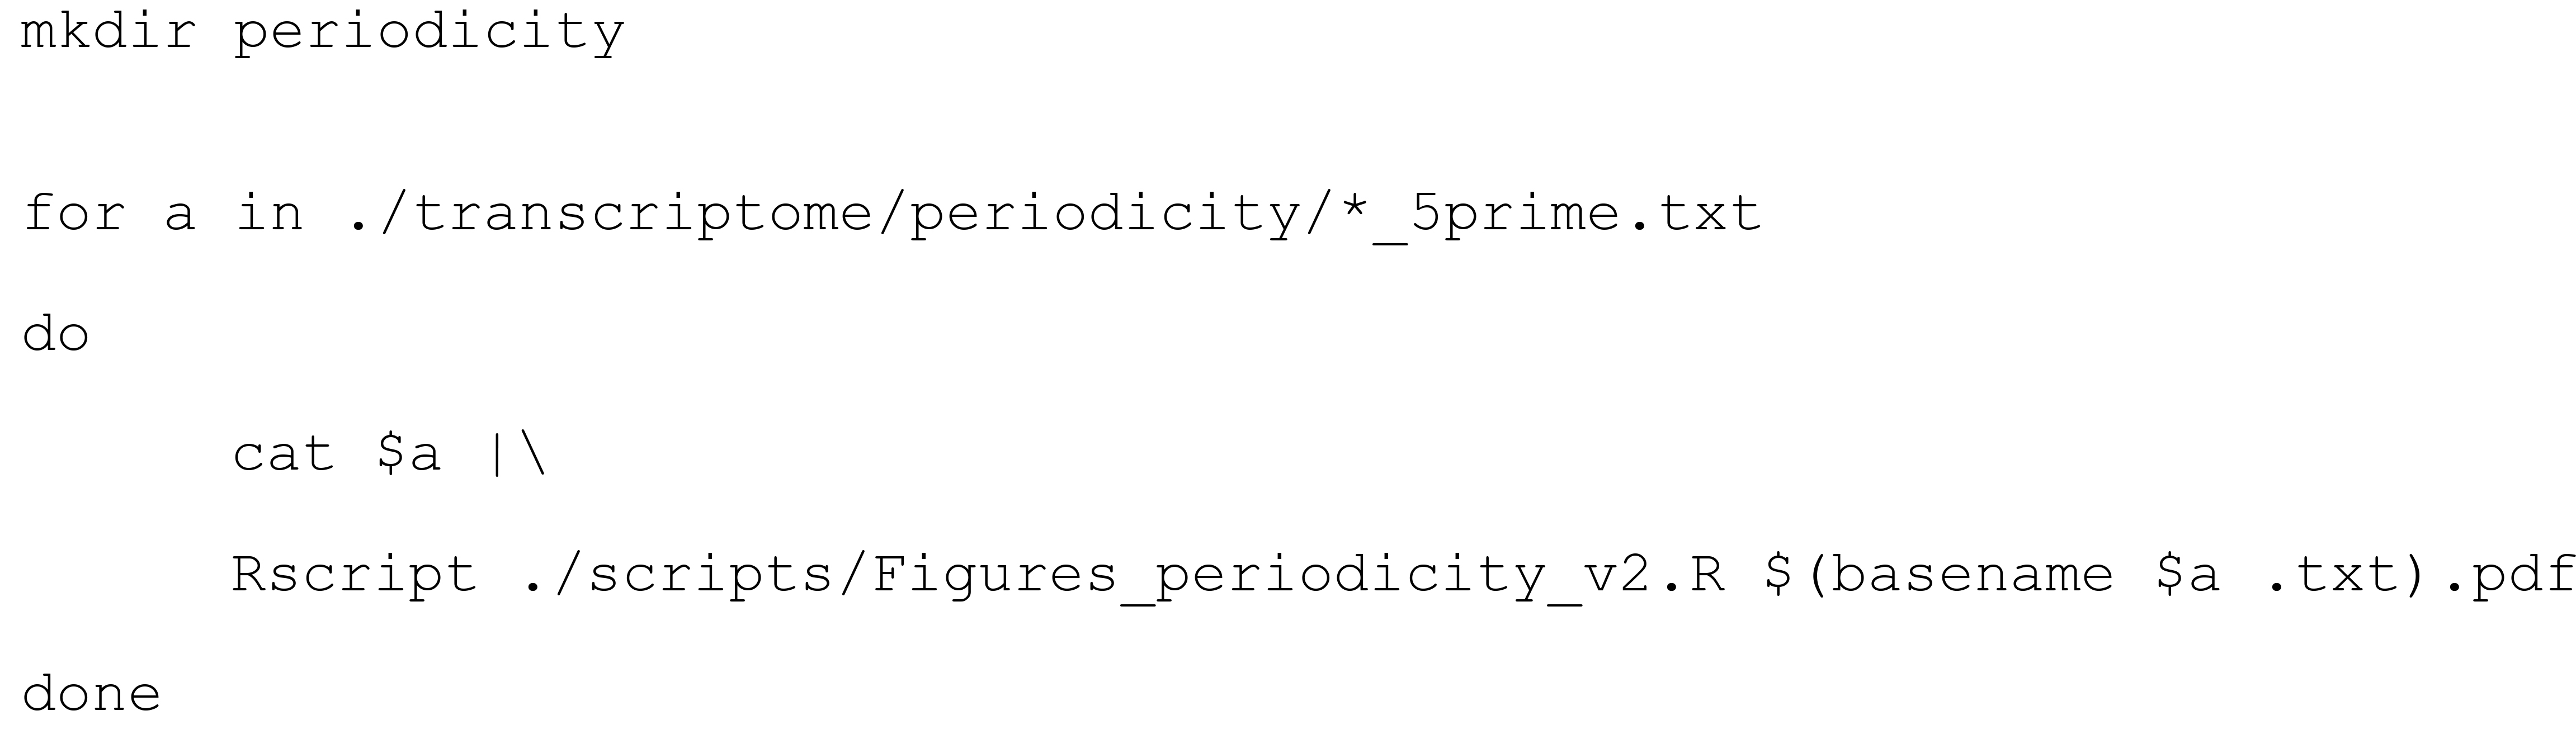
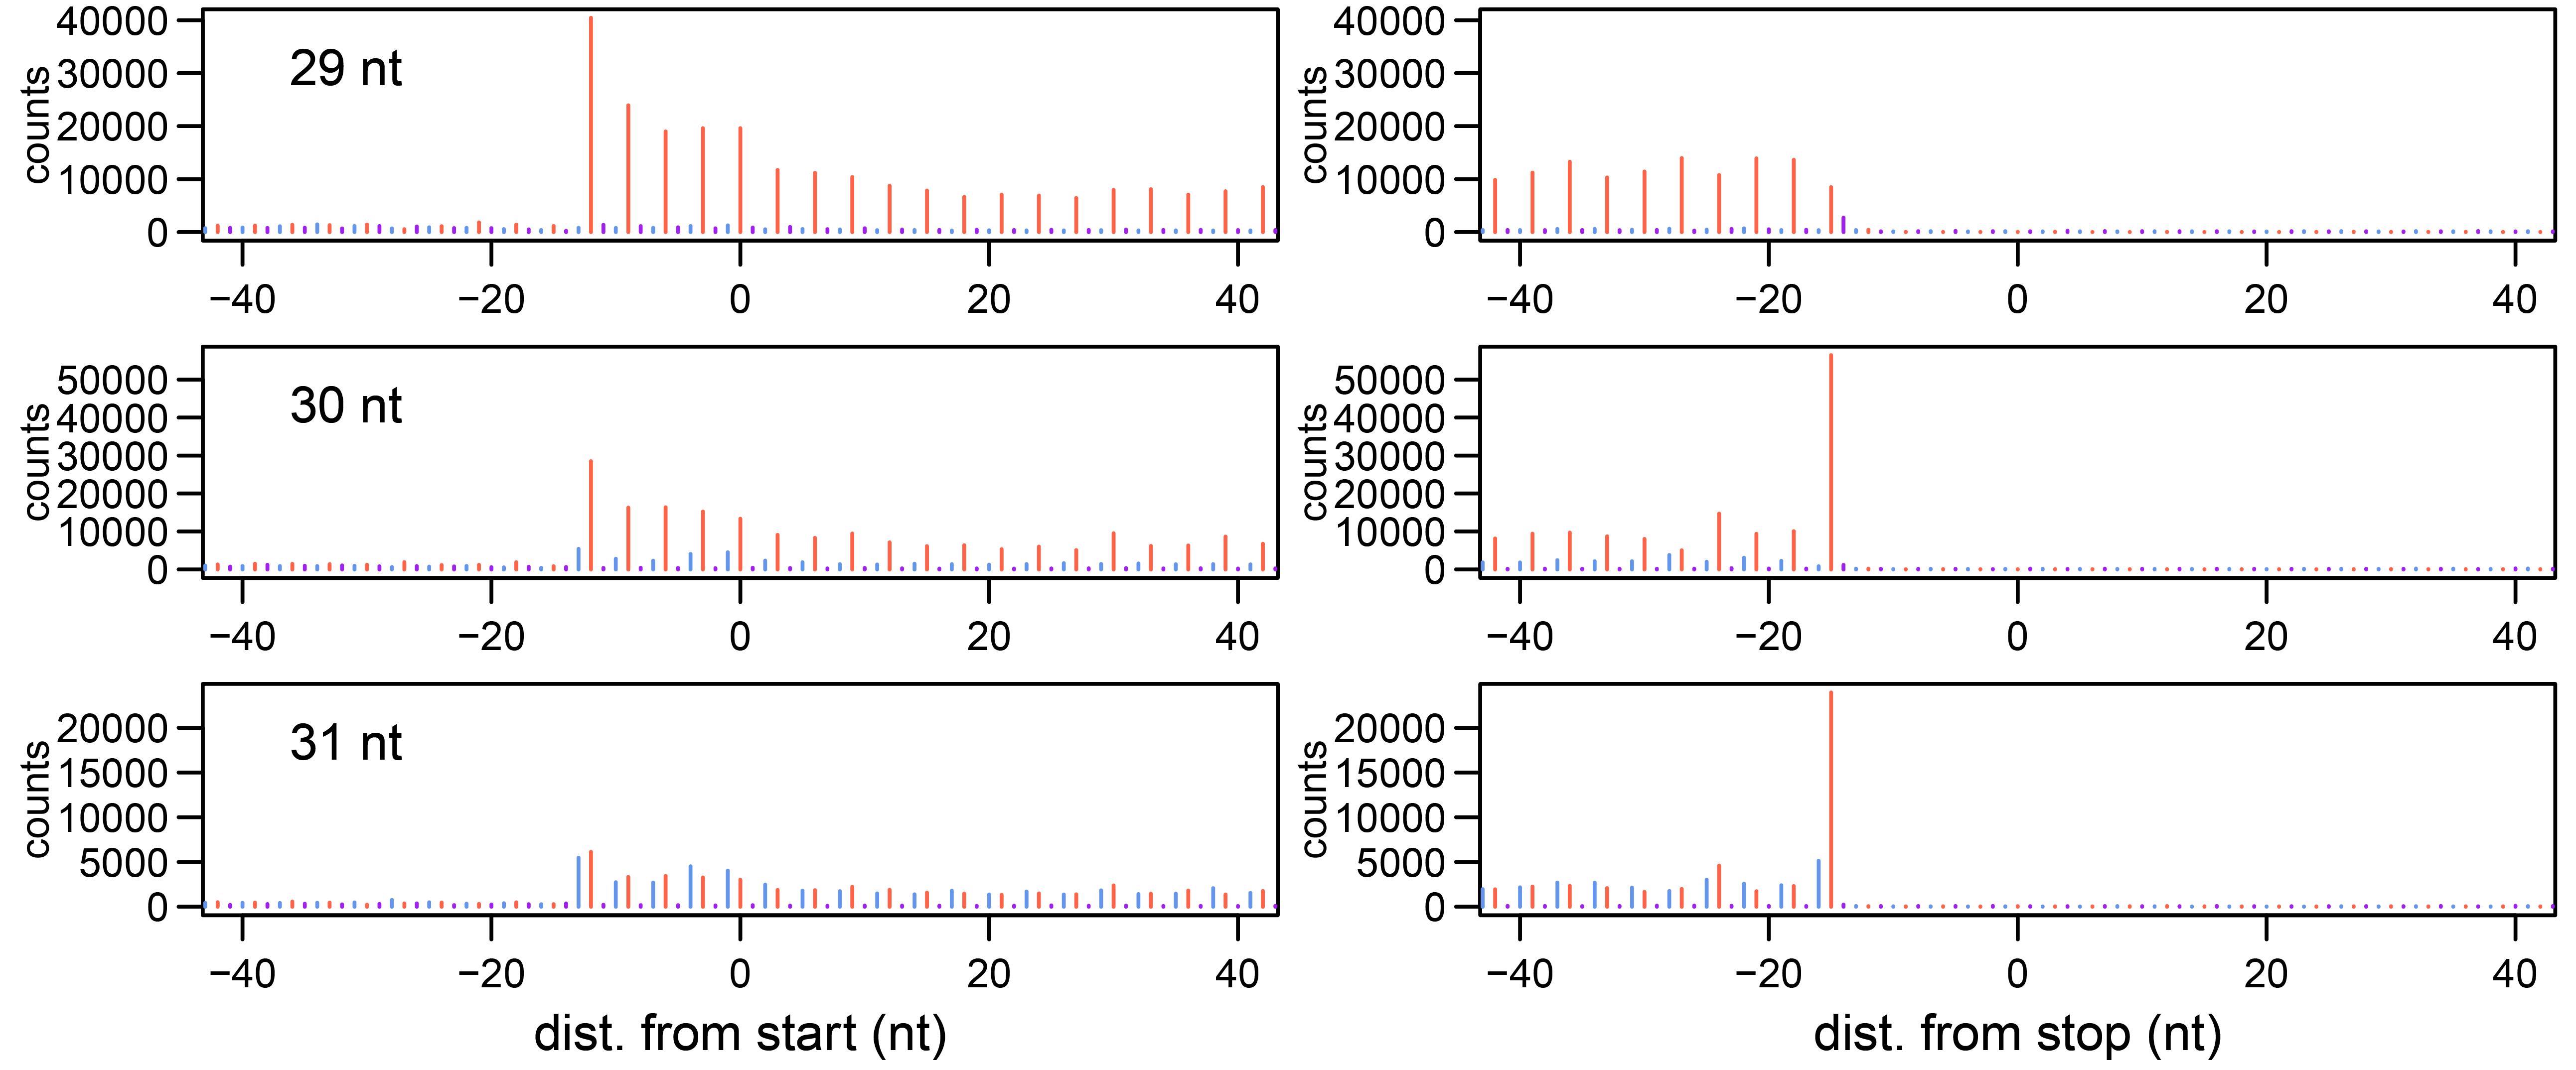
Figure 3. Periodicity and read distribution around the start and stop codon. The distance between the 5’ end of reads and the start or stop codon is determined separately for different read lengths. The three frames are indicated in different colors (1: red, 2: purple, 3: blue).
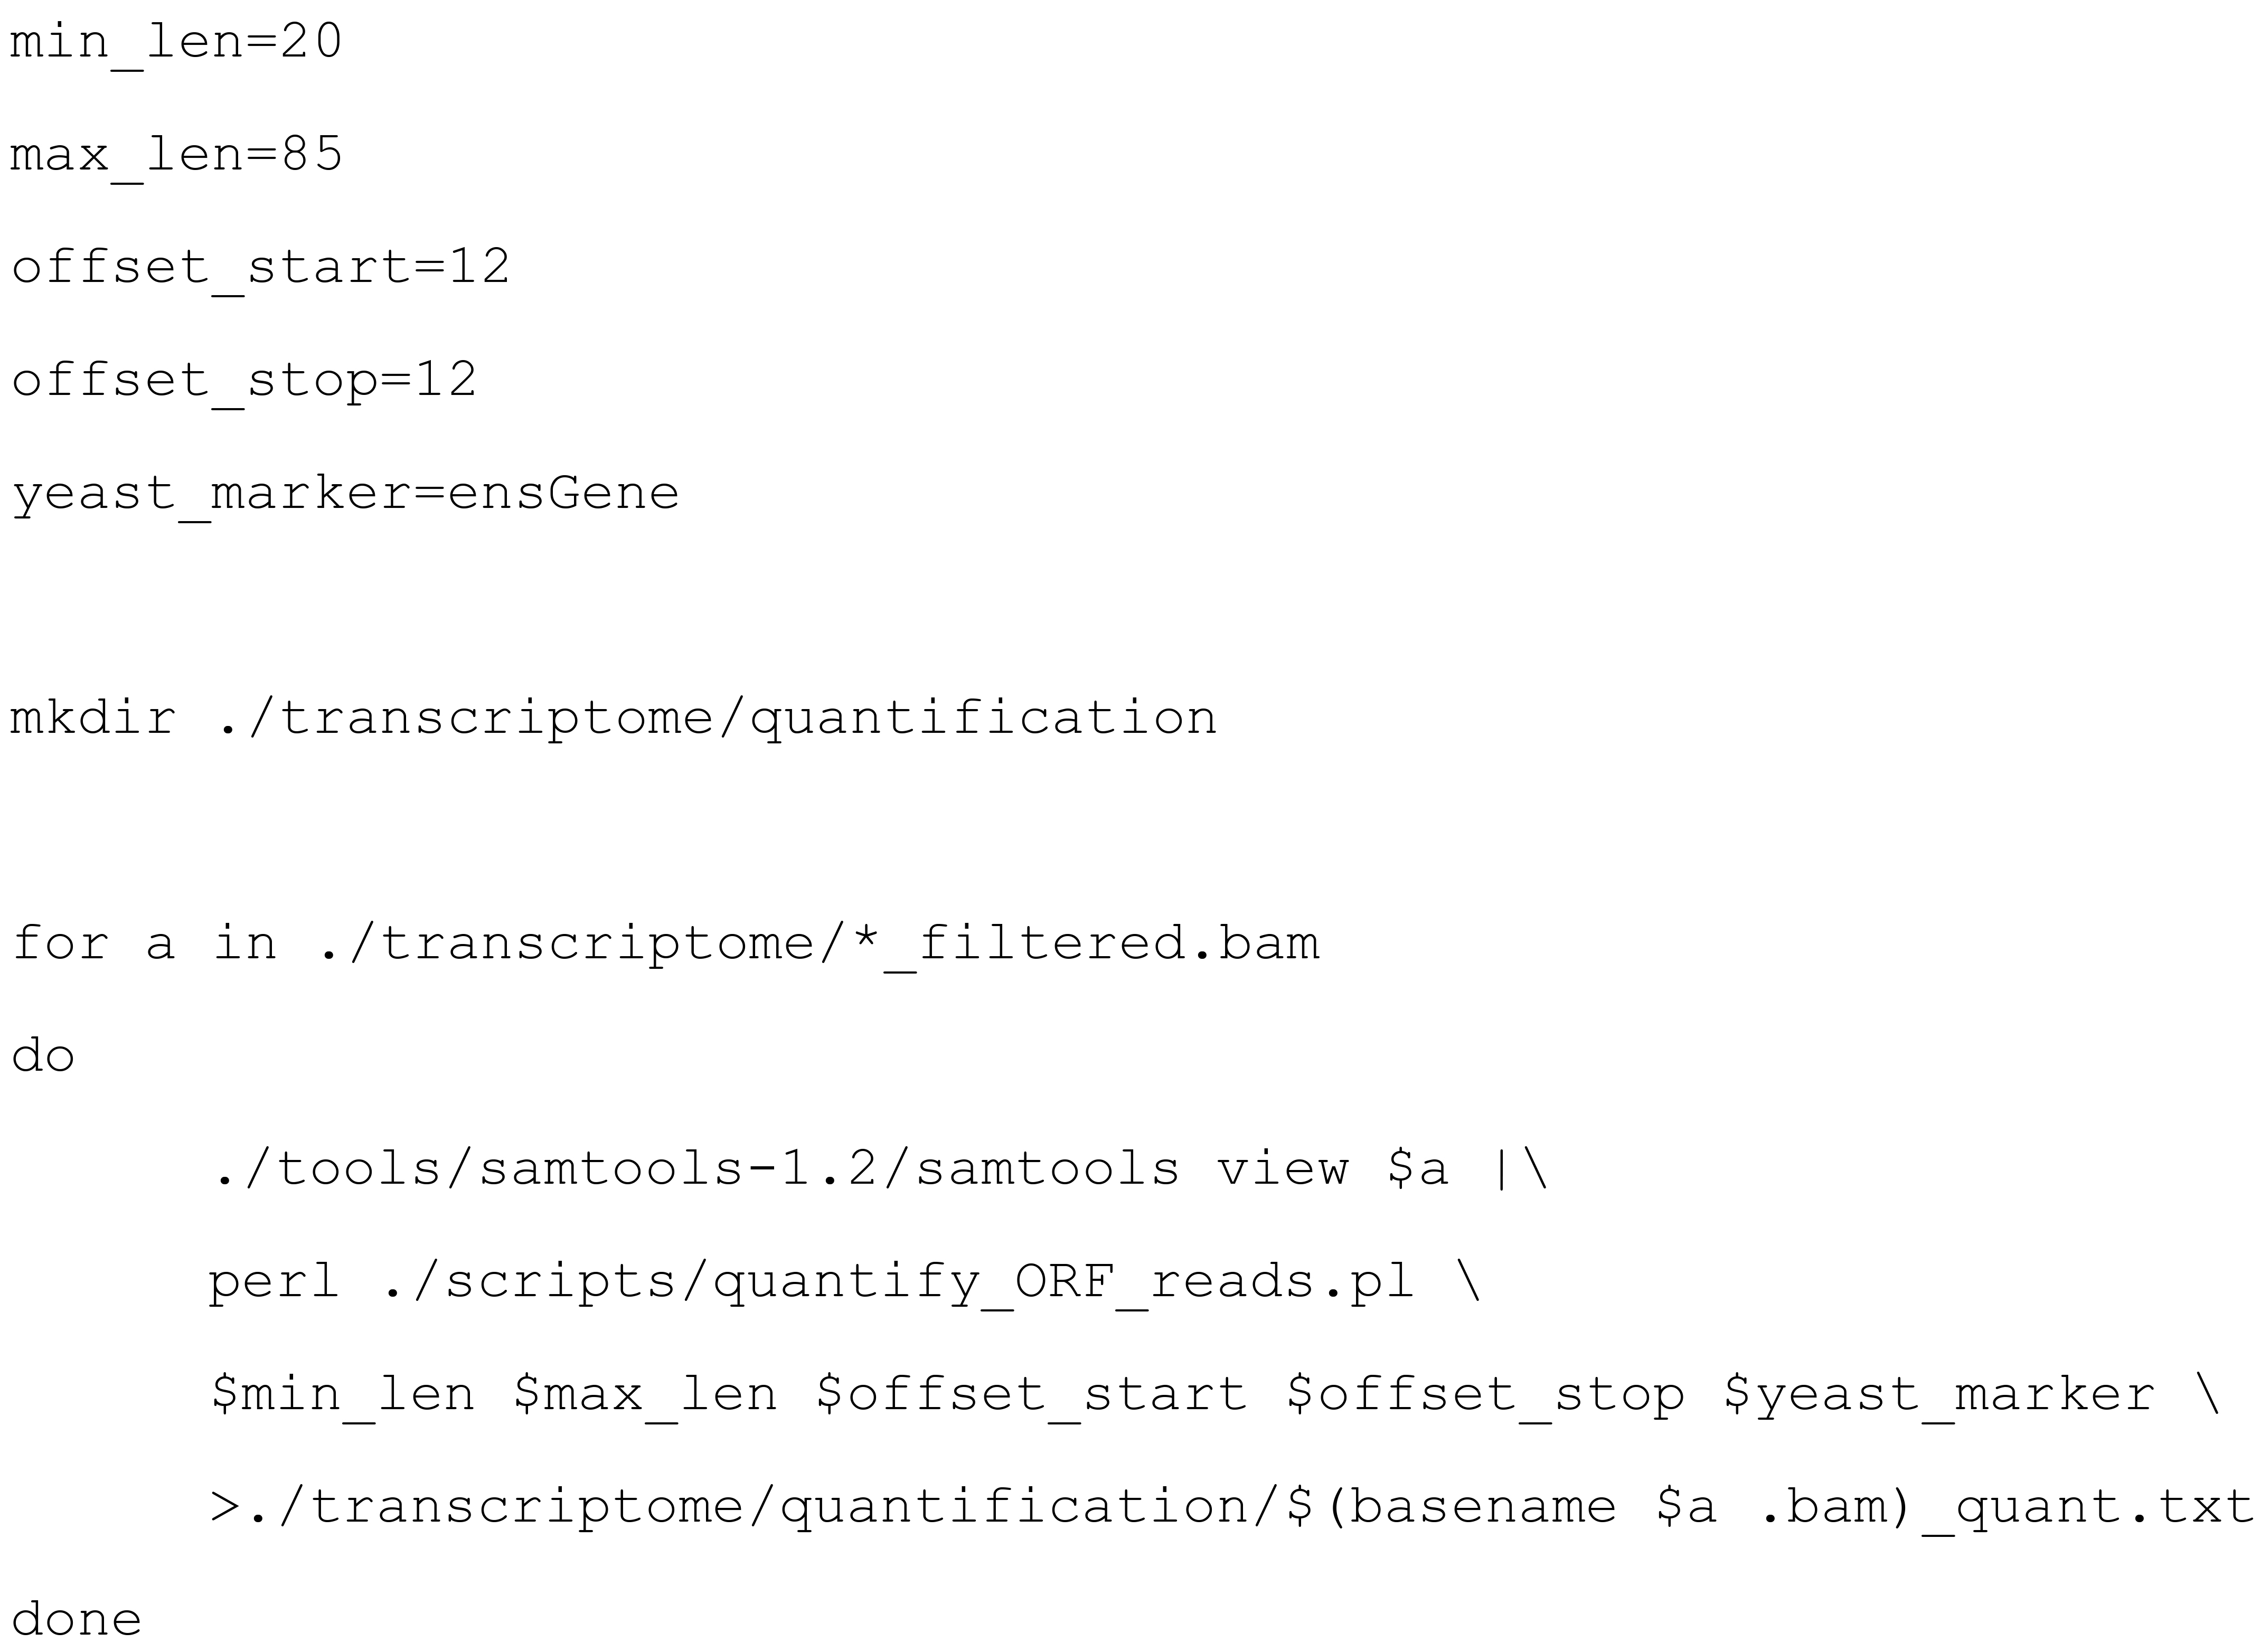
Reads are summarized at the gene level. For human mRNAs, only reads aligning to annotated ORFs are taken into account. Therefore, the file start_stop.csv is required (see section J in Data analysis). We did not exclude reads based on their size, but rather considered all reads between 20 nt (min_len) and 85 nt (max_len). At the start and the stop codon, we assumed a P-site offset of 12 nt (offset_start and offset_stop, see Note 13). In addition, a character string identifying yeast transcripts is required (yeast_marker).
For the data in our original article, mean RD per condition and gene can be determined with the R script analyze_RD.R. Human read counts are divided sample-wise by the sum of yeast read counts aligning to protein coding genes, to take global changes in RD into account. Protein-coding yeast genes are defined by the table “sacCer3_ensemblSource”, as downloaded from the UCSC Genome Browser. In addition, this script contains the statistical analysis to identify mRNAs with significant changes in RD irrespective of global effects, using the LRT test of the DESeq2 package (Figure 4). The results are exported as the file results.csv.
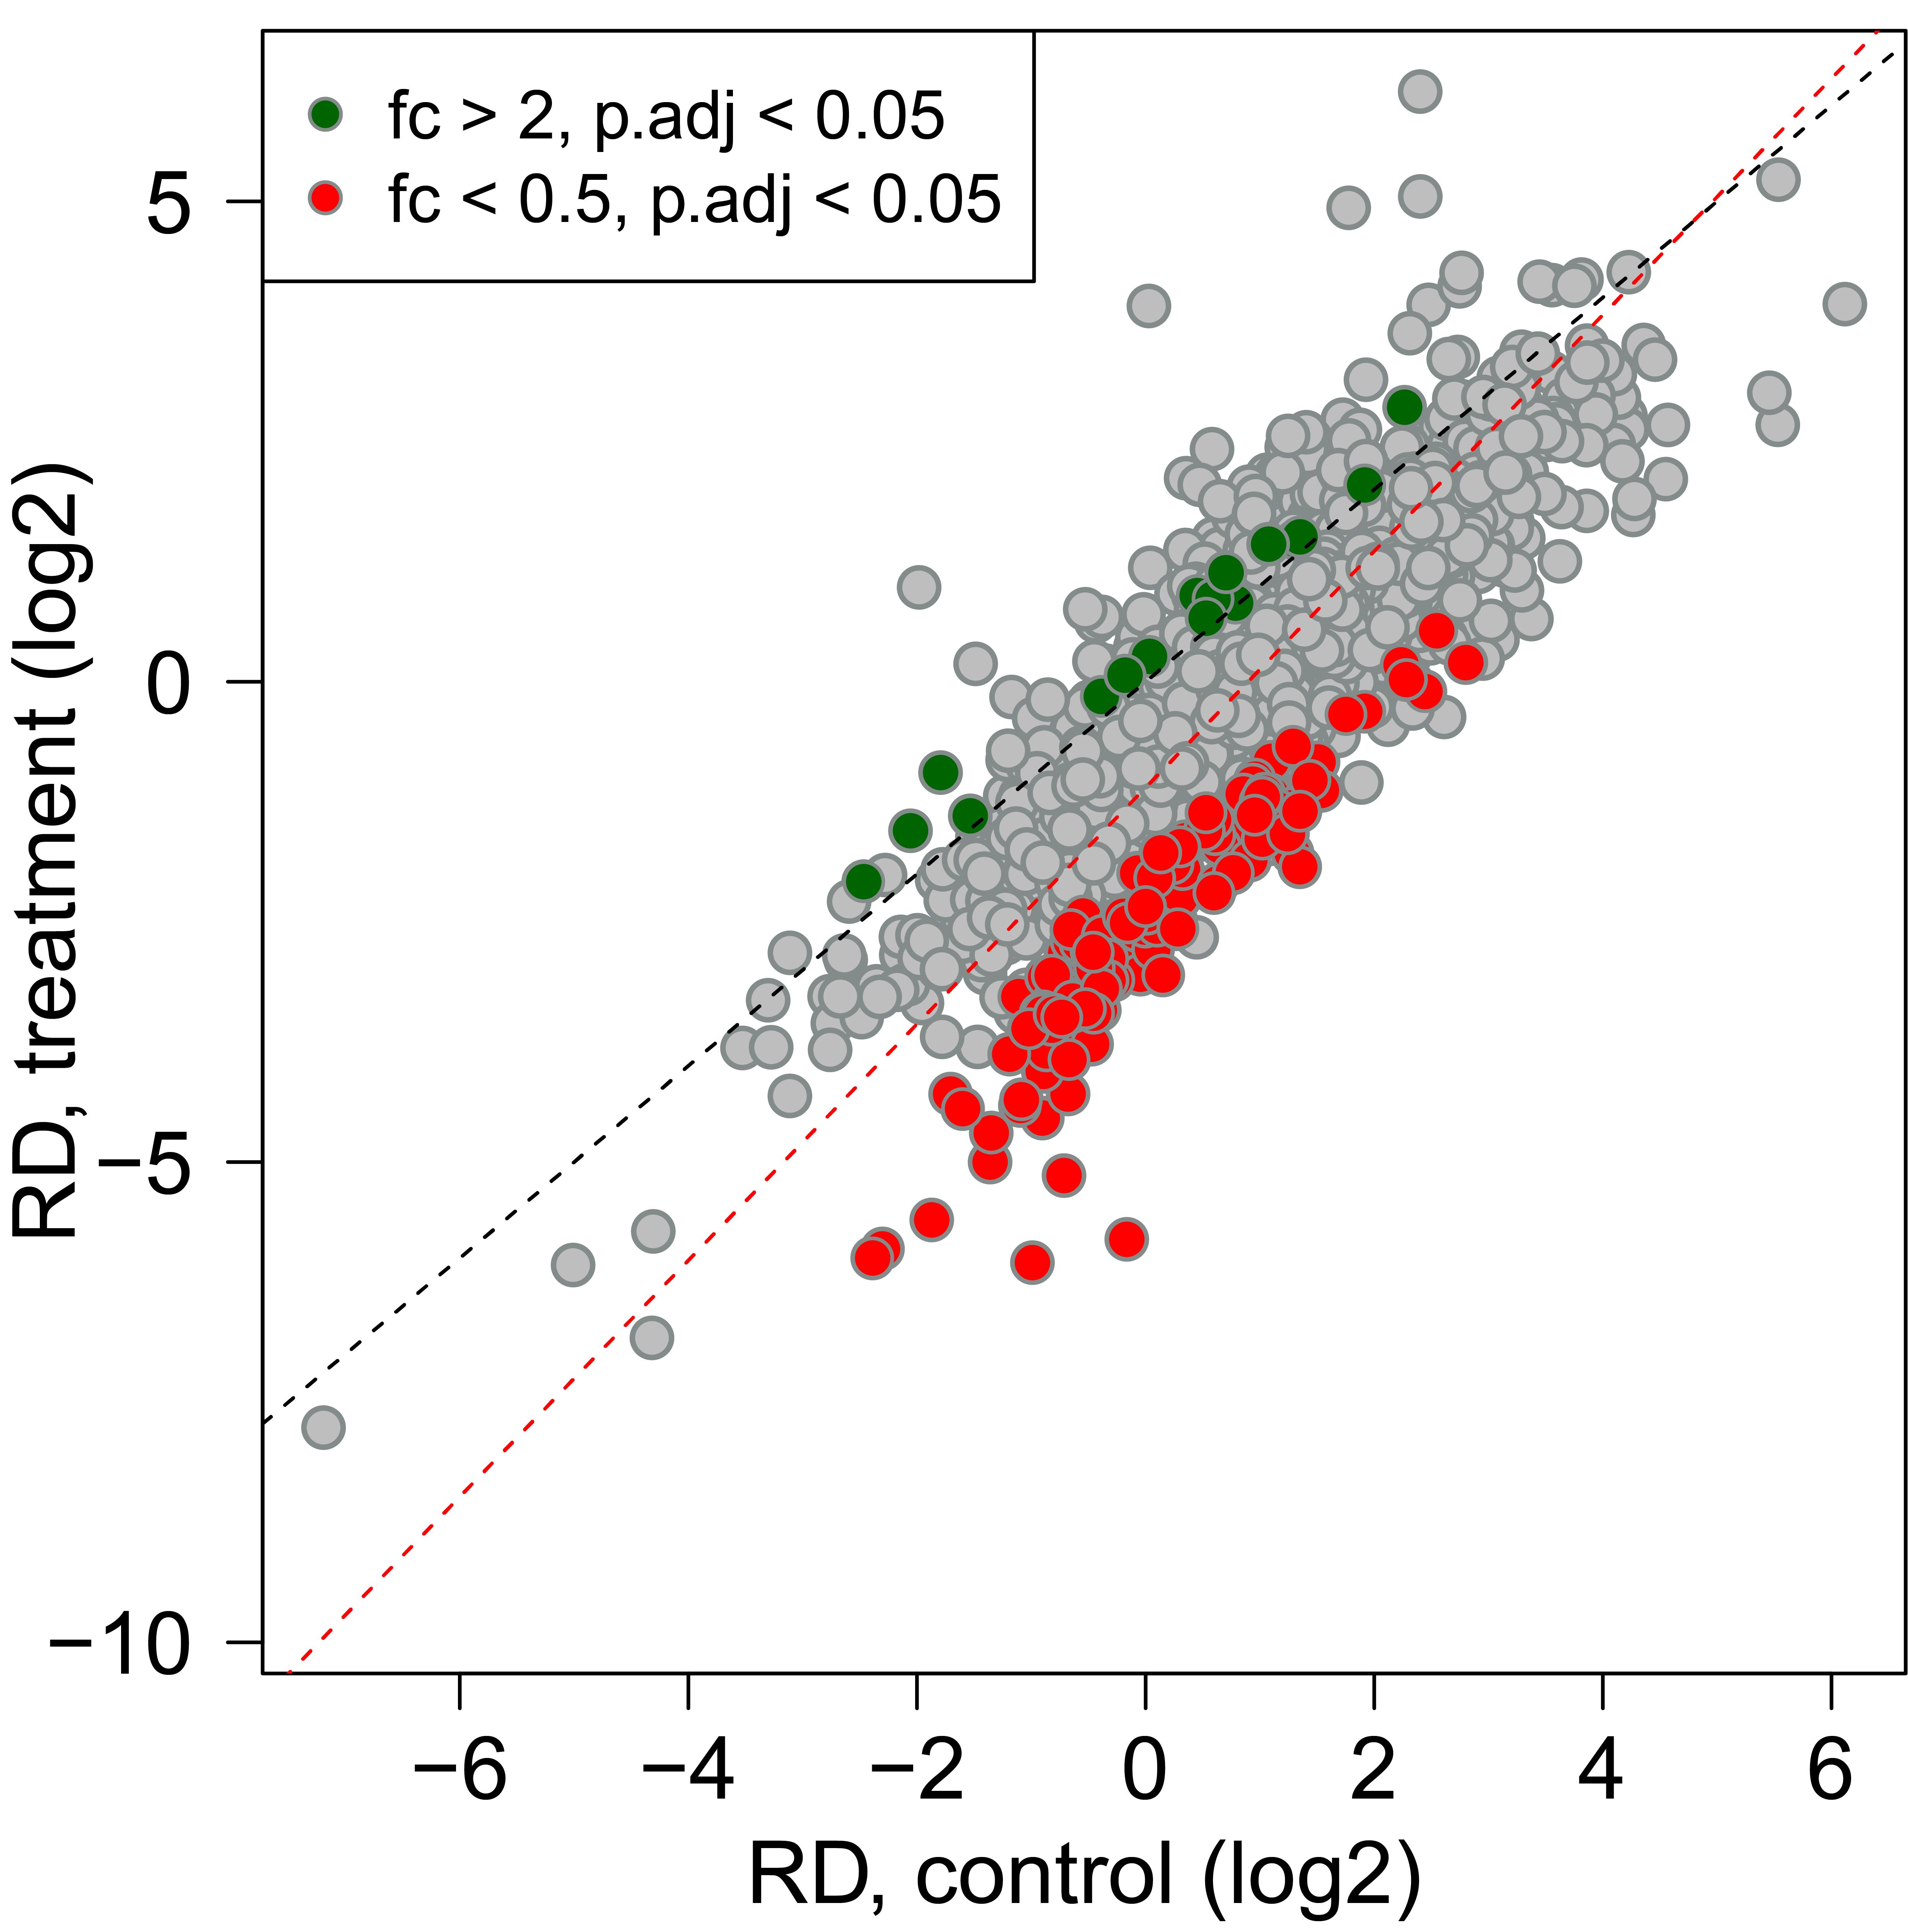
Figure 4. Normalized RD as scatter plot. Human ORF read counts are normalized to the sum of yeast ORF read counts. Ribosome densities (RD) are calculated as the ratio of footprint counts to input counts (FP/IN). The mean of this ratio is determined from three independent biological replicates. Differentially regulated mRNAs are identified with the DESeq2 package. RDs with a p-value <0.05 after Benjamini-Hochberg multiple testing correction and a fold-change of >2 or <0.5 are highlighted. The total least squares regression line is depicted in red, and a line through the origin with slope =1 in black.
Notes
Although there are yeast homologues for many human proteins, coding sequences are sufficiently dissimilar for our purpose. Before deciding to use Saccharomyces cerevisiae lysates as spike-in, we generated small fragments of the human reference transcriptome (the reference fasta file used in Data analysis, G) and aligned them to the yeast reference, and vice versa. In this process, fragments of lengths relevant for ribosome footprinting (≥28 nt) align with a rate of less than 0.05% to the opposite transcriptome. These fragments would be excluded from our analysis, because they can not be uniquely attributed.
Frozen whole cell Saccharomyces cerevisiae lysate can be prepared once and stored in aliquots for later use at -80°C. Saccharomyces cerevisiae polysome containing lysate can be prepared as previously described (Friedrich et al., 2021).
The RiboZero Gold rRNA removal kit from Illumina is no longer available for purchase separately. It has been replaced by the Illumina Stranded Total RNA Prep with Ribo-Zero Plus kit (20040525) that includes reagents for library preparation and sequencing of total RNA. It would be possible to either purchase this kit and use only the RiboZero reagents, or to use rRNA removal kits from other companies. Examples include the Ribominus kits from ThermoFisher Scientific and the NEBNext rRNA Depletion Kits from NEB. Alternatively, rRNA removal can be performed using self-made hybridization oligonucleotides (Kraus et al., 2019).
The PeakTrak software that is designed for the Teledyne Isco Foxy Jr gradient fractionator is no longer updated / supported and may not run on newer computers.
In the original protocol used in Haneke et al. (2020), the Ribo-seq protocol was performed in serum-starved RPE1 cells to ensure that the cells had exited the cell cycle and entered a quiescent state. To this end, 3 × 10⁶ RPE1 cells were diluted into FBS-free Ham’s F12 medium containing 2 mM L-glutamine, 100 U/mL penicillin, and 100 µg/mL streptomycin, and seeded into 15 cm dishes 48 h before the experiment. For drug treatment, fresh serum-free Ham’s F12 medium containing 2 mM L-glutamine, 100 U/mL penicillin, and 100 µg/mL streptomycin was also used.
Treatment of cells with CHX stabilizes existing polysomes and prevents ribosome run-off during the lysis procedure, but is also known to introduce a bias in RD, especially towards the 5’ end of the transcript. Therefore, this step was omitted in the original protocol used in Haneke et al. (2020).
We routinely use polysome buffer A and polysome lysis buffer A in our experiments, but have also tested polysome buffer B and polysome lysis buffer B, which show equal efficiency.
It might be required to adjust nuclease digestion conditions according to the origin of the sample. The described conditions worked best for mammalian cell lines in our hands, but longer digestion with less RNase I at RT is also possible. In general, it is advisable to always run and record both the polysome profile of the digested and an undigested sample, to be able to estimate the quality and the overall translational status of the sample. Moreover, also run and record a polysome gradient loaded with the yeast spike-in to assess the quality, amount, and translational status of the spike-in sample.
We suggest to separate sub-polysomal and polysomal fractions by sucrose density gradient centrifugation rather than by sucrose cushions, since it allows for better judgement of the RNase I digestion and better separation of monosomes from residual undigested polysomes.
For a regular ribosome footprint, the small RNA ladder is not necessarily required, as the two size marker oligonucleotides define the region that is cut out of the gel. However, if other fragment sizes are desired (for example 21 nt fragments for stalled ribosomes, or 60 nt fragments for collided ribosomes), the small RNA marker is beneficial. Alternatively, size marker oligonucleotides of different sizes could be designed and purchased.
The starting material that the manual is referring to, is considered total RNA. Since the RNA from the Ribo-Seq experiment is already size-selected, less material can be used and the adaptors provided in the kit should not be diluted (in contrast to what is stated in the manual).
We align sequencing reads of human ribosome-protected fragments or input fragments to transcriptomic sequences, and summarize them at the level of genes. For this purpose, all sequences aligning only to isoforms of one specific gene (defined by a common gene symbol) are counted for this gene. We adopted this pragmatic approach as a compromise: on the one hand, we want to consider only reads that can be attributed uniquely to a specific gene; on the other hand, we want to avoid the loss of reads originating from duplicated genes or tandem repeats within a gene, which occurs when allowing only unique alignments after mapping to the entire genome.
As an optional step of quality control, we visualize periodicity and distribution of reads around start and stop codons as an aggregate of all uniquely annotated reads in a sample (Data analysis, L.2). For this purpose, we determine the distance between the 5′ end of each read and the first nucleotide of the start or stop codon of an arbitrary isoform of the gene. Due to alternative translation initiation sites, this distance is not necessarily always correct, and the quality of the ribosome footprint might be underestimated. Usually, reads accumulate at 12 nt upstream of the start codon, which originate from initiating ribosomes that carry the start codon in the P-site. This P-site offset can be adapted for counting ORF reads (Data Analysis, M, offset_start). Likewise, the length of reads can be restricted, e.g., to those read lengths that display periodicity, although we did not restrict our analysis in this respect (Data analysis, M, min_len and max_len).
Recipes
Note: All concentrations listed are final concentrations.
PBS (20×)
2.7 M NaCl
54 mM KCl
200 mM Na2HPO4
pH 7.4, autoclaved
Polysome buffer A (2×)
40 mM Tris-HCl pH 7.4
10 mM MgCl2
300 mM NaCl
Polysome buffer B (2×)
40 mM Tris-HCl pH 7.4
20 mM MgCl2
400 mM KCl
Polysome lysis buffer A
20 mM Tris-HCl pH 7.4
5 mM MgCl2
150 mM NaCl
1% Triton X-100
100 µg/mL cycloheximide
1 mM DTT
Complete Protease Inhibitor
Polysome lysis buffer B
20 mM Tris-HCl pH 7.4
10 mM MgCl2
200 mM KCl
1% NP-40
100 µg/mL cycloheximide
1 mM DTT
Complete Protease Inhibitor
Urea buffer
10 mM Tris-HCl pH 7.5
350 mM NaCl
10 mM EDTA
1% SDS
7 M urea
Random fragmentation buffer
Note: Should be prepared fresh directly before use! 100 mM stock solutions of NaHCO3 and Na2CO3 can be stored for longer periods of time at RT.
2 mM EDTA
88 mM NaHCO3
12 mM Na2CO3
Stop/Precipitation solution (volumes per sample)
20 µL of 3 M NaOAc pH 5.2
1 µL of GlycoBlue
20 µL of 3 M NaCl
139 µL of RNase-free water
TBE (10×)
1 M Tris
0.889 M boric acid
20 mM EDTA (pH 8.0)
RNA loading dye (3×)
1× TBE
8 M urea
30 mM EDTA
20% glycerol
Traces of bromophenol blue and xylencyanol
Acknowledgments
This protocol was originally applied in our study “CDK1 couples proliferation with protein synthesis” published by The Journal of Cell Biology (Haneke et al., 2020). Our work was supported by the grants SPP 1935 (DFG) and TRR 319 (DFG). We would like to thank Ulrike Friedrich, Guenter Kramer, and Bernd Bukau (all at the Center for Molecular Biology of Heidelberg University, Germany) for providing yeast lysates. Furthermore, we would like to thank Georg Stoecklin (Medical Faculty Mannheim, Heidelberg University) for his invaluable support of our work, and Doris Lindner (Medical Faculty Mannheim, Heidelberg University) for technical assistance in establishing this protocol.
Competing interests
The authors declare no competing interests.
References
- Aviner, R., Geiger, T. and Elroy-Stein, O. (2014). Genome-wide identification and quantification of protein synthesis in cultured cells and whole tissues by puromycin-associated nascent chain proteomics (PUNCH-P). Nat Protoc 9(4): 751-760.
- Cattie, D. J., Richardson, C. E., Reddy, K. C., Ness-Cohn, E. M., Droste, R., Thompson, M. K., Gilbert, W. V. and Kim, D. H. (2016). Mutations in Nonessential eIF3k and eIF3l Genes Confer Lifespan Extension and Enhanced Resistance to ER Stress in Caenorhabditis elegans. PLoS Genet 12(9): e1006326.
- Dermit, M., Dodel, M. and Mardakheh, F. K. (2017). Methods for monitoring and measurement of protein translation in time and space. Mol Biosyst 13(12): 2477-2488.
- Dieterich, D. C., Lee, J. J., Link, A. J., Graumann, J., Tirrell, D. A. and Schuman, E. M. (2007). Labeling, detection and identification of newly synthesized proteomes with bioorthogonal non-canonical amino-acid tagging. Nat Protoc 2(3): 532-540.
- Friedrich, U. A., Zedan, M., Hessling, B., Fenzl, K., Gillet, L., Barry, J., Knop, M., Kramer, G. and Bukau, B. (2021). Nα-terminal acetylation of proteins by NatA and NatB serves distinct physiological roles in Saccharomyces cerevisiae. Cell Rep 34(5): 108711.
- Haneke, K., Schott, J., Lindner, D., Hollensen, A. K., Damgaard, C. K., Mongis, C., Knop, M., Palm, W., Ruggieri, A. and Stoecklin, G. (2020). CDK1 couples proliferation with protein synthesis. J Cell Biol 219(3): e201906147.
- Ingolia, N. T., Ghaemmaghami, S., Newman, J. R. and Weissman, J. S. (2009). Genome-wide analysis in vivo of translation with nucleotide resolution using ribosome profiling. Science 324(5924): 218-223.
- Kraus, A. J., Brink, B. G. and Siegel, T. N. (2019). Efficient and specific oligo-based depletion of rRNA. Sci Rep 9(1): 12281.
- Langmead, B., Trapnell, C., Pop, M. and Salzberg, S. L. (2009). Ultrafast and memory-efficient alignment of short DNA sequences to the human genome. Genome Biol 10(3): R25.
- Love, M. I., Huber, W. and Anders, S. (2014). Moderated estimation of fold change and dispersion for RNA-seq data with DESeq2. Genome Biol 15(12): 550.
- Melamed, D., Eliyahu, E. and Arava, Y. (2009). Exploring translation regulation by global analysis of ribosomal association. Methods 48(3): 301-305.
- Schwanhausser, B., Busse, D., Li, N., Dittmar, G., Schuchhardt, J., Wolf, J., Chen, W. and Selbach, M. (2011). Global quantification of mammalian gene expression control. Nature 473(7347): 337-342.
- Schwanhausser, B., Gossen, M., Dittmar, G. and Selbach, M. (2009). Global analysis of cellular protein translation by pulsed SILAC. Proteomics 9(1): 205-209.
- Wang, Y. J. and Gilbert, W. V. (2021). Quantitative Comparisons of Translation Activity by Ribosome Profiling with Internal Standards. Methods Mol Biol 2252: 127-149.
- Wang, Y. J., Vaidyanathan, P. P., Rojas-Duran, M. F., Udeshi, N. D., Bartoli, K. M., Carr, S. A. and Gilbert, W. V. (2018). Lso2 is a conserved ribosome-bound protein required for translational recovery in yeast. PLoSBiol 16(9): e2005903.
Article Information
Copyright
© 2022 The Authors; exclusive licensee Bio-protocol LLC.
How to cite
Readers should cite both the Bio-protocol article and the original research article where this protocol was used:
- Hoerth, K., Reitter, S. and Schott, J. (2022). Normalized Ribo-Seq for Quantifying Absolute Global and Specific Changes in Translation. Bio-protocol 12(4): e4323. DOI: 10.21769/BioProtoc.4323.
- Haneke, K., Schott, J., Lindner, D., Hollensen, A. K., Damgaard, C. K., Mongis, C., Knop, M., Palm, W., Ruggieri, A. and Stoecklin, G. (2020). CDK1 couples proliferation with protein synthesis. J Cell Biol 219(3): e201906147.
Category
Molecular Biology > RNA > RNA-protein interaction
Biochemistry > RNA > mRNA translation
Do you have any questions about this protocol?
Post your question to gather feedback from the community. We will also invite the authors of this article to respond.