- Protocols

- Articles and Issues
- For Authors
- About
- Become a Reviewer

Spherical Invasion Assay: A Novel Method to Measure Invasion of Cancer Cells

(*contributed equally to this work) Published: Vol 12, Iss 4, Feb 20, 2022 DOI: 10.21769/BioProtoc.4320 Views: 5457
Reviewed by: Gal HaimovichAnonymous reviewer(s)
Original research article
The authors used this protocol in:
Jan 2017
Advertisement


Protocol Collections
Comprehensive collections of detailed, peer-reviewed protocols focusing on specific topics


Abstract
The invasion of tumor cells into the neighboring blood vessels and lymph nodes is a vital step for distant metastasis. Traditionally, the invasive activity of growth factors (or the anti-invasive activity of drugs) is measured with the Boyden chamber assay. However, this assay has a few disadvantages like poor physiological relevance of transwell inserts and an inability to control chemokine gradients. The Boyden chamber assay is one of the most prevalent methods to measure the invasion of cancer cells. It would be advantageous to develop another assay that could validate the results of the Boyden chamber assay. With this in mind, our laboratory developed the spherical invasion assay (SIA) to measure the pro-invasive activity of human cancer cells. The SIA also circumvents some of the drawbacks of the Boyden chamber assay. The present manuscript measures the anti-invasive activity of the Src kinase inhibitor PP2 in A549 human non-small cell lung carcinoma (NSCLC) cells using the SIA. The SIA protocol is comprised of two steps. In the first step, A549 human NSCLC cells (treated or not with PP2) were mixed with Matrigel and seeded in the middle of an eight-well chamber slide. After 24 h, a second layer of Matrigel was overlaid over the first layer. Over the course of the next 24 h, the A549 cells invade from the primary to the secondary Matrigel layers. Subsequently, the cells are visualized by phase-contrast microscopy and the images obtained are quantified using ImageJ to calculate the anti-invasive activity of PP2 in A549 cells. The results of the SIA correlate well with Boyden chamber assays. The SIA may be adapted for multiple experimental designs, such as drug screening (to combat invasion and metastasis), measuring the pro-invasive activity of growth factors, and elucidating the signaling pathways underlying the pro-invasive/anti-invasive activity of biological modifiers.
Graphic abstract:
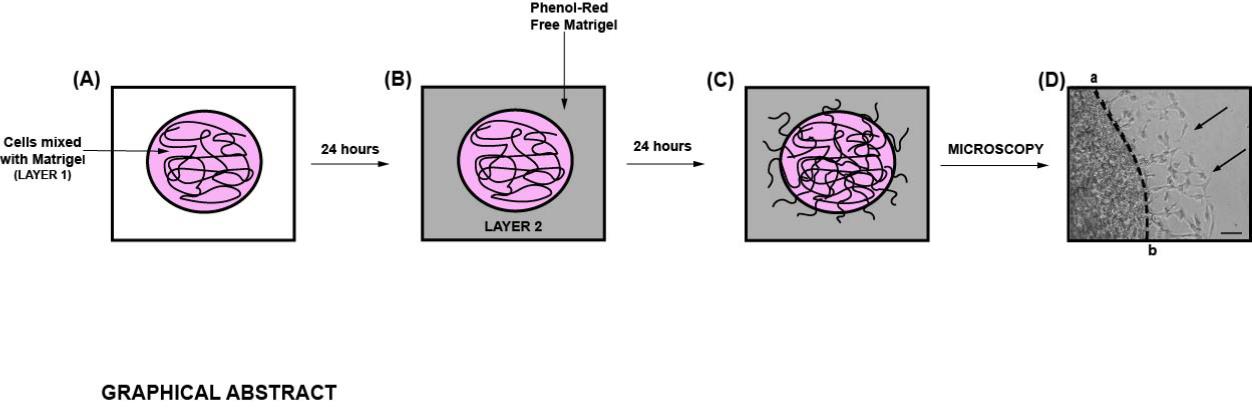
Diagrammatic illustration of the spherical invasion assay (Hurley et al., 2017). A. The first layer is comprised of human cancer cells mixed in a 1:1 suspension with Phenol Red containing Matrigel (represented as LAYER 1 in the figure). After 24 h, the cancer cells grow and extend up to the boundary of this first layer. B. A second layer of 1:1 solution Phenol Red-free Matrigel, in Phenol Red-free RPMI (represented as LAYER 2 in the figure) is added on top of the first Matrigel spot. The cells are incubated for 24 h at 37°C. C. Over these 24 h, the cancer cells invade from the primary layer into the secondary Matrigel layer. The chamber slides are observed by phase-contrast microscopy. D. A representative photograph of the images obtained by the SIA is shown. The black arrow indicates the cancer cells invading into the second layer of Matrigel. The dotted line represents the interface between the two layers. The distance to which the cells have traveled (into the secondary Matrigel layer) is measured at ten sites (for each photograph) in a randomized double-blind fashion by three independent observers, using NIH ImageJ Version 1.47. This process is repeated for three separate photographic fields per sample.
Background
Tumor invasion refers to the process by which cancer cells penetrate the basement membrane into surrounding stroma, neighboring blood vessels, and lymph nodes (Stuelten et al., 2018; Baghban et al., 2020). Tumor invasion is an essential step for metastasis of human cancers (Baghban et al., 2020). Amongst the many steps of metastasis, the process of tumor invasion has been targeted by many therapeutic agents to suppress the distant spread of tumors (Gandalovicova et al., 2017). The Boyden chamber assay is the benchmark technique for measuring the invasion of cancer cells (Guy et al., 2017). This assay involves the movement of a single-cell suspension through a microscopic mesh (8 micrometers in pore size) coated with an extracellular matrix. However, this assay suffers from several caveats. The physiological relevance of transwell inserts (to recapitulate invasion in vivo) is poor. The pore size of the membrane highly influences the number of cells that invade (Guy et al., 2017). In the Boyden chamber assay, a chemokine is added to the lower basolateral chamber to facilitate the invasion of tumor cells through the transwell membrane; however, it is very difficult to control the concentration of the chemokine gradient, and this may produce aberrant results (Guy et al., 2017). The Boyden chamber is one of the prevalent methods to measure tumor cell invasion. The “wound-healing assay” measures the migration (NOT THE INVASION) of human cancer cells. There are subtle differences between a “migration assay” and an “invasion assay”(Justus et al., 2014; Pijuan et al., 2019). In the migration assay, the movement of cells across a vacant area (like a scratch or wound) is measured. A second method to measure “cell migration” is to quantify the movement of cancer cells across a transwell filter (pore size of 8 µm) from the apical chamber to the basolateral chamber. Taken together, the migration assay measures the chemotactic capability of cells to travel toward a chemo-attractant or mixture of chemo-attractants (as observed with the use of conditioned medium). The invasion assay measures both cell chemotaxis and the invasion of cells through the layer of extracellular matrix proteins, a process that is commonly found in cancer metastasis. In the “invasion assay”, the transwell filters are coated with a thin layer of basement membrane (usually Matrigel). The first event in the “invasion assay” is that the cancer cells in the apical chamber secrete matrix metalloproteases to degrade basement membrane proteins, producing a gap in the basement membrane. Subsequently, the cancer cells travel through this gap in the basement membrane and pass through the transwell filter (pore size of 8 µm), to arrive at the basolateral chamber of the transwell filter. The process through which cancer cells degrade the basement membrane to penetrate the transwell insert is a unique feature of the “invasion assay”, which is not present in “migration assays”. The invasion assay faithfully recapitulates the process of “tumor invasion” during metastasis, where the neoplastic cells degrade the basement membrane to launch themselves into circulation in the neighboring blood vessel/lymph node. It would be useful to have a second invasion assay that could validate the results obtained with the Boyden chamber assay. All these considerations led us to develop a novel method of measuring tumor invasion namely the spherical invasion assay (SIA) in our laboratory. The SIA measures the invasion of human cancer cells as they migrate from the primary Matrigel layer, over the interface, and travel into a secondary Matrigel layer. The SIA mirrors the actual process of invasion under physiological conditions (Hurley et al., 2017). The cells that grow in extracellular matrix (ECM) retain biological characteristics of tumors, such as responsiveness to diffusion gradient of oxygen, nutrients, and pH. The growth of the cells inside the ECM allows for complex cell-cell and cell-matrix interaction. The SIA can be adapted to organoids, spheroids (Gunti et al., 2021), retinal angiogenic sprouts (Stitt et al., 2005), tumor stem cells (Atashzar et al., 2020), neurospheres (da Silva Siqueira et al., 2021), and cells grown on polymeric scaffolds (Stratton et al., 2016). In such cases, it is important to remember that the conditions for culturing normal cells are very different from cancer cells. In addition, normal cells should be used at a low passage number, so that they do not become senescent. For example, if the SIA is performed with retinal endothelial cells, then the assay should be performed between passages 3-6 (Stitt et al., 2005). Furthermore, these invading cells can be characterized by confocal laser microscopy and transmission electron microscopy. Most importantly, the results of the SIA correlate with the data obtained in the Boyden chamber assay, so the SIA can be used to confirm the results obtained in Boyden chamber assays (Hurley et al., 2017). The present protocol examines the effect of the Src Kinase inhibitor PP2 (Hanke et al., 1996) (at a concentration of 10 µM) on the invasion of A549 human NSCLC cells. We hope that the SIA will be a useful tool for researchers working in the field of tumor microenvironment biology and cancer metastasis.
Materials and Reagents
Fisherbrand High Precision Sterile Scalpel Blade (Fisher, catalog number: 12-000-161)
NuncTM EasYFlaskTM T-75 Cell Culture Flasks (Fisher, catalog number: 12-565-349)
Tissue culture dishes (diameter 100 mm) may also be used (NuncTM EasYDishTM Dishes; Fisher catalog number: 12-600-003).
Ice cold 1.5 mL microfuge tubes (Fisher, catalog number: 05-408-129)
5 mL microfuge tubes (Eppendorf, catalog number: 0030119401)
Sterile 15 mL centrifuge tube (Thermo Scientific Nunc, Fisher, catalog number: 12-565-268)
Sterile 50 mL centrifuge tubes (ThermoScientific Nunc, Fisher, catalog number: 12-565-270)
Thermo Scientific Nunc Lab-Tek eight well Permanox plastic Chamber Slide System (Fisher, catalog number: 12-565-22)
A549 human NSCLC cells (ATCC, catalog number: CCL-185)
F-12K Medium (Kaighn's Modification of Ham's F-12 Medium; ATCC; catalog number: 30-2004). Store at 4°C
Roswell Park Memorial Institute (RPMI)-1640 medium with phenol-red (ATCC, catalog number: 30-2001). Store at 4°C
Roswell Park Memorial Institute (RPMI)-1640 medium without Phenol Red (Fisher, catalog number: 30-404-014). Store at 4°C
Fetal bovine serum (FBS) (ATCC, catalog number: 30-2020)
Long-term storage for FBS is -20°C. In our laboratory, FBS is aliquoted into 50 mL centrifuge tubes and stored at -20°C. The FBS aliquot is stored at 4°C for immediate use.
Trypsin-EDTA (0.25% Trypsin, 0.53 mM EDTA, ATCC, catalog number: 30-2101)
Long-term storage for Trypsin-EDTA is stored at -20°C. However, Trypsin-EDTA is aliquoted and stored at 4°C for immediate use.
Dulbecco’s Phosphate buffered saline (PBS) without calcium and magnesium (Corning, Fisher, catalog number: 21-031-CM). Store at 4°C.
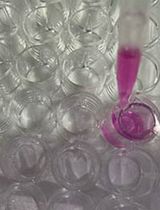
Matrigel membrane matrix (Fisher, catalog number: CB-40234)
Matrigel is a liquid at 4°C and it solidifies at 37°C. Matrigel is aliquoted and stored at -70°C for long-term storage. Before the experiment, Matrigel is kept overnight at 4°C for thawing. Matrigel is kept on ice throughout the experiment.
Phenol red-free Matrigel membrane matrix (Fisher, catalog number: CB-40234C)
PP2 (A potent and selective inhibitor of the Src family tyrosine kinases) was obtained from Enzo Biosciences (catalog number, 50-201-0681)
PP2 is a powder and is stored at -20°C. The PP2 is dissolved in DMSO (Corning DMSO, Fisher MT-25950CQC) at a final concentration of 10 mM. This stock solution of PP2 solution is aliquoted into microfuge tubes and stored at -20°C. Just before the SIA, the PP2 is thawed and diluted to the desired concentration using serum-free RPMI. After use, the remainder of the diluted PP2 solution (at a concentration of 10 µM) is discarded.
10 mM PP2 (see Recipes)
200 µM PP2 (see Recipes)
Equipment
NU-540 (LabGard® ES NU-540 Class II, Type A2) Laminar-Flow Biosafety Cabinet (NuAire, Plymouth, MN)
Cell culture incubator maintained at 37°C and 5% CO2 (Heracell VIOS 150i cell culture incubator, Thermo Scientific, Waltham, MA)
Leica DM IL LED Inverted Phase Contrast Microscope with a camera (Leica Microsystems, Welzar, Germany)
Corning Cell Counting Chamber (Fisher, catalog number: 07-200-988)
Labnet Hermle Z306 Universal Benchtop Centrifuge; 120V (Labnet International, Cary, NC)
Software
LAS Image Capture Software (Leica Microsystems)
Adobe Photoshop 2021 (Adobe Inc. for Windows)
Adobe Illustrator 2021 (Adobe Inc. for Windows)
NIH ImageJ Version 1.47 (National Institutes of Health, Bethesda)
GraphPad Prism Version 8
Procedure
Culture of A549 cells in RPMI supplemented with10% FBS
The human NSCLC cell line A549 was authenticated by the ATCC Cell Authentication Service (ATCC, Manassas, VA).
A549 cells were grown to 70-80% confluence in a F12K medium mixture containing 2 mM glutamine, 100 units/mL penicillin, 50 µg/mL streptomycin, and 10% FBS in a humidified environment at 37°C (in the presence of 5% CO2) in a cell culture incubator.
Working with Matrigel
The Matrigel is aliquoted in ice-cold microfuge tubes and stored at -70°C.
Before starting the experiment, the required amount of Matrigel is thawed overnight at 4°C. The Matrigel is always kept on ice.
Matrigel is a liquid at 4°C and it solidifies at 37°C. So all plasticware and reagents have to be kept ice cold while handling the Matrigel.
The thawed Matrigel is a thick viscous liquid. Therefore, the pipette tips should be trimmed at the tip (to increase the diameter of the tip) to transport the Matrigel in/out of microfuge tubes. The tips are trimmed by using a sterile scalpel blade. All microfuge tubes and pipette tips are kept ice cold while handling the Matrigel. In our laboratory, we use ice-cold RPMI as a cooling media. All the pipette tips are dipped into the ice-cooled media to chill them down before using them to handle Matrigel.
Spherical Invasion Assay
Day 1Before starting the experiment, draw the schema of the assay as shown in Figure 1. The assay will be set up in an eight-well chamber slide. The yellow region of the side of the chamber slide is used to lift it up and transport it around.
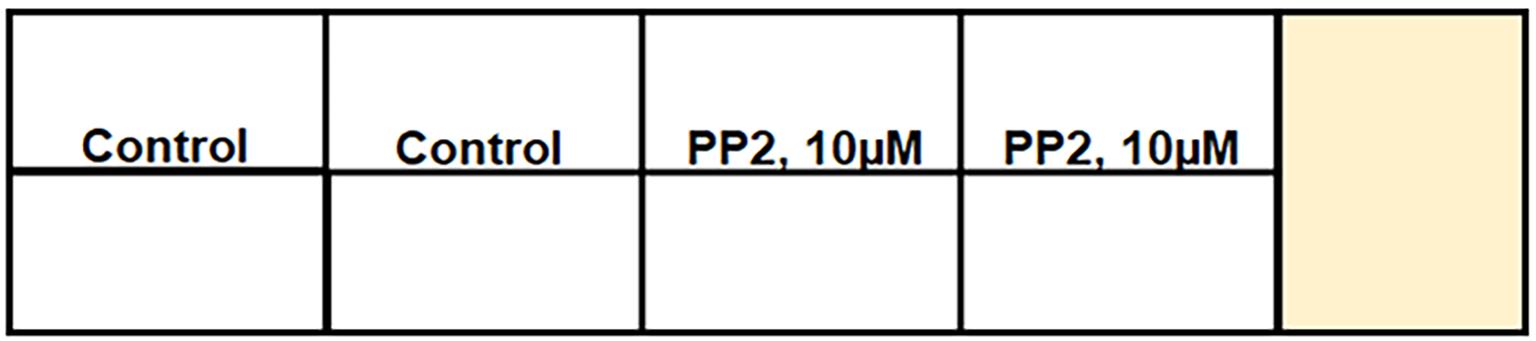
Figure 1. Schema of an example spherical invasion assay in an eight well chamber slide.A549 human NSCLC cells were grown to approximately 70-80% confluence in T-75 tissue culture flasks in F-12K supplemented with 10% FBS.
Wash cells once with DPBS and trypsinize them from the flask using 0.25% Trypsin-EDTA.
Add 1 mL of FBS to inactivate the Trypsin. Aspirate cells by pipetting up and down gently, and collect them in a 15 mL/50 mL sterile centrifuge tube.
Gently spin down the cells at 800 × g for 5 min. Aspirate the media and resuspend the cells in RPMI (containing phenol red)/ 20% FBS.
Count the cells using the Corning cell counting chamber. Adjust the concentration of the cells to 50 × 106 cells/mL in RPMI (containing phenol red) containing 20% FBS. This tube is identified as TUBE A.
The PP2 was diluted to a concentration of 200 µM in serum-free RPMI (containing phenol red). This stock is always prepared at 20× concentration, where x is the final concentration of the drug in the SIA. The final concentration of PP2 to be used for the SIA is 10 µM. Therefore, the PP2 stock was 200 µM.
In a separate microfuge tube, mix the cells (from TUBE A) with PP2 (at a concentration of 200 µM) at a ratio of 10:1 (v/v). This dilutes the PP2 to a concentration of PP2 = 20 µM. For example, you may add 45 µL of cell suspension (from TUBE A) to 5 µL of the PP2. Therefore, the new concentration of PP2 = 20 µM. We will call this TUBE B.
Keep a few microfuge tubes on ice to chill them down. Mix the cells with Matrigel at a ratio of 1:1 in an ice-cold microfuge tube. As mentioned in Step 6, the cells are resuspended in RPMI (containing phenol red)/20% FBS. Once the cells are mixed (at a ratio of 1:1) in Matrigel, the final concentration of the media comes down to RPMI (containing phenol red)/10% FBS. For example, mix 15 µL of Matrigel with 15 µL of cell suspension (taken from TUBE B). Mix the cells with the Matrigel by flicking the tube, making the final PP2 concentration in the tube 10 µM. This tube is referred to as TUBE C.
Similarly, 15 µL of untreated control A549 cells were mixed with 15 µL of Matrigel in a separate microfuge tube. This tube is referred to as TUBE D.
Take a chamber slide out of the packet. Keep the chamber slide in a dish over a piece of tissue paper. If you keep it directly on the surface of the head, the bottom of the chamber slide tends to stick to the floor of the hood, and it is hard to lift the chamber slide.
Take 6 µL of the cell suspension from TUBE C and plate it as a drop in the center of the chamber slide. Each sample is assayed in duplicate. A similar process is followed for TUBE D. The chamber slide is incubated at 37°C for one hour in a cell culture incubator. Figure 2 is a schematic representation of the chamber slide with the drop in the middle of the well.
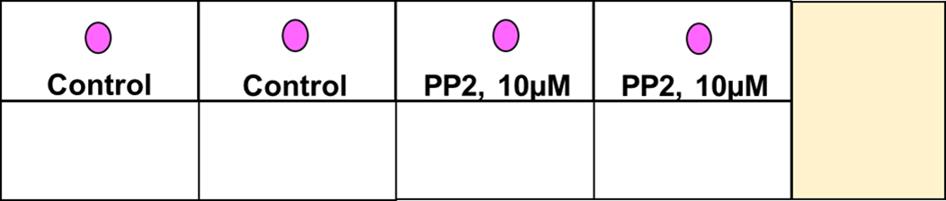
Figure 2. Schema of the first step of the spherical invasion assay in an eight well chamber slide. The cells are mixed with phenol red-containing Matrigel (as a 1:1 suspension) and plated as a drop in the middle of each well of the chamber slide. This drop is represented as a pink circle in the figure above.After 1 h, add 250 µL of RPMI (containing phenol red) with 10% FBS to each well. Leave the chamber slide at 37°C for 24 h in a cell culture incubator.
Thaw a vial of phenol red-free Matrigel overnight at 4°C. If the assay is set up like shown in the schematic diagram above, then we will need 125 µL of phenol red-free Matrigel per well of the chamber slide.
Dilute the phenol red-free Matrigel with an equal volume of phenol red-free RPMI containing 20% FBS. Keep this solution on ice.
Look at the chamber slide under a phase-contrast microscope. The cells are located inside the drop.
Aspirate the medium from the chamber slide. Use a pipette to gently remove the medium without disturbing the drop at the center of the chamber slide.
Overlay 250 µL of the 1:1 solution of phenol red-free Matrigel (diluted with phenol-red free RPMI supplemented with 20% FBS) over the drop. The schematic diagram of the chamber slide is provided below (Figure 3). The pink color drop represents the primary layer of Matrigel and the light grey region around the pink drop represents the phenol red-free Matrigel. The chamber slide is incubated at 37°C for 1 h in a cell culture incubator. After 1 h, add 250 µL of RPMI (containing phenol red) with 10% FBS to each well. Leave the chamber slide at 37°C for 24 h in a cell culture incubator.
We have performed the SIA by adding drugs (in this case PP2) to the secondary layer of Matrigel. However, we have observed that the presence/absence of the drug in the secondary Matrigel layer does not make a substantial difference in the outcome of the assay. Therefore, we do not add the drugs to the secondary layer of Matrigel.
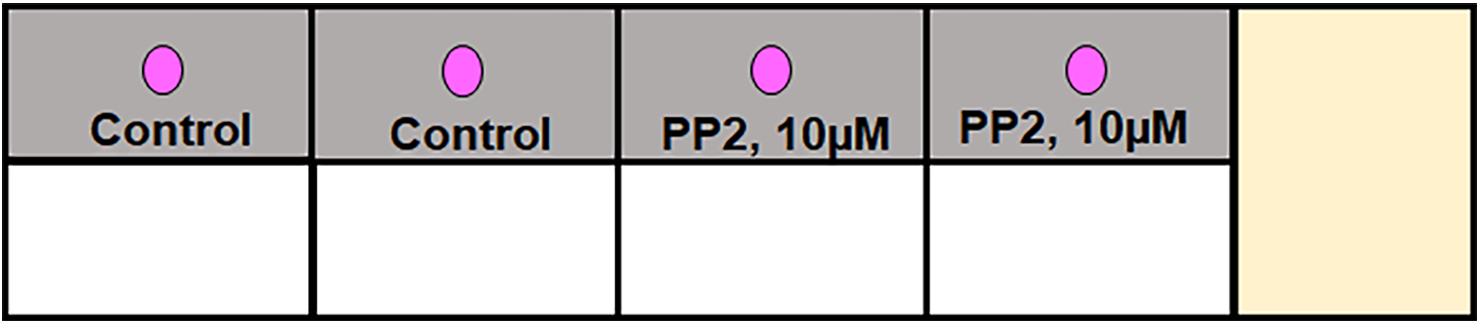
Figure 3. Schema of the second step of the spherical invasion assay in an eight-well chamber slide. The first step involves mixing the cells with phenol red-containing Matrigel (as a 1:1) suspension and plating them as a drop in the middle of each well of the chamber slide (shown as the pink circle in the figure above). In the second step, phenol red-free Matrigel is mixed with phenol red-free RPMI (at a 1:1 volume by volume ratio) and overlaid over the first layer (as shown by the grey region in the figure above).
Observe the chamber slide under a phase-contrast microscope. The cells are clearly seen invading out radially from the primary Matrigel layer in to the secondary Matrigel layer. The first layer contains a high concentration of A549 cells mixed with phenol-red containing Matrigel. The second layer is made up of phenol-red-free Matrigel and contains no cells. Therefore, the migration of cells from the primary layer to the secondary layer is very clear and distinct. Another factor that helps to make the interface very clear is the fact that two different colored Matrigels are used for creating the primary and secondary layers. The first layer is comprised of A549 cells mixed with phenol-red containing Matrigel. Under a phase-contrast microscope, this layer is red-black in appearance (Figure 4). The second layer is created by using phenol red-free Matrigel and is light pink in color. The interface is always very clear and defined. Photograph three independent fields for each sample.
Processing the images using adobe illustrator and ImageJ.
Figure 4 shows the representative images obtained from the SIA. The images are photographed at 20× magnification (scale bar = 1 mm). The black arrows indicate the A549 cells which have invaded from the primary to the secondary Matrigel layers.
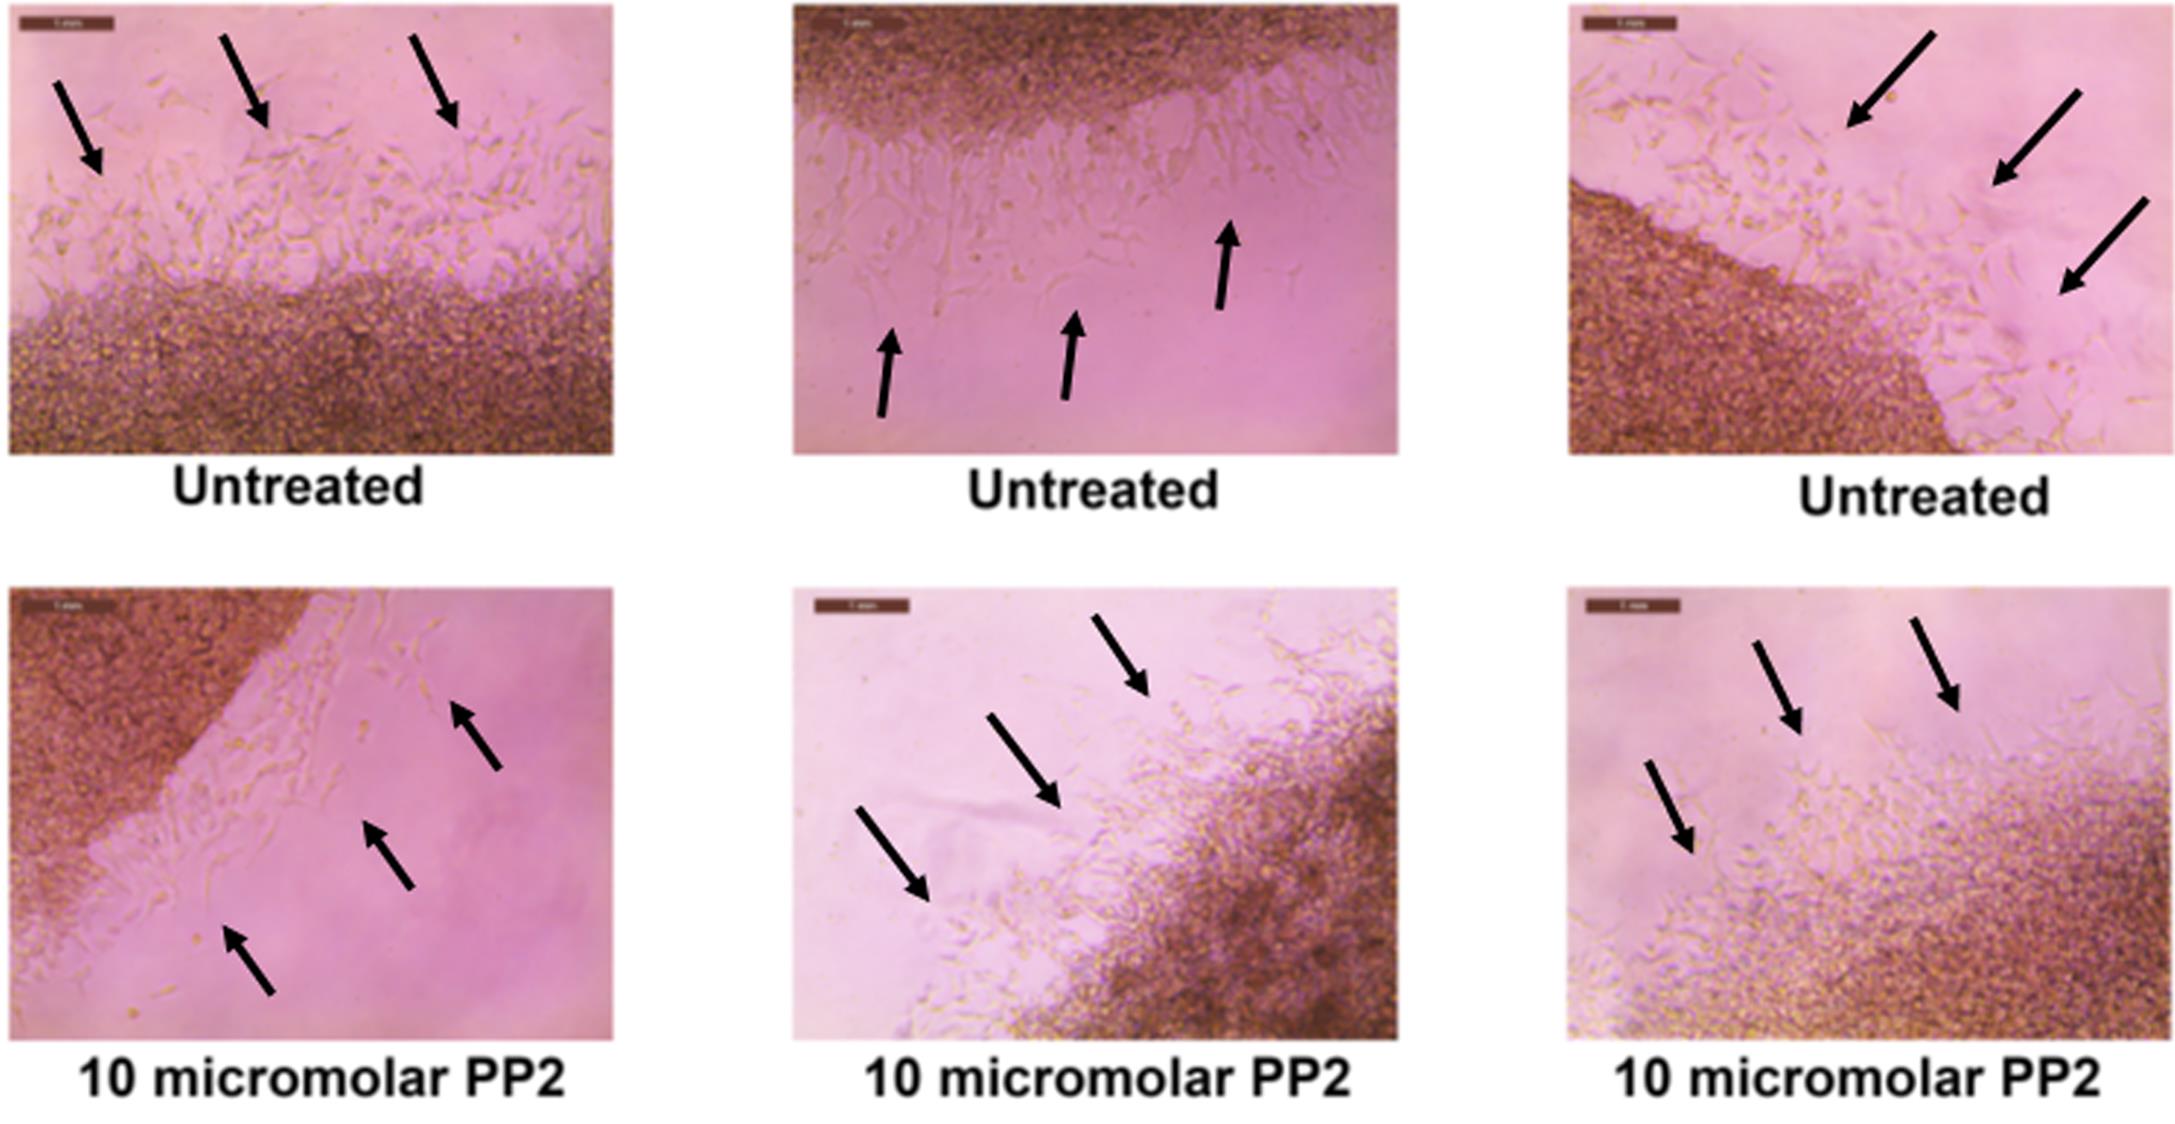
Figure 4. Representative images obtained after performing the SIA, as described in Section C.Open the images in ADOBE ILLUSTRATOR. Using the pen curvature tool, draw a dotted line across the interface the two layers (Figure 5).
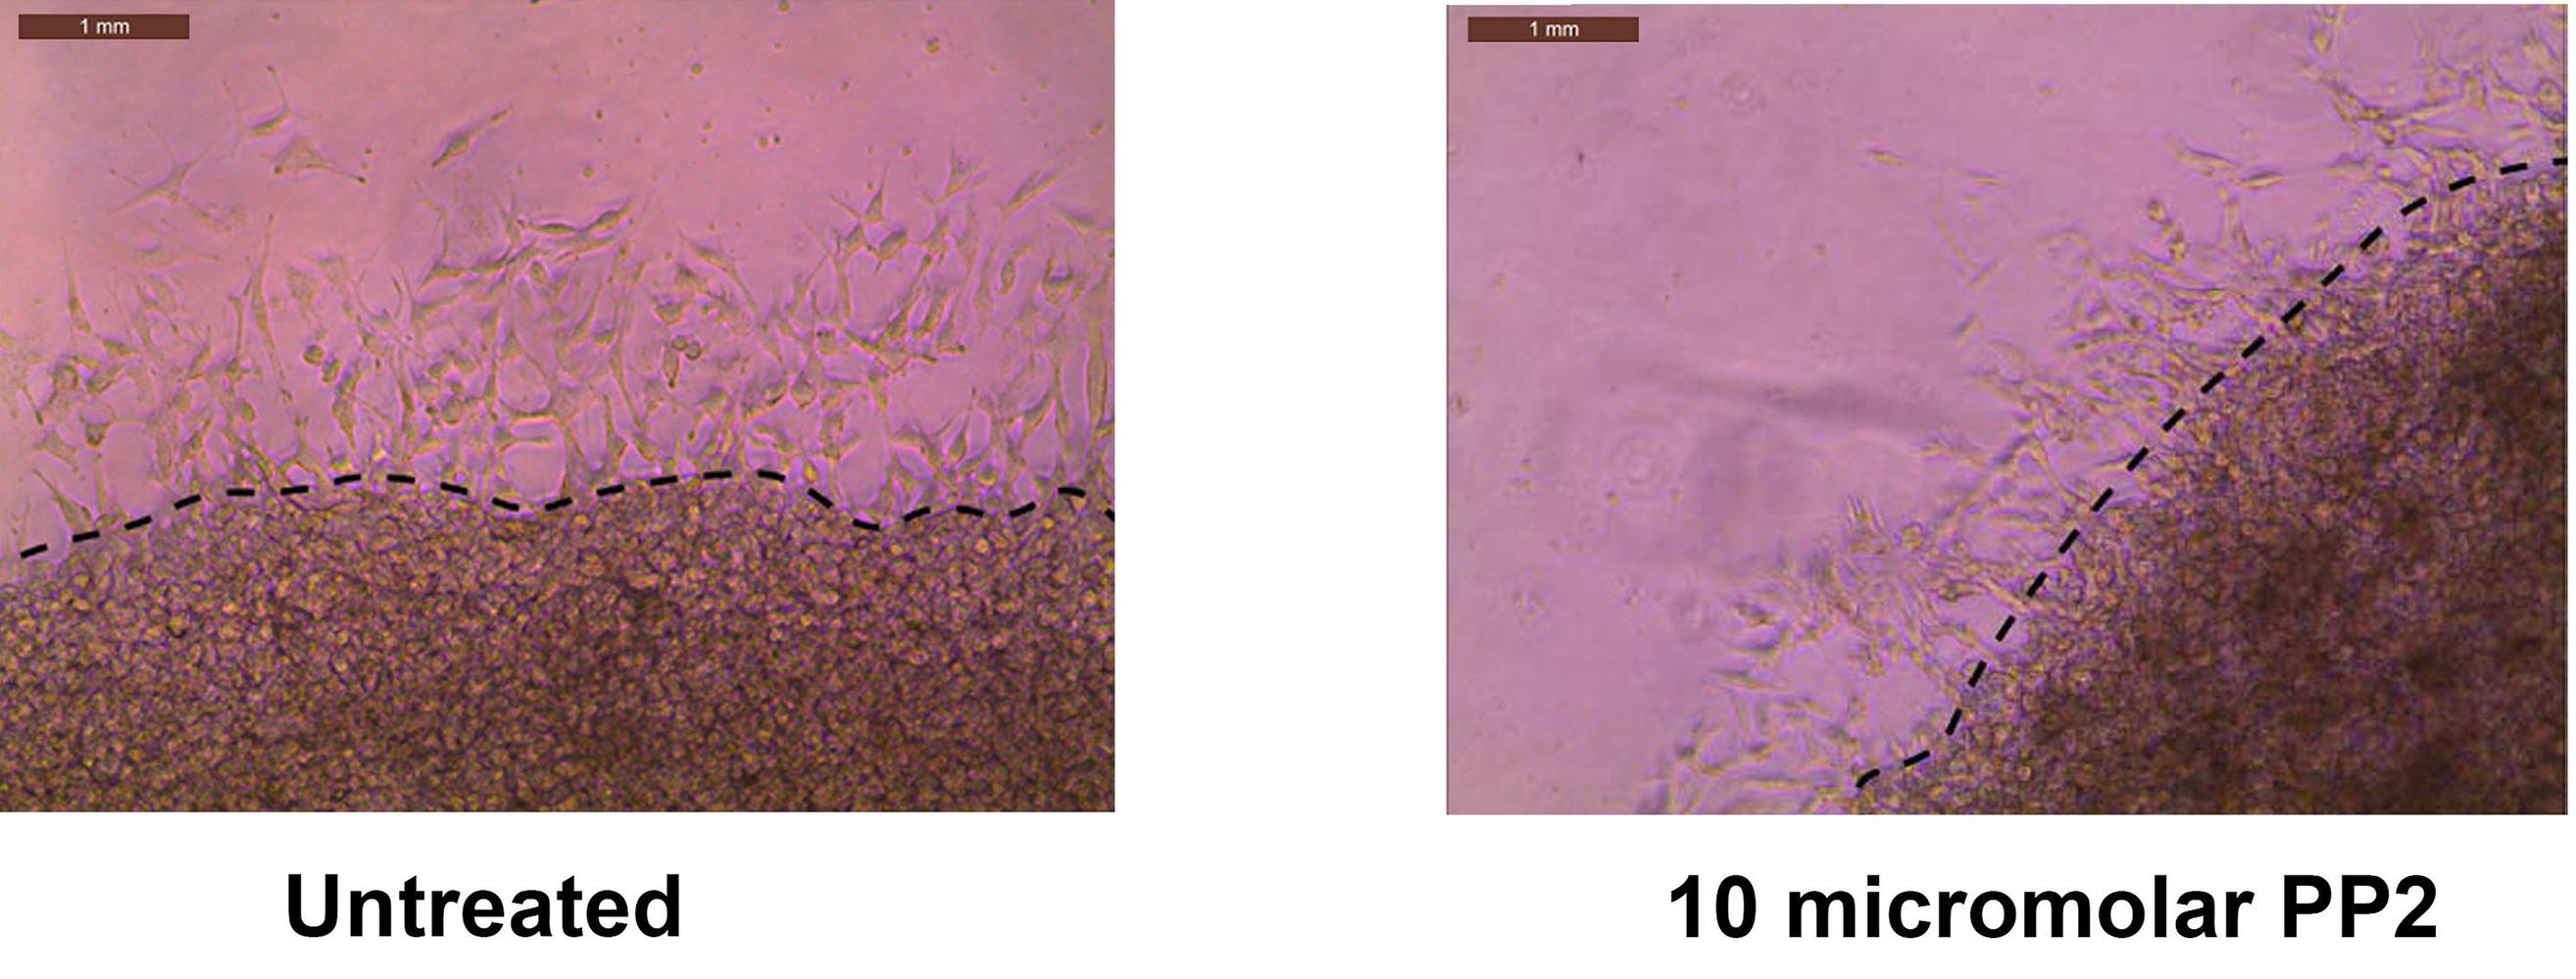
Figure 5. Adobe Illustrator is used to process the images obtained in Figure 4. A dotted line is drawn across the interface of the two layers.Export the images to ADOBE PHOTOSHOP and save them in jpeg format.
Open the jpeg files in ImageJ. Using the line tool, draw a set of ten lines tracing the distance that the A549 cells have invaded into the secondary Matrigel layer (Figure 6). After drawing each line, press CTRL-M to obtain the length of the line drawn.
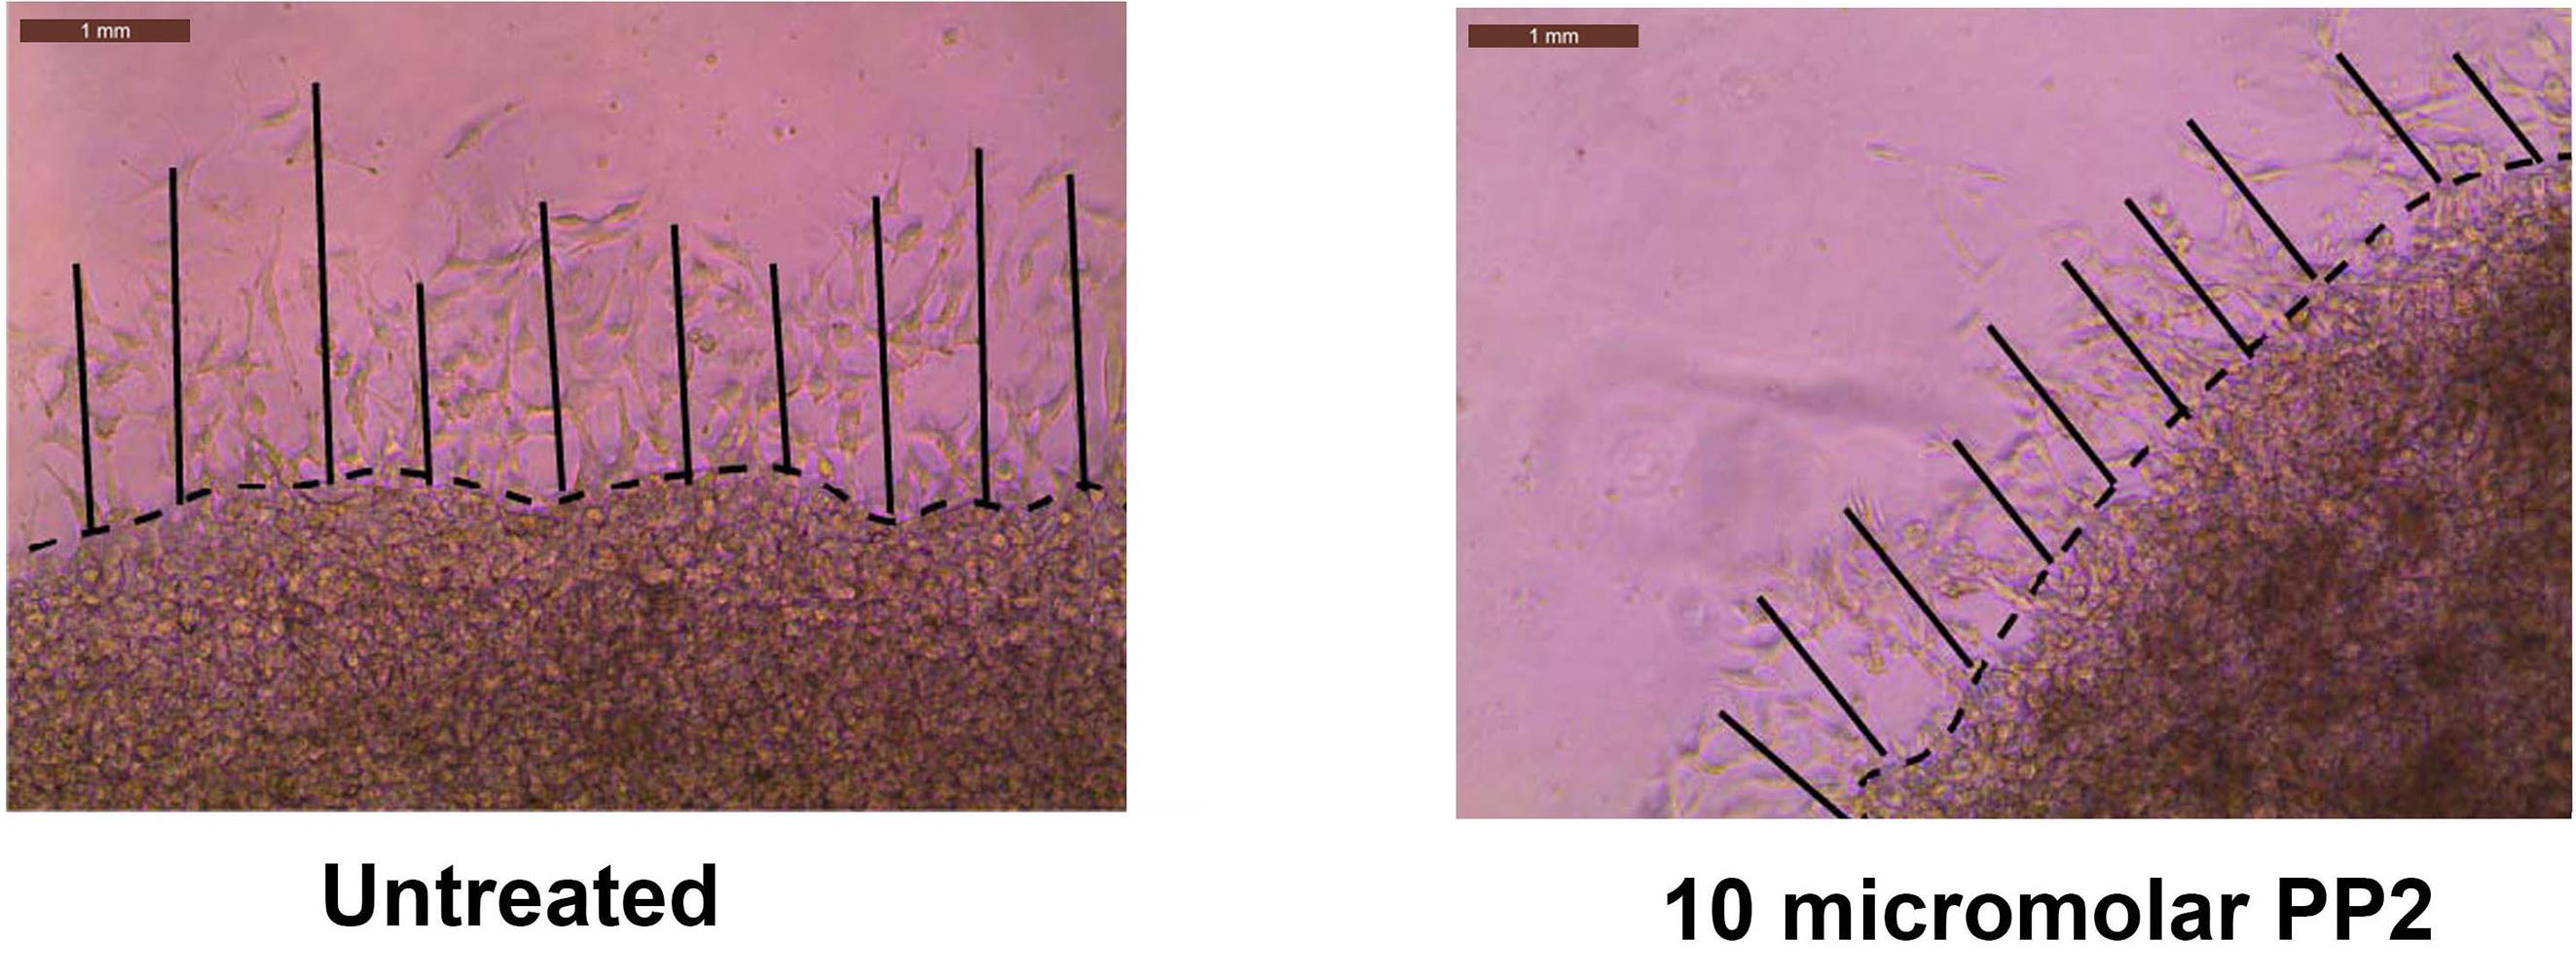
Figure 6. The image files obtained in Figure 5 are opened via ImageJ. With the help of the line tool, a set of ten lines tracing the distance that the A549 cells have invaded into the secondary Matrigel layer are drawn.Open GraphPad Prism. Using the numbers obtained by the ImageJ program, create a column graph (Figure 7). Values represented by the symbol * are statistically different relative to control (P < 0.05).
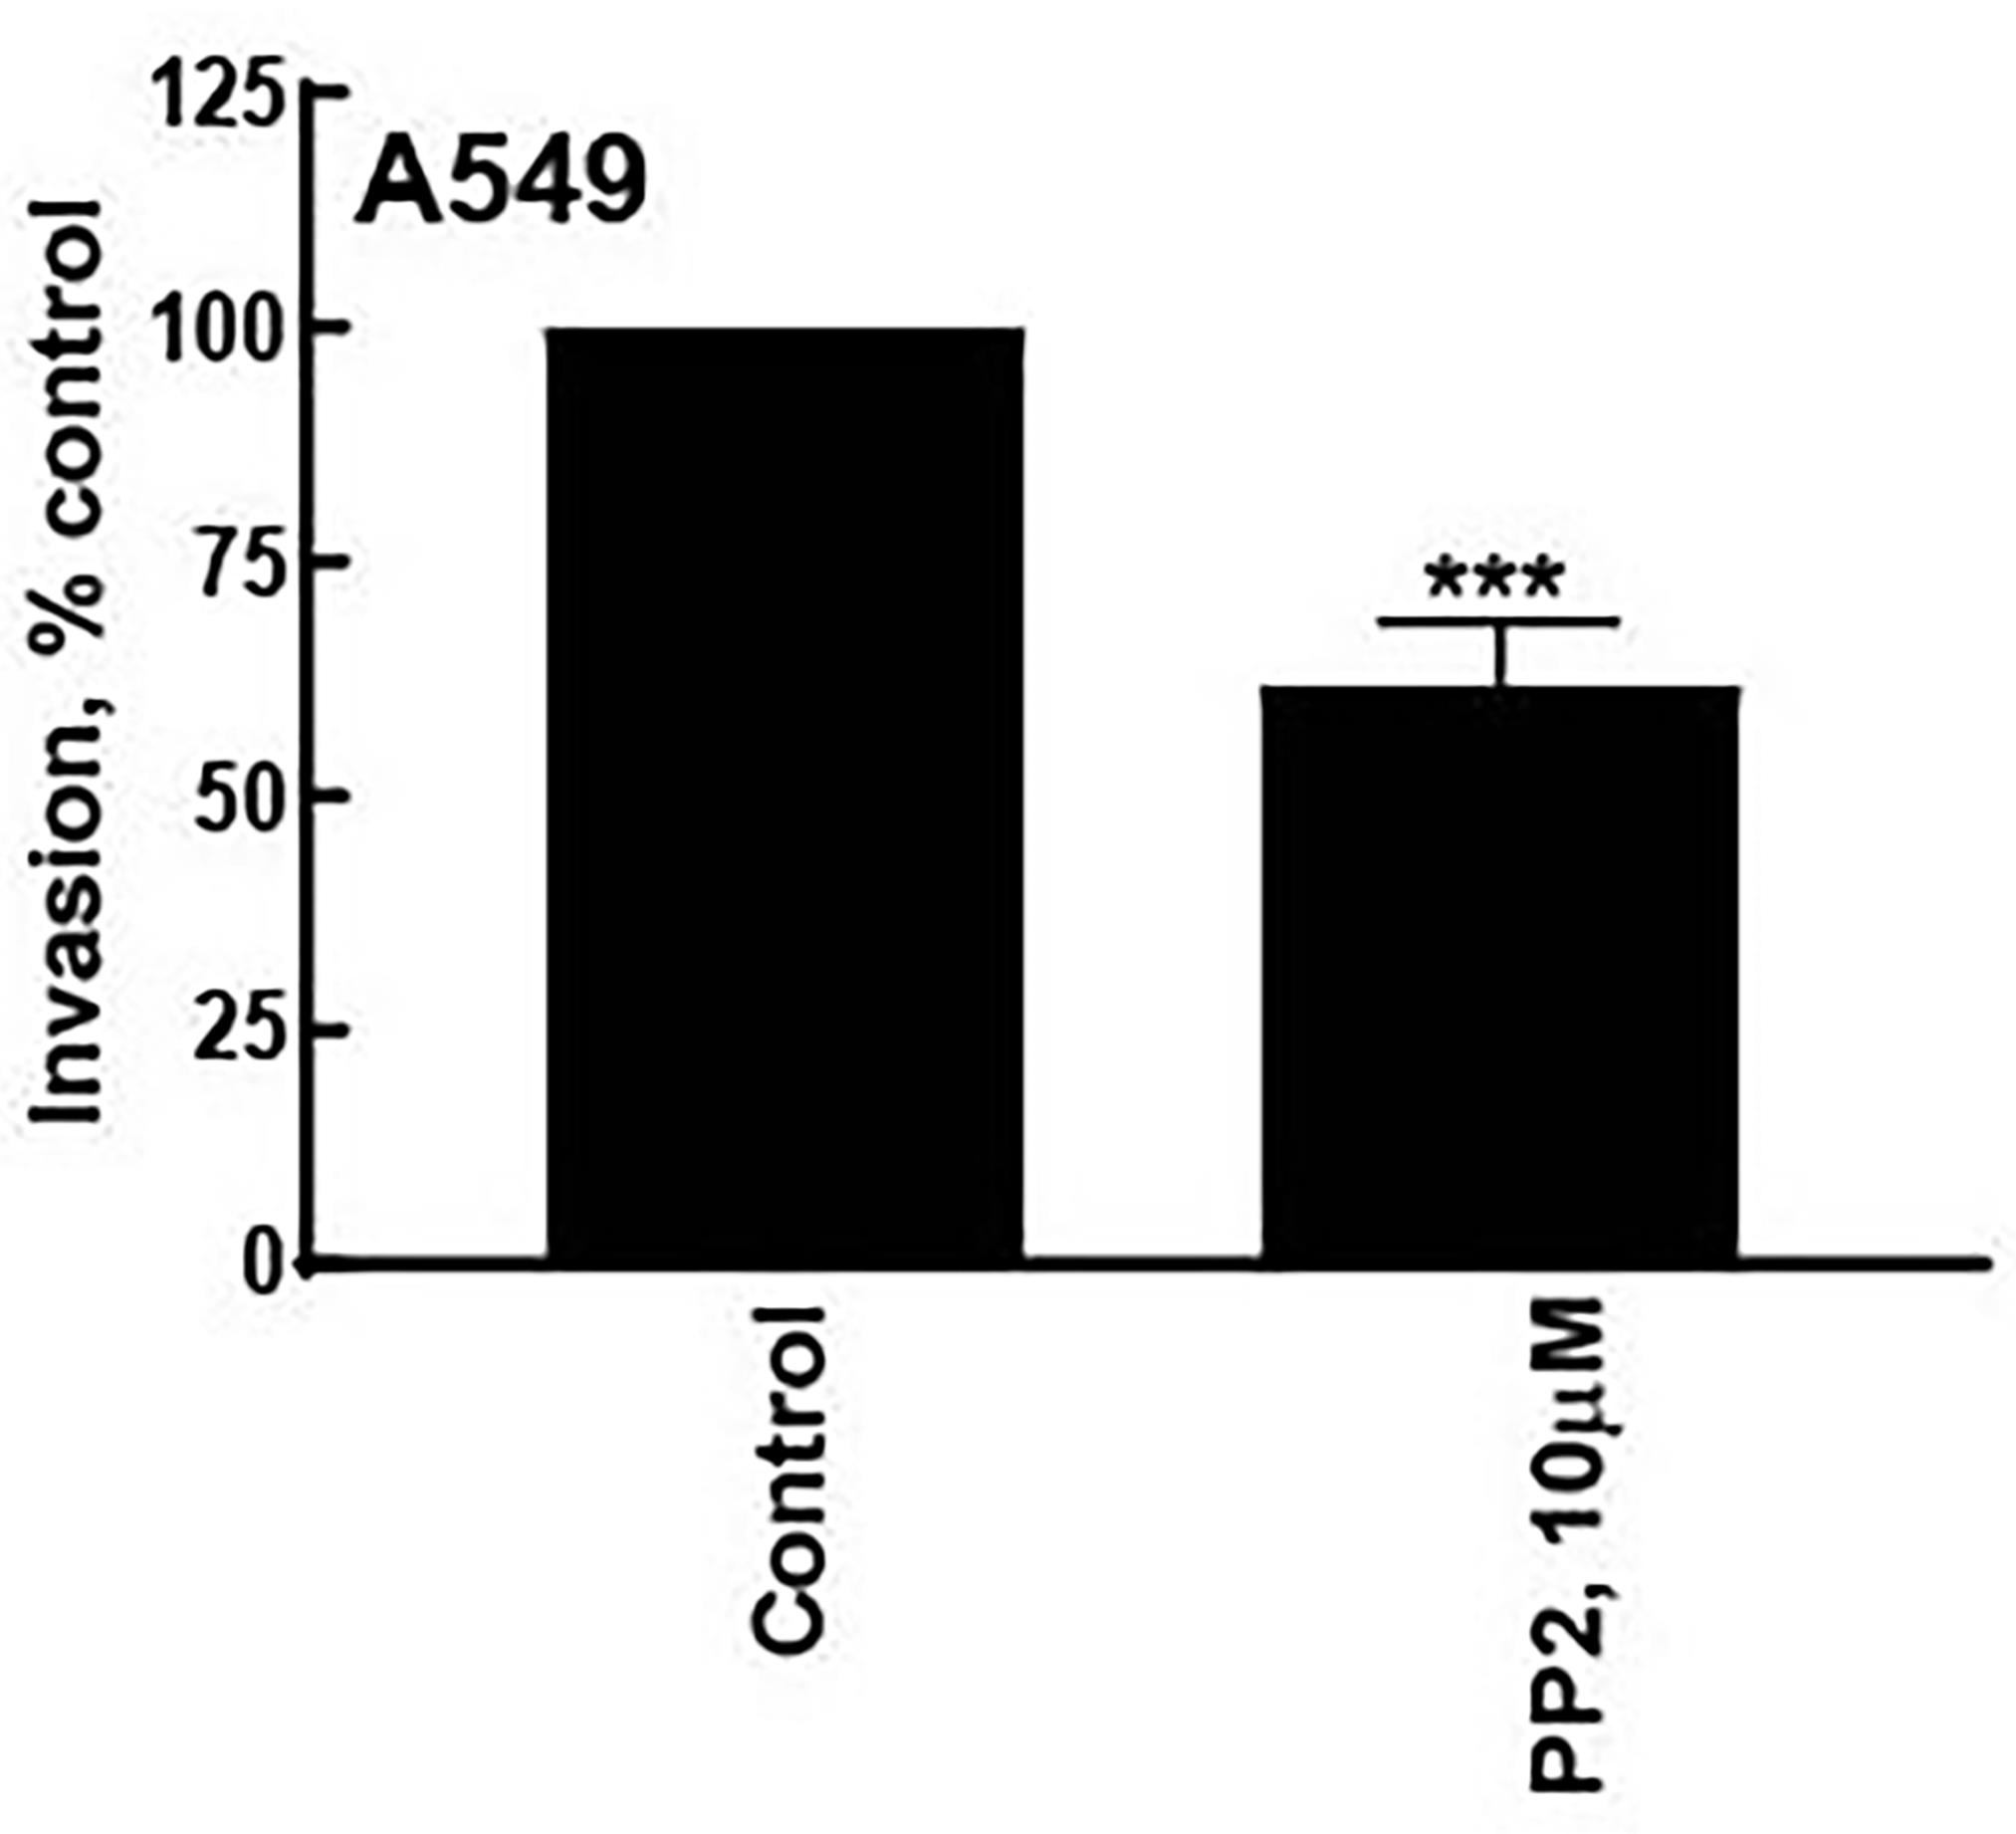
Figure 7. After quantifying the microscopy images by the ImageJ program, the data is graphed using GraphPad Prism. Vales represented by the symbol * are statistically significantly different from control (P ≤ 0.05).
Data analysis
Each sample was tested in duplicate in the SIA. The entire assay was repeated six independent times. The assay was quantified using phase-contrast microscopy. Three representative images (at 20× magnification) were captured for each sample. These images were quantified by ImageJ by three independent observers in a randomized double-blind manner. The data were graphed using GraphPad Prism (Version 8). All data were plotted as mean ± standard deviation (SD). The data were analyzed by performing an analysis of variance (ANOVA) followed by the Tukey posthoc test. All analyses were completed using a 95% confidence interval. Data were considered significant when P < 0.05. The protocol of the SIA has been published in Cell Adhesion and Migration. The link to the paper is provided below:
Hurley, J. D., Akers, A. T., Friedman, J. R., Nolan, N. A., Brown, K. C., Dasgupta, P. (2017). Non-pungent long chain capsaicin-analogs arvanil and olvanil display better anti-invasive activity than capsaicin in human small cell lung cancers.Cell Adh Migr 11(1): 80-97.
Discussion
The SIA is a novel method to measure the invasive ability of cells, growth factors, cytokines, and steroids. It can also be used to quantify the invasion-inhibitory activity of anti-metastatic drugs. A very important factor to remember in this assay is to use relevant concentrations of the drug. For example, if a very high concentration of the anti-cancer drug is used, it will kill the cells and that will also abrogate the invasion of cells into the secondary Matrigel layer. Therefore, the drugs should be used at concentrations where they do not impact the viability of cells. If the drug does not affect the viability of cells and yet it shows reduced invasion into the secondary layer, then it may be conjectured that the drug has anti-invasive activity. The results of the SIA should be confirmed by the Boyden chamber invasion assay and, based on the combined results of these two assays, we can decide whether a candidate drug displays anti-invasive activity. It is also vital to include relevant controls for the SIA. The distance invaded by the cells (in the secondary Matrigel layer) is not an absolute number; it varies upon the nature of the cell line, culture conditions, lot-lot variations in Matrigel, and the time-scale of the assay. It is essential to compare the invasion of a test sample to the control to determine if there is an effect of the process of invasion. For example, the absolute distance invaded by PP2-treated cells may vary from cell line to cell line, but it will always be lower than the pro-invasive activity of untreated cells. In our laboratory, we perform the SIA over 48 h. However, the SIA can be performed at shorter time points than 48 h. We have observed that it takes about 12-18 h for the cells to migrate from the primary layer to the secondary layer. Keeping this fact in mind, the time-frame of the assay can be adjusted accordingly.
The SIA can be performed using growth-factor-reduced Matrigel. This enables the researcher to control pro-invasive growth factors, chemokine gradients, and endogenous anti-invasive factors present in the secondary layer. This process allows the creation of specific chemokine gradients and defined tumor microenvironments in the experiment. An important question involves the use of positive and negative controls in the SIA. The process of invasion is not limited to cancer; it occurs during many normal physiological processes like wound-healing, menstruation, tissue remodeling, development, embryogenesis, and immune responses. Given the appropriate cellular signal, all cells have the ability to invade into the surrounding stroma, therefore it is not possible to identify a cell line that will not show any invasion in the SIA. It is generally observed that cancer cells display higher invasiveness compared to normal cells. With this in mind, a good positive control for the SIA is to use known pro-invasive or anti-invasive drugs, depending on the nature of the experiment.
Recipes
10 mM PP2
Molecular weight of PP2=301.78
Weigh 6 mg of PP2 in a sterile 5 mL microfuge tube. In the laminar flow hood, dissolve the PP2 in 2 mL of DMSO (Corning DMSO, Fisher MT-25950CQC). Vortex briefly to obtain 10 mM PP2. This stock solution of PP2 solution is aliquoted (as 50 µL aliquots) into microfuge tubes and stored at -20°C.
200 µM PP2
Thaw out one aliquot of PP2. Add 20 µL of PP2 in 1 mL of serum-free RPMI. Vortex vigorously. Now the concentration of PP2 is 200 µM. Use this PP2 solution as described in Section C, Step 7. Discard the remaining solution.
Acknowledgments
We acknowledge Dr. S. Chellappan and his laboratory for their continuous support. SDR is a recipient of NSF-SURE and WV-NASA Space Consortium undergraduate fellowships respectively. PD and MAV are supported by a National Institutes of Health R15 Academic Research Enhancement Award (Grants 1R15CA161491-02 and 2R15CA161491-03). MAV is also supported by NIH R15AI15197-01 and R15HL145573-01. This work was supported in part by the West Virginia IDeA Network of Biomedical Research Excellence (WV-INBRE) grant (NIH grant P20GM103434; PI: Dr. G. Rankin), the National Institute of General Medical Sciences of the National Institutes of Health under the award number P30GM122733. The protocol of SIA was based on the research papers of Evensen et al. (2013), and Stitt et al. (2005). The paper by Evensen et al. (2013) described a high throughput invasion assay to screen novel anti-cancer drugs. The published report by Stitt et al. (2005) outlines the protocol for the Matrigel Duplex assay.
Competing interests
The authors declare no competing interests.
References
- Atashzar, M. R., Baharlou, R., Karami, J., Abdollahi, H., Rezaei, R., Pourramezan, F. and Zoljalali Moghaddam, S. H. (2020). Cancer stem cells: A review from origin to therapeutic implications. J Cell Physiol 235(2): 790-803.
- Baghban, R., Roshangar, L., Jahanban-Esfahlan, R., Seidi, K., Ebrahimi-Kalan, A., Jaymand, M., Kolahian, S., Javaheri, T. and Zare, P. (2020). Tumor microenvironment complexity and therapeutic implications at a glance. Cell Commun Signal 18(1): 59.
- da Silva Siqueira, L., Majolo, F., da Silva, A. P. B., da Costa, J. C. and Marinowic, D. R. (2021). Neurospheres: a potential in vitro model for the study of central nervous system disorders. Mol Biol Rep 48(4): 3649-3663.
- Evensen, N. A., Li, J., Yang, J., Yu, X., Sampson, N. S., Zucker, S. and Cao, J. (2013). Development of a high-throughput three-dimensional invasion assay for anti-cancer drug discovery. PLoS One 8(12): e82811.
- Gandalovicova, A., Rosel, D., Fernandes, M., Vesely, P., Heneberg, P., Cermak, V., Petruzelka, L., Kumar, S., Sanz-Moreno, V. and Brabek, J. (2017). Migrastatics-Anti-metastatic and Anti-invasion Drugs: Promises and Challenges. Trends Cancer 3(6): 391-406.
- Guy, J. B., Espenel, S., Vallard, A., Battiston-Montagne, P., Wozny, A. S., Ardail, D., Alphonse, G., Rancoule, C., Rodriguez-Lafrasse, C. and Magne, N. (2017). Evaluation of the Cell Invasion and Migration Process: A Comparison of the Video Microscope-based Scratch Wound Assay and the Boyden Chamber Assay. J Vis Exp(129): 56337.
- Gunti, S., Hoke, A. T. K., Vu, K. P. and London, N. R., Jr. (2021). Organoid and Spheroid Tumor Models: Techniques and Applications. Cancers (Basel) 13(4).
- Hanke, J. H., Gardner, J. P., Dow, R. L., Changelian, P. S., Brissette, W. H., Weringer, E. J., Pollok, B. A. and Connelly, P. A. (1996). Discovery of a novel, potent, and Src family-selective tyrosine kinase inhibitor. Study of Lck- and FynT-dependent T cell activation. J Biol Chem 271(2): 695-701.
- Hurley, J. D., Akers, A. T., Friedman, J. R., Nolan, N. A., Brown, K. C. and Dasgupta, P. (2017). Non-pungent long chain capsaicin-analogs arvanil and olvanil display better anti-invasive activity than capsaicin in human small cell lung cancers. Cell Adh Migr 11(1): 80-97.
- Justus, C. R., Leffler, N., Ruiz-Echevarria, M. and Yang, L. V. (2014). In vitro cell migration and invasion assays. J Vis Exp (88): 51046.
- Pijuan, J., Barceló, C., Moreno, D. F., Maiques, O., Sisó, P., Marti, R. M., Macià, A. and Panosa, A. (2019). In vitro Cell Migration, Invasion, and Adhesion Assays: From Cell Imaging to Data Analysis. Front Cell Dev Biol 7(107). doi: 10.3389/fcell.2019.00107. eCollection 2019.
- Stitt, A. W., McGoldrick, C., Rice-McCaldin, A., McCance, D. R., Glenn, J. V., Hsu, D. K., Liu, F. T., Thorpe, S. R. and Gardiner, T. A. (2005). Impaired retinal angiogenesis in diabetes: role of advanced glycation end products and galectin-3. Diabetes 54(3): 785-794.
- Stratton, S., Shelke, N. B., Hoshino, K., Rudraiah, S. and Kumbar, S. G. (2016). Bioactive polymeric scaffolds for tissue engineering. Bioact Mater 1(2): 93-108.
- Stuelten, C. H., Parent, C. A. and Montell, D. J. (2018). Cell motility in cancer invasion and metastasis: insights from simple model organisms. Nat Rev Cancer 18(5): 296-312.
Article Information
Copyright
© 2022 The Authors; exclusive licensee Bio-protocol LLC.
How to cite
Richbart, S. D., Merritt, J. C., Moles, E. G., Brown, K. C., Adeluola, A. A., Finch, P. T., Hess, J. A., Tirona, M. T., Miles, S. L., Valentovic, M. A. and Dasgupta, P. (2022). Spherical Invasion Assay: A Novel Method to Measure Invasion of Cancer Cells. Bio-protocol 12(4): e4320. DOI: 10.21769/BioProtoc.4320.
Category
Cancer Biology > Invasion & metastasis > Cell biology assays > Cell invasion
Drug Discovery
Cell Biology > Cell movement > Cell migration
Do you have any questions about this protocol?
Post your question to gather feedback from the community. We will also invite the authors of this article to respond.