- Protocols

- Articles and Issues
- For Authors
- About
- Become a Reviewer

Developing Clinically Relevant Acquired Chemoresistance Models in Epithelial Ovarian Cancer Cell Lines
(*contributed equally to this work) Published: Vol 12, Iss 3, Feb 5, 2022 DOI: 10.21769/BioProtoc.4310 Views: 4453
Reviewed by: Giusy TornilloVishal NehruKristina AguileraTalita Diniz Melo HanchukManoj B. Menon
Original research article
The authors used this protocol in:

Feb 2021
Advertisement


Protocol Collections
Comprehensive collections of detailed, peer-reviewed protocols focusing on specific topics


Abstract
Chemoresistance, the ability of cancer cells to overcome therapeutic interventions, is an area of active research. Studies on intrinsic and acquired chemoresistance have partly succeeded in elucidating some of the molecular mechanisms in this elusive phenomenon. Hence, drug-resistant cellular models are routinely developed and used to mimic the clinical scenario in-vitro. In an attempt to identify the underlying molecular mechanisms that allow ovarian cancer cells to gradually acquire chemoresistance, we have developed isogenic cellular models of cisplatin and paclitaxel resistance (singularly and in combination) over six months, using a clinically relevant modified pulse method. These models serve as important tools to investigate the underlying molecular players, modulation in genetics, epigenetics, and relevant signaling pathways, as well as to understand the role of drug detoxification and drug influx-efflux pathways in development of resistance. These models can also be used as screening tools for new therapeutic molecules. Additionally, repurposing therapeutic agents approved for diseases other than cancer have gained significant attention in improving cancer therapy. To investigate the effect of metformin on acquirement of chemoresistance, we have also developed a combinatorial model of metformin and platinum-taxol, using two different strategies. All these models were subsequently used to study modulation in receptor tyrosine kinase pathways, cancer stem cell functionalities, autophagy, metastasis, metabolic signatures, and various biological processes during development of chemoresistance. Herein, we outline the protocols used for developing these intricate resistant cellular models.
Graphic abstract:
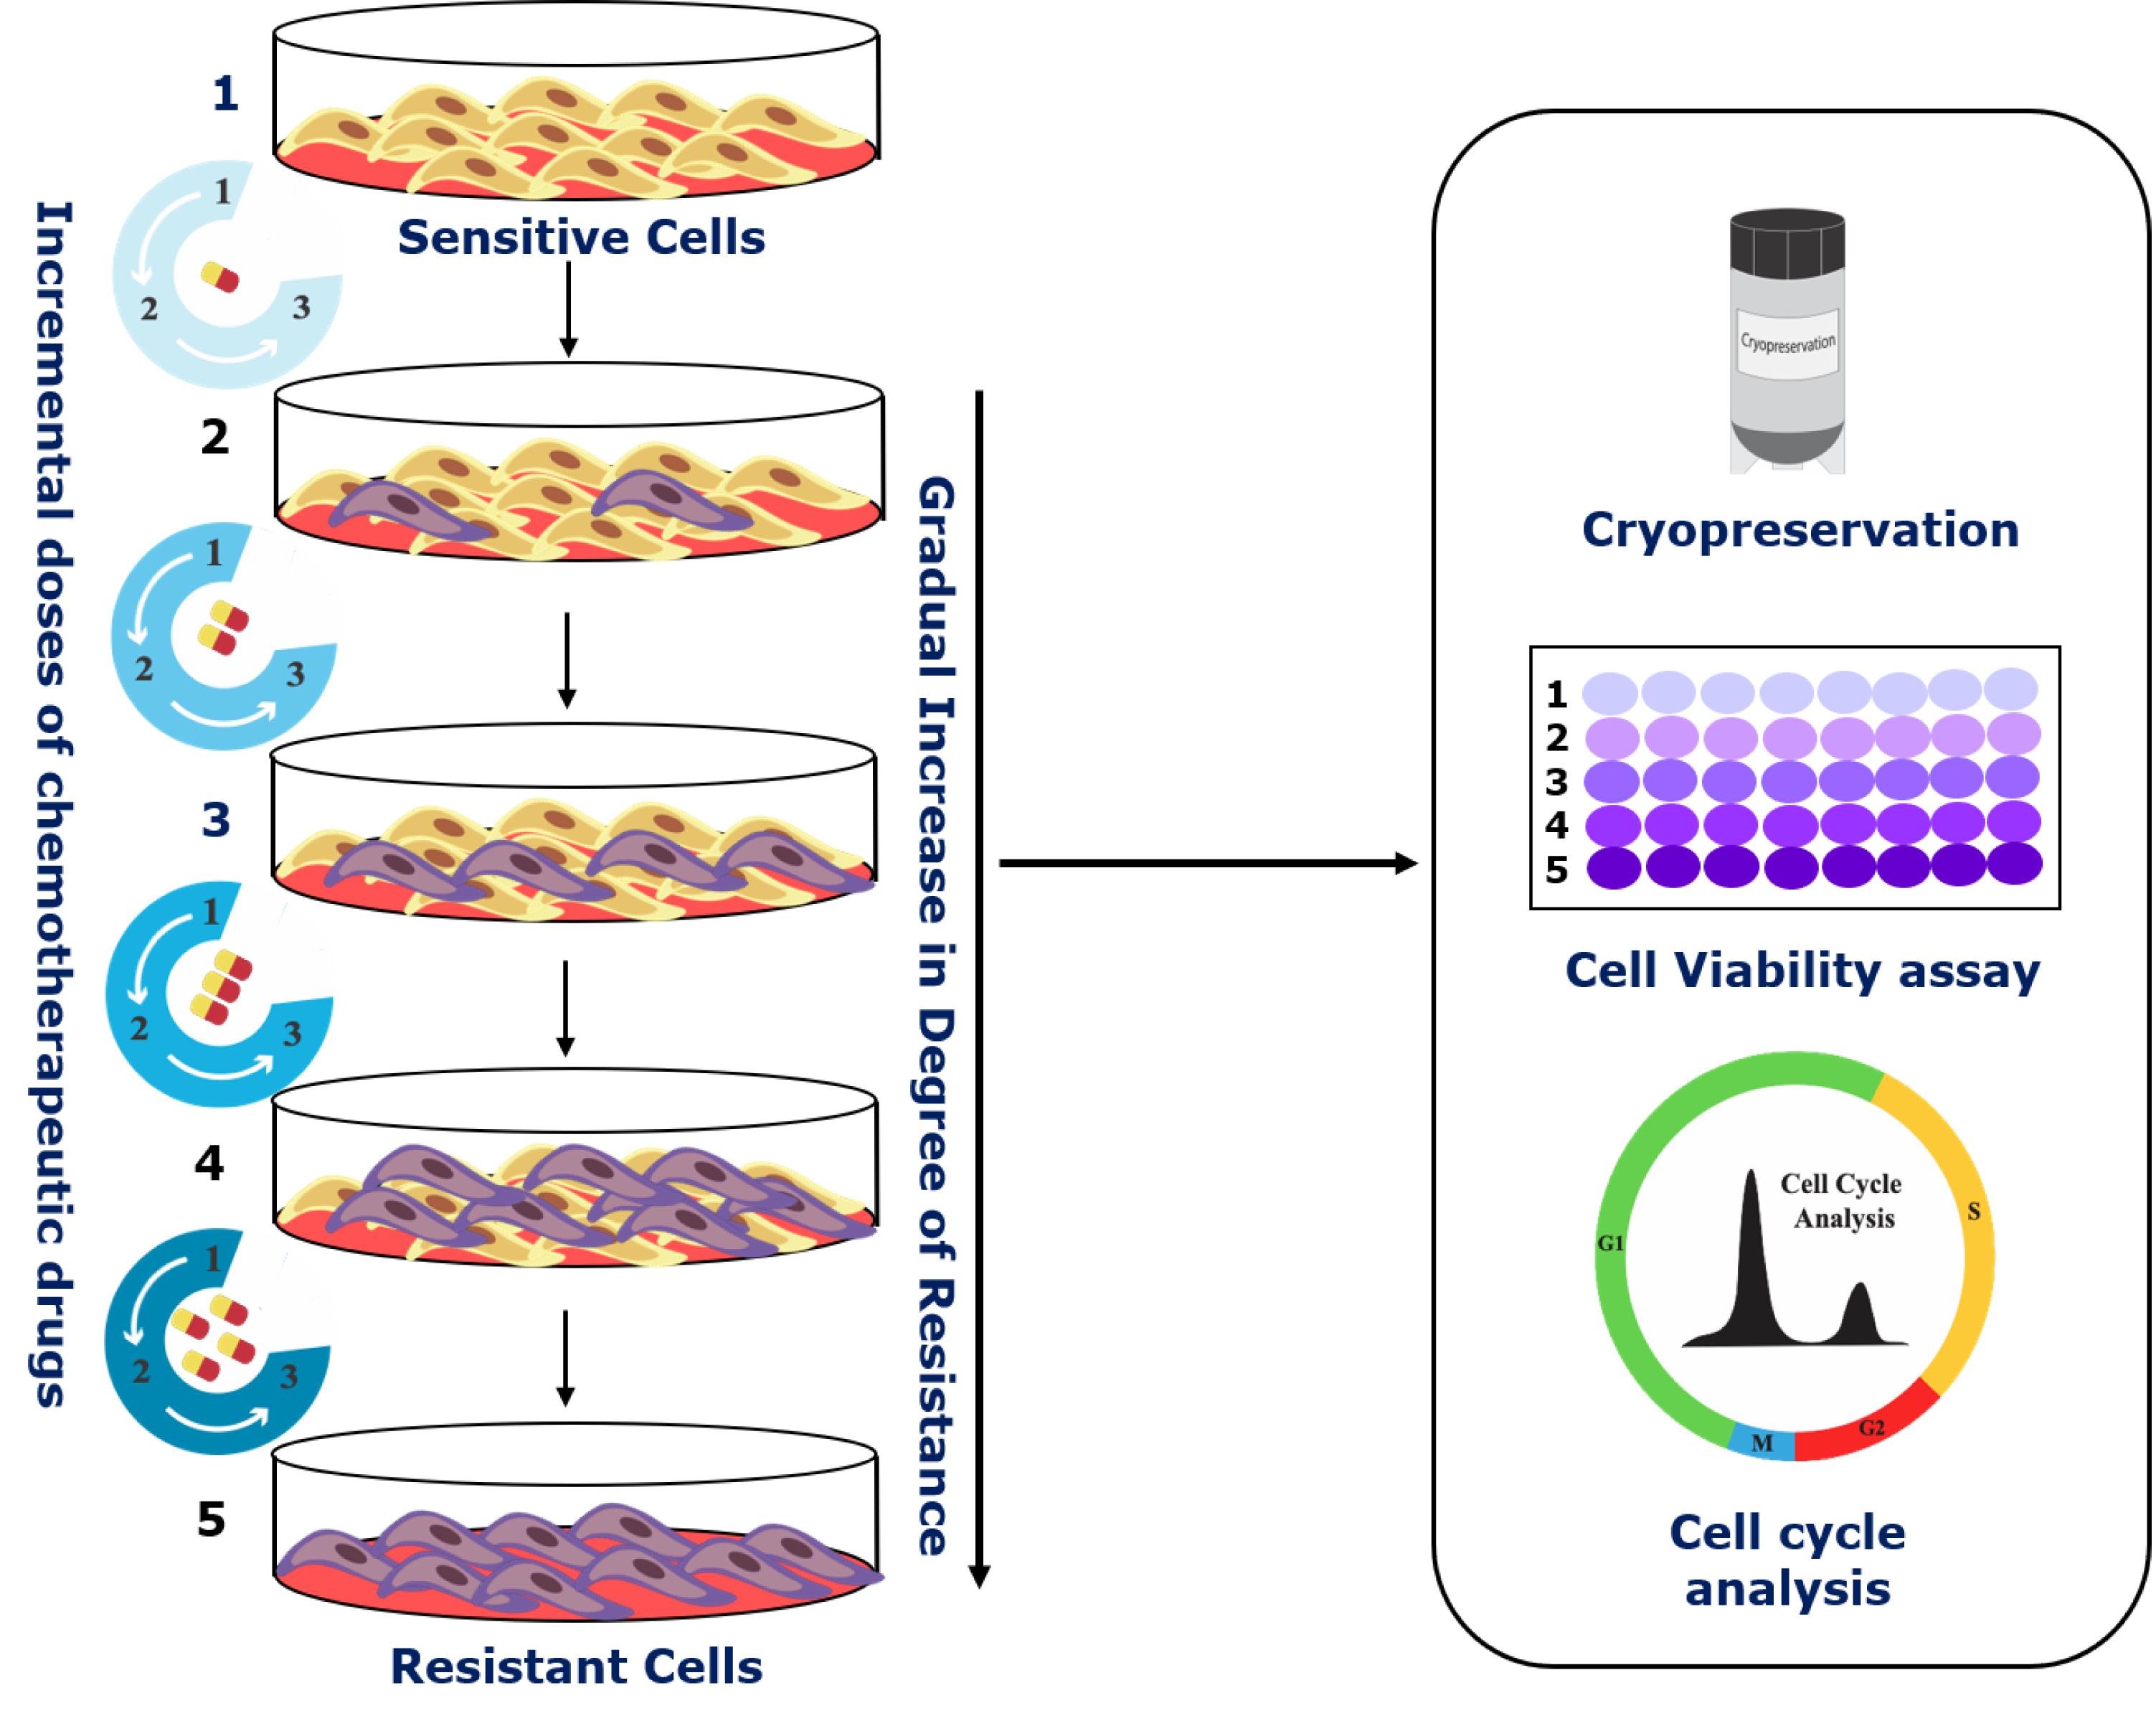
Schematic of the step-wise development of cellular chemoresistant model. Schema illustrating the modified pulse method for the development of individual and combinatorial resistant models. Two different cell lines (A2780 and OAW42) were exposed to drug treatment (either alone or in various combinations) of one concentration for three consecutive cycles (3×). Furthermore, the surviving cells were sub-cultured subsequently with increasing drug concentrations. After every treatment cycle, 50% of the cells were cryo-preserved for further experiments. Additionally, to check for the development of chemoresistance and to assess the changes in cell cycle during resistance development, cell viability assays and flow cytometry were performed.
Background
Chemoresistance is described as the ability of cancer cells to circumvent or soldier through therapeutic interventions. Studies have established the existence of a certain population of tumor cells amongst an otherwise heterogeneous milieu of cells that harbor intrinsic or gradually acquire a chemoresistance phenotype. This population of cells is considered to be a potent challenge in oncology research (Zheng, 2017). Furthermore, cases of relapse, cancer dissemination, and subsequent death can directly or indirectly be linked to chemoresistance (Yeldag et al., 2018). Even though ongoing research has improved our knowledge regarding chemoresistance, better systemic and integrative models need to be developed, to tackle this complication head-on.
Considered the deadliest amongst gynecological malignancies, identifying novel targets to combat chemoresistance is currently a significant hurdle in ovarian cancer treatment. Many molecular mechanisms have been attributed to developing resistance against the cytotoxic effects of common chemotherapeutic drugs, such as cisplatin and paclitaxel. These mechanisms comprise a diverse set of complex and often intermingling cell signaling machinery such as the PI3K/Akt/mTOR pathway (Deng et al., 2019) or Wnt/β-catenin signaling (Nguyen et al., 2019), which are deemed essential for acquiring resistance. These pathways are multifactorial and poorly understood, making their targeting ineffective. Cell lines established from EOC patients are routinely utilized to investigate the alteration in these molecular pathways post drug treatments, as well as during development of resistance.
In a clinical setting, the cells gradually begin acquiring resistance to the ongoing course of treatment by expressing specific signaling molecules. These signaling molecules allow the cells to better adapt to the external environment, thereby allowing them to survive and proliferate further. Hence, developing appropriate drug-resistant cellular models to mimic this scenario is essential to understand and discover the signaling cascades associated with chemoresistance regulation (Yan et al., 2007). Drug-resistant cell models are broadly classified into conventional and clinically relevant models. The conventional method involves incremental administration of drugs at low doses with every cycle, whereas the clinically relevant model employs a pulsed treatment, wherein the cells are allowed to grow after every treatment cycle. However, both these traditionally accepted methods have a fair share of advantages and disadvantages. The conventional method creates highly resistant cells, but the heterogeneity observed in these models makes it difficult to identify the underlying molecular players responsible for chemoresistance. Moreover, it is not clinically relevant. The clinically relevant model successfully mimics the treatment cycles administered to a patient in the clinic, but it creates low-level resistance with significantly few molecular changes, thereby making it hard to detect and study. Establishing clinically relevant drug-resistant cell lines involves treating the cells with a fixed drug dosage consistently. This is called the pulse method, and it better encapsulates the biological transition in patients of an otherwise chemo-sensitive cell into gaining chemoresistance. Additionally, the repurposing of existing non-oncology drugs has also emerged as an effective adjuvant in complementing conventional chemotherapeutic regimens (Zhang et al., 2020).
Our laboratory employs a modified version of the pulse method, wherein the parent cells are treated with multiple cycles of incremental drug doses. This leads to the development of a set of isogenic ovarian cancer cell lines resistant to cisplatin, paclitaxel, or both. Furthermore, we also checked the effect of metformin, used for type 2 diabetes treatment, on acquiring chemoresistance in combination with platinum-taxol. An increase in drug concentration after every few treatment cycles is instrumental in the selection and proliferation of only the surviving cells. The isogenic chemoresistant cells obtained from the modified pulse method reflect the clinical scenario and show high resistance indices. Additionally, they also allow the investigator to accurately identify the key molecular players responsible for attaining this chemoresistant phenotype. Though we majorly narrated our methods for A2780 and OAW42 cell lines, these methods can be adapted for any cell line of various cancer origins.
Materials and Reagents
96-well plate (Himedia, catalog number: TPP96)
Cell lines used: A780 and OAW42 cell lines (Passage 10-15) were obtained from Late Dr. Sam Gambhir’s lab, Radiology department of Stanford University, USA (STR profiling of the cells have been included in the Supplementary File).
DMEM (Gibco/Invitrogen, catalog number: 12800017)
Fetal Bovine Serum (FBS) (Himedia, catalog number: RM10409)
Penicillin-Streptomycin (Himedia, catalog number: A002)
Trypsin-EDTA (Gibco/Invitrogen, catalog number: 25200072)
DMSO (Himedia, catalog number: TC185)
Cisplatin (Sigma, catalog number: P4394)
Paclitaxel (Sigma, catalog number: T1912)
Metformin (Sigma, catalog number: PHR1084)
Superfect transfection reagent (Qiagen, catalog number: 301307)
Thiazolyl Blue Tetrazolium Bromide (Sigma, catalog number: M2128-1G)
Propidium Iodide (Sigma, catalog number: P4170)
RNase A (Sigma, catalog number: R4875)
Drug stocks (see Recipes)
Equipment
Benchtop Centrifuge (Eppendorf Centrifuge, model: 5804 R)
Incubator (Thermo Scientific, model: 3121)
Esco Class II Biological Safety Cabinet
Procedure
Overview:
A2780 and OAW42 cells were treated with paclitaxel and cisplatin individually and in combination with incrementing doses. Cell viability was measured by MTT assay at different stages, to estimate the degree of resistance. Development of each model was continued until the cells attained 80-90% viability at the IC50 dose of the sensitive cells. Morphological changes were observed as the cells gradually acquire resistance (representative images of an early and a late resistant stage of the Metformin-cisplatin-paclitaxel model are shown in Figure 1) (Video 3). FACS analysis was performed to assess the alteration in the cell cycle of resistant cells, whereby representative data of A2780 cisplatin resistant and A2780 paclitaxel resistant models are shown in Figure 2g and 2h. The late resistant cells showed significant increase in G0-G1 stage compared to A2780 sensitive cells.
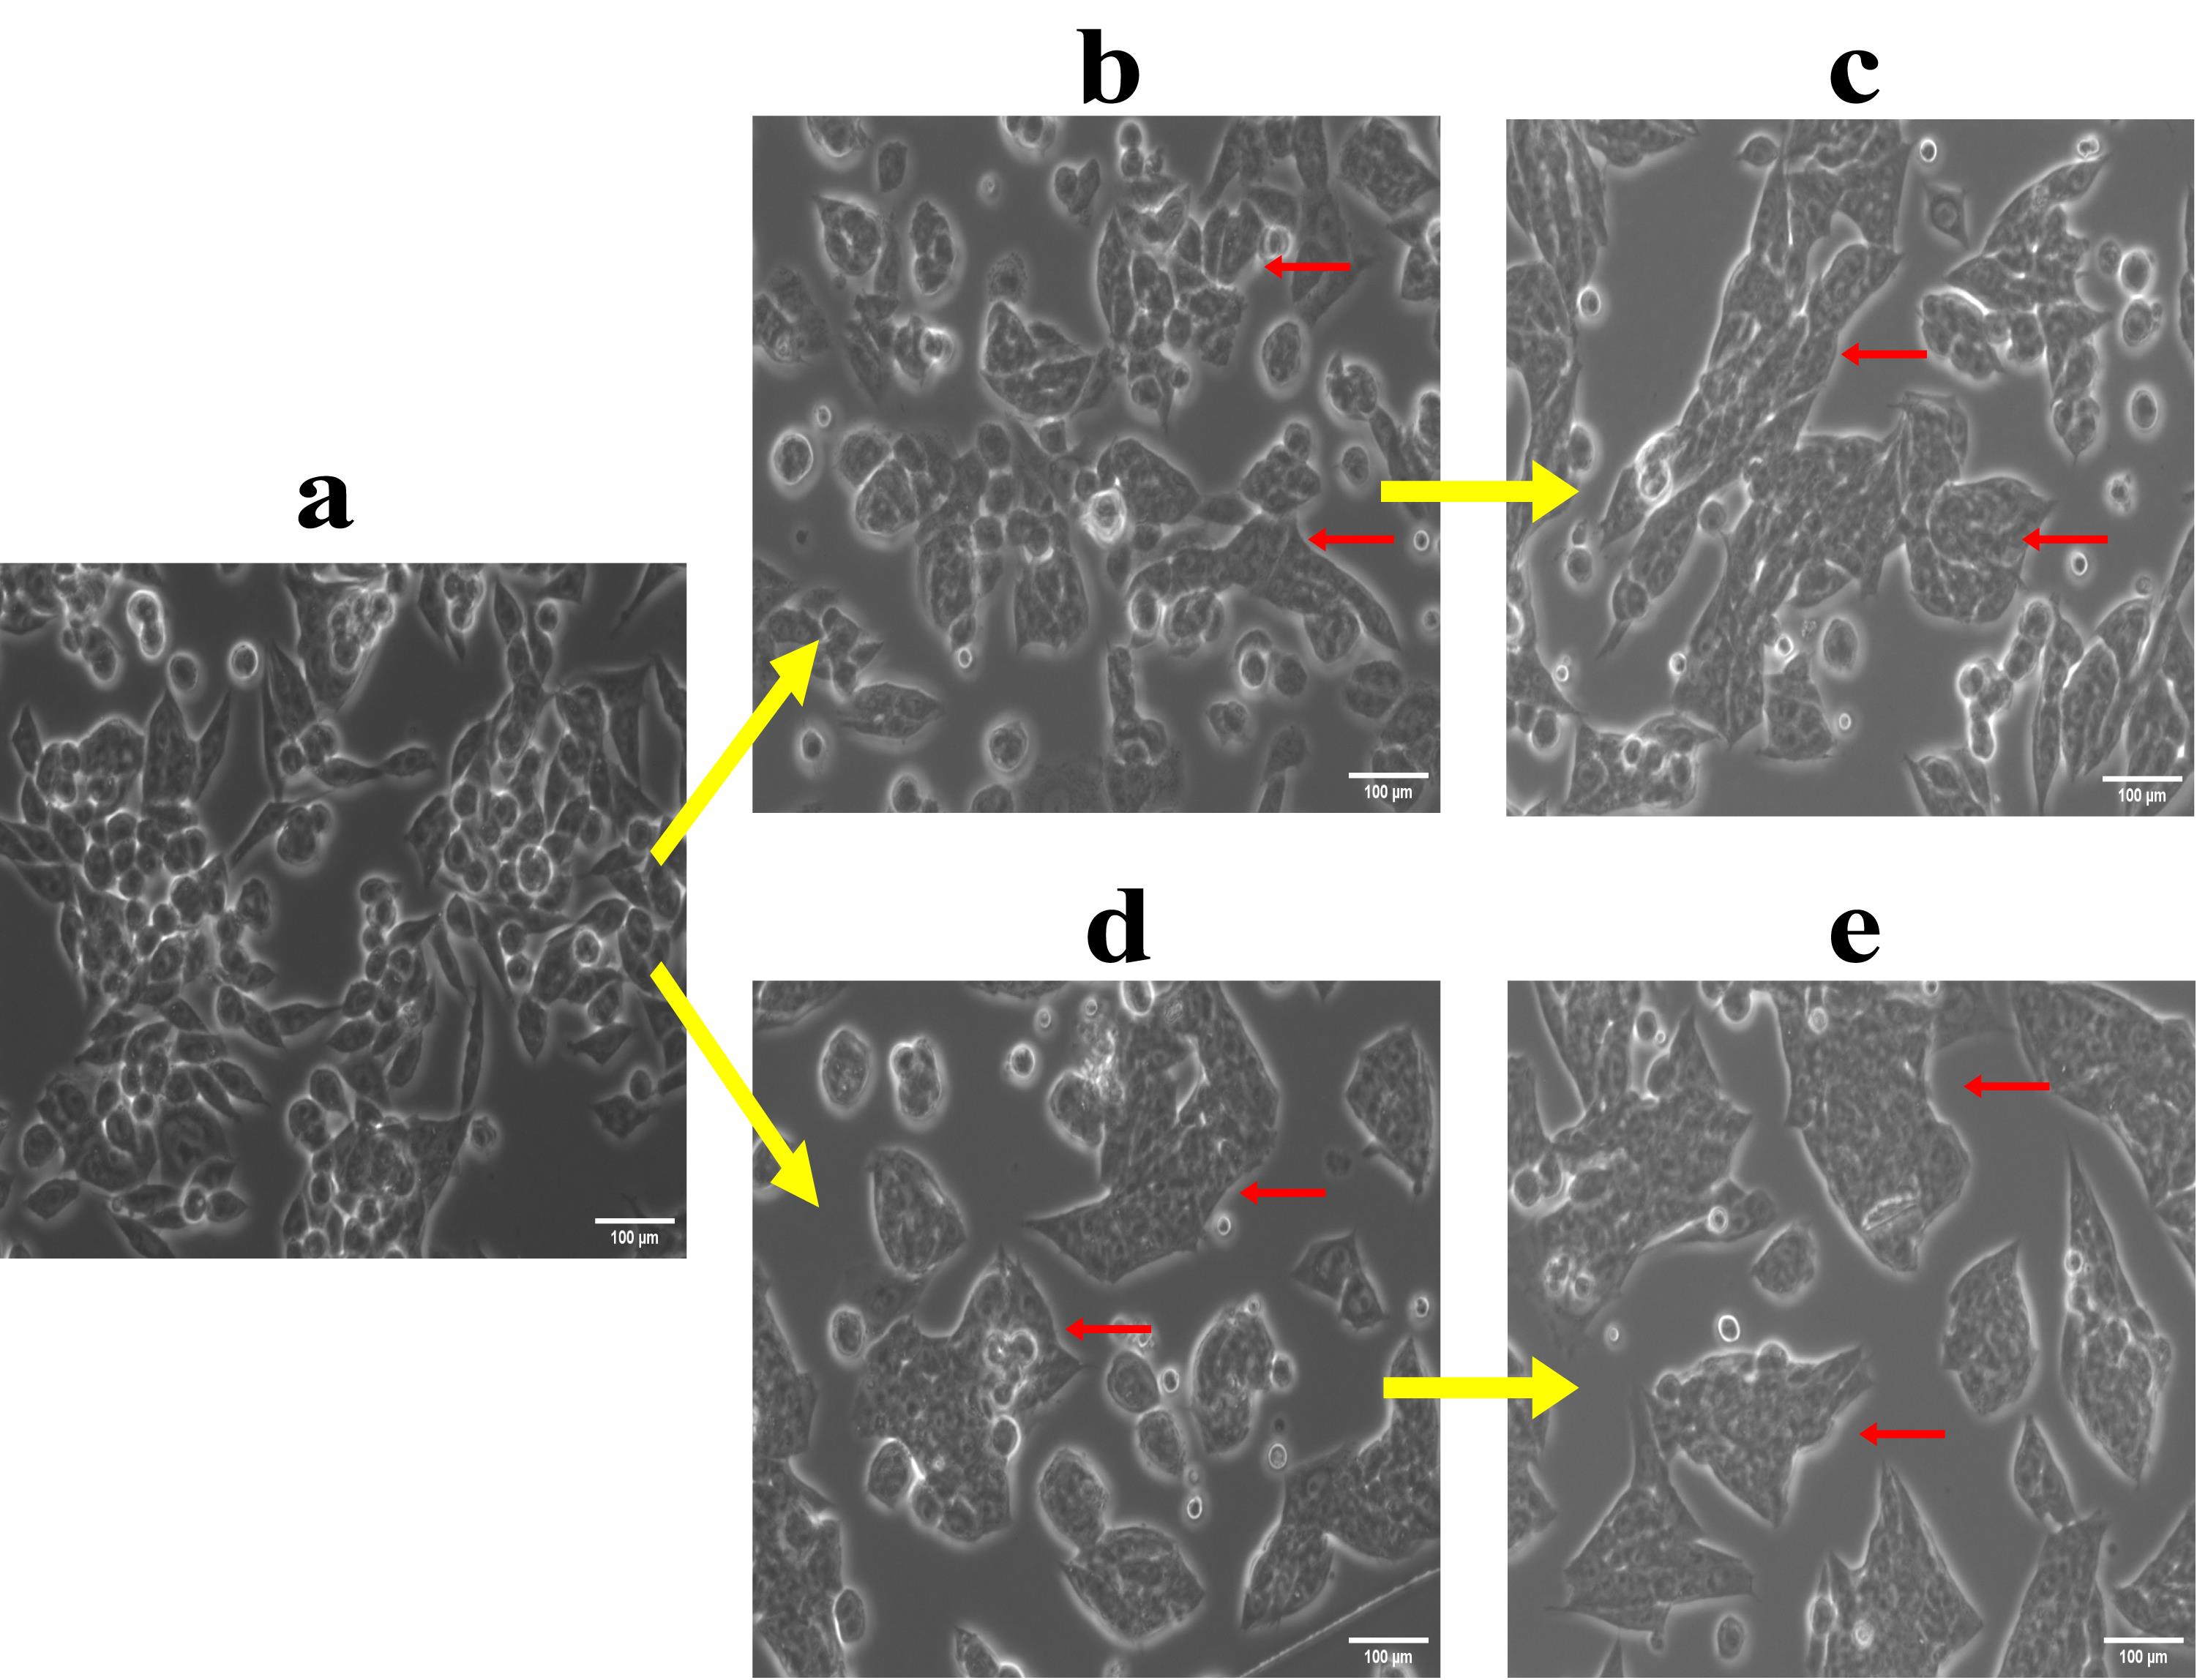
Figure 1. Morphological changes in cells during development of drug resistance. (a) A2780 sensitive cells; (b) 4th A2780 sequential Met-Cis-Pac model; (c) 15th A2780 sequential Met-Cis-Pac model; (d) 4th A2780 combinatorial Met-Cis-Pac model; (e) 15th combinatorial Met-Cis-Pac model. The arrows indicate the morphological changes observed at different stages during the acquirement of metformin sequential and combinatorial dual drug resistance. Similarly, the morphological changes have been captured in the form of a video for sensitive, early stage, and late-stage drug resistant cells in the presence and absence of drugs.

Video 1 shows cisplatin and paclitaxel dual drug resistance model in A2780 cell line. It comprises of A2780 sensitive cells, A2780 Cis-Pac treated cells, early resistant sensitive and Cis-Pac treated cells (9th stage), and late resistant sensitive and Cis-Pac treated cells (16th stage). (UT – Untreated, DT- Drug Treated)
Video 2 shows cisplatin drug resistance model in A2780 cell line. It comprises of A2780 sensitive cells, A2780 cisplatin treated cells, early resistant sensitive and cisplatin treated cells (9th stage), and late resistant sensitive and cisplatin treated cells (16th stage). (UT – Untreated, DT- Drug Treated)
Video 3 shows sequential metformin dual drug resistance model in OAW42 cell line. It comprises of OAW42 sensitive cells, OAW42 metformin-cisplatin-paclitaxel treated cells, early resistant sensitive and metformin-cisplatin-paclitaxel treated cells (9th stage), and late resistant sensitive and metformin-cisplatin-paclitaxel treated cells (13th stage). (UT – Untreated, DT- Drug Treated)
Development of chemoreistance models against single drug
A1. Paclitaxel resistant models in A2780 or OAW42 cellsDepending upon the proliferative rate of each cell line, seed 1 million A2780 or 0.5 million OAW42 cells in 100 mm dishes.
After 24 h of seeding, treat the cells with either 60 nM (for A2780) or 1.77 µM (for OAW42) of paclitaxel for 2 h, and then replace them with 4 mL of fresh media. The selection of these exact concentrations of drug for the first treatment was determined by individual IC50 value calculated for each cell line for 72 h.
Upon drug treatment, substantial cell death will be observed, which will eventually lead to individual colony formation in a few days. In our case, extensive cell death was seen for both A2780 and OAW42 cells, and individual colonies started growing after a few days. Due to the smaller size of A2780 cells, large colonies in enough numbers took 5-6 days to attain 60-70% confluence. For OAW42 cells, which are relatively larger in size, colonies started merging by three days (60-70% confluence).
Trypsinize and reseed approximately 1 million cells in a 100 mm dish for the second treatment cycle. To mimic the clinical scenario, we avoided picking up individual clones which might bear differential molecular signature and resistance index.
Apply the same dose of paclitaxel again for 2 h, followed by adding fresh media and allowing them to grow for 60-70% confluence. Again, in our case, we observed cell death and colony formation for both the cell lines.
Next, trypsinize and reseed approximately 1 million cells for the third treatment cycle of the same dose and allow them to grow in fresh growth medium. Interestingly, from the third treatment cycle onwards, both A2780 and OAW42 cells showed more homogenous growth pattern.
Once the cells attain 60-70% confluency, trypsinize the cells and freeze down 50% of them for future use. Reseed the remaining cells for next treatment at incremental doses as mentioned in the Table 1.
Table 1. Paclitaxel concentration used for each treatment cycle in A2780 and OAW42 cells.
Treatment Cycle Paclitaxel concentration for A2780 (nM) Paclitaxel concentration for OAW42 (µM) 1 60 1.17 2 60 1.17 3 60 1.17 4 100 1.17 5 100 5.85 6 100 5.85 7 150 5.85 8 150 5.85 9 150 11.71 10 200 11.71 11 200 11.71 12 200 11.71 13 350 - 14 350 - At this step, seed some cells for MTT to compare their drug sensitivity to the respective sensitive (A2780 or OAW42) cells.
For MTT, seed the cells in a 96-well plate at a density of 3,000 cells per well with total volume not exceeding 100 µL.
Treat the cells with a range of drug concentrations and incubate the plates for 72 h at 37°C in a 5% CO2 incubator.
After the incubation, treat the cells with 20 µL of 5 mg/mL MTT and incubate the plate for 3 h at 37°C in a 5% CO2 incubator.
Remove the media from each of the wells and add 100 µL of DMSO per well, to solubilize the dye.
Keep the plate in a shaker and incubate for 15 min for the dye to dissolve in DMSO. Measure the absorbance of the dye at two different wavelengths (560 nm and 670 nm). Finally, measure acquirement of resistance in comparison to the IC50 dose of the respective sensitive cells.
Note: Subtract the absorbance obtained at 560 nm from the absorbance obtained at 670 nm to negate the background absorbance arising from the presence of DMSO.
Repeat similar treatment cycles of paclitaxel with incremental doses as mentioned in Table 1 for both A2780 and OAW42 cells.
Further, perform MTT assay of the intermediate stages to validate the development of paclitaxel chemoresistance.
Note: We performedthis assay at the 6th, 12th, and 13th cycles for A2780 cells, and at the 8th, 11th, and 12th cycles for OAW42 cells (Figure 2a and 2b).
Calculate the resistance indices indicating the level of resistance acquired at different stages using the formula:
RI = IC50 value of resistant cells/IC50 value of control cells
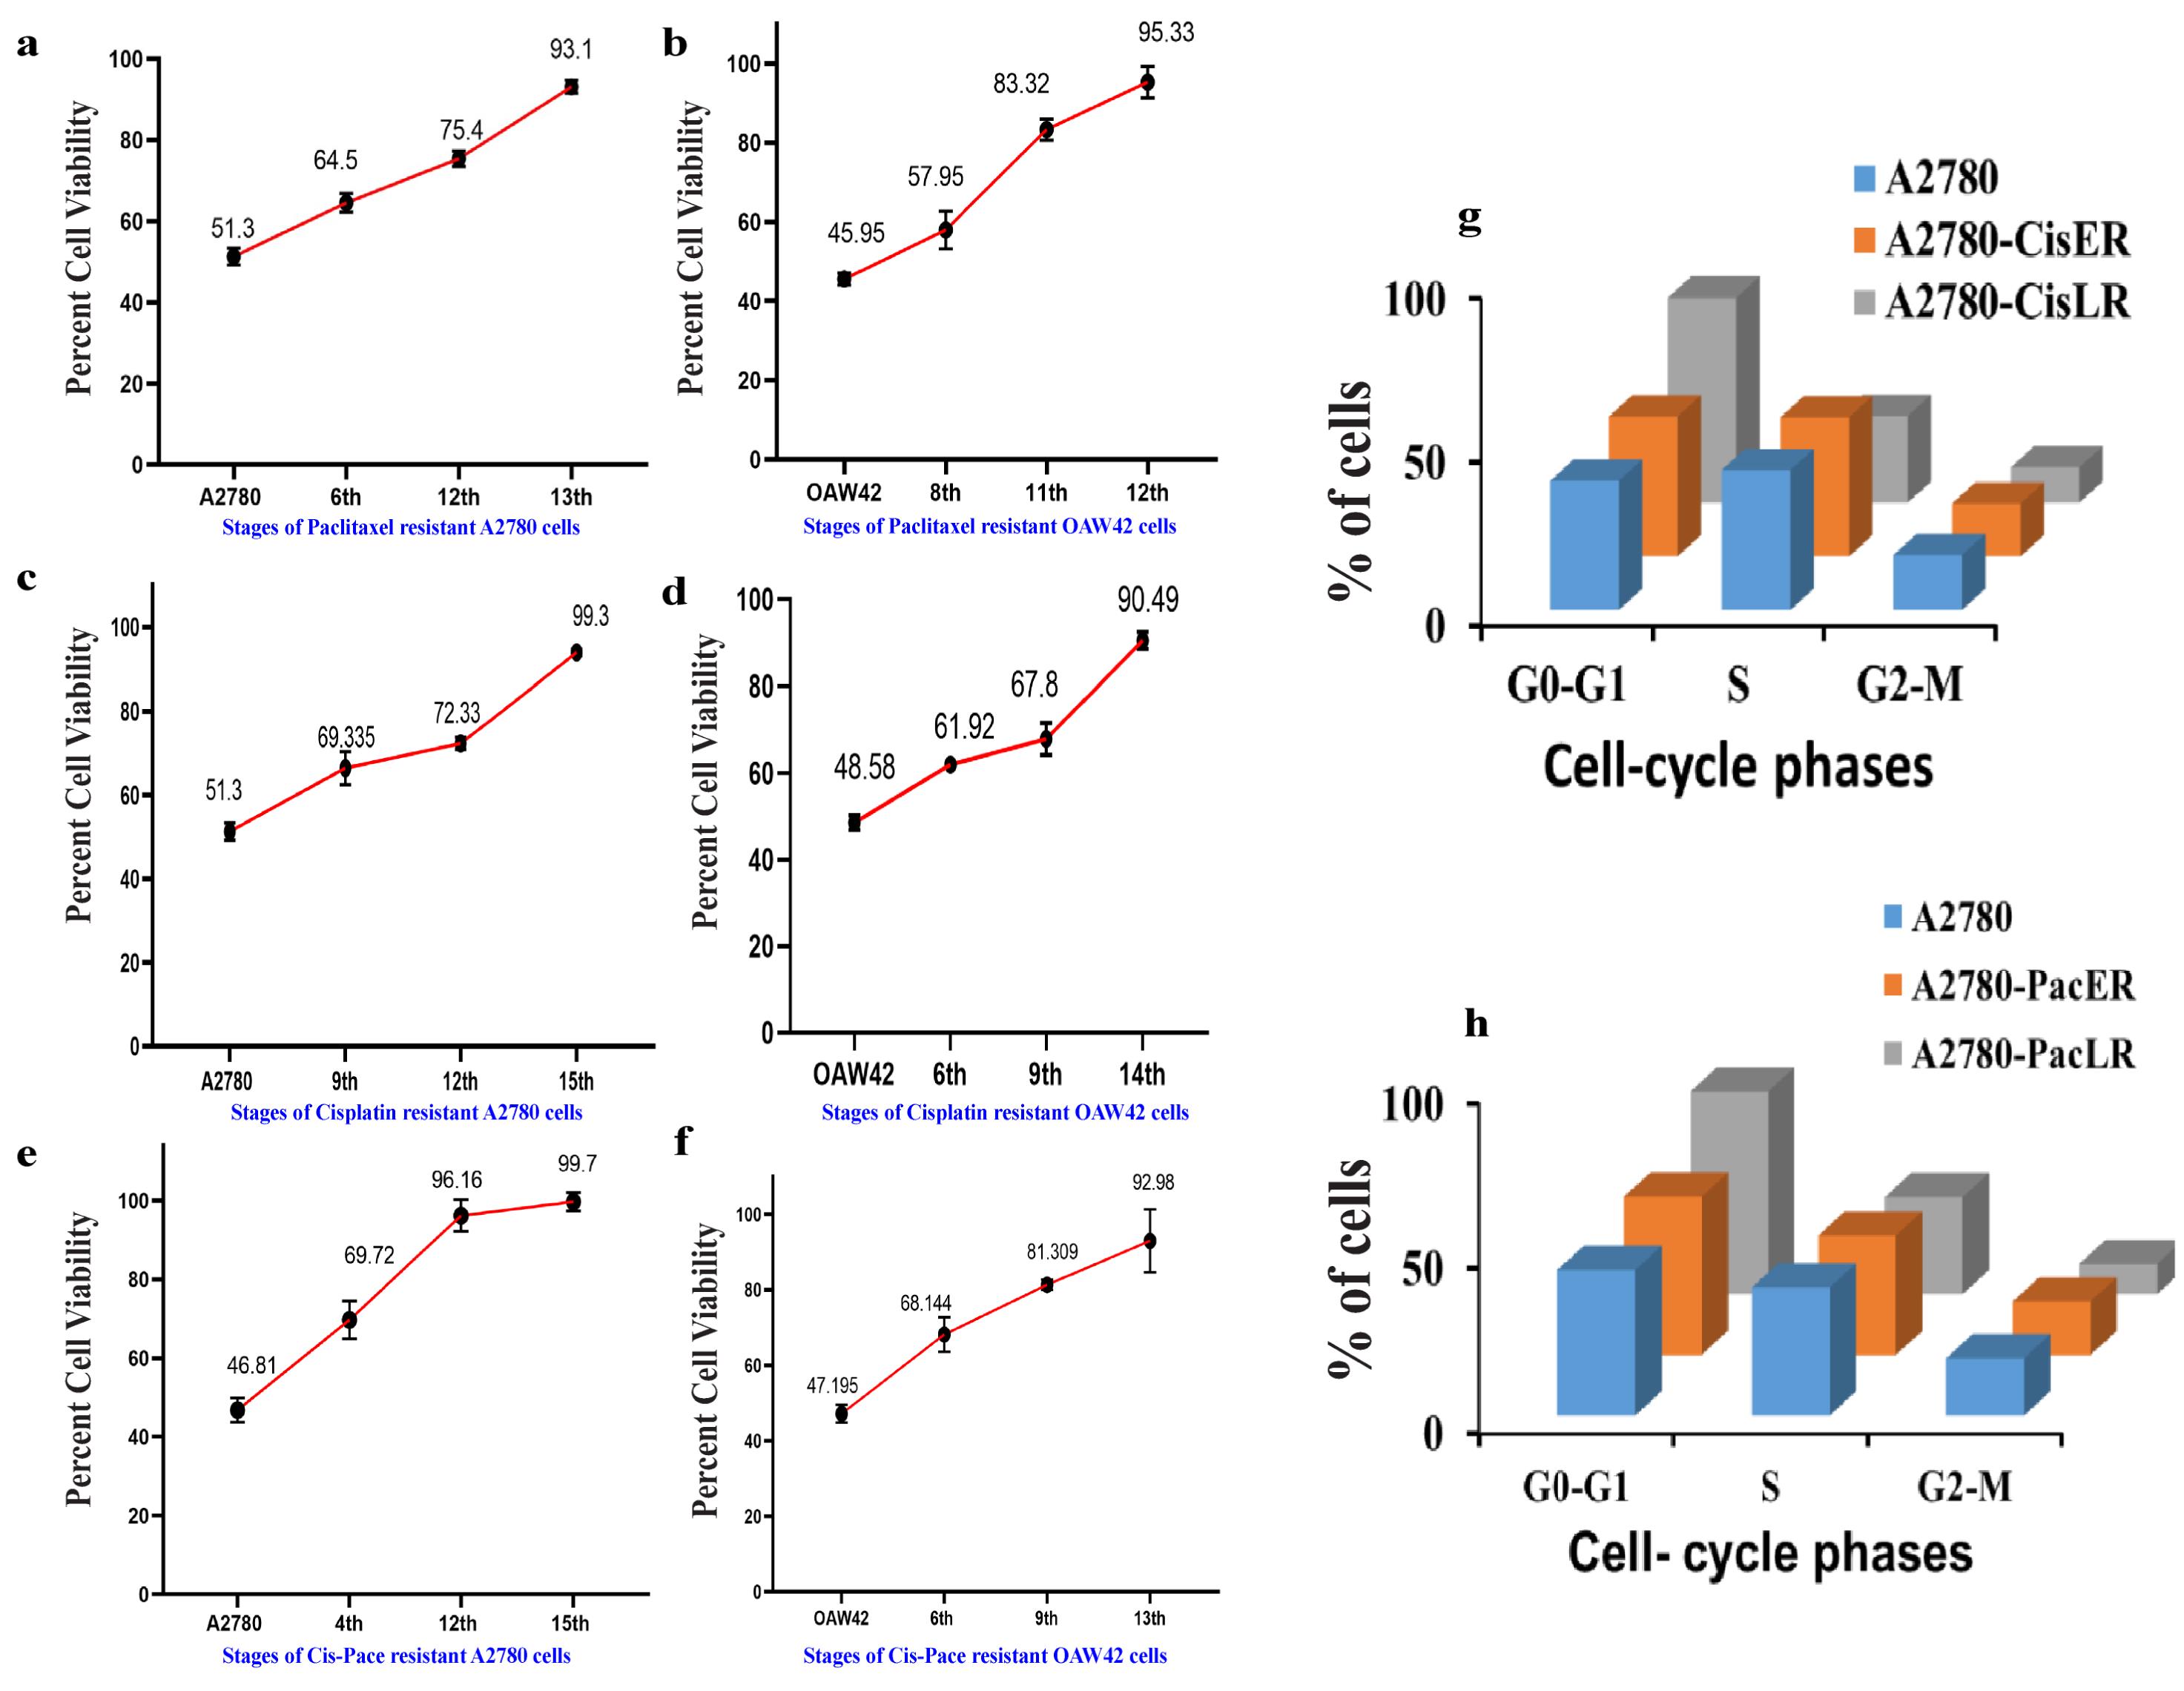
Figure 2. Cell viability assay and cell cycle analysis depicting increase in drug resistance across the different stages of A2780 and OAW42 cells. Cells were treated with IC50 values of cisplatin or paclitaxel determined for A2780 and OAW42 sensitive cells. (a) Paclitaxel resistant A2780 cells showed 93.1 % viability in the 13th stage of resistance and (b) OAW42 cells showed 95.3% viability in the 12th stage of resistance. Similarly, (c) cisplatin treated A2780 cells showed 99.3% viability in the 15th stage and (d) cisplatin treated OAW42 cells showed 90.49% cell viability in the 14th stage. A2780 shows approximately 100% cell viability in the 15th stage of Cis-Pac resistance. Similarly, for (f) OAW42 cells, cell viability was almost 92.9% in the 13th stage. (g) Cisplatin and paclitaxel late resistant A2780 cells show a significant cell cycle blockade in the G0-G1 phase, as compared to A2780 cells.A2. Cisplatin resistant models in A2780 or OAW42 cells
Seed 1 million A2780 or 0.5 million OAW42 cells in 100 mm dishes.
After 24 h of seeding, treat the cells with either 3.32 µM (for A2780) or 1.66 µM (for OAW42) of cisplatin for 2 h, and then replace with 4 mL of fresh media. The selection of these exact concentrations of drug for the first treatment was determined by individual cell line-specific IC50 values calculated for 72 h.
Upon drug treatment, substantial cell death will be observed, which will eventually lead to individual colony formation in a few days. In our case, extensive cell death was seen for both A2780 and OAW42 cells and individual colonies started growing after a few days. Due to the smaller size of A2780 cells, large colonies in enough numbers took 5-6 days to attain 60-70% confluence. For OAW42 cells, which are relatively larger in size, colonies started merging by three days (60-70% confluence).
Trypsinize and reseed approximately 1 million cells in 100 mm dish for the second treatment cycle. To mimic the clinical scenario, we avoided picking up individual clones which might bear differential molecular signature and resistance index.
Apply the same dose of cisplatin again for 2 h, followed by adding fresh media and allowing them to grow for 60-70% confluence. Again, in our case, we observed cell death and colony formation for both the cell lines.
Next, trypsinize and reseed approximately 1 million cells for the third treatment cycle of the same dose and allow them to grow in fresh growth medium. Interestingly, from this point onwards, both A2780 and OAW42 cells showed a more homogenous growth pattern.
Once the cells attain 60-70% confluency, trypsinize the cells and freeze down 50% of them for future use. Re-seed the remaining cells for the subsequent treatment at incremental doses as mentioned in the Table 2.
Table 2. Cisplatin concentration used for each treatment cycle in A2780 and OAW42 cells.
Treatment Cycle Cisplatin Concentration for A2780 (µM) Cisplatin Concentration for OAW42 (µM) 1 3.32 1.66 2 3.32 1.66 3 3.32 1.66 4 3.32 2.49 5 16.6 2.49 6 16.6 2.49 7 16.6 3.32 8 33.2 3.32 9 33.2 3.32 10 33.2 6.64 11 49.81 6.64 12 49.81 6.64 13 49.81 13.28 14 66.42 13.28 15 66.42 13.28 16 66.42 At this step, seed some cells for MTT to compare their drug sensitivity to the respective sensitive (A2780 or OAW42) cells.
For MTT, seed the cells in a 96-well plate at a density of 3000 cells per well, with total volume not exceeding 100 µL and follow the steps as mentioned in section A1.
Repeat similar treatment cycles of cisplatin with incremental doses as mentioned in Table 2 for the rest of both A2780 and OAW42 cells.
Further, perform MTT assay of the intermediate stages to check for the development of cisplatin chemoresistance.
Note: We performed MTT at 9th, 12th, and 15th cycles for A2780 cells, and at 6th, 9th, and 11th cycles for OAW42 cells (Figure 2c and 2d).
Resistance indices for different stages were calculated using the formula:
RI= IC50 value of resistant cells/IC50 value of control cells
Cisplatin and paclitaxel (Cis-Pac) combinatorial resistant model in A2780 and OAW42 cells
Seed 1 million A2780 or 0.5 million OAW42 cells in 100 mm dishes.
After 24 h of seeding, treat A2780 cells with 3.32 µM cisplatin + 60 nM paclitaxel for 2 h and OAW42 cells in 0.332 µM cisplatin + 0.05 µM paclitaxel for 4 h, and replace it with 4 mL of fresh media. To determine the IC50 dose of cisplatin in combination with paclitaxel, we prepared a range of serial dilutions surrounding the individual IC50 value of each drug and tested for both cell lines. This combinatorial IC50 dose of cisplatin+paclitaxel was used for the first treatment.
Upon drug treatment, substantial cell death will be observed, which will eventually lead to individual colony formation in a few days. In our case, extensive cell death was seen for both A2780 and OAW42 cells and individual colonies started growing after a few days. Due to the smaller size of A2780 cells, large colonies in enough numbers took 5-6 days to attain 60-70% confluence. For OAW42 cells, which are relatively larger in size, colonies started merging by three days (60-70% confluence).
Trypsinize and reseed approximately 1 million cells in 100 mm dish and for the second treatment cycle. To mimic the clinical scenario, we avoided picking up individual clones which might bear differential molecular signature and resistance index.
Apply the same dose of cisplatin and paclitaxel again for 2 h, followed by adding fresh media and allowing them to grow for 60-70% confluence. Again, in our case, we observed cell death and colony formation for both the cell lines.
Next, trypsinize and reseed approximately 1 million cells for the third treatment cycle of the same dose, and allow them to grow in fresh growth medium. Interestingly, both A2780 and OAW42 cells showed a more homogenous growth pattern.
At this step, seed some cells for MTT to compare their drug sensitivity to the respective sensitive (A2780 or OAW42) cells and perform MTT assay as mentioned in section A1.
For the remaining cells once they attain 60-70% confluency, trypsinize them and freeze down 50% of them for future use. Reseed the remaining cells for the subsequent treatment at incremental doses as mentioned in Table 2.
Repeat similar treatment cycles of cisplatin and paclitaxel with incremental doses as mentioned in Table 1 for both A2780 and OAW42 cells.
Further, perform MTT assay of the intermediate stages to monitor the development of Cis-Pac combinatorial chemoresistance.
Note: We performed MTT at 4th, 12th, and 15th cycles for A2780 cells, and at 6th, 9th, and 13th cycles for OAW42 cells (Figure 2e and 2f).
Resistance indices for different stages were calculated using the formula:
RI = IC50 value of resistant cells/IC50 value of control cells.
Table 3. Cis-Pac concentration used for each treatment cycle in A2780 and OAW42 cells.
Treatment Cycle Cisplatin Concentration
for A2780 (µM )Paclitaxel Concentration
for A2780(nM)Cisplatin concentration
for OAW42 (µM)Paclitaxel concentration
for OAW42 (µM)1 0.332 0.05 0.166 0.012 2 0.332 0.05 0.166 0.012 3 0.332 0.05 0.166 0.012 4 0.332 0.05 0.332 0.024 5 0.664 0.11 0.332 0.024 6 0.664 0.11 0.332 0.024 7 0.664 0.11 0.551 0.040 8 0.664 0.11 0.551 0.040 9 1.32 0.23 0.551 0.040 10 1.32 0.23 1.666 0.124 11 1.32 0.23 1.666 0.124 12 1.32 0.23 1.666 0.124 13 2.65 0.46 3.32 0.248 14 2.65 0.46 - - 15 2.65 0.46 - -
Metformin-Cis-Pac resistant models in A2780 or OAW42 cells
Type 2 diabetes is known to be associated with an increased risk of several cancers, including ovarian cancer. To better understand the role of metformin (the most commonly prescribed medicine for type 2 diabetes) intervention in acquiring chemoresistance, two different chemo-resistant models were developed in A2780 and OAW42 cells. Due to the lack of any existing study on this aspect, two different strategies were adapted:
i. Sequential treatment of cells with metformin for 24 h, followed by 2 h of cisplatin-paclitaxel treatment, and,
ii. Combinatorial metformin treatment along with cisplatin-paclitaxel for two hours.
Sequential Metformin dual drug/Combinatorial Metformin dual drug Resistant model in A2780 and OAW42 cells
Seed 1 million A2780 cells or 0.5 million OAW42 cells in a 100 mm dish.
For Metformin sequential treatment
Treat the cells with 2 mM metformin (IC20 concentration) for 24 h (the IC50 and IC20 concentrations of metformin were determined using MTT assay as detailed in Section A1.15 – data not shown).
Upon completing the metformin pre-treatment, treat the cells with different combinations of cisplatin and paclitaxel concentrations as narrated in Table 3 for 2 h, and replace it with 4 mL of fresh media.
For Metformin combinatorial treatment
Treat the cells with 2 mM metformin (IC20 concentration) + Cis-Pac concentrations for 2 h, as mentioned in Table 4.
Table 4. Metformin Sequential/Combinatorial drug concentration used for each treatment cycle in A2780 and OAW42 cells.
(i) Sequential Treatment – 2 mM Metformin pretreatment for 24 h followed by Cis-Pac treatments for 2 h as mentioned below. (ii) Combinatorial Treatment – 2 mM Metformin + Cis-Pac treatments for 2 h.
Treatment Cycle Cisplatin concentration
for A2780 (µM)Paclitaxel concentration
for A2780 (µM)Cisplatin concentration
for OAW42 (µM)Paclitaxel concentration
for OAW42 (µM)1 0.332 0.05 0.166 0.012 2 0.332 0.05 0.166 0.012 3 0.332 0.05 0.166 0.012 4 0.332 0.05 0.332 0.024 5 0.664 0.11 0.332 0.024 6 0.664 0.11 0.332 0.024 7 0.664 0.11 0.551 0.040 8 0.664 0.11 0.551 0.040 9 1.32 0.23 0.551 0.040 10 1.32 0.23 1.666 0.124 11 1.32 0.23 1.666 0.124 12 1.32 0.23 1.666 0.124 13 2.65 0.46 3.32 0.248 14 2.65 0.46 - - 15 2.65 0.46 - - Grow the cells until they attain more than 60-70% confluency before the 2nd dose. For this model, moderate cell death with homogenous growth was observed after the 1st treatment.
Repeat the second treatment cycle as mentioned above depending on the model, replace the drugs with 4 mL of fresh media, and incubate the cells until they attain 60-70% confluency. Again, homogenous growth with moderate cell death was observed for both cell lines.
Trypsinize the cells and freeze down 50% of the cells for future use, and re-seed the remaining cells for the next treatment cycle in a 100 mm dish.
Seed some cells for MTT assay and perform MTT as described in section A1.
For the successive treatment cycles, repeat the steps keeping the metformin dose constant but incrementally increasing the concentrations of Cis-Pac, as mentioned in Table 4.
Repeat the successive treatment cycles for the development of MSLR and MCLR models, by keeping the metformin dose constant but incrementally increasing the concentrations of Cis-Pac, as mentioned in Table 4.
Further, perform MTT assay of the intermediate stages to monitor the development of resistance in the sequential and combinatorial metformin dual drug resistant models.
Note: We performed MTT assay at 4th, 12th, and 15th cycles for A2780 cells, and at 6th, 9th, and 13th cycles for OAW42 cells (Figure 3a, 3b, 3c, and 3d).
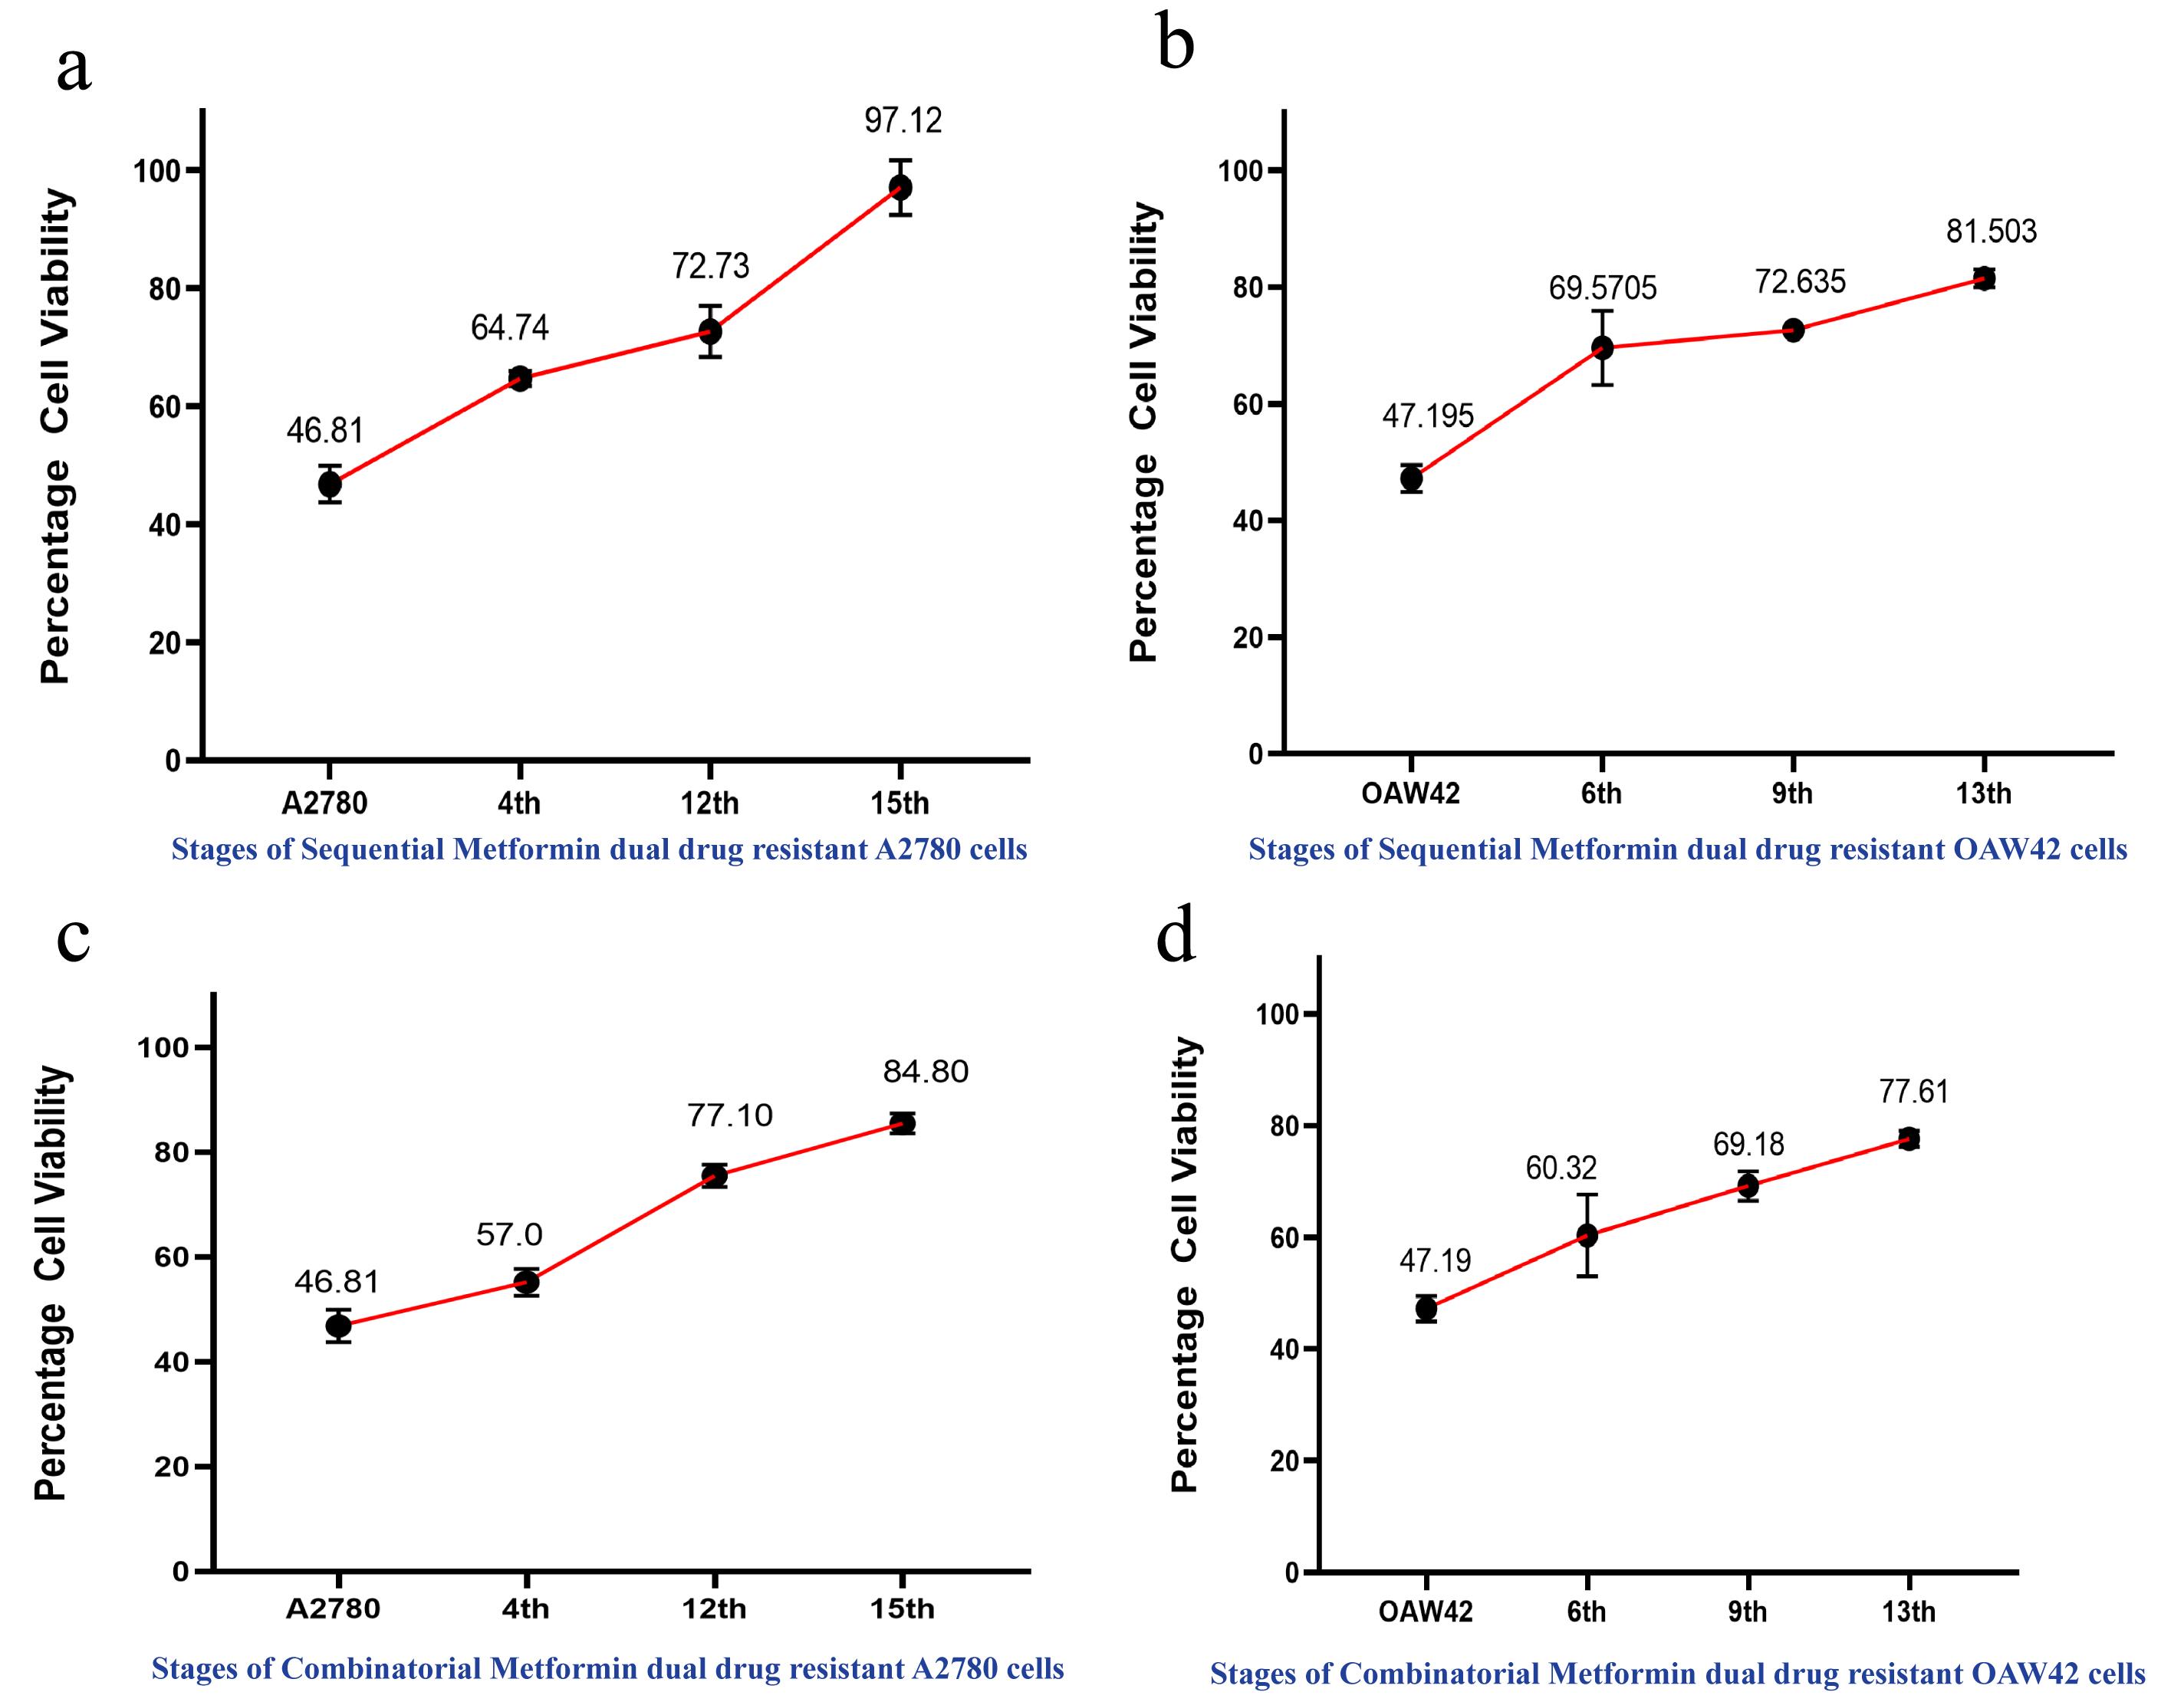
Figure 3. Cell viability assay depicting increase in drug resistance across the different stages of A2780 and OAW42 cells. Cells were treated with combination IC50 values of cisplatin and paclitaxel. (a) In case of sequential metformin dual drug resistant A2780 cells, 97.12% cell viability was observed in the 15th stage and (b) OAW42 cells showed 81.5% cell viability in the 13th stage. Similarly, (c) in case of metformin-cisplatin-paclitaxel resistant A2780 cells, 84.80% cell viability was observed in the 15th stage, and d. OAW42 cells showed 77.6% cell viability in the 13th stage.APPLICATION:
The development of the abovementioned chemo-resistant models has led us to comprehend the differential modulations of various key molecules in the early vs. late stages of chemoresistance. Our study demonstrated that the early resistant (cisplatin, or paclitaxel, or Cis-Pac) cells possess upregulated insulin-like growth factor receptor (IGF1R) expression, which declines at late resistant stages (Singh et al., 2014; Dhadve et al., 2020). The late resistant model showed high AKT activation for both the cell lines, irrespective of the nature of the drugs. Such pulsatory nature of IGF1R signaling regulates the differential level of cancer stem cell population, and their functionalities and differential autophagic flux at different stages of resistance (Singh et al., 2016; Bishnu et al., 2021). Using these models, we have also shown the ability of metformin to act as a chemosensitizer, leading to the impediment of chemoresistance by reducing the cancer stem cell-like population (Bishnu et al., 2019). We believe that these chemo-resistant models have wide potential to study intricate molecular signatures and assess the therapeutic relevance of molecules that can be selectively targeted at different stages of chemoresistance, and can also be widely adapted to other cancer cell lines.
Recipes
Drug Stock Concentrations and Storage Instructions:
Cisplatin: Freshly prepare 33.3 mM (10 µg/µL) stock solution in DMSO at the time of treatment.
Paclitaxel: Prepare 11.71 mM (10 µg/µL) stock solution in DMSO and store in -20°C.
Metformin: Prepare 1 M stock solution in DMEM and store in 4°C.
Acknowledgments
PS and SC acknowledge TMC-ACTREC for fellowship. PR acknowledges ACTREC-TMC for funding.
Competing interests
The authors declare no conflicts of interest or competing interests.
References
- Bishnu, A., Phadte, P., Dhadve, A., Sakpal, A., Rekhi, B. and Ray, P. (2021). Molecular imaging of the kinetics of hyperactivated ERK1/2-mediated autophagy during acquirement of chemoresistance. Cell Death Dis 12(2): 161.
- Bishnu, A., Sakpal, A., Ghosh, N., Choudhury, P., Chaudhury, K. and Ray, P. (2019). Long term treatment of metformin impedes development of chemoresistance by regulating cancer stem cell differentiation through taurine generation in ovarian cancer cells. Int J Biochem Cell Biol 107: 116-127.
- Deng, J., Bai, X., Feng, X., Ni, J., Beretov, J., Graham, P. and Li, Y. (2019). Inhibition of PI3K/Akt/mTOR signaling pathway alleviates ovarian cancer chemoresistance through reversing epithelial-mesenchymal transition and decreasing cancer stem cell marker expression. BMC Cancer 19(1): 618.
- Dhadve, A. C., Hari, K., Rekhi, B., Jolly, M. K., De, A. and Ray, P. (2020). Decoding molecular interplay between RUNX1 and FOXO3a underlying the pulsatile IGF1R expression during acquirement of chemoresistance. Biochim Biophys Acta Mol Basis Dis 1866(6): 165754.
- Nguyen, V. H. L., Hough, R., Bernaudo, S. and Peng, C. (2019). Wnt/beta-catenin signalling in ovarian cancer: Insights into its hyperactivation and function in tumorigenesis. J Ovarian Res 12(1): 122.
- Singh, R. K., Gaikwad, S. M., Jinager, A., Chaudhury, S., Maheshwari, A. and Ray, P. (2014). IGF-1R inhibition potentiates cytotoxic effects of chemotherapeutic agents in early stages of chemoresistant ovarian cancer cells. Cancer Lett 354(2): 254-262.
- Singh, R. K., Dhadve, A., Sakpal, A., De, A. and Ray, P. (2016). An active IGF-1R-AKT signaling imparts functional heterogeneity in ovarian CSC population. Sci Rep 6: 36612.
- Yan, X. D., Li, M., Yuan, Y., Mao, N. and Pan, L. Y. (2007). Biological comparison of ovarian cancer resistant cell lines to cisplatin and Taxol by two different administrations. Oncol Rep 17(5): 1163-1169.
- Yeldag, G., Rice, A. and Del Río Hernández, A. (2018). Chemoresistance and the Self-Maintaining Tumor Microenvironment. Cancers (Basel) 10(12).
- Zheng, H. C. (2017). The molecular mechanisms of chemoresistance in cancers. Oncotarget 8(35): 59950-59964.
- Zhang, Z., Zhou, L., Xie, N., Nice, E. C., Zhang, T., Cui, Y. and Huang, C. (2020). Overcoming cancer therapeutic bottleneck by drug repurposing. Signal Transduct Target Ther 5(1): 113.
Article Information
Copyright
© 2022 The Authors; exclusive licensee Bio-protocol LLC.
How to cite
Shenoy, P. S., Chakraborty, S., Gaikwad, S. M., Sakpal, A. and Ray, P. (2022). Developing Clinically Relevant Acquired Chemoresistance Models in Epithelial Ovarian Cancer Cell Lines. Bio-protocol 12(3): e4310. DOI: 10.21769/BioProtoc.4310.
Category
Cancer Biology > Cancer biochemistry > Drug resistance
Cell Biology > Cell isolation and culture
Do you have any questions about this protocol?
Post your question to gather feedback from the community. We will also invite the authors of this article to respond.