- Protocols

- Articles and Issues
- For Authors
- About
- Become a Reviewer

Measuring Oligonucleotide Hydrolysis in Cellular Lysates via Viscosity Measurements
Published: Vol 12, Iss 2, Jan 20, 2022 DOI: 10.21769/BioProtoc.4304 Views: 2662
Reviewed by: Alba BlesaMiaowei Marwell MaoAnonymous reviewer(s)
Original research article
The authors used this protocol in:
Sep 2020
Advertisement


Protocol Collections
Comprehensive collections of detailed, peer-reviewed protocols focusing on specific topics


Abstract
Cell lysis, a process that releases host oligonucleotides, is required in many biotechnological applications. However, intact oligonucleotides in crude cellular lysates increase the viscosity of lysates, which complicates downstream processes and routine laboratory workflows. To address this, nucleases that hydrolyze the intact oligonucleotides are commonly added, either as purified enzymes or co-expressed in genetically engineered bacterial strains. To measure oligonucleotide hydrolysis, common DNA quantification methods, such as qPCR or fluorescence-based, require expensive reagents and equipment, and cannot distinguish different-sized DNA fragments. Here, we outline a simple alternative method for measuring DNA/RNA hydrolysis in cellular lysates, by measuring their viscosity. This method only requires common laboratory supplies and a cell phone camera.
Background
Many biotechnological applications, such as recombinant protein purification, require lysing the cells releasing host oligonucleotides in the process. However, intact oligonucleotides in crude cellular lysates rapidly increase the viscosity of biological samples, which can complicate sample handling and downstream processes (Prazeres et al., 1999), or may completely impede routine analytical methods, such as SDS-PAGE (Kurien and Scofield, 2012). While some cell lysis methods such as sonication lead to some DNA shearing and decreased viscosity, the addition of purified nucleases that hydrolyze intact oligonucleotides in lysates is a more commonplace solution in industrial settings (Boynton et al., 1999). Alternatively, we recently developed a method using an E. coli autolysis/autohydrolysis strain where, after cell growth and autoinducible protein expression, cell autolysis and DNA/RNA autohydrolysis can easily be triggered upon addition of a 0.1% detergent and a freeze-thaw cycle. This method leverages a chromosomally integrated genetic circuit that encodes the co-expression of a lysozyme and a nuclease (Menacho-Melgar et al., 2020).
In this context, a method to quantify oligonucleotide hydrolysis may be desirable. DNA quantification methods, such as fluorescence-based and qPCR, may be used for this purpose but require expensive equipment and reagents and do not differentiate based on DNA fragment size (Nakayama et al., 2016). A simpler alternative is to directly measure the viscosity of the lysates. While the viscosity of lysates is dependent on various factors, intact oligonucleotides are the major contributor. Still, viscosity can only be used to measure oligonucleotide hydrolysis within equivalent samples and not to make comparisons across different strains or cell cultures of different cell densities. Importantly, this method will not work in lysates obtained using sonication, as this shears the DNA. Here, we provide a detailed protocol for measuring DNA hydrolysis using viscosity measurements, only requiring the use of common laboratory supplies and a cell phone camera.
Materials and Reagents
5 mL serological pipets (Genesee Scientific, catalog number: 12-104)
Rattler glass plating beads (Genesee Scientific, catalog number: 11-255A)
Parafilm (VWR, catalog number: P7793-1EA)
General purpose laboratory tape (VWR, catalog number: 89097-938)
50 mL tubes (Genesee Scientific, catalog number: 28-108)
1.7 mL microcentrifuge tubes (Genesee Scientific, catalog number: 24-281)
Cell lysate samples to be tested (e.g., from DLF_R004) (Menacho-Melgar et al., 2020)
We recommend using a minimum of 2.5 mL of lysate, coming from at least 20 mL of cell culture, of at least OD600 = 10)
Tap water
Tris base (GoldBio, catalog number: T-400-500)
Triton X-100 (Sigma Aldrich, catalog number: 93443)
Protease inhibitors tablets, EDTA-free (Thermo Fisher, catalog number: A32965)
Lysis buffer (see Recipes)
Equipment
Cell phone with a camera
Tube cutter (Ridgid, model: 104)
Benchtop centrifuge (Thermo Scientific, model: Legend XTR)
Heat block (Bioer, model: CHB-201)
-80°C freezer (Thermo Scientific, model: TSX700)
Software
Any video media player such as “Movies & TV” (Microsoft)
Procedure
Obtaining the cell lysate
Centrifuge 20 mL of DLF_R004 (or other E. coli strain) cell culture, after growing them as previously described (Menacho-Melgar et al., 2020).
Resuspend the cells in 1× Lysis buffer.
Freeze the cells for 1 hour in the -80°C freezer.
Thaw the cells at 37°C for 1 h. For additional details, refer to our published article describing our method (Menacho-Melgar et al., 2020).
If not using DLF_R004 or a derivative E. coli strain, the cells can be lysed using lysis buffer supplemented with lysozyme and repeated freeze-thaw cycles. If hydrolyzed oligonucleotides are desired, a nuclease (e.g., DNase I or BenzonaseTM) can be added, according to the manufacturer’s instructions. In this case, complete lysis should not be expected.
Serological pipette preparation
Using the tube cutter, cut the pipette at the 3 mL mark (Figure 1A).
Seal the bottom of the serological pipette with parafilm.
Fill the serological pipette with 1 mL of water to make sure no leaking will occur.
Empty the serological pipette.
Secure the serological pipette to a vertical surface, ensuring there is enough contrast between the surface and the pipette to facilitate the data analysis (Figure 1B).
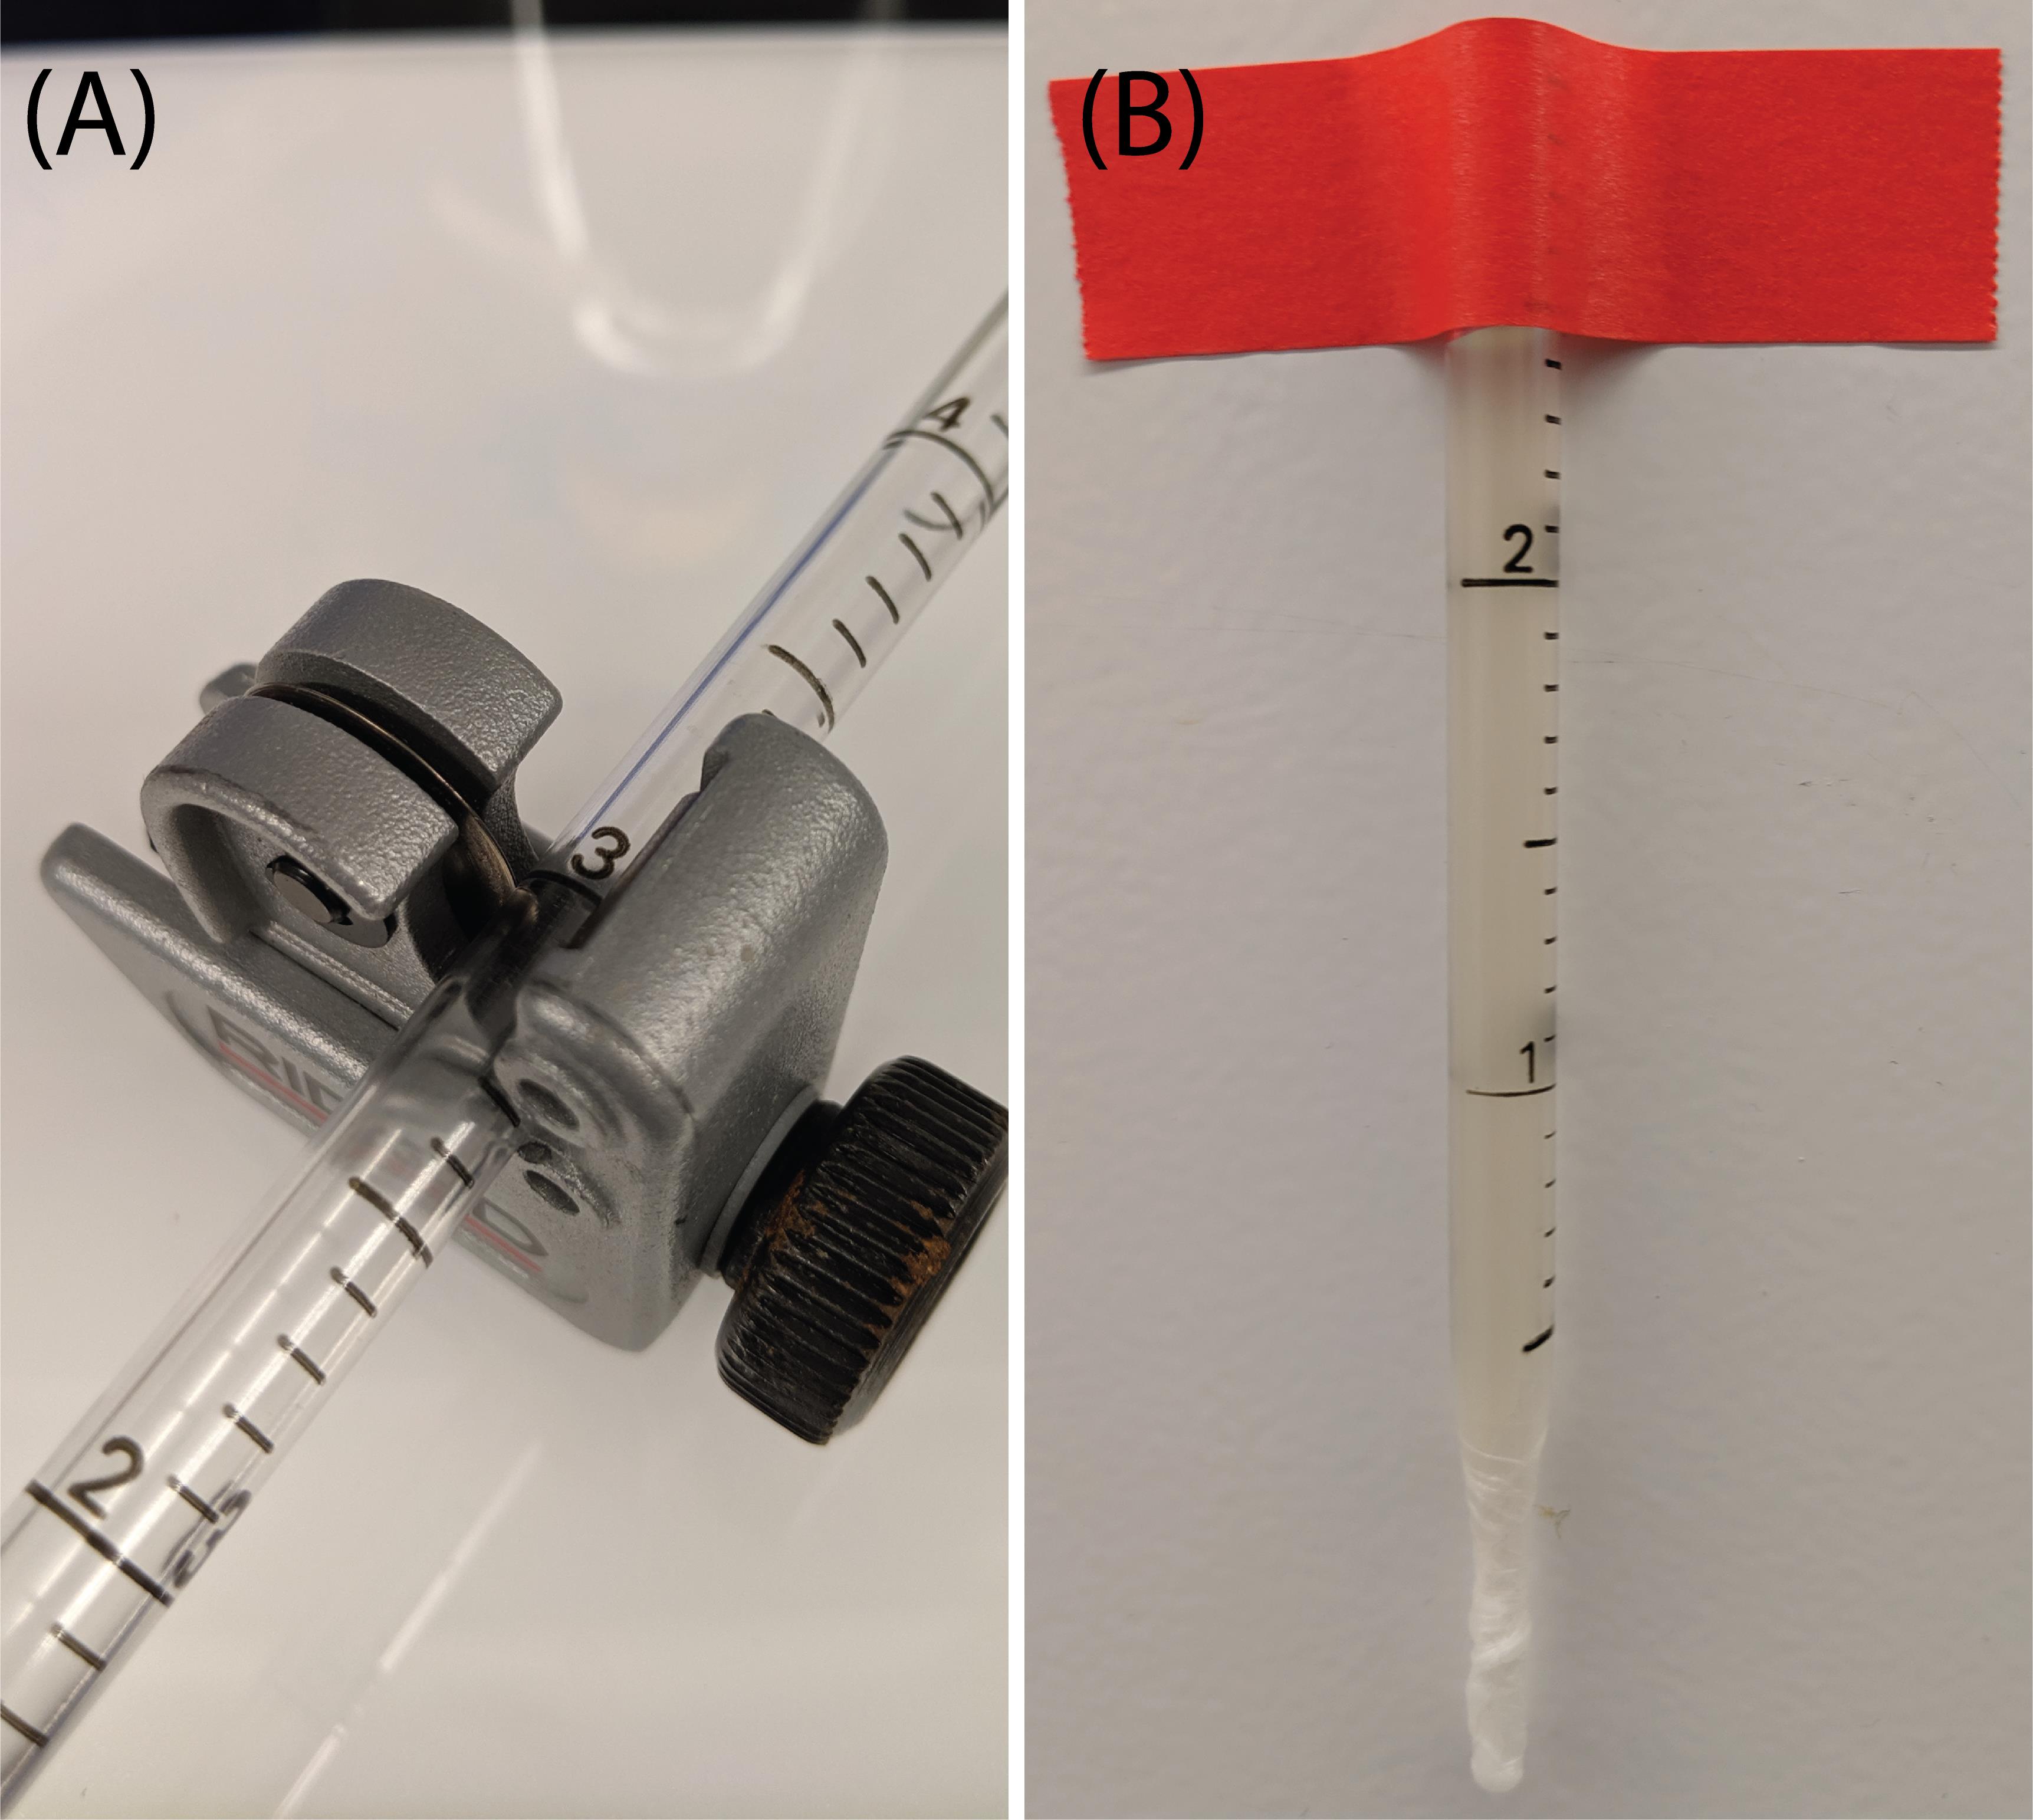
Figure 1. Setup preparation for lysate viscosity measurements. (A) A serological pipette is cut at the 3 mL mark using a tube cutter. (B) After sealing the bottom of the serological pipette with parafilm, the filled serological pipette is taped vertically and filled with the sample to be measured.
Measuring viscosity
Fill the serological pipette with at least 2.5 mL of cell lysate. One can increase the volume of cell lysate up to 6 mL, if the serological pipette is cut at the 6 mL mark in step B1.
Measure the distance from the 2 mL mark to the 1 mL mark. If using the serological pipette listed in this protocol, the distance is 3.6 cm.
Position your cell phone camera just far enough to ensure the top and bottom of the serological pipette are visible. Start recording a video of the pipette.
Drop a glass bead inside the serological pipette.
Repeat step C3 two more times.
Stop recording the video once the third glass bead has dropped to the bottom of the serological pipette.
Remove the parafilm seal.
Empty the serological pipette and rinse with water.
Fill the serological pipette with the next sample and repeat steps C1-C7 two more times to obtain triplicates.
As examples, Videos 1 and 2 are provided.
 Video 1. Glass bead dropping through a non-viscous lysate sample, wherein DNA/RNA has been hydrolyzed. Video 2. Glass bead dropping through a viscous lysate sample, wherein DNA/RNA has not been hydrolyzed.
Data analysis
Using any media player software, play and record the time it takes for the bead to go from the 2 mL mark to the 1 mL mark. Alternatively, if more cell lysate was used, one can record the bead drop time over a longer distance.
Calculate viscosity using the formula:
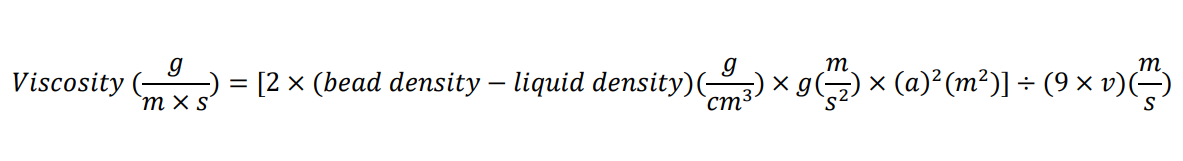
where g is the acceleration due to gravity, a is the radius of the bead, and v is the velocity of the bead moving through the liquid. The density of the lysate is assumed to be that of water (1 g/mL).
Calculate the velocity of the bead by dividing the distance between the 1- and 2-mL marks (or a longer distance if more cell lysate was used) by the time the bead took to drop that distance.
If using the materials listed in this protocol (after unit conversions), the formula reduces to:
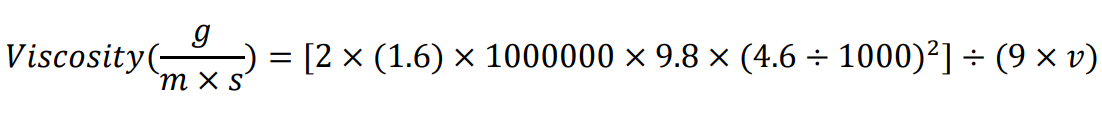
If not using the same serological pipette, measure the distance between the 2 mL and 1 mL mark. If not using the same glass beads, measure the bead diameter. If using a bead from a different material, look up the density value.
Using this method, we have obtained viscosity values of ~600 g/(m*s) for lysates containing hydrolyzed oligonucleotides and ~450,000 g/(m*s) for lysates containing non-hydrolyzed oligonucleotides.
Recipes
Lysis buffer
20 mM Tris HCl, pH 8.0
0.1% v/v Triton X-100
1 tablet of protein inhibitors per 50 mL of lysis buffer.
Acknowledgments
We would like to acknowledge the following support: DARPA# HR0011-14-C-0075, ONR YIP #N00014-16-1-2558, and DOE EERE grant #EE0007563, the North Carolina Biotechnology Center 2018-BIG-6503, and NIH R61 AI140485-01. This protocol was adapted from Menacho-Melgar, R., Moreb, E. A., Efromson, J. P., Yang, T., Hennigan, J. N., Wang, R., and Lynch, M. D. (2020). Improved two-stage protein expression and purification via autoinduction of both autolysis and auto DNA/RNA hydrolysis conferred by phage lysozyme and DNA/RNA endonuclease. Biotechnol Bioeng 117(9): 2852-2860.
Competing interests
MD Lynch has a competing interest in DMC Biotechnologies, Inc. MD Lynch and R Menacho-Melgar have competing interests in Roke Biotechnologies, LLC. The authors have no other competing interests.
References
- Boynton, Z. L., Koon, J. J., Brennan, E. M., Clouart, J. D., Horowitz, D. M., Gerngross, T. U. and Huisman, G. W. (1999). Reduction of cell lysate viscosity during processing of poly(3-hydroxyalkanoates) by chromosomal integration of the staphylococcal nuclease gene in Pseudomonas putida. Appl Environ Microbiol 65(4): 1524-1529.
- Kurien, B. T., and Hal Scofield, R. (2012). Common Artifacts and Mistakes Made in Electrophoresis. In: Methods in Molecular Biology. 869: 633-40.
- Menacho-Melgar, R., Moreb, E. A., Efromson, J. P., Yang, T., Hennigan, J. N., Wang, R. and Lynch, M. D. (2020). Improved two-stage protein expression and purification via autoinduction of both autolysis and auto DNA/RNA hydrolysis conferred by phage lysozyme and DNA/RNA endonuclease. Biotechnol Bioeng 117(9): 2852-2860.
- Nakayama, Y., Yamaguchi, H., Einaga, N. and Esumi, M. (2016). Pitfalls of DNA Quantification Using DNA-Binding Fluorescent Dyes and Suggested Solutions. PLoS One 11(3): e0150528.
- Prazeres, D. M., Ferreira, G. N., Monteiro, G. A., Cooney, C. L. and Cabral, J. M. (1999). Large-scale production of pharmaceutical-grade plasmid DNA for gene therapy: problems and bottlenecks. Trends Biotechnol 17(4): 169-174.
Article Information
Copyright
© 2022 The Authors; exclusive licensee Bio-protocol LLC.
How to cite
Menacho-Melgar, R. and Lynch, M. D. (2022). Measuring Oligonucleotide Hydrolysis in Cellular Lysates via Viscosity Measurements . Bio-protocol 12(2): e4304. DOI: 10.21769/BioProtoc.4304.
Category
Biological Engineering > Synthetic biology
Microbiology > Heterologous expression system > Escherichia coli
Biochemistry > Protein > Isolation and purification
Do you have any questions about this protocol?
Post your question to gather feedback from the community. We will also invite the authors of this article to respond.