- Protocols

- Articles and Issues
- For Authors
- About
- Become a Reviewer

An Alternative Technique for Monitoring the Live Interaction of Monocytes and Tumor Cells with Nanoparticles in the Mouse Lung
Published: Vol 12, Iss 2, Jan 20, 2022 DOI: 10.21769/BioProtoc.4293 Views: 3385
Reviewed by: Alessandro DidonnaEVANGELOS THEODOROUAnonymous reviewer(s)
Original research article
The authors used this protocol in:

Oct 2020
Advertisement


Protocol Collections
Comprehensive collections of detailed, peer-reviewed protocols focusing on specific topics


Abstract
Nanomaterials are increasingly used for the diagnosis and treatment of cancer, including lung cancer. For the clinical translation of nano-based theranostics, it is vital to detect and monitor their accumulation in the tumor, as well as their interaction with tumor, immune cells, and the tumor microenvironment (TME). While high resolution microscopy of fixed tumor specimens can provide some of this information from individual thin slices, it cannot capture cellular events over time and lacks 3D information of the tumor tissue. On the other hand, in vivo optical procedures either fall short of providing the necessary cellular resolution, as in the case of epifluorescence optical imaging, or are very demanding, as for instance intravital lung microscopy. We describe an alternative approach to investigate nanoparticle-cell interactions in entire mouse lung lobes, by longitudinal live cell confocal microscopy at nanometer resolution. By filling the lung ex vivo with 1% agarose, we were able to stabilize the lung lobes and visualize the interaction of fluorescent cells and nanoparticles for at least 4 hours post mortem. This high resolution ex vivo live cell imaging approach is an easy 4D tool for assessing several dynamic processes in tumor tissue, such as the traffic of cells, shedding of extracellular vesicles (EVs), and the accumulation of nanoparticles in tumor tissue.
Graphic abstract:
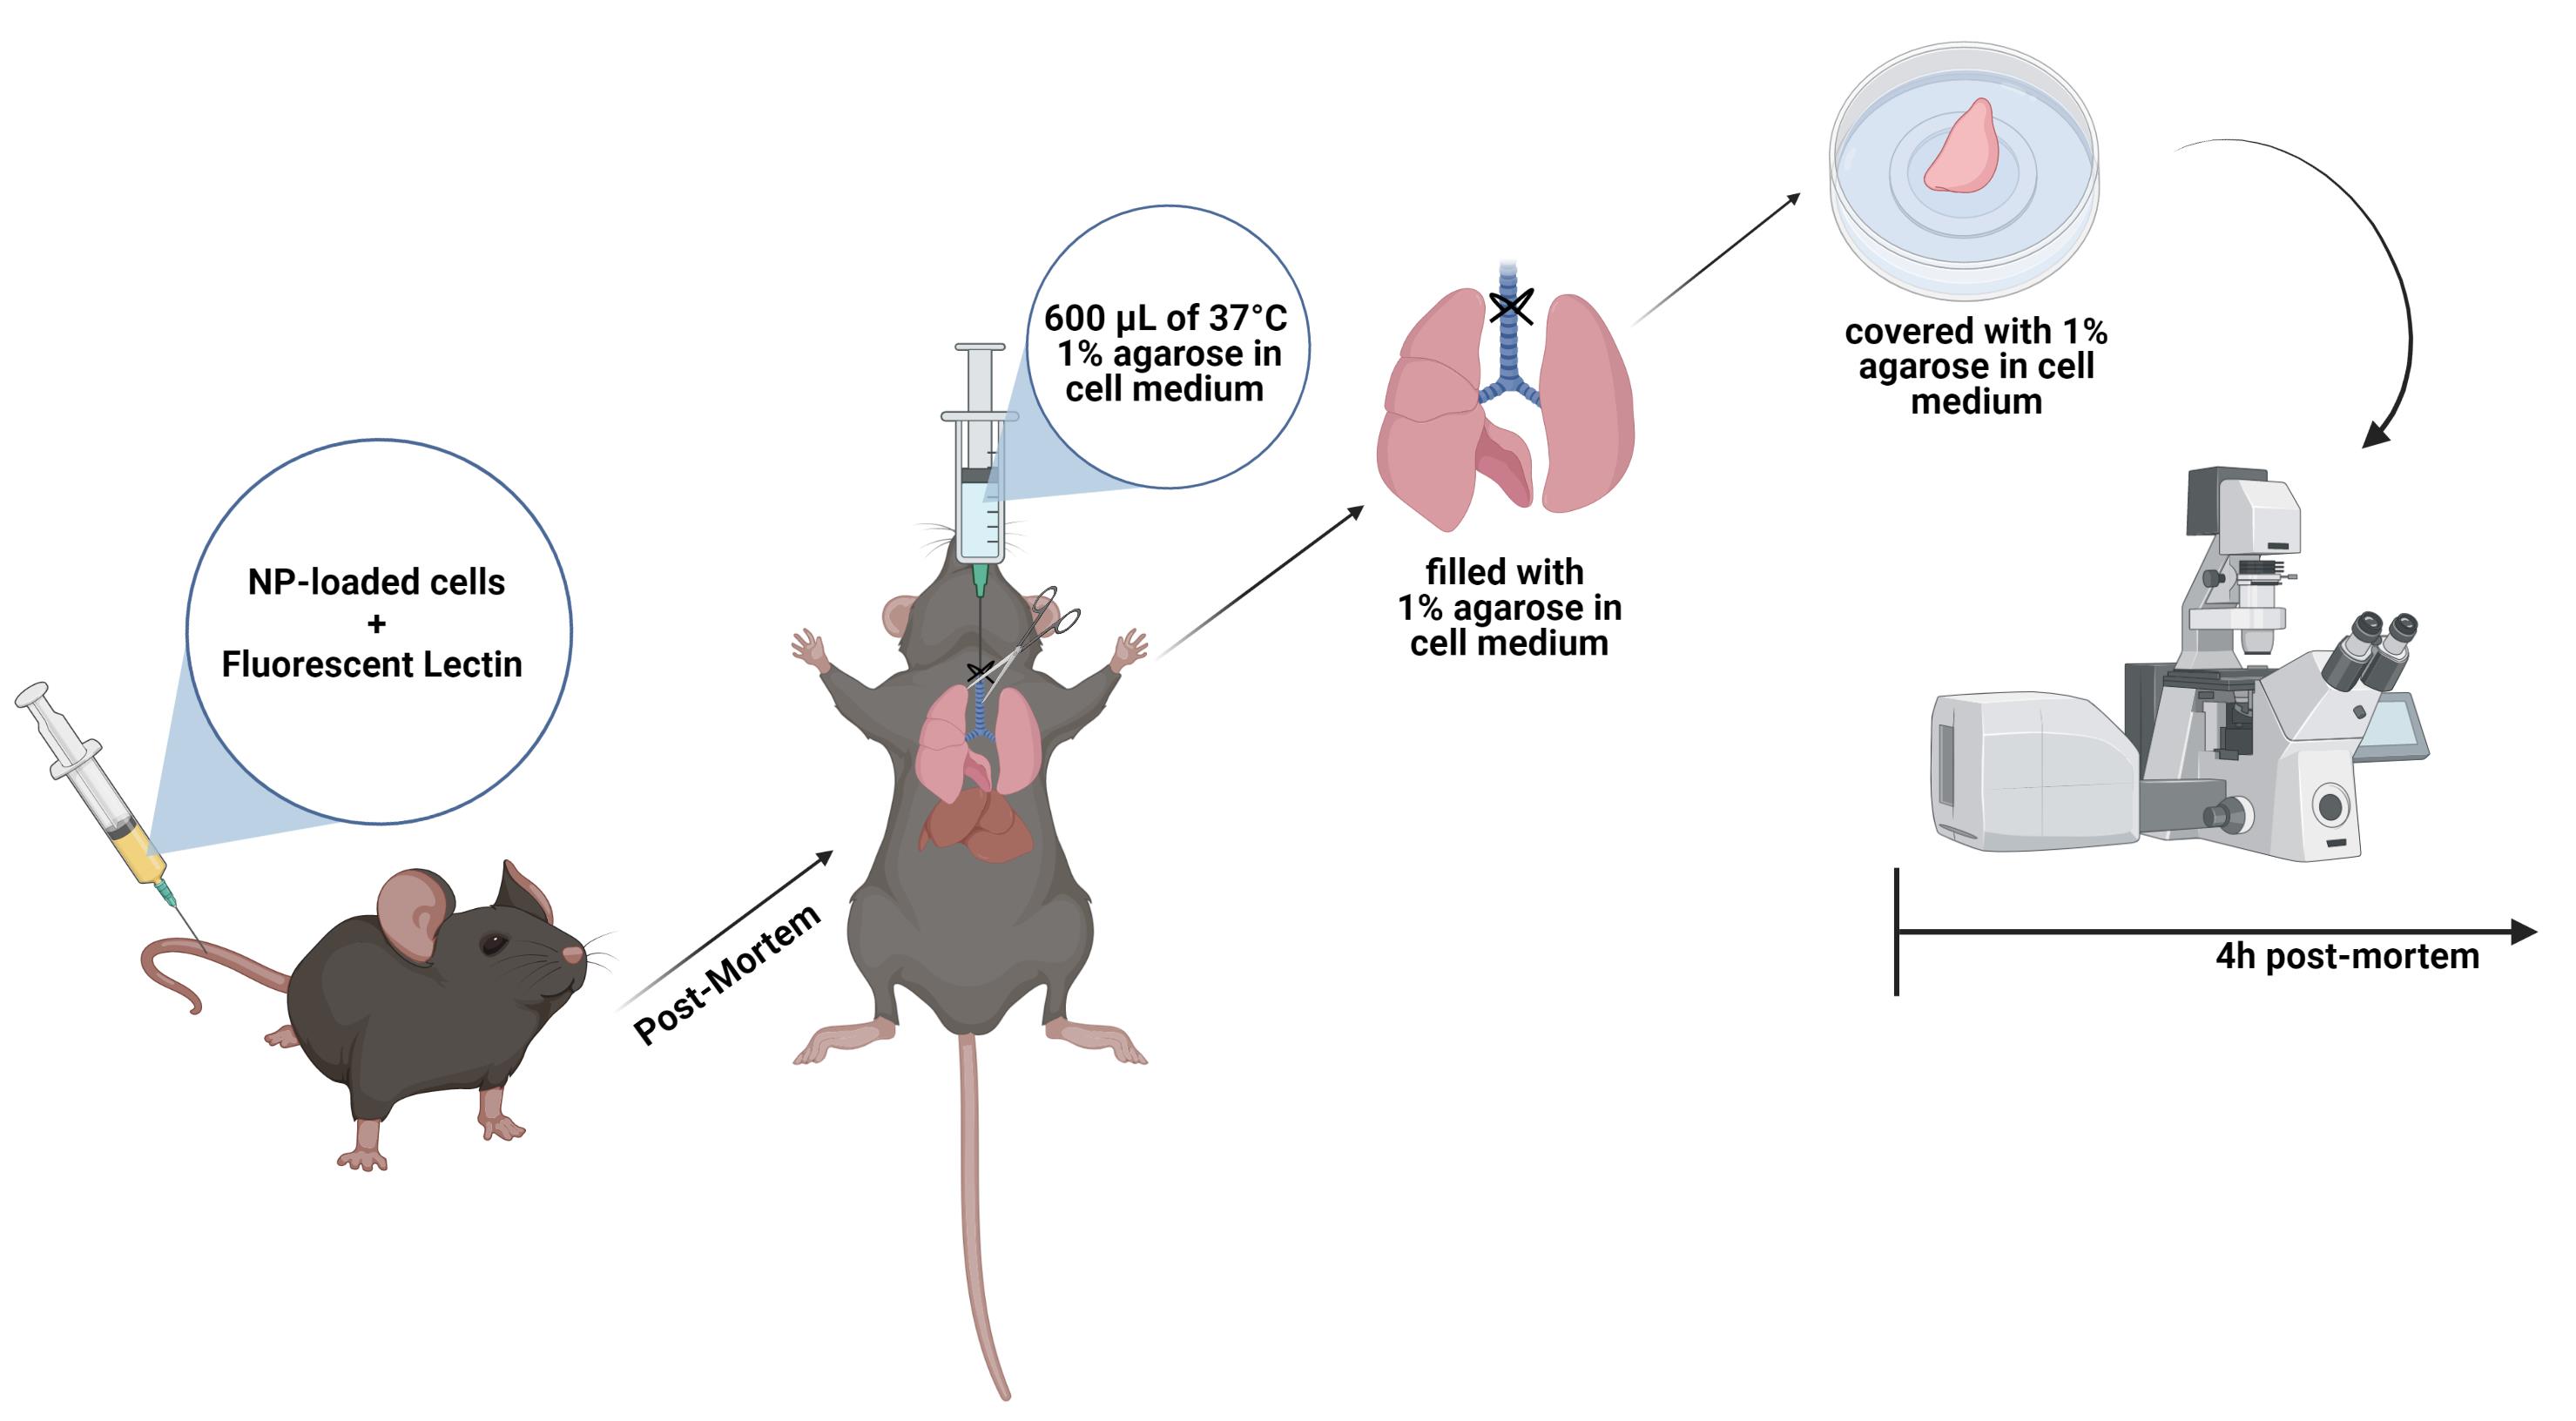
Schematic of the workflow for live cell imaging in the mouse lung.
Background
The advancement of the nanotechnology field has enabled the exploitation of nanoparticle (NP)-based cancer therapies (Jain and Stylianopoulos, 2010; Shi et al., 2017). Compared to the standard chemotherapeutic approach, NPs confer several advantages as they improve drug solubility and stability, prolong drug half-lives in plasma, minimize off-target effects, and concentrate drugs at the target site (Mudshinge et al., 2011). Combining all these characteristics, some NPs have been successfully approved by the FDA or are currently in clinical trials (Dinndorf et al., 2007; Ediriwickrema and Saltzman, 2015). Despite these achievements, several details have to be considered in novel nanoparticle formulations, as most NP-based drugs have failed to improve patient outcomes. One of the most important is the relation of NPs with the tumor microenvironment (TME), which includes tumor cells, immune cells, and blood vessels (Blank et al., 2017).
Traditionally, the characterization of the cellular uptake and interaction of NPs in the TME has been evaluated by 2D tissue sections. Despite the nanoscale resolution, immunohistochemistry and histology fail to demonstrate the complex organization of biological specimens and only provide static snapshots of events. With the development of new volumetric microscopy techniques, the understanding of cell-cell interactions in intact samples has become clearer. Furthermore, in comparison with other live-cell or in vivo technologies, confocal microscopy enables real-time imaging from general tissue architecture at nanoscale resolution (Ramos-Gomes et al., 2020).
Recently, we published a protocol for live high-resolution imaging of the interaction between monocytes and tumor cells with nanoparticles in the mouse lung (Ramos-Gomes et al., 2020). Here, we were able to demonstrate the dynamics between tumor and immune cells, the reaction of the macrophages/monocytes towards NPs, and characterize the NP deposition in the tumor. This approach opens new avenues to dynamically understand how nanotherapies are going to affect the TME and reach target sites.
Materials and Reagents
6-well plates
20 G blunt cannula with the tips cut-off (BD Microlance 3, catalog number: 301300)
1 mL syringe ( BD Plastipak, catalog number: 303172)
U100 Insulin syringe (Braun, catalog number: 9151125)
Uncoated Ibidi 35 mm cell culture dishes (ibidi GmbH, catalog number: 80131)
Cotton sowing thread (not too thin; Wenco, catalog number: 140720)
Surgical disposable scalpel (Braun, catalog number: 5518075)
Kimtech paper (Kimtech Science, catalog number: 05511)
25 mm round cover slips, 170 µm thick (Menzel-Gläser; VWR, catalog number: 631-1346)
Fluorescent-Labeled Lectin (Isolectin B4 from Bandeiraea simplicifolia, Sigma GmbH)
1× Phosphate buffered saline (PBS, Gibco, catalog number: 14190-144)
Isoflurane (Forene, abbvie)
70% ethanol (Honeywell, catalog number: 32205-2.5L-GL)
1% agarose (BioFroxx, catalog number: 16500-500) in DMEM without phenol red (Gibco, catalog number: 31053-028) (see Recipes)
Cells
For visualization, tumor cells need to be fluorescent or preloaded with fluorescent NPs. Here, we use:
LLC-red fluorescence protein (RFP) lung tumor cells
human A549-mCherry lung tumor cells, which were prelabeled with fluorescent Atto488-Barium-NPs
Fluorescent reporter mouse for visualizing immune cells or tumor cells. Here we use C57BL/6-Tg(CD68-EGFP)1Drg/J transgenic mouse (The Jackson Laboratory, Stock No: 026827)
NMRI-Foxn1nu mice (Charles River Laboratories Inc, Strain code: 639)
Equipment
Surgical Wagner scissors (F.S.T., catalog number: 14068-12)
Tissue forceps (F.S.T., catalog number: 11021-12)
Standard pattern forceps (F.S.T., catalog number: 11000-14)
Water bath at 40°C (Memmert GmbH)
Isoflurane Vaporizer (VetEquip, catalog number: 911104)
Confocal/superresolution laser-scanning microscope system equipped with a tunable laser (470-670 nm) and GaAsP-PMT/Spectral detectors (Carl Zeiss, model: LSM880 equipped with Airyscan detection mode)
Microwave (Sharp)
Software
Zen Black (Carl Zeiss)
Imaris (https://imaris.oxinst.com) (Bitplane, version 9.1.2)
Fiji (freeware; https://fiji.sc/)
Procedure
Two scenarios are described, to evaluate:
The interaction between tumor cells, which were prelabeled with fluorescent NPs. As an example, we used human A549-mCherry lung tumor cells, which were prelabeled with Atto488-NPs, by incubating 3 × 10⁵ adherent A549-mCherry cells with 25 mg/mL Atto488-NPs, in 6-well plates overnight at 37°C, 5% CO2. We used the Atto488-NP-loaded cells in a NMRI-Fox1nu/nu mouse (Video 1).
 Video 1. Exchange of green fluorescent nanoparticles between two A549-mCherry lung tumor cells active in the mouse lung [from Ramos-Gomes et al. (2020)].
The interaction of fluorescent tumor cells with macrophages. As an example, we used mouse LLC-red fluorescence protein (RFP) lung tumor cells, in a C57BL/6-Tg(CD68-EGFP)1Drg/J (The Jackson Laboratory) transgenic mouse (Video 2).
There are no limitations regarding age and sex of the mice for these two described scenarios. However, age and sex of the mice may play a role for other settings or experiments, and thus may be dependent on the individual questions to be answered, cell lines to be used, or transgenic mice chosen.
Video 2. Interaction of LLC-RFP lung tumor cells with CD68-EGFP+ macrophages/monocytes in the mouse lung [from Ramos-Gomes et al. (2020)].For visualization of blood vessels, fluorescent lectin (e.g., Alexa-647-lectin) is injected together with either tumor cells, or NP-loaded tumor cells.
Prepare a fresh solution of 1% agarose in phenol red free DMEM and keep in a 40°C water bath.
In vivo injection of tumor cells, NPs, and lectin
Anaesthetize the mouse with a consistent flow of 2% isoflurane in 1 L/min oxygen.
Into an U100 insulin syringe, take up 1 × 10⁶ tumor cells, or NP-loaded 1 × 10⁶ tumor cells, and 100 µg of lectin in the appropriate volume of PBS, depending on the weight of the mouse (maximum 5mL/kg body weight).
Place the mouse on a 37°C heat pad lying on its side, with the tail hanging over the edge, so that one of the lateral caudal veins is easily visible.
Warm up the tail of the mouse by soaking it in 37°C warm water for 1-2 min, to dilate the blood vessels.
The needle is placed on the surface almost parallel to the vein and carefully inserted into the vein. Once the needle tip is under the skin, it is important to pull back the syringe slightly during insertion, to confirm the blood will flow back, and then slowly inject the mixture without moving the needle tip.
Wait for 5 min, before sacrificing the animal with an overdose of anaesthesia.
Lung preparation
Immediately following sacrifice, fix the mouse with needles onto the surgical board, and clean the thoracic area with 70% ethanol.
Open the chest cavity with surgical scissors and expose the lung and trachea.
Place two 10 cm cotton threads underneath the trachea (Figure 1), by carefully sliding some standard pattern forceps underneath the trachea and pulling the threads through.
Make a small incision at the very top of the trachea using surgical scissors.
Insert the bland canula about 5 mm into the trachea.
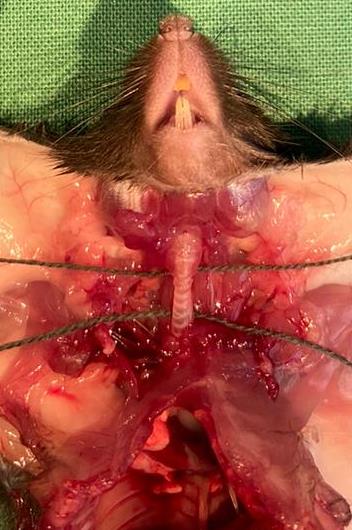
Figure 1. Visualization of the cotton threads position below the trachea.Fix the canula to the trachea with the top cotton thread, by making a double knot.
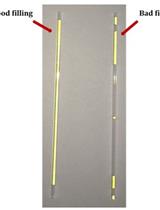
Load 600 µL of warm 1% agarose in a 1 mL syringe, immediately insert it into the canula, and slowly inject the agarose into the lung, to prevent premature polymerisation of the agarose (Figure 2).
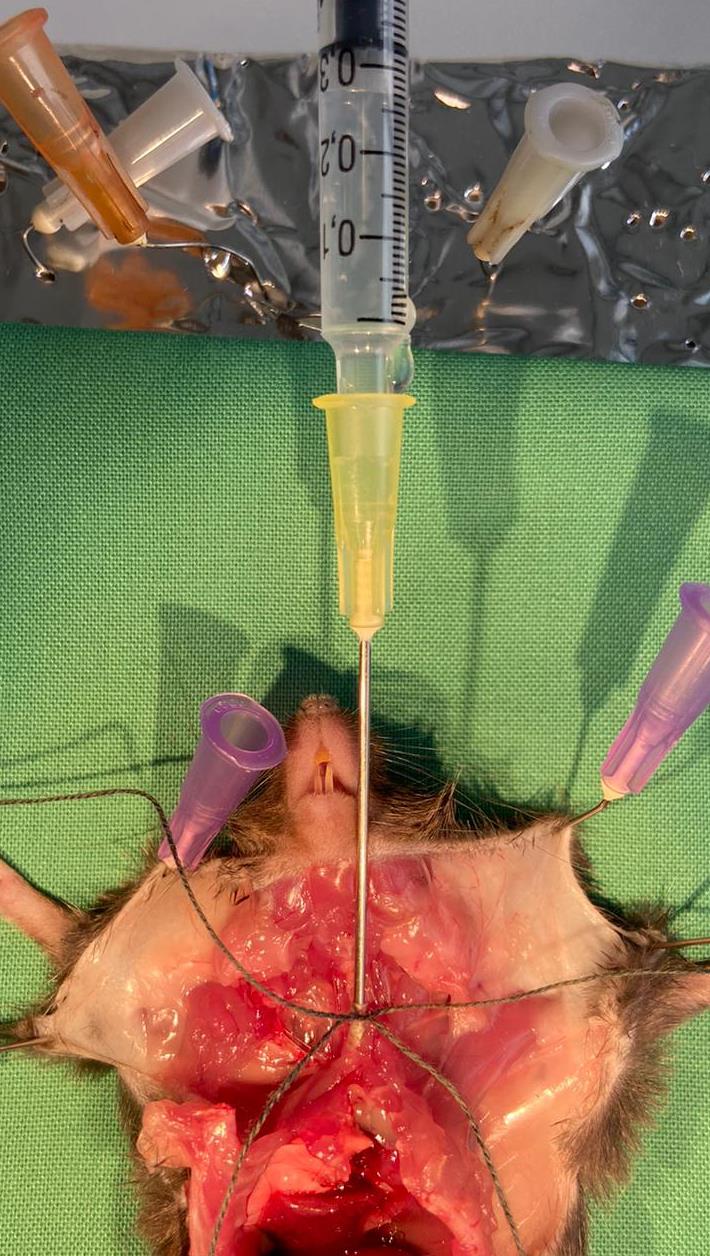
Figure 2. Image of the process for filling the lung with 1% agarose.Tighten the lower cotton thread with a knot below the canula, to seal the lung.
Remove the canula carefully by cutting off the first thread.
Dissect the lung from the chest cavity by carefully cutting all dorsal attachments with scissors, removing the esophagus, trachea, heart, and lungs en bloc. The esophagus is the dorsal landmark through the cervical region. The thoracic aorta is removed with the heart/lungs.
Place the lung on a dry surface and remove the heart with a scalpel (Figure 3).
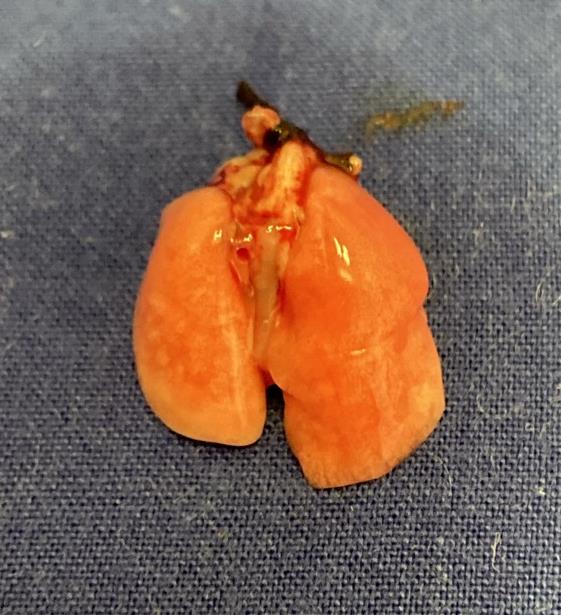
Figure 3. Appearance of the dissected lung filled with 1% agarose injection.Isolate individual lung lobes by cutting them off at the bronchial branches with a scalpel. Briefly rinse them in PBS to remove any blood.
Dry the lung lobes on Kimtech paper.
Choose individual lung lobes for imaging and place them with the flattest surface on an Ibidi 35 mm cell culture dish.
Cover the entire lung lobe with 500-800 µL of 37°C warm 1% agarose, so that the lung lobe is just covered with agarose, ensuring the lung lobe does not float, and remains firmly on the bottom of the Ibidi dish.
Place a cover slip on top of the agarose-sealed lung to prevent drying out of the lung (Figure 4).
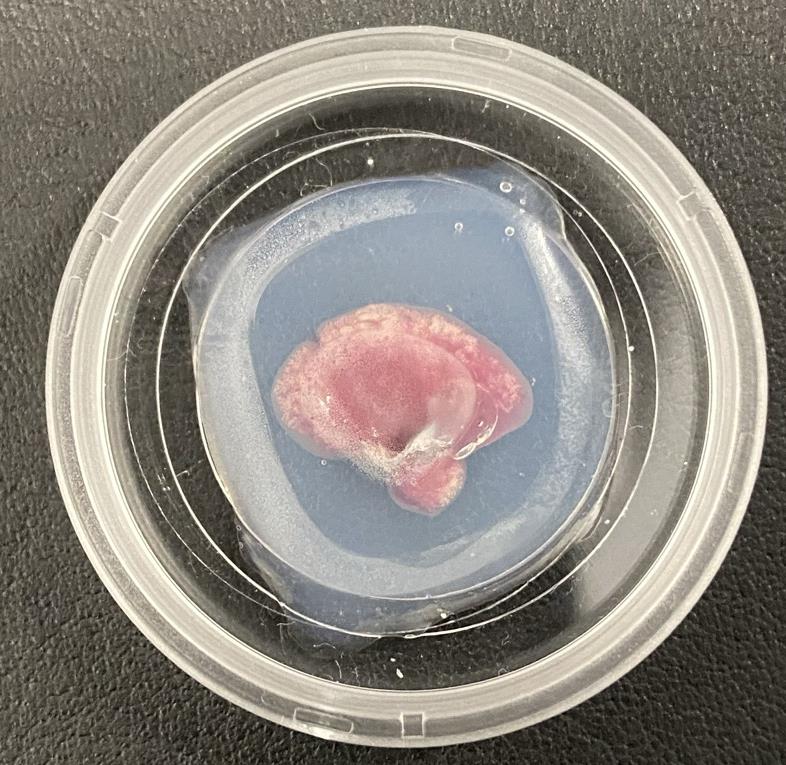
Figure 4. Arrangement of the lung lobe sample inside the Ibidi chamber.Immediately proceed to imaging.
Live image acquisition with Zeiss LSM880
Set-up of the Zeiss LSM880 environmental system: Turn on the microscopy environmental incubator at least 4h before image acquisition to minimize focal drift: 37°C and 5% CO2.
Image acquisition
Place the sample-containing Ibidi chamber on the microscope stage (Figure 5).
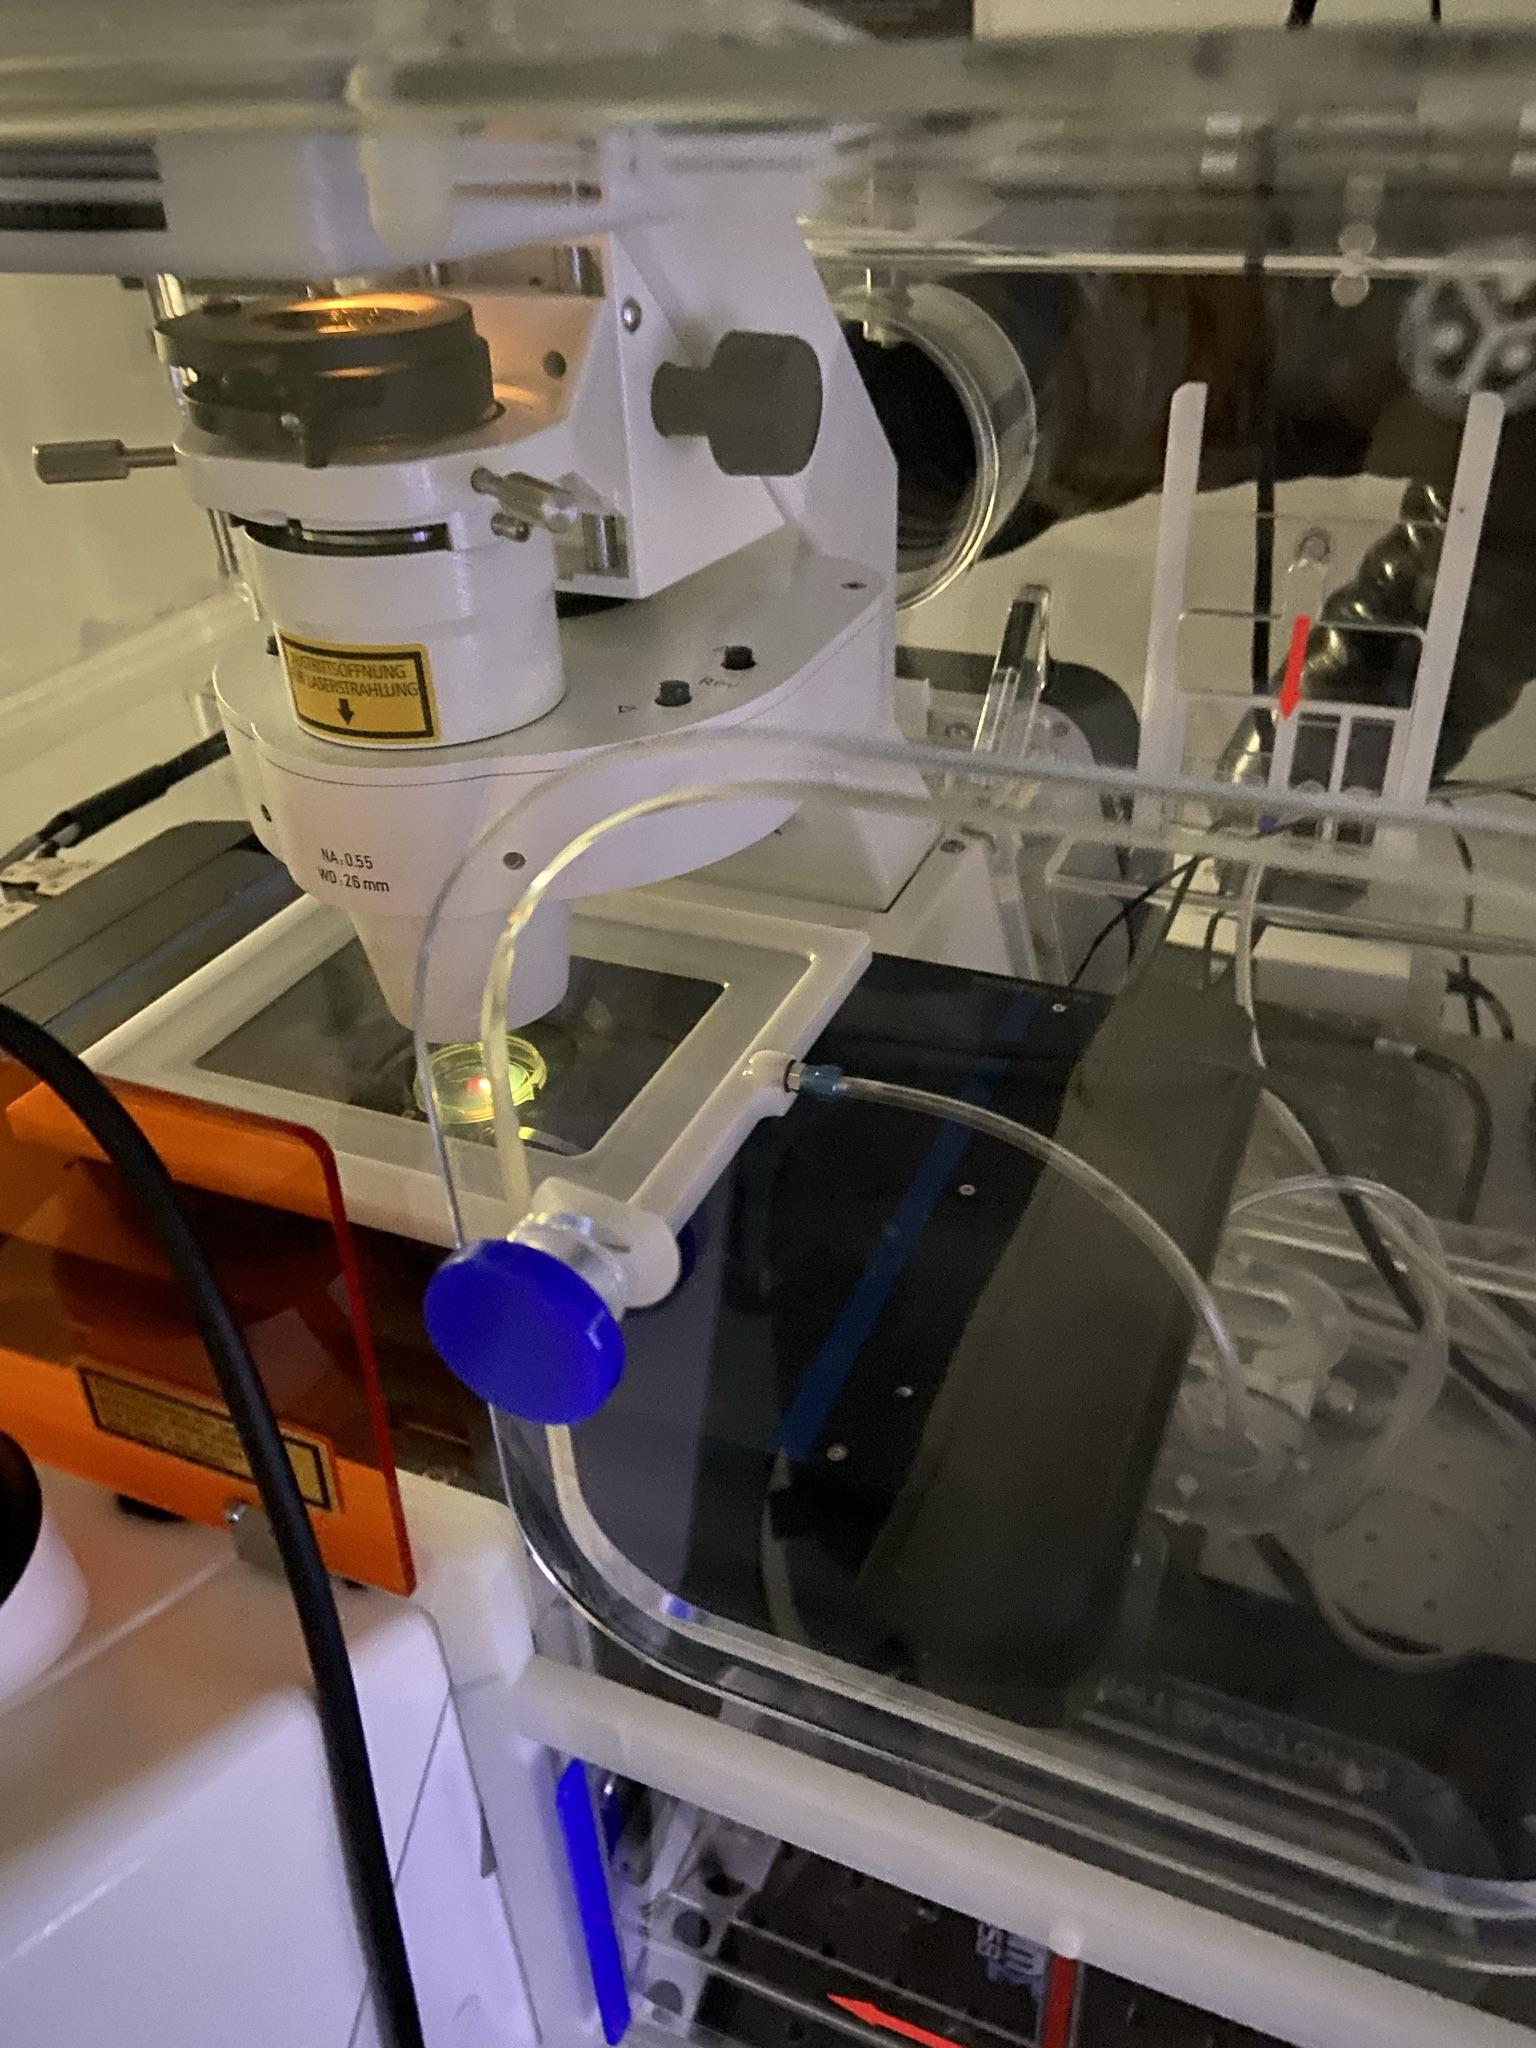
Figure 5. Placement of the sample in the environmental chamber of the microscope.Perform a reflection of the cover slip using any of the available lasers and the 20× air objective.
Set the outer coverslip reflection as the zero µm position.
Set-up the appropriate lasers and filters according to the chosen combination of fluorophores. In our examples, we used the following: GFP-labeled monocytes of CD68-EGFP mouse lungs and Atto488-labeled NPs are excited with the Argon laser at 488 nm, LL2-RFP and A549-mCherry tumor cells are excited with the 561 nm laser, and Lectin-Alexa647 is excited with the 633 nm laser. The light path is divided with a beam splitter 488/561/633, and detected with GaAsP-PMT detectors. For high resolution imaging, we use 1024 × 1024 pixels with a 20x objective, and a field of view of 400 µm2 or less in case of zoomed images. For an accurate quantification of fluorescent signals, we suggest a bit depth of at least 12, with the pinhole set to 1 airy unit, although these settings should be adjusted to the particular sample and experimental goal. Collect z slices of 10-12 μm range (step-size of 1-2 μm) of 3-color images at time intervals of 4 min (e.g., this time is suitable for monocyte dynamics observation).
Raw data sets (z slice 3-color images at each timepoint) are exported as czi files.
Data analysis
Several software and freeware programs are available for image analysis. We recommend the Fiji distribution of the ImageJ software and Imaris (Bitplane, version 9.1.2). We commonly adjust the maximum gray-value display range and time series for the desired time interval. Background noise can also be reduced by applying a median filter. Finally, if the data is captured as a z-stack, part of or the entire stack can be displayed as a 2D image, by applying a maximum intensity projection. Maximum projections are suitable for display, but not for quantification.
Examples of final time-lapse videos acquired by these procedures can be seen in Videos 1 and 2. Video 1 shows the exchange of green fluorescent nanoparticles between two A549-mCherry lung tumor cells active in the lung, that appear yellow. The exchange of nanomaterial took place over 3 h. Video 2 shows the interaction of LLC-lung tumor cells (yellow) with macrophages/monocytes of a transgenic C57BL/6-Tg(CD68-EGFP)1Drg/J mouse, that appear green fluorescent (arrows). The surveillance of the tumor cells by the macrophages/monocytes can be observed within the blood vessels, that are fluorescing in red. The lung tissue shows minimal movement and high focus stability over a period of 3 h 20 min.
Recipes
1% agarose in DMEM without phenol red
Mix 1 g of agarose powder in 100 mL of DMEM without phenol red in a microwavable flask.
Microwave the solution for 1-3 min until the agarose is completely dissolved (do not overboil, as the excessive evaporation can alter the final agarose concentration).
Keep at 40°C until use.
Acknowledgments
This project has received funding from the European Union's Horizon 2020 research and innovation program under the Marie Skłodowska-Curie grant agreement No. 861190 (PAVE) and from the BMBF (VDI) funded projects THERAKON (No. 13GW0218A) and ELICIT (No. 13N14346).
This protocol has been adapted from Ramos-Gomes et al. (2020).
Competing interests
The authors declare that the research was conducted in the absence of any commercial or financial relationships that could be construed as a potential conflict of interest.
Ethics
The animal study was reviewed and approved by Nds. Landesamt für Verbraucherschutz und Lebensmittelsicherheit.
All the animals in-vivo experiments were performed in accordance with European Directive (2010/63/EU).
References
- Blank, F., Fytianos, K., Seydoux, E., Rodriguez-Lorenzo, L., Petri-Fink, A., von Garnier, C. and Rothen-Rutishauser, B. (2017). Interaction of biomedical nanoparticles with the pulmonary immune system. J Nanobiotechnology 15(1): 6.
- Dinndorf, P. A., Gootenberg, J., Cohen, M. H., Keegan, P. and Pazdur, R. (2007). FDA drug approval summary: pegaspargase (oncaspar) for the first-line treatment of children with acute lymphoblastic leukemia (ALL). Oncologist 12(8): 991-998.
- Ediriwickrema, A. and Saltzman, W. M. (2015). Nanotherapy for Cancer: Targeting and Multifunctionality in the Future of Cancer Therapies. ACS Biomater Sci Eng 1(2): 64-78.
- Jain, R. K. and Stylianopoulos, T. (2010). Delivering nanomedicine to solid tumors. Nat Rev Clin Oncol 7(11): 653-664.
- Mudshinge, S. R., Deore, A. B., Patil, S. and Bhalgat, C. M. (2011). Nanoparticles: Emerging carriers for drug delivery. Saudi Pharm J 19(3): 129-141.
- Ramos-Gomes, F., Ferreira, N., Kraupner, A., Alves, F. and Markus, M. A. (2020). Ex vivo Live Cell Imaging of Nanoparticle-Cell Interactions in the Mouse Lung.Front Bioeng Biotechnol 8: 588922.
- Shi, J., Kantoff, P. W., Wooster, R. and Farokhzad, O. C. (2017). Cancer nanomedicine: progress, challenges and opportunities. Nat Rev Cancer 17(1): 20-37.
Article Information
Copyright
© 2022 The Authors; exclusive licensee Bio-protocol LLC.
How to cite
Ramos-Gomes, F., Ferreira, N., Alves, F. and Markus, M. A. (2022). An Alternative Technique for Monitoring the Live Interaction of Monocytes and Tumor Cells with Nanoparticles in the Mouse Lung . Bio-protocol 12(2): e4293. DOI: 10.21769/BioProtoc.4293.
Category
Cancer Biology > Tumor immunology > Drug discovery and analysis
Biological Engineering > Biomedical engineering
Do you have any questions about this protocol?
Post your question to gather feedback from the community. We will also invite the authors of this article to respond.