- Protocols

- Articles and Issues
- For Authors
- About
- Become a Reviewer

Single Molecular Resolution to Monitor DNA Replication Fork Dynamics upon Stress by DNA Fiber Assay
Published: Vol 11, Iss 24, Dec 20, 2021 DOI: 10.21769/BioProtoc.4269 Views: 5305
Reviewed by: Alice MeroniArif Md. Rashedul KabirAnonymous reviewer(s)

Original research article
The authors used this protocol in:

Nov 2020
Advertisement


Protocol Collections
Comprehensive collections of detailed, peer-reviewed protocols focusing on specific topics


Abstract
DNA replication always encounters numerous endogenous and exogenous stresses during the cell cycle. Measuring the cell responses to stress has primarily relied on cell survival and incorporation of radioactive dNTPs, which is limited in resolution. A higher resolution is required to monitor how replication and repair respond to these stresses. This protocol describes a procedure to monitor the length of new synthesized DNA in a single molecular resolution called DNA fiber assay. The fiber assay relies on labeling of nascent DNA with the nucleoside analog 5-Chloro-2'-deoxyuridine (CldU) and 5-Iodo-2'-deoxyuridine (IdU). We can visualize the labeled nascent DNA in single molecular resolution by immunostaining. By measuring labeled DNA length, the assay permits interrogation of replication speed at given conditions, end processing at the reversed fork, and fork restart after repair.
Background
The fidelity of DNA replication is always challenged by exogenous and endogenous sources of stress, including base lesions and crosslinks generated from genotoxic reagents, secondary DNA structures generated from GC enriched regions, and transcription interference (Berti et al., 2020a). Upon replication stress, the DNA polymerase uncouples from CMG helicases and the replication speed will slow down to allow the repair of the lesions. Meanwhile, the uncoupling leads to more ssDNA at the stalled fork (Zellweger et al., 2015). Fork reversal is the global response to replication stress, which indicates new synthesized leading and lagging strands annealed together by DNA translocases and RAD51. The reversed fork is protected by many protection factors to prevent degradation mediated by nucleases (Schlacher et al., 2011 and 2012; Mukherjee et al., 2019; Liu et al., 2020). The intact reversed fork confers the stability of the stalled fork, facilitating later repair pathways, such as template switch to restart the fork (Bhat and Cortez, 2018). Moreover, Primpol mediated repriming and translesion synthesis are also involved in the replication stress response (Bai et al., 2020; Quinet et al., 2020; Genois et al., 2021).
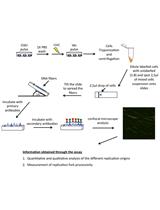
To understand how the fork is protected and repaired upon stress, we need to monitor fork activities such as fork speed, ssDNA gaps, fork reversal, nascent DNA strand degradation (NSD), and fork restart at a single molecular resolution. We and others have previously shown that the DNA fiber assay can successfully monitor fork activities in different cell lines at a single molecular resolution (Liu et al., 2016 and 2020; Dungrawala et al., 2017; Bai et al., 2020; Quinet et al., 2020; Genois et al., 2021). We cultured cells for a fixed time with the warm complete medium containing a high concentration of thymidine analogs CldU or IdU. The thymidine analogs integrated in the genome DNA after a certain treatment, the cells were harvested and lysed on slides, followed by DNA fixation. The DNA is denatured and then the labeled DNA undergoes immunostaining. Two monoclonal BrdU antibodies generated from mouse and rat are able to cross-react with IdU and CldU, respectively, so we took the advantage of this cross-reaction to immunostain the analogs with distinct colors. To be consistent, in this paper, we stain CldU with red and IdU with green. We could image the labeled single DNA molecule and quantify fork activities by fluorescence microscopy scanning.
Thus far, the DNA fiber assay was used to determine fork speed (Mehta et al., 2020; Krishnamoorthy et al., 2021), fork reversal in some fork protection deficiency cells (Mijic et al., 2017; Taglialatela et al., 2017; Krishnamoorthy et al., 2021) such as the BRCA2 null cell line, nascent DNA strand degradation (Dungrawala et al., 2017; Przetocka et al., 2018; Liu et al., 2020), ssDNA gaps after Primpol mediated repriming (Bai et al., 2020; Quinet et al., 2020; Genois et al., 2021), fork restart in various treatments, and genetic background (Liu et al., 2016; Palermo et al., 2016; Mason et al., 2019).
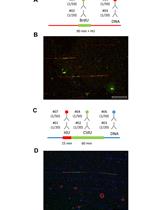
To monitor different fork activities, we used different labeling strategies and treatments (Figure 1A for labeling, see notes for analysis). For measuring fork speed in U2OS cells, we labelled cells with CldU for 20 min, followed by IdU for 20 min. We measured the CldU and IdU labeled DNA lengths and plotted their length separately. Longer fibers meant faster replication speed, or DNA synthesis. Interestingly, we could also see fibers with one color in the middle of another color. When a green fiber has a red color in the middle, this indicated the formation of a new firing origin (Figure 1B), and when a red fiber has green in the middle, this indicated a termination event (Figure 1C). By plotting the length ratio of longer green fibers to shorter green fibers in an origin firing, we may determine if the stress or genetic background causes fork progression problems (Dungrawala et al., 2017). In a previous study, the fork speed labeling method with low dose CPT (50nM) was also used to monitor fork reversal frequency (Berti et al., 2020b), since fork reversal correlates with fork speed in some specific background, such as low dose CPT. The cells were firstly labeled with CldU for 20 min, followed by IdU labeling for another 20 min, and co-treated with low-dose CPT during IdU labeling (Figure 1A). The measurement for fork reversal was the ratio of IdU/CldU, with shorter IdU fiber length corresponding to more fork reversal.
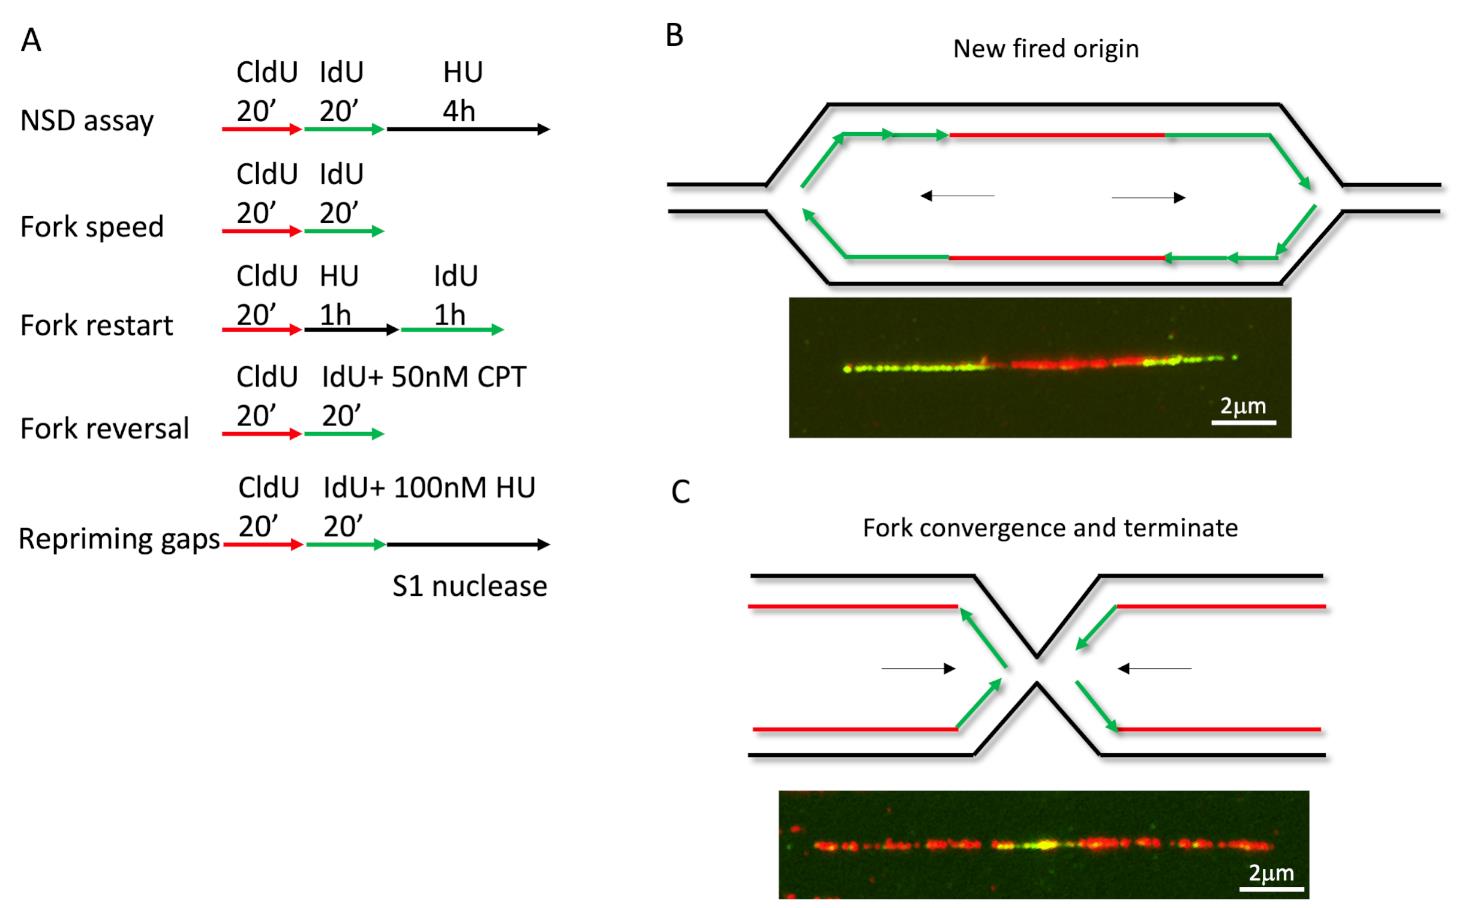
Figure 1. DNA fiber labeling in different applications. (A) Cells labeled with CldU and IdU in different protocols to determine various fork activities. (B-C) Examples for new firing origins and terminations events.
Loss of fork reversal enzyme HLTF leads to repriming dependent aberrant fork speeding, but leaves ssDNA gaps behind (Bai et al., 2020). To detect ssDNA gaps generated by the repriming pathway, the labeling method is shown at the bottom of Figure 1A. After pulsing with thymidine analogs, cells are harvested and digested with S1 nuclease before spreading. The S1 nuclease is a single-strand-specific endonuclease that cleaves ssDNA at the dsDNA region caused by a nick, gap, mismatch, or loop. S1 nuclease treatment digests the IdU labeled fibers with gaps into short pieces that are undetectable; as a consequence, IdU fibers become shorter than CldU fibers.
Another application for this method is the nascent DNA strand degradation assay. Briefly, cells treated for equal duration with CldU and IdU, followed by 5 h high dose Hydroxyurea (4 mM) treatment, can fully stall replication (Figure 2A). The fiber length of CldU and IdU is noted, and the ratio of IdU/CldU is plotted as the degradation readout. Theoretically, if the IdU/CldU ratio equals 1, the fork remains intact (Figures 2B and 2C), but if the ratio is less than 1, this indicates the nascent DNA has been degraded by nucleases (Figure 2D). The nascent DNA strand degradation can be rescued by either blocking nucleolytic digestion or inactivating fork reversal (Figures 2B and 2C). Previous studies show that fork reversal is the entry point for NSD. Therefore, an NSD assay is also used to measure fork reversal in some specific situations (Liu et al., 2020).
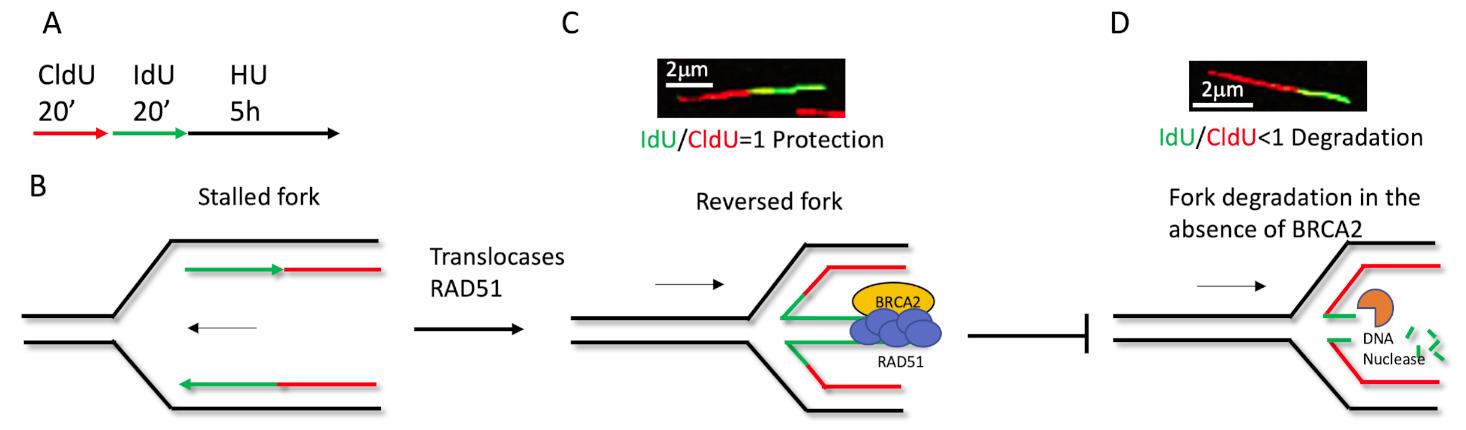
Figure 2. Schematic of how the fiber labeling technique detects nascent DNA degradation in the stressed fork. (A) Cells labeled with 20 μM CldU and 100 μM IdU for 20 min, respectively, followed by 4mM HU for 5 h. (B) The replication fork is stalled upon HU treatment, after CldU and IdU labeling. Then, RAD51 and translocases mediate fork reversal (C), BRCA2 stabilizes RAD51 at the regressed arm to protect the fork from nascent DNA degradation by nucleases (D). In the absence of protection, such as BRCA2 deficiency, the newer synthesized DNA will degrade first, causing the IdU/CldU ratio to be less than 1. Either blocking the nucleolytic digestion, restoring protection, or inactivating fork reversal can prevent degradation, an increase the ratio of IdU/CldU back to 1.
To monitor fork restart efficiency, we labelled the cells with CldU for 20 min, followed by 1 h high dose HU or other reagents of interest. After wash out of the stress reagents, 20 min to 1 h of IdU without stress allowed replication restart. Through imaging, we can see fibers with green connecting red, which means a restart event. Red only fibers indicate stalled forks that failed to restart. Green only fibers indicate new firing origins. The measurement of restart is calculated by counting the number of dual-color fibers and red-only fibers. We plot the restart efficiency by the ratio of Nred/green/(NRed only + Nred/green). There are fibers that have red in the middle of green or green in the middle of red in the fiber image. These fibers indicate the fork restart first, followed by termination events. However, it is hard to know if these fibers indicate one or two restart events, since we usually count it as one restart event.
In this protocol, we use the NSD assay as an example to describe the labeling, staining, and data analysis. We knockdown BRCA2 as an example to test NSD, because this gene is required in fork protection (Schlacher et al., 2012).
Materials and Reagents
Premium Microscope Slides Frosted (Fisherfinest, catalog number: 12-544-2)
Corning 24 × 50 mm Rectangular Cover Glass (Fisher Scientific, catalog number: 12-553-464)
6-well plate (Corning, catalog number: 07-200-83)
Plastic bags (Uline, catalog number: S-952)
U2OS cells (ATCC)
DMEM (Gibco, catalog number: 11965-092)
FBS (Gibco, catalog number: A4766801)
Rat monoclonal anti-BrdU (Abcam, catalog number: ab6326, store at -20°C)
Mouse anti-BrdU (Becton Dickinson, catalog number: 347580 B44, store at 4°C)
Goat anti Rat IgG (H+L) Secondary Antibody, Alexa Fluor 594 (Invitrogen, catalog number: A-11007, 4°C, avoid light)
Goat anti-Mouse IgG (H+L) Highly Cross-Adsorbed Secondary Antibody, Alexa Fluor Plus 488 (Invitrogen, catalog number: A32723, 4°C, avoid light)
Prolong Gold without DAPI (Invitrogen, catalog number: P36930, RT)
HBSS (Gibco, catalog number: 14175-095)
BRCA2 siRNA (Dharmacon, catalog number: L-003462-00-0005, dissolved in nucleases free water at 20 µM)
Non-targeting siRNA (siNT Qiagen, catalog number: 1027281)
Dharmafect 1 (Dharmacon, catalog number: T-2001, store at 4°C)
Opti-MEM (Gibco, catalog number: 31985-070)
EDTA 0.5M pH 8.0 (Corning, catalog number: 46-034-CI, RT)
SDS 10% (Sigma, catalog number: 75746-250G; dissolve in water, store at room temperature for 1 year)
Tris-HCl pH7.4 1 M (Sigma, catalog number: 77-86-1; dissolve in water, adjust pH to 7.4 with HCl, store at room temperature for 1 year)
Triton X-100 (Sigma, catalog number: T8787)
Glacial Acetic acid (Fisher , catalog number: A38-212)
Methanol (Fisher Scientific, catalog number: A413-20)
Hydrochloric Acid (Fisher Scientific, catalog number: A144-212)
Goat serum (Gibco, catalog number: 16210072, aliquot to 1ml eppendoff tubes in -20°C)
Trypsin (Gibco, catalog number: 25200056)
IdU (Sigma, catalog number: I7125, powder in -20°C, resuspended in 1 N ammonium hydroxide at 50 mg/ml or 141.2 mM; aliquot to 20 μl, store in -20°C for up to 3 years) (see Recipes)
CldU (Sigma, catalog number: C6891, powder in -20°C, resuspended in 1 N ammonium hydroxide at 20 mg/ml or 76.1 mM, store at -20°C for up to 3 years) (see Recipes)
HydroxyUrea (HU; Sigma, catalog number: H8627) (see Recipes)
Fiber spreading buffer (see Recipes)
Denature buffer (see Recipes)
Blocking buffer (see Recipes)
Equipment
Spreading apparatus (see Figure 3 how to make it)
Immunofloursence microscope (Nikon, model: Ti-DH)
Coplin jar
Incubator or water bath
Software
Nikon Nis elements BR 4.40.00 64-bit
Prism 8
Excel
Procedure
Cell preparation
Transfect BRCA2 siRNA to U2OS cells in 6-well plate:
Plate 150,000 U2OS cells in 2 ml complete medium per well of a 6-well plate. Prepare 4 wells: two for control siRNA and two wells for BRCA2 knockdown.
For each well, prepare 2 μl 20 μM siRNA in 250 μl Opti-MEM. In a separate tube, add 4 μl of Dharmafect 1 in 250 μl Opti-MEM, vortex and wait for 5 min. Then, add the Dharmafect 1 solution to the siRNA solution, vortex, and incubate for 15 min at RT.
Apply transfection mixture to cells and shake well.
Incubate cells in 37°C incubator for 48 h. Change to fresh medium 1 day before labeling.
Cell labeling
Warm 20 ml of complete medium and 50 ml HBSS in the incubator or 37°C water bath overnight the day before labeling.
Harvest one well of control siRNA and one well of BRCA2 knockdown to run a western blot to test BRCA2 expression (western blot protocol not included here).
Prepare 20 μM CldU, 100 μM IdU, and 4 mM HU in warm complete medium, at a volum of 5 ml for each. Warm up the labeling medium in a water bath or incubator until use.
Decant the old medium in the 6-well plate, add 2 ml of CldU medium to cells, and place the cells back in the incubator for 20 min (Figure 3).
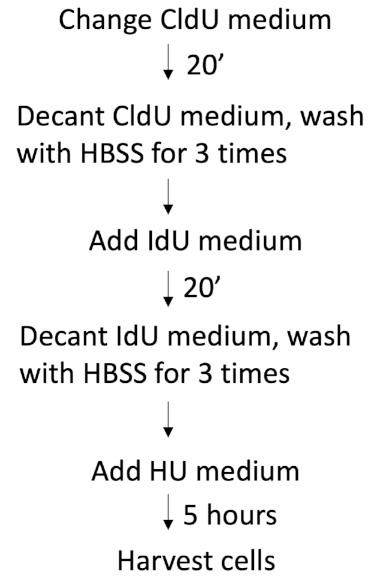
Figure 3. Labeling schematicRinse the cells with warm HBSS buffer 3 times (2 ml per rinse). Perform the wash step for at least 2 min in total, and not too fast as this can reduce the green/red signal overlap.
Add 2 ml Iof dU medium, place the cells back in the incubator for 20 min (ensure the concentration is exactly 100 µM, otherwise the control ratio may change).
Wash the wells 3 times with equilibrated HBSS for at least 2 min, then add HU medium, and place the cells back in the incubator for 5 h.
Spreading
Trypsinize the cells at room temperature for 5 min (300 µl/well for a 6-well plate).
Use ~700 µl of media to suspend cells and transfer to an Eppendorf tube. Count cell numbers. Centrifuge cells at 500 × g for 3 min.
Aspirate and resuspend cells in ice-cold PBS to obtain approximately 1 × 10⁶ cells/ml.
Place the slides flat on the apparatus with the white frosted end facing up. Each apparatus holds 4 slides (Figure 4A-4B).
Only label slides in pencil because the marker pen will be washed away in the fixation step.
Mark the slide where cells have been added so fibers can be easily found later.
Typically, spread 2 slides per sample, stain 1 slide and keep another for backup. If the staining is good, 1 slide can contain 100-200 dual-color fibers. If fibers are not enough to be confident, you should stain 2 slides or more.
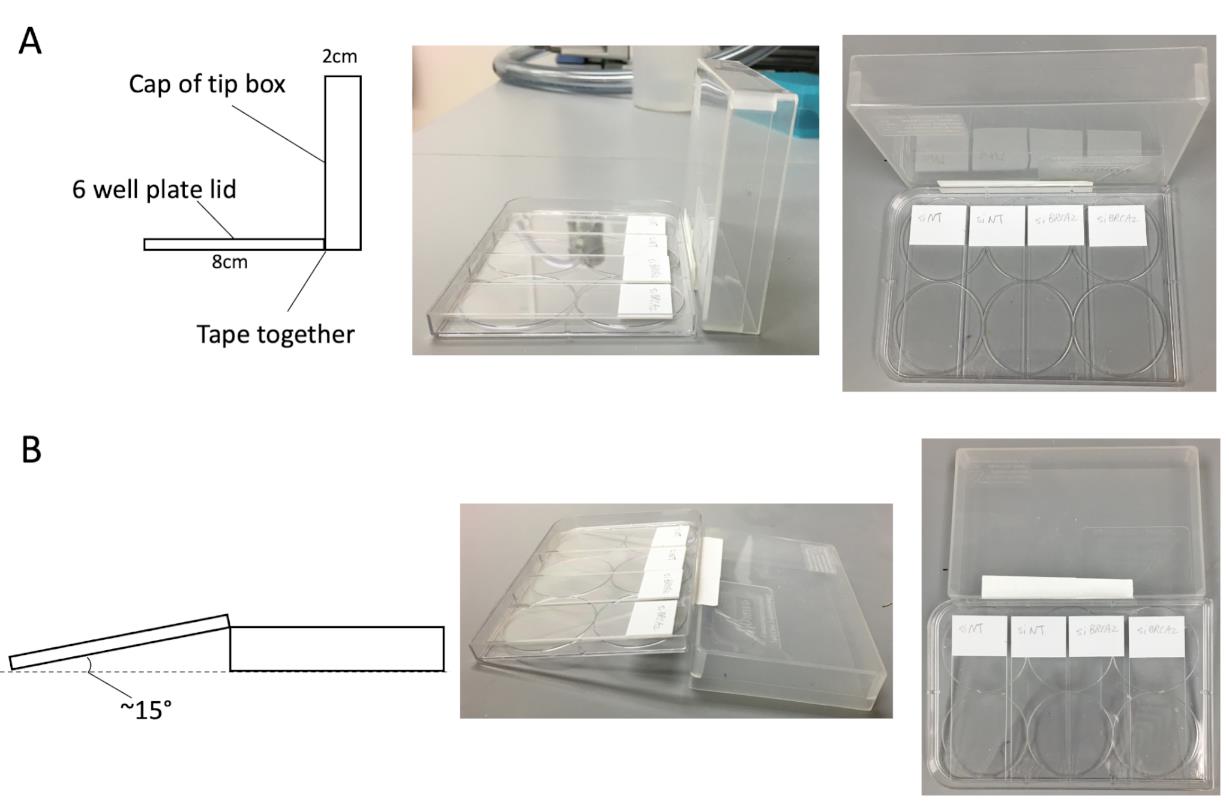
Figure 4. Homemade fiber spreading apparatus. (A) Put the lid of a 6-well plate horizontally and facing up, lift up the cap of a 200 μl tip box next to the lid, then tape them together. The 6-well plate lid can hold up to 4 slides simultaneously. (B) After adding the lysis buffer, flip down the cap, one side of the slides will lift up to an approximate 15°. This angle confers the suitable spreading rate.Add 2 µl of cell suspension (1,000-2,000 cells applied) to a slide near the white frosted end. Flick tube to resuspend cells before adding to slide. Leave it to air-dry for ~5-6 min until the sample becomes tacky (Figures 4A, 5A-5B).
Note: Spread the sample in a 0.7 cm long horizontal line across the slide (instead of placing a drop). This helps “spread” the cells to obtain less overlapping DNA while imaging.
Add 10 µl of spreading buffer to the cells on the slide (Figure 5C) (use fresh spreading buffer, this can significantly improve the results). Leave for 6 min at room temperature to lyse the cells.
Tilt the slide 15° to allow the DNA to run slowly down the slide (Figures 4B and 5D).
Notes:
Make sure the drop runs straight and slowly.
Do not allow the drop to sit at the top for too long because the DNA gets tangled into a ball.
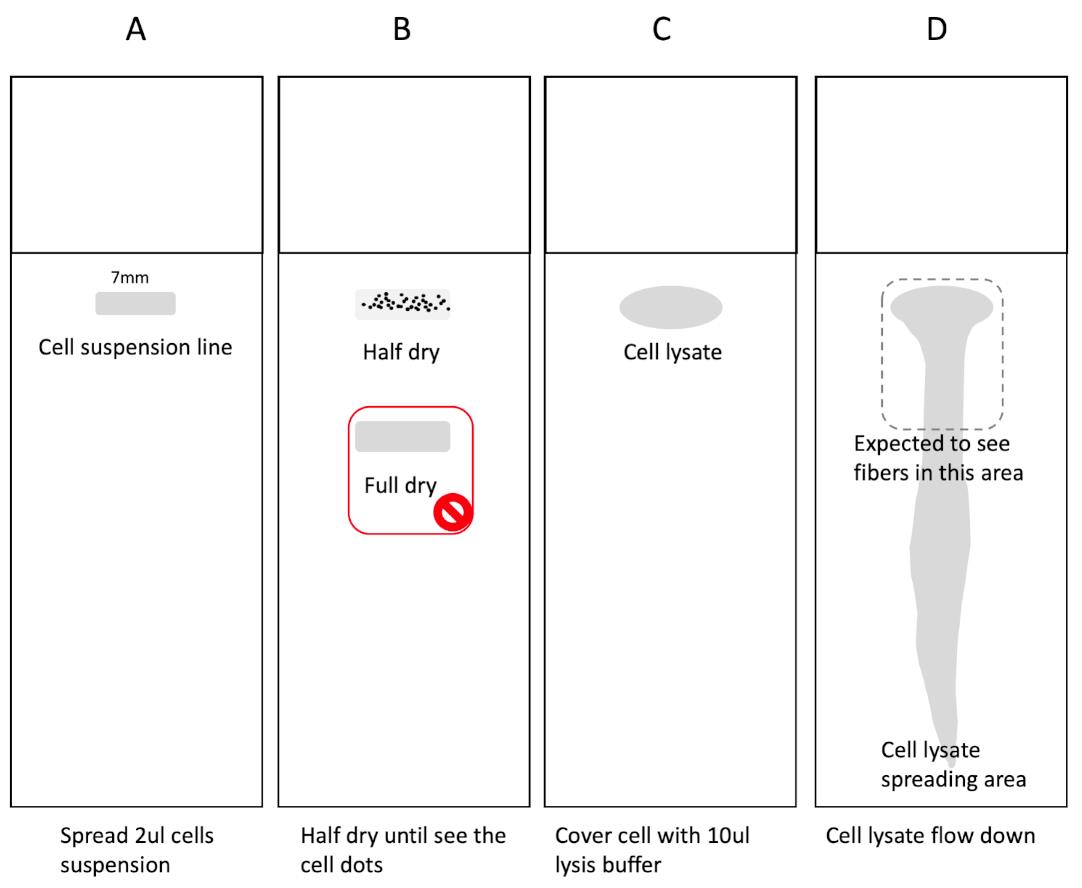
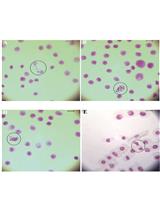
Figure 5. Cell and DNA spreading on slides. (A) Take 2 μl of cell suspension, draw a 7 mm line on the indicated area of the slide. (B) Wait 5-6 min to allow the suspension to dry halfway until you can see the dots in the spreading area as shown. Don’t fully dry the cells as shown below. (C) Drop 10 μl of lysis buffer to cover all of the cell spreading lines. (D) Lift over the apparatus to activate DNA spreading. The dashed line area is expected to contain most of the high-quality fibers.Air dry at room temperature for at least 30 min.
Fix 5-10 min in fixation buffer in a Coplin jar in the hood.
Decant fixation buffer, take out the slides, air dry slides in the hood on a diaper for at least 20 min.
Store slides at -20°C for at least a day to a maximum of 3 days.
Note: Extra cells in PBS can be kept for less than 6 days at 4°C.
Staining
Treat the slides with denature buffer for 70 min in a Coplin jar (Figure 6A).
Rinse 3 times with PBS in the Coplin jars, washing both sides of the slide.
Tile the slides in precut plastic bags, the DNA spreading side face up, apply 100 μl blocking buffer for each slide, then cover the the slides with the other half of the plastic bag. Incubate 1 h at room temperature. (Figure 6B-6E).
Note: Sterile filter serum to reduce background staining.
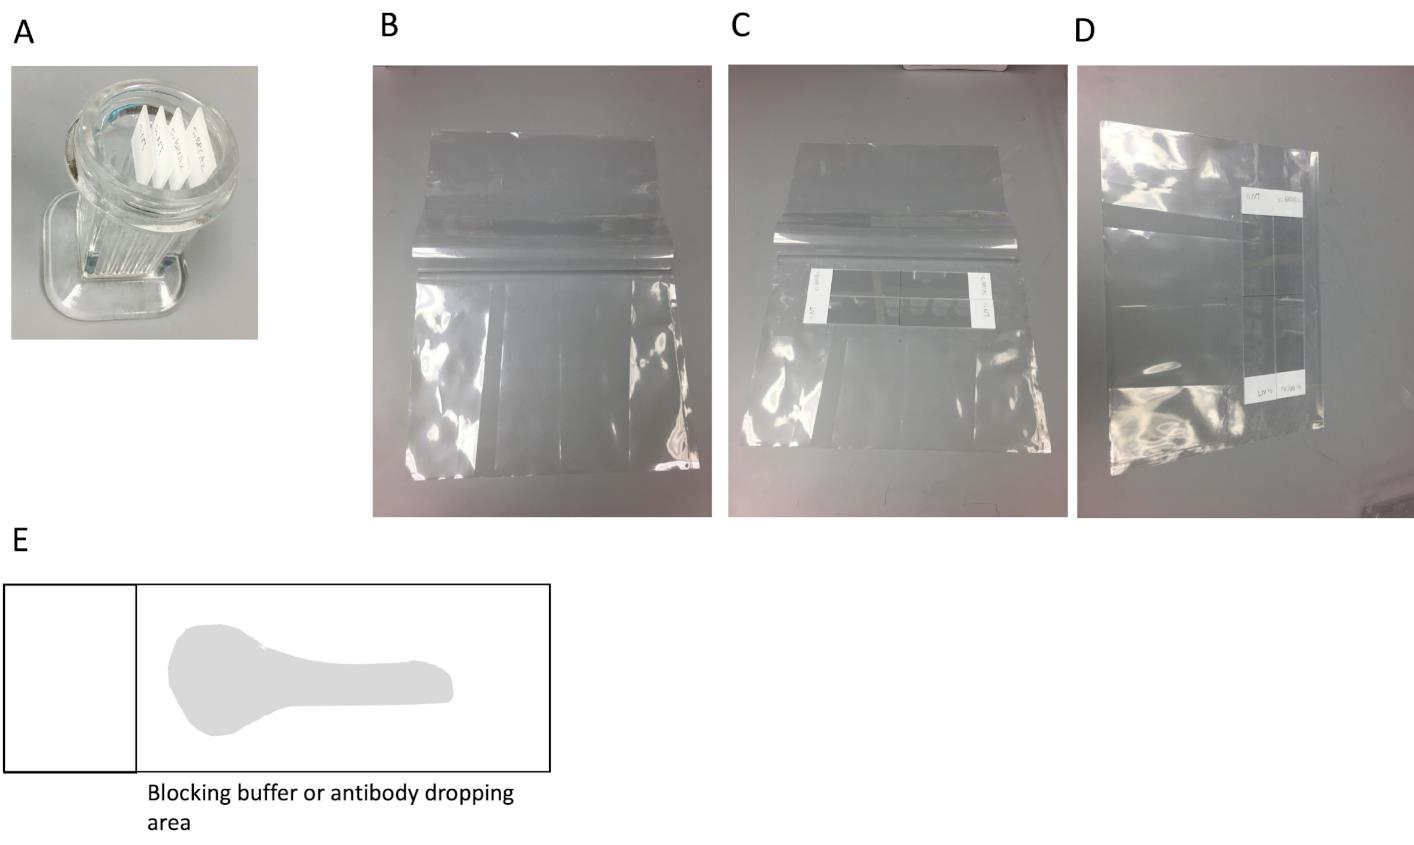
Figure 6. Fiber staining. (A) Denaturing or washing slides in the Coplin jar. (B) Precut two sides of the plastic bag. (C) Tile the slides on the bag. (D) Drop blocking buffer or antibody, then cover another half of the plastic membrane, avoiding air bubbles. (E) Drop blocking buffer and antibodies in the position shown in the shadowed area.Dilute rat monoclonal anti-BrdU (anti-CldU ab6326) and mouse anti-BrdU (anti-IdU BD347580) 1/100 in blocking buffer, for example, 1 μl of rat anti-BrdU and 1 μl of mouse anti-BrdU in 98 μl of blocking buffer. Apply 100 μl of diluted primary antibody to each slide (Figure 6D-6E), cover the slides with the plastic membrane as in the blocking step, and incubate 2 h at room temperature.
Notes:
Make sure no air bubbles are present. Place the drop at the white frosted end and leave it gently to allow the drop to diffuse across the slide.
All incubations are done in the dark, so it is easiest to just place the slides in a drawer.
Rinse 3 times in PBS in the Coplin jar.
Dilute Goat anti-rat IgG Alexa Fluor 594 and Goat anti-mouse Alexa Fluor 488 1:350 in blocking buffer. Apply 100 µl per slide (Figure 6D-6E). Incubate 1 h in the dark in new precut bags.
Rinse 3 times in PBS in the Coplin jar.
Air dry in the dark for ~10-15 min.
Mount with ~35 µl Prolong Gold without DAPI using whole slide coverslips.
Notes:
Align coverslip with the white edge of the slide.
Minimize air bubbles.
Let dry overnight in the dark and your slides are ready.
Notes:
Add nail polish to corners for immediate viewing.
After slides have dried overnight at room temperature, place them in a slide box in 4°C to preserve the signal until ready to view. It is recommended visualizing the slides as soon as possible, or within one week.
Imaging
Look for fibers under the green or red channel (IdU is green, CldU is red).
For the Nikon microscope in this protocol, switch to 40× using oil, turn the focus number approximately to 2,050, which should be around the focus on the fiber layer.
Fibers will be in the same plane as background specks.
Align the objective with the area of the slide where cells were placed (Figure 5D).
Proceed slowly, since fibers have a very small field of focus and are easy to pass by.
Most of the fibers are detected in the section of the slide towards the frosted end.
Only capture individual fibers that have a clear boundary between red and green.
Data analysis
Fiber measuring (Figure 7)
Click the ‘2 points’ button on the right side as shown in Figure 7A, the arrow will turn to measure mode (Figure 7A).
Click the beginning of the red fiber (Figure 7B), then click the end of the red fiber to finish the red fiber length measuring event (Figure 7C). The length of the fiber measured appears in the table (Figure 7D).
Repeat the measuring for the green fiber. One complete fiber measurement should consist of both red and green.
Only measure fibers that are straight and have no overlaps with other tracks.
Always measure the red fiber first then followed by measuring the green fiber that is adjunct to the red fiber you have measured.
Always measure fibers that have dual color staining without long gaps to make sure they belong to one replication event.
Always measure a single fiber that has beginning and termination.
Always measure fibers you are confident in.
For reproducible results, 200 fibers are usually required. Click Export to copy data to Excel (Figure 7E).
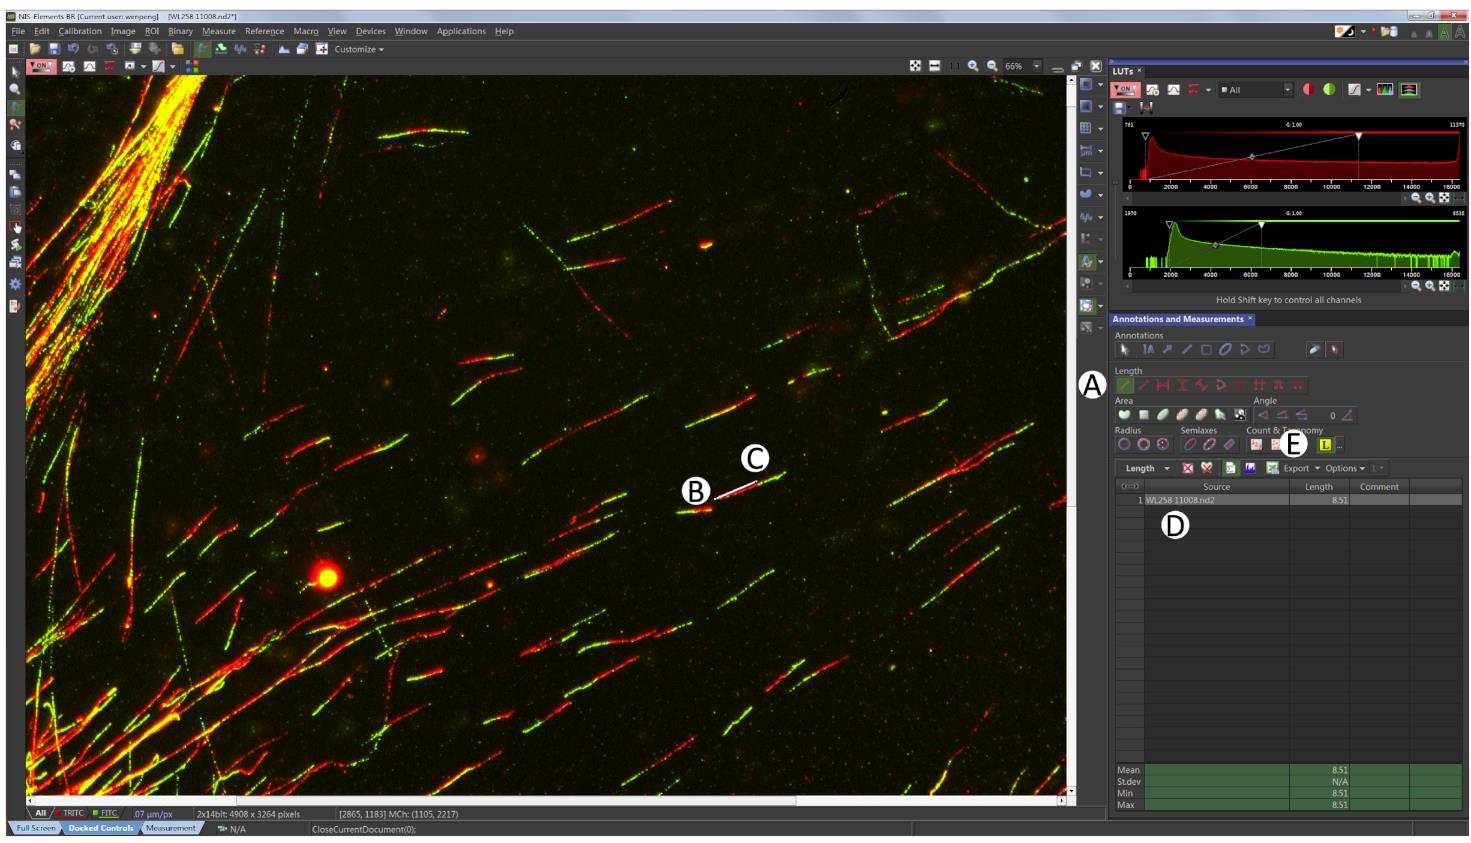
Figure 7. Fibers measuring. Click the two points button as shown in (A), then go ahead to measure the red fiber by clicking (B) and (C), to generate the red fiber length data as shown in (D). Always measure red fibers first followed by green. Click Export as shown in (E) to export the fiber length to Excel.Data analysis
Export the fiber length data to Excel, delete columns from D onwards (Figure 8).
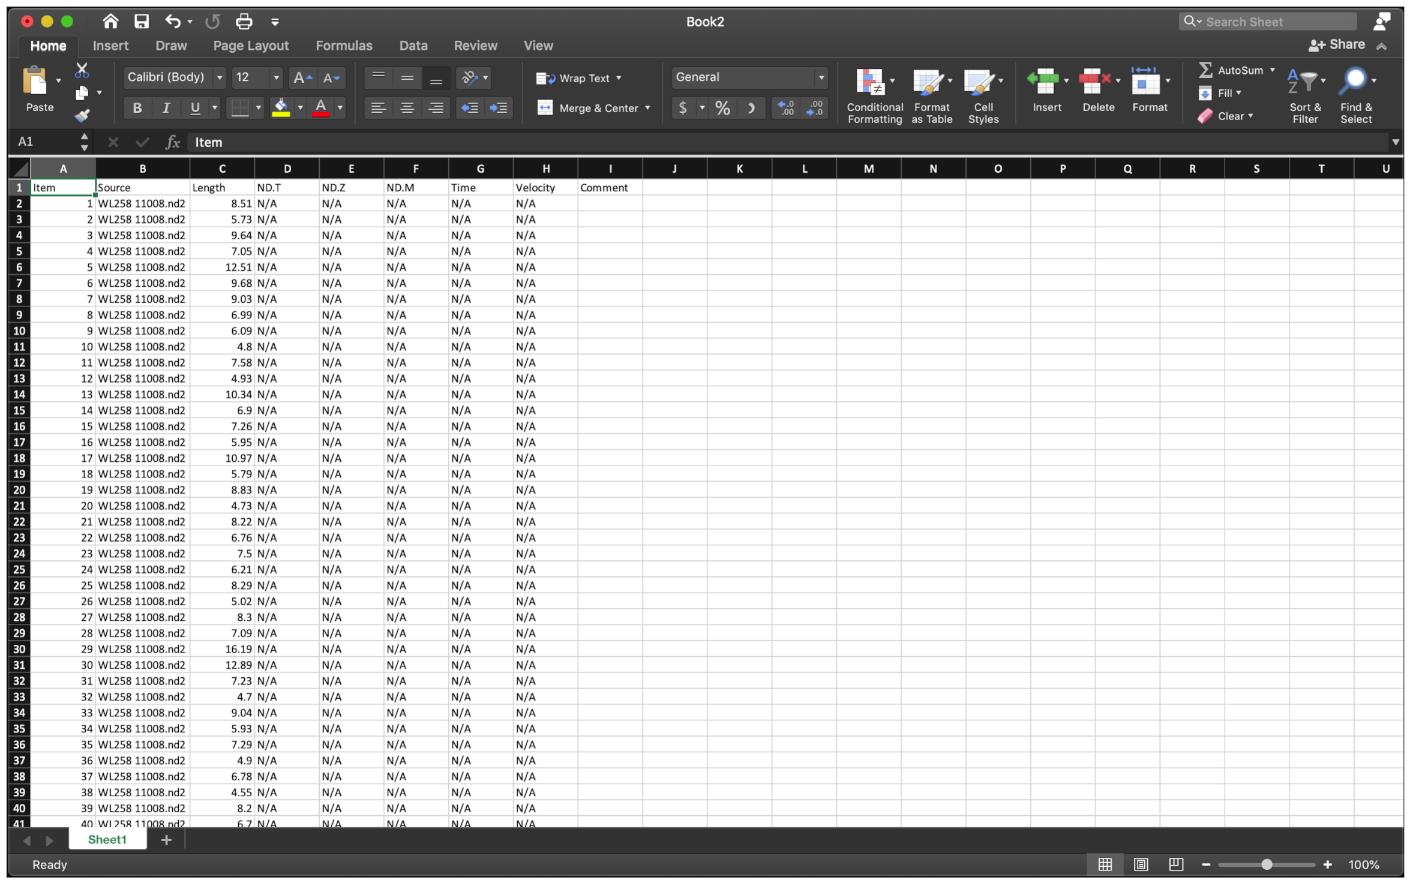
Figure 8. Paste the fiber length data to Excel.The fiber length number order should be red-green for the first fiber, and again red-green for the next fiber, etc.
For the NSD assay, we calculate the ratio of Lengthgreen/Lengthred. Therefore, divide the first fiber (red) length number by the second fiber (green) length, using the function “=C3/C2” at row 2, then extend the division to the last row of the data set (Figure 9).
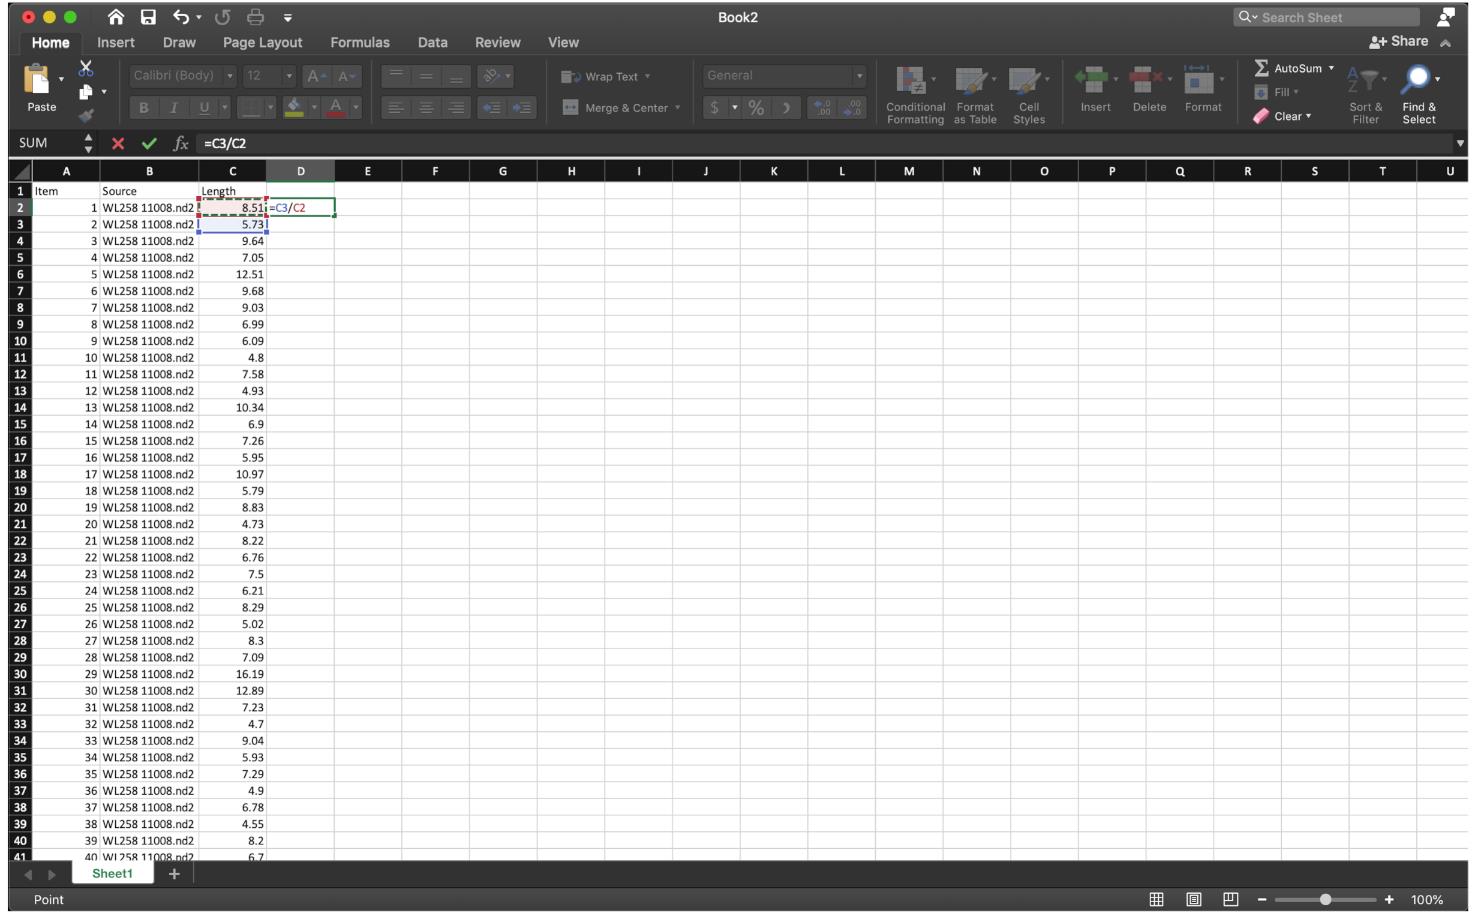
Figure 9. Divide the first red fiber length by the first green fiber length as shown, then extend the cell down to the end.To sort out the ratio of IdU/CldU for each fiber in an odd number row, use the function ” =IF(MOD(ROW(),2)=0,1,0)” at row 2 of column E to label the data we need, then extend to the last row of the data set (Figure 10).
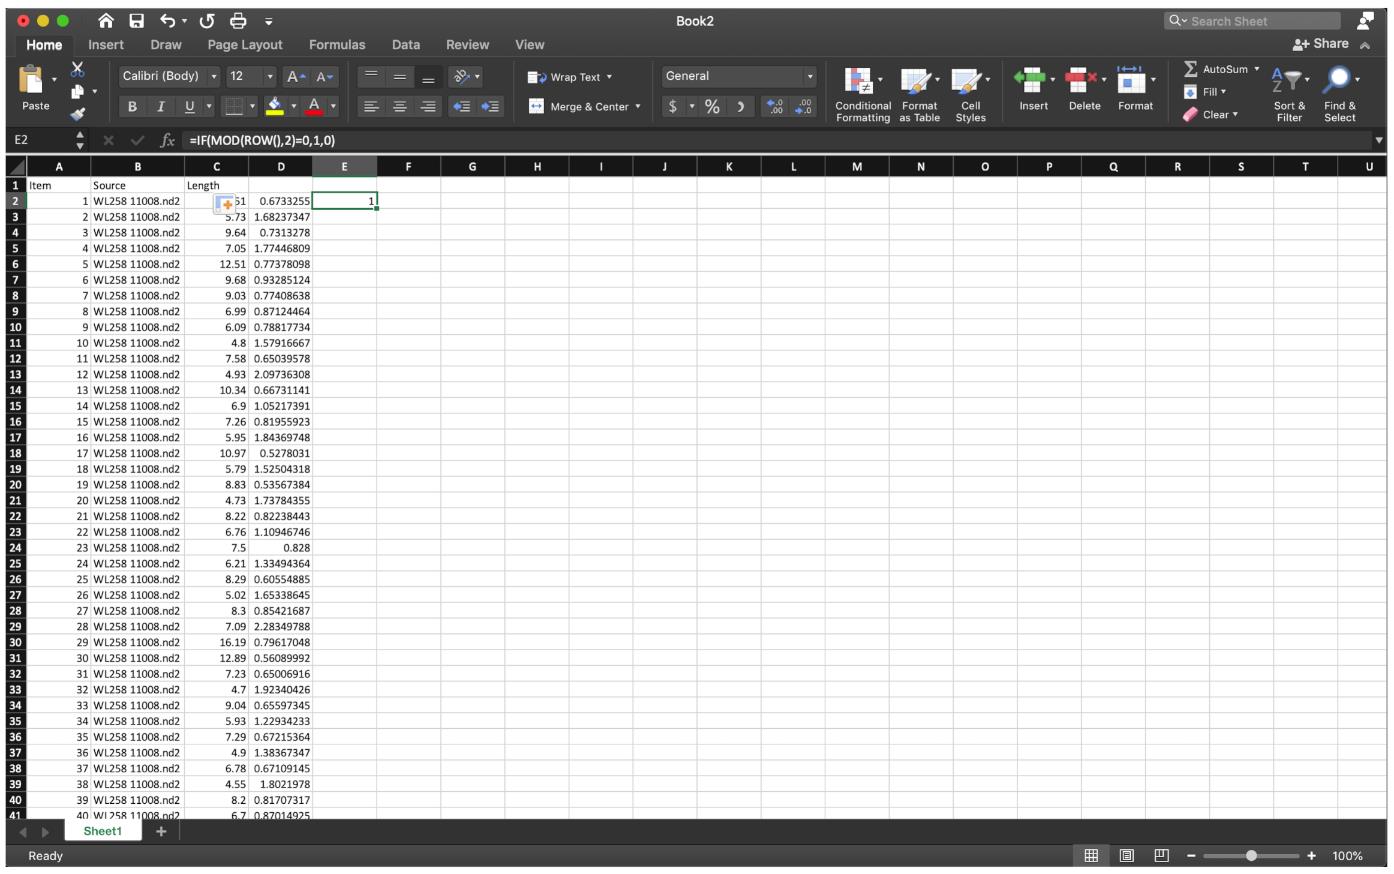
Figure 10. Label the data of interest by function” =IF(MOD(ROW(),2)=0,1,0)”, extend down to the end.Since we need the ratio of IdU/CldU for each fiber, rather than the quotient of CldU of the next fiber over the IdU of the last fiber, to sort the data row we need, apply the sorting function at column E, then select the row labeled as 1 to sort the quotient (Figure 11).
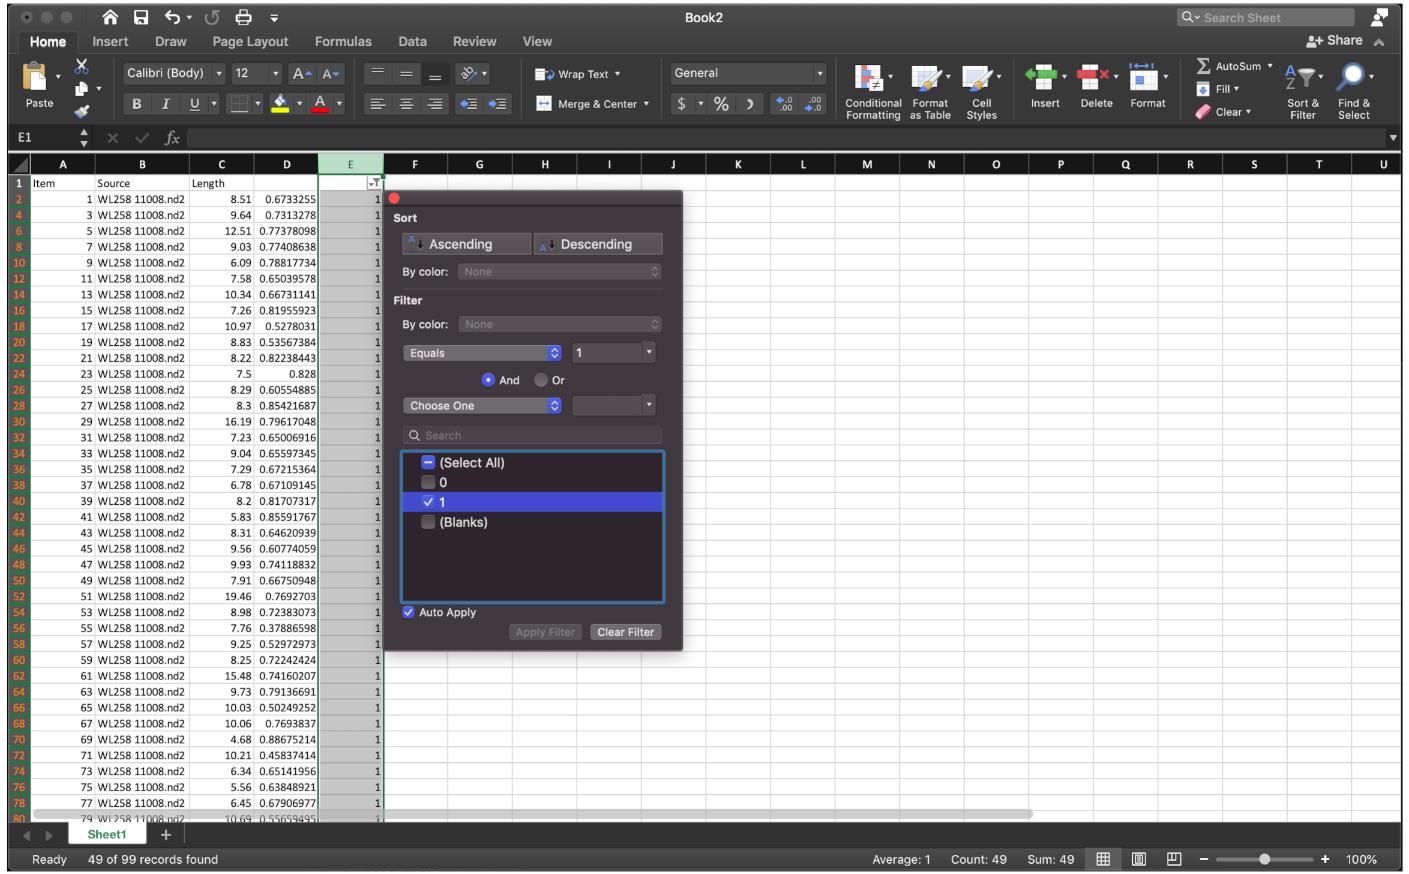
Figure 11. Sorting the data by the filter as shown.Copy the quotient for each fiber for each sample to Prism 8.
Plot data with Prism 8
Open Prism 8, click the column at the left side menu. Choose the option as shown in Figure 12A.
Input the sample name to the first row of the table. The control sample is “siNT”, BRCA2 knockdown sample is “siBRCA2”. Then paste the data points from the Excel file (Figure 12B).
Click the “Graphs” button on the left side, then choose the options as the figure. Double click the data points in the graph, then choose the option as shown in Figure 12C.
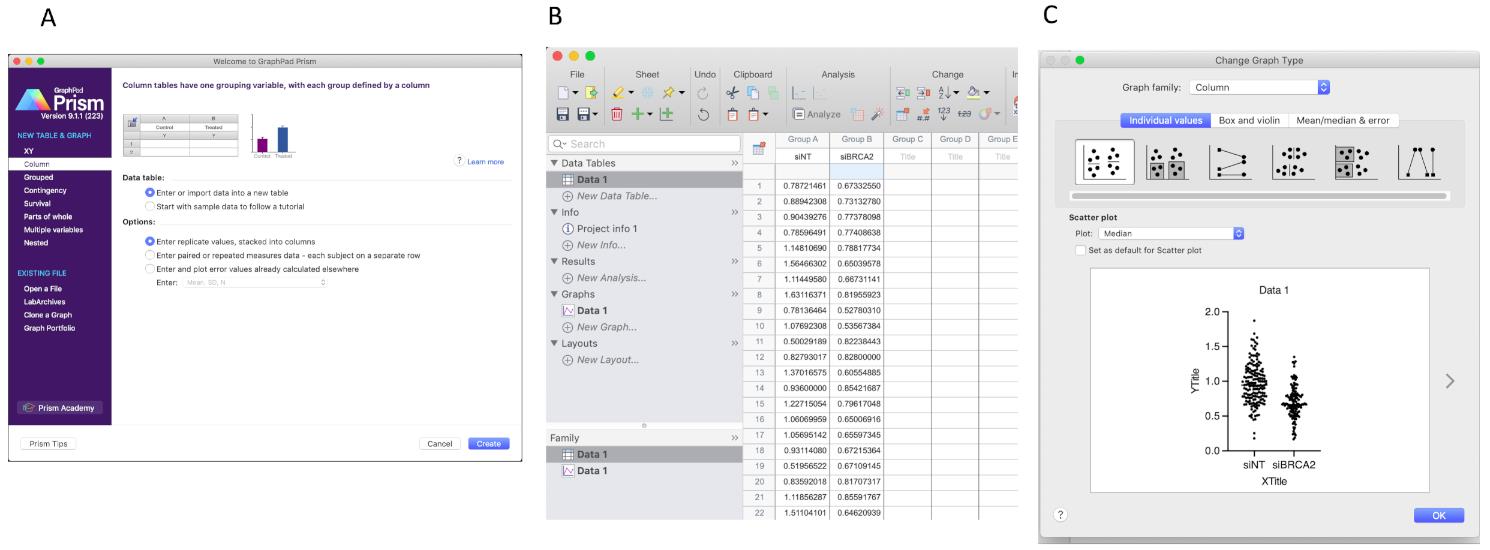
Figure 12. Copy the IdU/CldU ratio data from Excel to Prism 8. (A) Create a new form as shown. (B) Paste data to the column then click Data 1 in the Graphs tab on the left. Once the graph type option pops out (C), click OK.Click OK, get the graph, then modify the graph as you need (Figure 13).
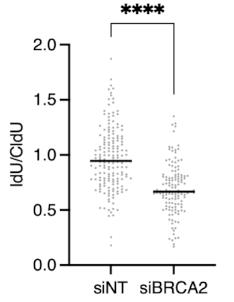
Figure 13. Decorate the graph. In the absence of BRCA2, the ratio of IdU/CldU is less than 1, suggesting that nascent DNA is degraded, consistent with the previous studies.Statistics
Perform the statistics in Prism 8. For details please see: https://www.graphpad.com/guides/prism/latest/statistics/index.htm.
Notes
For the labeling protocol used in other applications, please see Figure 2A. See below for analysis data:
Fork speed. For the fork speed purpose, please plot CldU or IdU fiber length instead of the ratio.
Fork restart. Count the dual-color fibers (restart fibers) and red only fibers (stalled fibers), then calculate the ratio of dual-color fiber number over total counted fiber.
Fork reversal. Only applied in the limit condition when NSD is rescued due to inactivation of fork reversal. The measurement is the same as the NSD assay, plot the ratio of IdU/CldU.
ssDNA gaps detection. For the S1 nuclease treatment see details in Bai et al. (2020) . The measurement is fiber length.
Recipes
IdU
IdU is resuspended in 1 N ammonium hydroxide at 50 mg/ml or 141.2 mM, and stored at -20°C for up to 3 years.
CldU
CldU is resuspended in 1 N ammonium hydroxide at 20 mg/ml or 76.1 mM, and stored at -20°C for up to 3 years.
HU
76.08 mg HydroxyUrea dissolved in 1 ml water to get 1 M HU solution. For best performance, use fresh everytime.
Fiber spreading buffer
0.5% SDS
200 mM Tris-HCl pH 7.4 (check the pH of Tris before use)
50 mM EDTA
Disolve in ddH2O
Prepare fresh before use
Fixation buffer
3:1 methanol:acetic acid, make fresh every time before use.
Denature buffer
Dilute the concentrated hydrochloric acid (~14 M) to 2.5 M with water. Make fresh every time before use.
Blocking buffer
10% goat serum dissolved in PBSTw (0.1% Triton in PBS), make fresh every time before use.
Acknowledgments
Funding: This research was supported by grants to D.C. from the NIH (R01GM116616) and the Breast Cancer Research Foundation. Thanks for the original protocol that is used in Liu et al. (2020; DOI: 10.1126/sciadv.abc3598) from Cortez Lab.
Competing interests
No competing interests declared.
References
- Bai, G., Kermi, C., Stoy, H., Schiltz, C. J., Bacal, J., Zaino, A. M., Hadden, M. K., Eichman, B. F., Lopes, M. and Cimprich, K. A. (2020). HLTF Promotes Fork Reversal, Limiting Replication Stress Resistance and Preventing Multiple Mechanisms of Unrestrained DNA Synthesis. Mol Cell 78(6): 1237-1251 e1237.
- Berti, M., Cortez, D. and Lopes, M. (2020a). The plasticity of DNA replication forks in response to clinically relevant genotoxic stress. Nat Rev Mol Cell Biol 21(10): 633-651.
- Berti, M., Teloni, F., Mijic, S., Ursich, S., Fuchs, J., Palumbieri, M. D., Krietsch, J., Schmid, J. A., Garcin, E. B., Gon, S., et al. (2020b). Sequential role of RAD51 paralog complexes in replication fork remodeling and restart. Nat Commun 11(1): 3531.
- Bhat, K. P. and Cortez, D. (2018). RPA and RAD51: fork reversal, fork protection, and genome stability. Nat Struct Mol Biol 25(6): 446-453.
- Dungrawala, H., Bhat, K. P., Le Meur, R., Chazin, W. J., Ding, X., Sharan, S. K., Wessel, S. R., Sathe, A. A., Zhao, R. and Cortez, D. (2017). RADX Promotes Genome Stability and Modulates Chemosensitivity by Regulating RAD51 at Replication Forks. Mol Cell 67(3): 374-386 e375.
- Genois, M. M., Gagne, J. P., Yasuhara, T., Jackson, J., Saxena, S., Langelier, M. F., Ahel, I., Bedford, M. T., Pascal, J. M., Vindigni, A., et al. (2021). CARM1 regulates replication fork speed and stress response by stimulating PARP1. Mol Cell 81(4): 784-800 e788.
- Krishnamoorthy, A., Jackson, J., Mohamed, T., Adolph, M., Vindigni, A. and Cortez, D. (2021). RADX prevents genome instability by confining replication fork reversal to stalled forks. Mol Cell 81(14): 3007-3017 e3005.
- Liu, W., Krishnamoorthy, A., Zhao, R. and Cortez, D. (2020). Two replication fork remodeling pathways generate nuclease substrates for distinct fork protection factors. Sci Adv 6(46): eabc3598.
- Liu, W., Zhou, M., Li, Z., Li, H., Polaczek, P., Dai, H., Wu, Q., Liu, C., Karanja, K. K., Popuri, V., et al. (2016). A Selective Small Molecule DNA2 Inhibitor for Sensitization of Human Cancer Cells to Chemotherapy. EBioMedicine 6: 73-86.
- Mason, J. M., Chan, Y. L., Weichselbaum, R. W. and Bishop, D. K. (2019). Non-enzymatic roles of human RAD51 at stalled replication forks. Nat Commun 10(1): 4410.
- Mehta, K. P. M., Lovejoy, C. A., Zhao, R., Heintzman, D. R. and Cortez, D. (2020). HMCES Maintains Replication Fork Progression and Prevents Double-Strand Breaks in Response to APOBEC Deamination and Abasic Site Formation. Cell Rep 31(9): 107705.
- Mijic, S., Zellweger, R., Chappidi, N., Berti, M., Jacobs, K., Mutreja, K., Ursich, S., Ray Chaudhuri, A., Nussenzweig, A., Janscak, P., et al. (2017). Replication fork reversal triggers fork degradation in BRCA2-defective cells. Nat Commun 8(1): 859.
- Mukherjee, C., Tripathi, V., Manolika, E. M., Heijink, A. M., Ricci, G., Merzouk, S., de Boer, H. R., Demmers, J., van Vugt, M. and Ray Chaudhuri, A. (2019). RIF1 promotes replication fork protection and efficient restart to maintain genome stability. Nat Commun 10(1): 3287.
- Palermo, V., Rinalducci, S., Sanchez, M., Grillini, F., Sommers, J. A., Brosh, R. M., Jr., Zolla, L., Franchitto, A. and Pichierri, P. (2016). CDK1 phosphorylates WRN at collapsed replication forks. Nat Commun 7: 12880.
- Przetocka, S., Porro, A., Bolck, H. A., Walker, C., Lezaja, A., Trenner, A., von Aesch, C., Himmels, S. F., D'Andrea, A. D., Ceccaldi, R., et al. (2018). CtIP-Mediated Fork Protection Synergizes with BRCA1 to Suppress Genomic Instability upon DNA Replication Stress. Mol Cell 72(3): 568-582 e566.
- Quinet, A., Tirman, S., Jackson, J., Svikovic, S., Lemacon, D., Carvajal-Maldonado, D., Gonzalez-Acosta, D., Vessoni, A. T., Cybulla, E., Wood, M., et al. (2020). PRIMPOL-Mediated Adaptive Response Suppresses Replication Fork Reversal in BRCA-Deficient Cells. Mol Cell 77(3): 461-474 e469.
- Schlacher, K., Christ, N., Siaud, N., Egashira, A., Wu, H. and Jasin, M. (2011). Double-strand break repair-independent role for BRCA2 in blocking stalled replication fork degradation by MRE11. Cell 145(4): 529-542.
- Schlacher, K., Wu, H. and Jasin, M. (2012). A distinct replication fork protection pathway connects Fanconi anemia tumor suppressors to RAD51-BRCA1/2. Cancer Cell 22(1): 106-116.
- Taglialatela, A., Alvarez, S., Leuzzi, G., Sannino, V., Ranjha, L., Huang, J. W., Madubata, C., Anand, R., Levy, B., Rabadan, R., et al. (2017). Restoration of Replication Fork Stability in BRCA1- and BRCA2-Deficient Cells by Inactivation of SNF2-Family Fork Remodelers. Mol Cell 68(2): 414-430 e418.
- Zellweger, R., Dalcher, D., Mutreja, K., Berti, M., Schmid, J. A., Herrador, R., Vindigni, A. and Lopes, M. (2015). Rad51-mediated replication fork reversal is a global response to genotoxic treatments in human cells. J Cell Biol 208(5): 563-579.
Article Information
Copyright
© 2021 The Authors; exclusive licensee Bio-protocol LLC.
How to cite
Readers should cite both the Bio-protocol article and the original research article where this protocol was used:
- Liu, W. (2021). Single Molecular Resolution to Monitor DNA Replication Fork Dynamics upon Stress by DNA Fiber Assay. Bio-protocol 11(24): e4269. DOI: 10.21769/BioProtoc.4269.
- Liu, W., Krishnamoorthy, A., Zhao, R. and Cortez, D. (2020). Two replication fork remodeling pathways generate nuclease substrates for distinct fork protection factors. Sci Adv 6(46): eabc3598.
Category
Biophysics > Single-molecule technique
Biophysics > Microscopy
Biochemistry > DNA > Single-molecule Activity > Imaging
Do you have any questions about this protocol?
Post your question to gather feedback from the community. We will also invite the authors of this article to respond.