- Protocols

- Articles and Issues
- For Authors
- About
- Become a Reviewer

A Simple Method for in situ Quantification of Cells on Carriers
Published: Vol 11, Iss 23, Dec 5, 2021 DOI: 10.21769/BioProtoc.4254 Views: 2722
Reviewed by: Alessandro DidonnaCristina SuárezSneha Ray
Original research article
The authors used this protocol in:

Oct 2021
Advertisement


Protocol Collections
Comprehensive collections of detailed, peer-reviewed protocols focusing on specific topics


Abstract
The technology of cell carriers was developed as a response to the need for high cell density to enable higher production levels in cell-based production processes. To follow the production process, quantifying the number of cells on these carriers is required, as well as tracking their viability and proliferation. However, owing to various carriers’ unique structures, tracking the cells is challenging using current traditional assays that were originally developed for monolayers of adherent cells. The current "gold standard" method is counting cell nuclei, which is tedious and counts both live and dead cells. A few other techniques have been developed, but they are all specific to a carrier type and involve specialized equipment. Here, we describe a broad ranging method for counting cells on carriers. The method is based on the Alamar blue dye, a well-known, common marker for cell activity. No separation of the cells from the carriers is needed, nor is any specialized equipment. The method is simple and rapid, and provides comprehensive details necessary for control of production processes in cells. This method can be easily implemented in any cell-based process and other unique platforms for measuring growth of cells.
Graphic abstract:
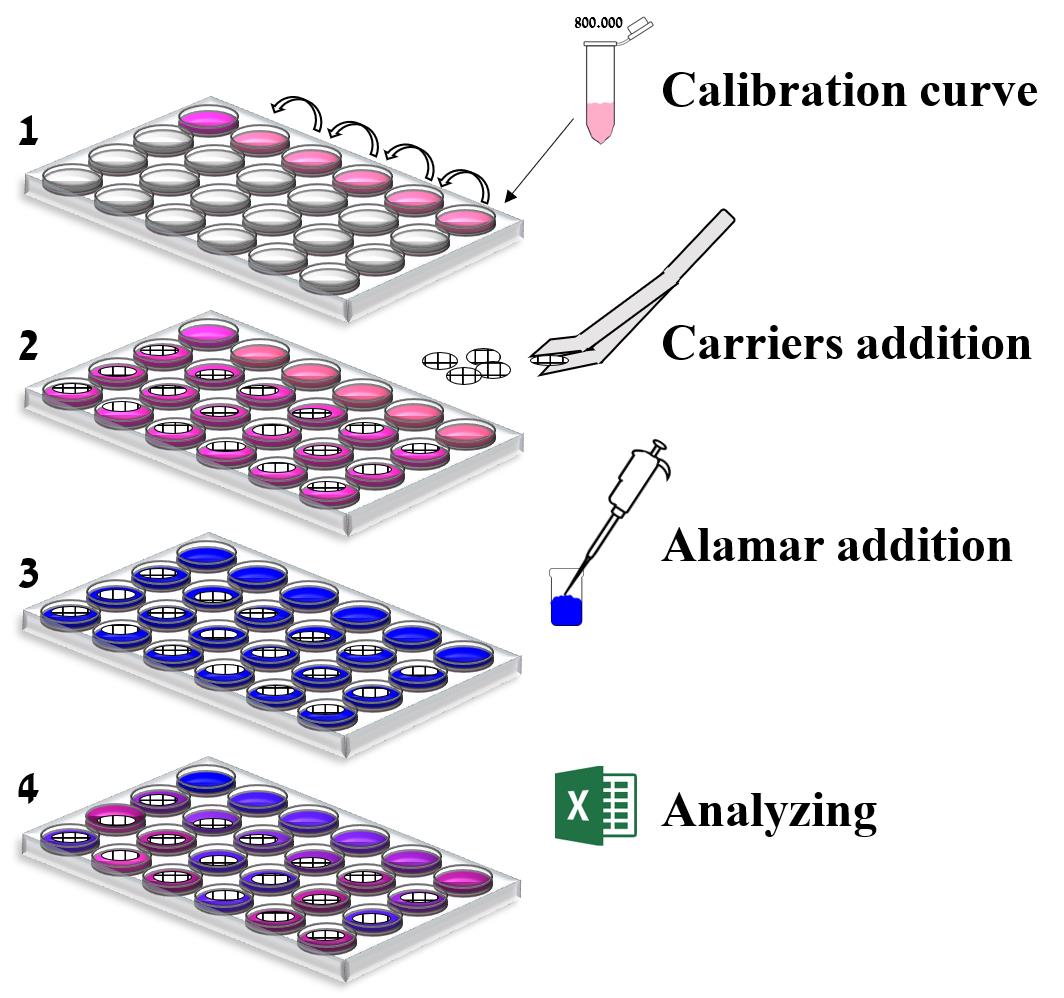
Schematic of the in situ quantification method.
Background
Cell culture-based production is gaining increasing attention owing to the need for new manufacturing strategies. The advantages of cell-based production processes include the use of defined and serum-free cell cultures that allow greater consistency. Moreover, cell-based processes can be adapted to manufacturing processes involving bioreactors that are scalable and need less space (Aubrit et al., 2015). The mounting use of cell culture-based vaccine production, together with a quest for a more efficient and scalable process, have stimulated the development and implementation of carrier technology. Micro and macrocarriers are small compact surface support matrices for growing adherent cells. Those carriers (from the micrometer to the millimeter size range for micro and macrocarriers, respectively) and their density allows their maintenance in suspension with gentle stirring (Huang et al., 2020).
To better follow and understand a production process, it is necessary to quantify the number of cells on these carriers, as well as to track their viability and proliferation. The gold standard method for quantification of cells on micro and macrocarriers is nuclear staining (Sanford et al., 1951). In this method, cells are separated from the carriers, stained with crystal violet, and counted visually under a microscope. The method is tedious (Berry et al., 1996) and counts both live and dead cells, making it unsuitable for tracking cell condition. As a result, a method that can better quantify cells on micro and macrocarriers is desirable.
Counting cells on carriers poses a challenge to traditional assays due to the carriers’ shape. The main feature of the widely used methods to measure cell quantity (Riss et al., 2013) is dyeing the cells with a fluorescent or colorimetric dye and quantifying the results based on fluorescence or absorbance. Examples of such dyes are glycyl-phenylalanyl-aminofluorocoumarin (GF-AFC), 3-(4,5-dimethylthiazol-2-yl)-2,5-diphenyltetrazolium bromide (MTT), 3-(4,5-dimethylthiazol-2-yl)-5-(3-carboxymethoxyphenyl)-2-(4-sulfophenyl)-2H-tetrazolium (MTS), 2,3-bis-(2-methoxy-4-nitro-5-sulfophenyl)-2H-tetrazolium-5-carboxanilide (XTT), 4-[3-(4-iodophenyl)-2-(4-nitrophenyl)-2H-5-tetrazolio]-1,3-benzene disulfonate (WST-1), and resazurin (Alamar blue). These assays are relatively inexpensive and have a homogeneous format, but their use is limited to single layer cultures (Mosmann, 1983; Berridge and Tan, 1993; Marshall et al., 1995). A limited number of assays for cell quantification on carriers have been developed, but they all require specialized equipment that is not commercially available, and are “matched” with specific micro or macrocarriers (Farrell et al., 2016). Thus, to date, no assays for quantification of cells on carriers that are simple, rapid, reliable, and low-priced are commercially available.
Here, a method for quantification of cells on carriers is described. The assay utilizes Alamar blue, a well-known and common marker for cell activity (Rampersad, 2012), and includes a calibration curve with known cell numbers. When added to cell cultures, the oxidized form of Alamar blue enters the cytosol and is converted to the reduced form by mitochondrial enzyme activity. This redox reaction is accompanied by a shift in the color of the culture medium from indigo blue to fluorescent pink, which can be easily measured by fluorometry (Al-Nasiry et al., 2007). The method can quantify cells in situ on the carriers without requiring separation of cells from the carriers. The method is simple, rapid, elegant, does not require specialized reagents or equipment, and results are strongly correlated with the gold standard assay. The method can be easily adapted for any cell-based process or other unique platforms for cell growth, including additional carriers and other scaffolds for culturing cells such as hydrogels.
Materials and Reagents
1.5 ml Eppendorf tubes (Sarstedt, catalog number: 72.692.005)
Pipette tips (Filtered) (Thermo, catalog numbers: TF112-1000-Q [1,000 µl], T104RS-Q [10 µl], TF140-200-Q [200 µl])
24-well clear plates (Corning, catalog number: 3524-ND)
75 cm2 T-flasks (Grenier, catalog number: 658-975)
500 ml vacuum filter bottle system, Sterile (Corning, catalog number: 431097)
Counting vessels (Invitrogen, catalog number: C10283)
Aluminum foil (Nidix)
Vero cells (WHO, catalog number: RCB 10-87)
Note: Cells used for the calibration curve must be the same as cells on carriers.
L-alanine-L-glutamine (Biological Industries, catalog number: 03-022-1B)
NutriVero FLEX-20 (Biological Industries, catalog number: 05-069-1A)
Pen-strep antibiotics (Biological Industries, catalog number: 03-031-1C)
Phosphate buffered saline (PBS) (Biological Industries, catalog number: 02-020-1A)
Recombinant trypsin-EDTA solution (Biological Industries, catalog number: 03-079-1A)
Trypan blue solution (Biological Industries, catalog number: 03-102-1B)
Alamar blue (Promega, catalog number: G808)
Cell medium (see Recipes)
Equipment
Sterile tweezers (United Scientific Supplies, catalog number: 20A00R146)
Sterile scalpel (Asp medical, catalog number: LDT455)
Pipettors 200 and 1,000 µl (ThermoFisher Scientific, catalog numbers: 4652140, 4652080)
Incubator at 37°C with 5% CO2 (ThermoFisher Scientific, model: Heracell 150i)
Laminar flow hood (ThermoFisher Scientific, model: Msc-advantage)
Refrigerator 4°C (Mondial Elite, model: BEV PV 40 MED)
Centrifuge (Eppendorf, model: Minispin plus spin)
SPARK plate reader (NEOTEC BIO, TECAN)
Cytometer cell countess II (Invitrogen, model: AMQAX1000)
Heater (Talboys, microplate heater)
Software
Microsoft Excel 2010
Procedure
Preparing the cells
Maintain the cells in cell medium (see Recipes) in 75 cm2 T-flasks at 37°C under 5% CO2.
Harvest the cells by washing the flask one time at RT with 5 ml of PBS at room temperature (RT), followed by incubation at 37°C with 2 ml of trypsin-EDTA for 5 min.
Transfer the cells from the flask to a 1.5 ml Eppendorf tube.
Centrifuge the cells at RT for 5 min at 1,200 × g.
Remove the supernatant with a 1 ml pipette.
Resuspend the pellet in 1 ml of cell medium at 37°C, by pipetting the solution up and down five times.
Take a sample of 50 μl from the cell solution, and mix 1:1 with trypan blue in a 1.5 ml Eppendorf tube.
Count the cells with a cytometer cell countess.
Dilute as necessary by adding cell medium to reach a concentration of 800,000 cells/ml (stock for calibration curve). A total of 2 ml is necessary.
If the cells to be quantified were cultured and grew in different media than the one described here, the exact same conditions should apply to cells for the calibration curve.
Preparing the calibration curve
Add 1 ml of fresh medium to wells 1A, 2A, 3A, 4A, and 5A of a 24-well plate.
Place 2 ml of 800,000 cells/ml (stock for calibration curve, see A9) in well 6A.
Take 1 ml from well 6A, and transfer it to the adjacent well (5A).
Mix by gently pipetting five times with a 1 ml pipette.
Take 1 ml from well 5A, and transfer it to the adjacent well (4A).
Mix by gently pipetting five times with a 1 ml pipette.
Take 1 ml from well 4A, and transfer it to the adjacent well (3A).
Mix by gently pipetting five times with a 1 ml pipette.
Take 1 ml from well 3A, and transfer it to the adjacent well (2A).
Mix by gently pipetting five times with a 1 ml pipette.
Take 1 ml from well 2A and dispose of it.
Well 1A contains only 1 ml of fresh medium for negative control.
Wells 2A-6A contain 50,000, 100,000, 200,000, 400,000, and 800,000 cells, respectively (Figure 1).
Use another 24-well plate if there are more than 18 samples. In that case, prepare another calibration curve in the new plate as described above.
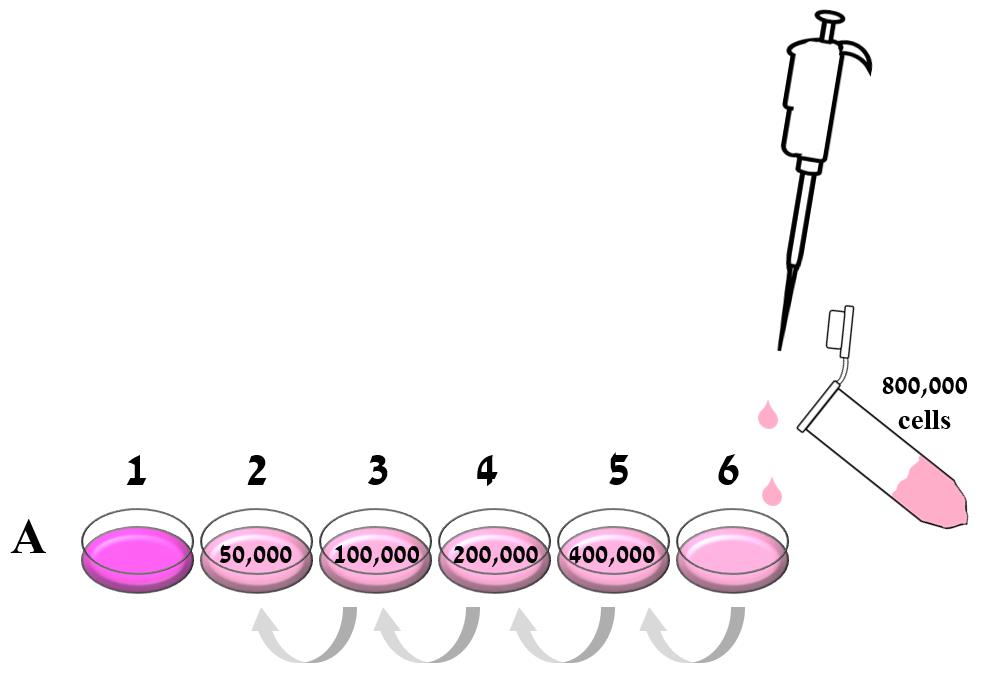
Figure 1. Preparation of the calibration curve. The cell stock was brought to 800,000 cells/ml, and 2 ml of it were added to well 6A in a 24 well plate. In the same row, 1 ml of culture medium was placed in the other five wells (1A-5A). A serial dilution was performed by taking 1 ml of 800,000 cell/ml from well A6 to the adjacent well (5A), and serially across the entire row so that wells contained 800,000, 400,000, 200,000, 100,000, and 50,000 cells. The last well in the row (1A) was left with 1 ml fresh medium as a blank control.
Determining the number of cells on carrier
Add 1 ml of cell medium to all empty wells in rows B, C, and D in the plate.
Place one carrier in a well containing 1ml of fresh medium.
Add 100 µl of Alamar blue to all wells in the plate.
Cover the plate with aluminum foil (protect from light).
Incubate the plate for 1 h at 37°C.
Read the plate in the SPARK plate reader, with Ex 550 nm, Em 580 nm filters.
Data analysis
Transfer the data to an Excel file.
In the Excel file, write the number of cells that were used in the calibration curve (50,000-800,000) on column A, and include the blank (no cells, from well A1).
Insert the corresponding fluorescence intensity values in the adjacent column (B).
Subtract the value of the blank from all fluorescence values, and write the results in the adjacent column (C). see example below (Figure 2).
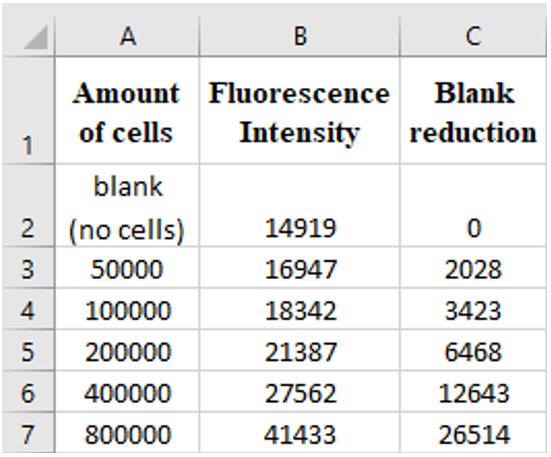
Figure 2. Example of data layout for analysis. The number of cells that were used for the calibration curve and their fluorescence intensity values are in columns A and B in an excel file. The fluorescence of the blank is subtracted from all values and written in column C.Write the fluorescence results from all other wells (containing cell-carriers). If several carriers were taken from the same vessel/reactor, write all results in the same column.
Average the results from step 5 (if more than one carrier from the same experiment) and subtract the value of the blank.
Calculate the number of cells on each carrier using the excel FORECAST formula based on the calibration curve (Figure 3).
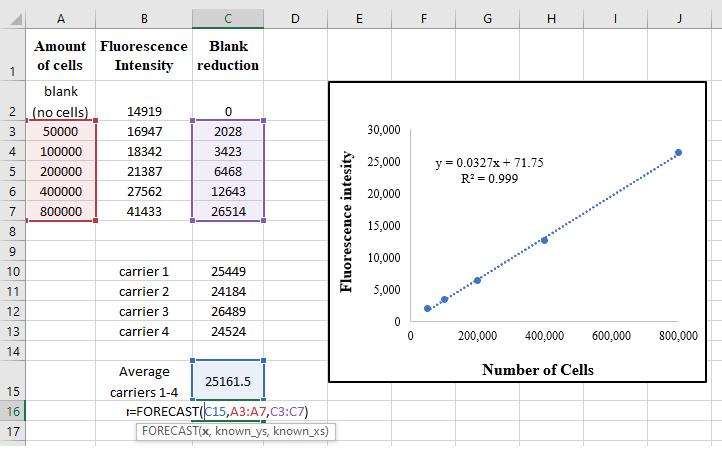
Figure 3. Example of data analysis. The fluorescence results from all wells (containing carriers) are written and their average is calculated. The amount of cells on the carriers is calculated by the FORECAST formula based on the calibration curve.
Notes
Every type of cells and carriers may be used.
Every validated 24-well plate may be used.
Every type of plate reader with suitable filters may be used.
For each 24-well plate, use its own calibration curve.
Cells for the calibration curve must be fresh and may be counted in every validated cytometer.
The method can quantify cells in different media, but the calibration curve must be performed under the same conditions.
Recipes
Cell medium
Take 500 ml of FLEX-20 medium
Add 5 ml of 200 mM L-alanine L-glutamine
Add 0.5 ml of pen-strep antibiotics
Filter the solution with a filter bottle
Acknowledgments
The protocol described here has been derived from the work of Rosen et al. (2021).
Competing interests
The authors declare not to have any competing interests
References
- Al-Nasiry, S., Geusens, N., Hanssens, M., Luyten, C. and Pijnenborg, R. (2007). The use of Alamar Blue assay for quantitative analysis of viability, migration and invasion of choriocarcinoma cells. Hum Reprod 22(5): 1304-1309.
- Aubrit, F., Perugi, F., Leon, A., Guehenneux, F., Champion-Arnaud, P., Lahmar, M. and Schwamborn, K. (2015). Cell substrates for the production of viral vaccines. Vaccine 33(44): 5905-5912.
- Berridge, M. V. and Tan, A. S. (1993). Characterization of the cellular reduction of 3-(4,5-dimethylthiazol-2-yl)-2,5-diphenyltetrazolium bromide (MTT): subcellular localization, substrate dependence, and involvement of mitochondrial electron transport in MTT reduction. Arch Biochem Biophys 303(2): 474-482.
- Berry, J. M., Huebner, E. and Butler, M. (1996). The crystal violet nuclei staining technique leads to anomalous results in monitoring mammalian cell cultures. Cytotechnology 21(1): 73-80.
- Farrell, C. J., Cicalese, S. M., Davis, H. B., Dogdas, B., Shah, T., Culp, T. and Hoang, V. M. (2016). Cell confluency analysis on microcarriers by micro-flow imaging. Cytotechnology 68(6): 2469-2478.
- Huang, L., Abdalla, A. M. E., Xiao, L. and Yang, G. (2020). Biopolymer-Based Microcarriers for Three-Dimensional Cell Culture and Engineered Tissue Formation. Int J Mol Sci 21(5): 1895.
- Mosmann, T. (1983). Rapid colorimetric assay for cellular growth and survival: application to proliferation and cytotoxicity assays. J Immunol Methods 65(1-2): 55-63.
- Marshall, N. J., Goodwin, C. J. and Holt, S. J. (1995). A critical assessment of the use of microculture tetrazolium assays to measure cell growth and function. Growth Regul 5(2): 69-84.
- Rampersad, S. N. (2012). Multiple applications of Alamar Blue as an indicator of metabolic function and cellular health in cell viability bioassays. Sensors (Basel) 12(9): 12347-12360.
- Riss, T. L., Moravec, R. A., Niles, A. L., Duellman, S., Benink, H. A., Worzella, T. J. and Minor, L. (2013). Cell viability assays. In: Markossian, S., Grossman, A., Brimacombe K, et al. (Eds.). Assay guidance manual. Eli Lilly & Company and the National Center for Advancing Translational Sciences.
- Rosen, O., Jayson, A., Natan, N., Monash, A., Girshengorn, M., Goldvaser, M., Levin, L. and Epstein, E. (2021). Novel method for quantifying cells on carriers and its demonstration during SARS-2 vaccine development. Biotechnol Bioeng 18(10): 3811-3820.
- Sanford, K. K., Earle, W. R., Evans, V. J., Waltz, H. K. and Shannon, J. E. (1951). The measurement of proliferation in tissue cultures by enumeration of cell nuclei. J Natl Cancer Inst 11(4): 773-795.
Article Information
Copyright
© 2021 The Authors; exclusive licensee Bio-protocol LLC.
How to cite
Rosen, O., Jayson, A., Natan, N. and Epstein, E. (2021). A Simple Method for in situ Quantification of Cells on Carriers. Bio-protocol 11(23): e4254. DOI: 10.21769/BioProtoc.4254.
Category
Cell Biology > Cell-based analysis
Cell Biology > Single cell analysis > Cell counter
Do you have any questions about this protocol?
Post your question to gather feedback from the community. We will also invite the authors of this article to respond.