- Protocols

- Articles and Issues
- For Authors
- About
- Become a Reviewer

Synchronized Real-time Measurement of Sec-mediated Protein Translocation
Published: Vol 11, Iss 16, Aug 20, 2021 DOI: 10.21769/BioProtoc.4129 Views: 3269
Reviewed by: Emilia KrypotouJose Antonio Reyes-DariasPetru-Iulian Trasnea
Original research article
The authors used this protocol in:

Jul 2020
Advertisement


Protocol Collections
Comprehensive collections of detailed, peer-reviewed protocols focusing on specific topics


Abstract
The Sec translocon, consisting of a heterotrimeric transmembrane channel (SecYEG) and an associated ATPase (SecA), catalyzes the export of unfolded proteins from the cytosol in bacteria. Kinetically resolving protein translocation at high resolution yields mechanistic insight into the process. Translocation is typically followed by measuring the protection of proteins transported into lipid vesicles, which only allows visualization of translocation after it has already been completed and limits time resolution. Here, we describe the implementation of an assay for measuring translocation in real-time. By priming the reconstituted translocon with suitably engineered substrate proteins, the kinetics of the actual translocation process can be resolved at high resolution. To analyze translocation kinetics, we developed a detailed kinetic model of the process that includes on-pathway and off-pathway processes. Together, this experimental protocol and model permit detailed mechanistic analyses of Sec-dependent protein translocation.
Graphic abstract:
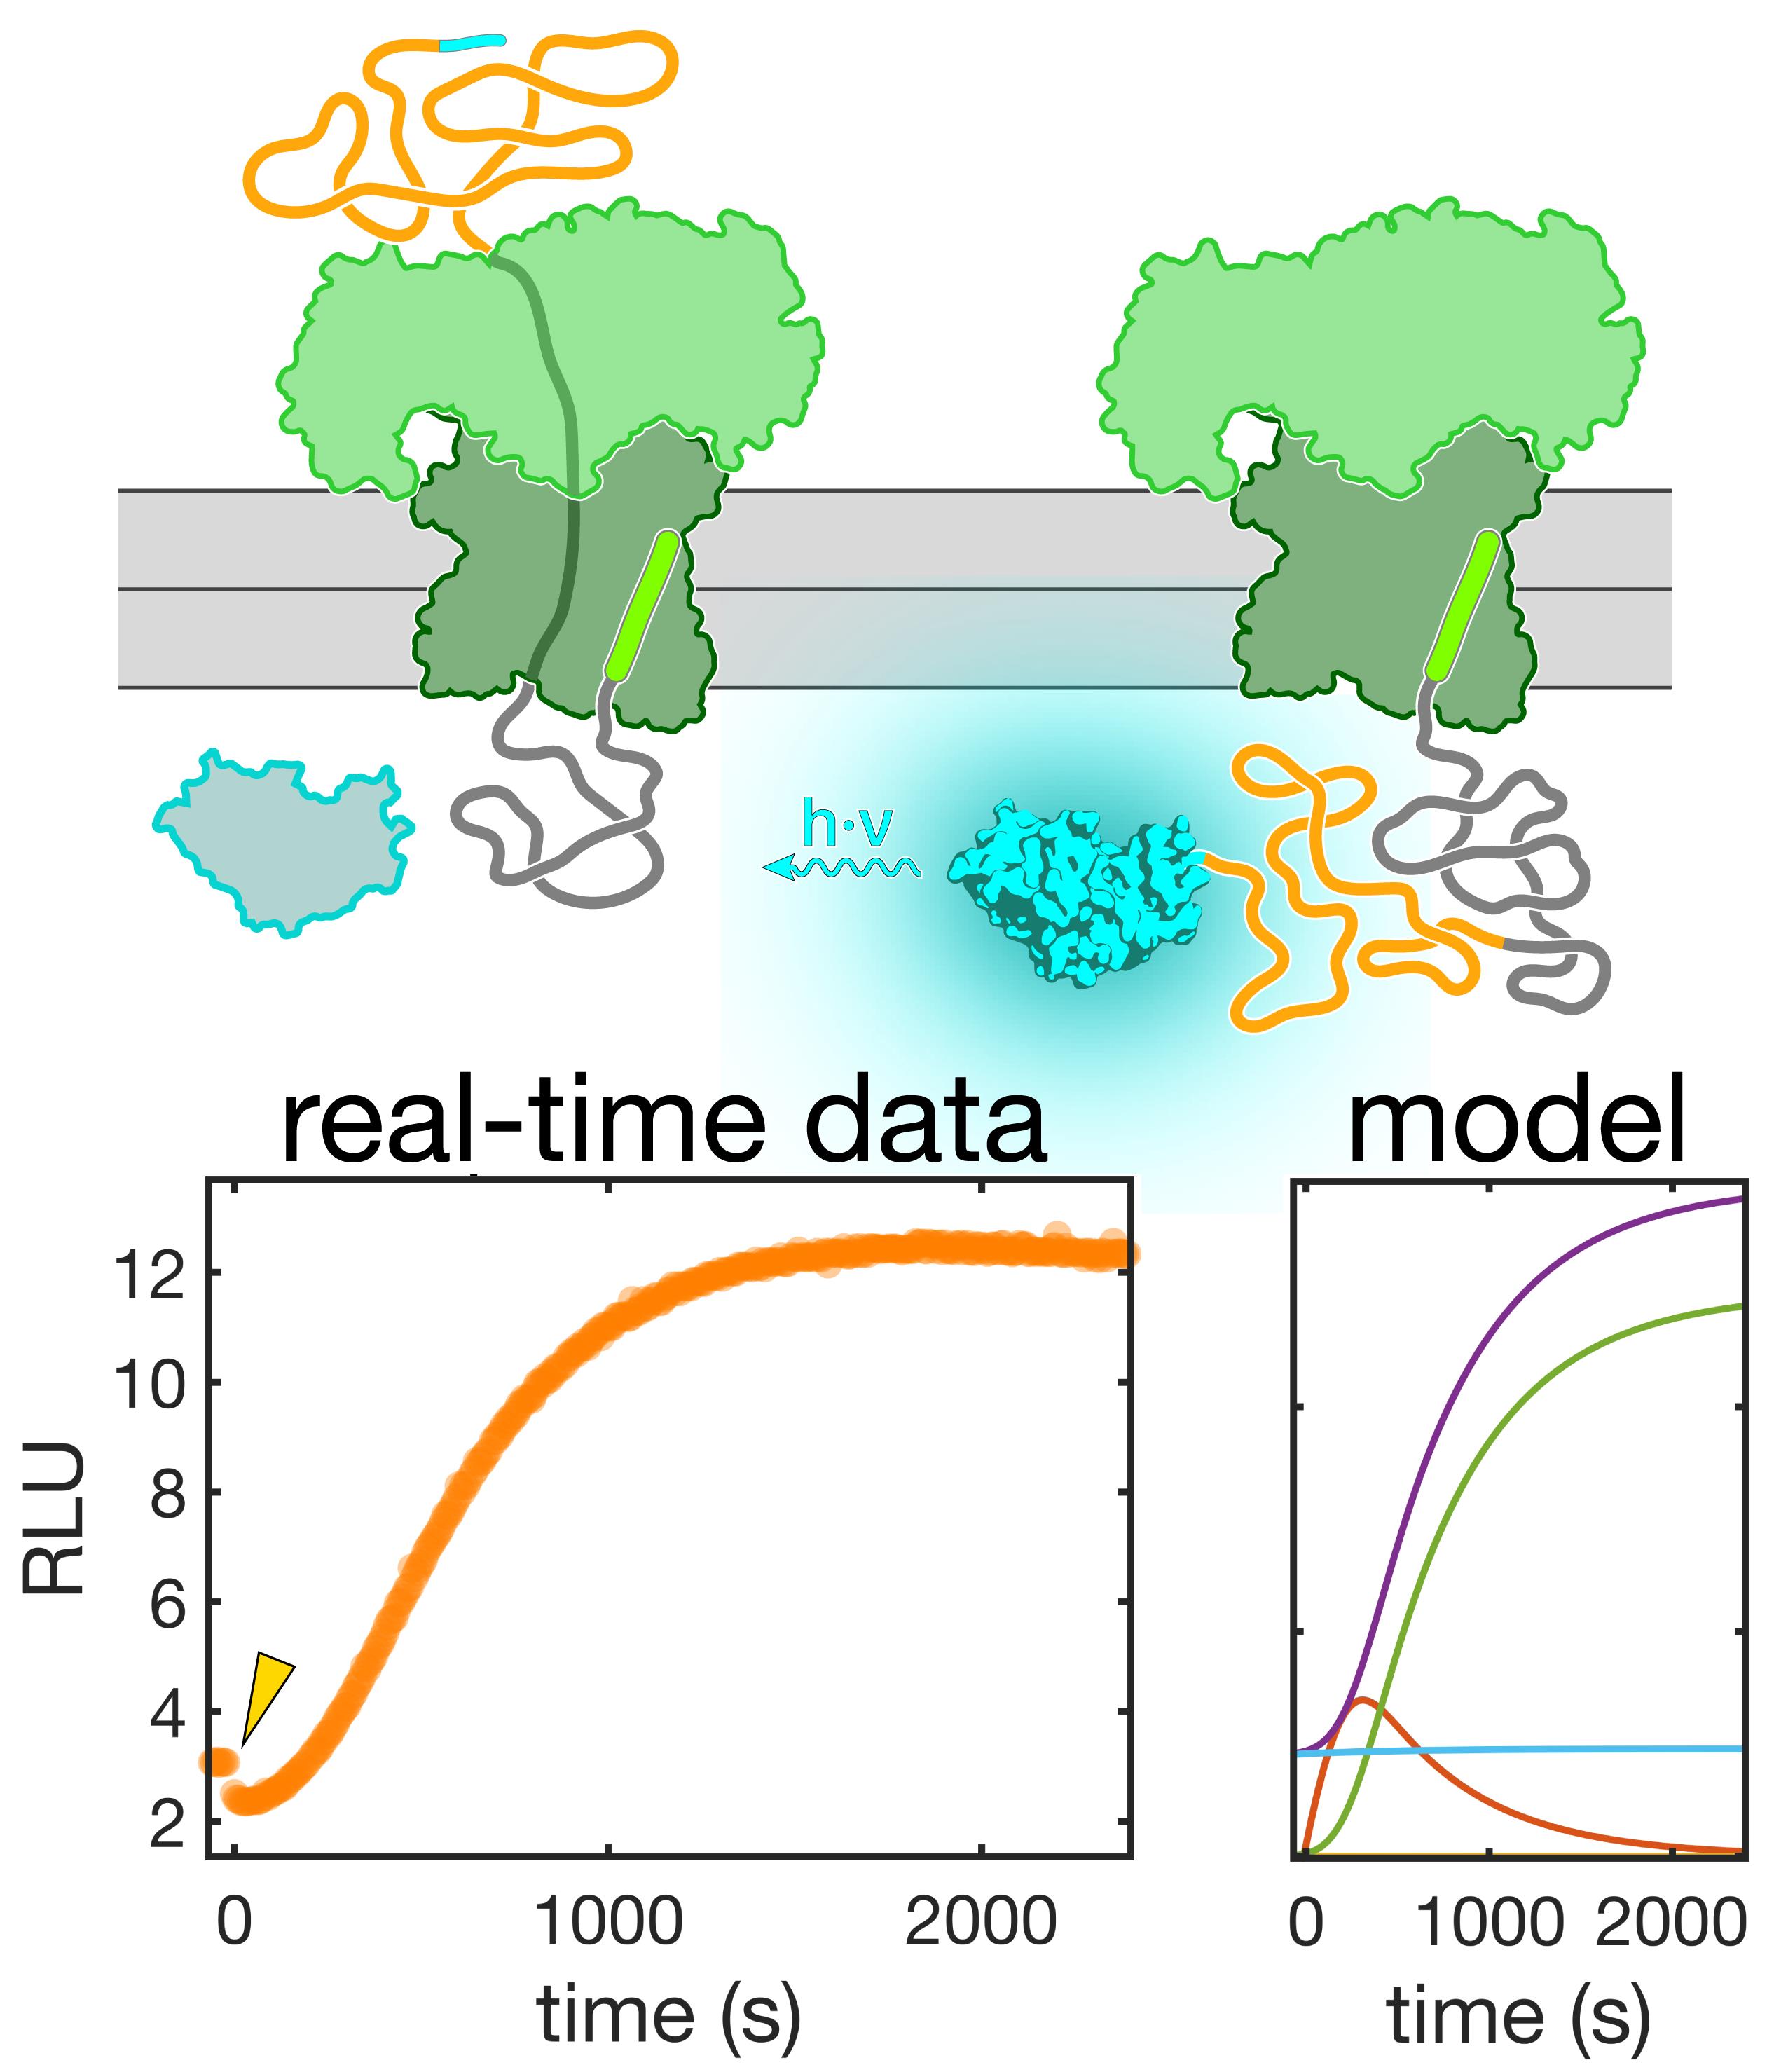
Synchronized real-time measurements, combined with a detailed kinetic model, enable a mechanistic analysis of protein transport.
Background
The Sec translocon moves proteins across lipid bilayers in all domains of life. In bacteria, a heterotrimeric transmembrane channel (SecYEG), located in the plasma membrane, associates with an ATPase, SecA, which drives substrate protein translocation. SecA utilizes chemical energy from ATP to drive the reaction forward and help to destabilize the tertiary structure of the substrate protein that otherwise interferes with translocation progress. Substrate proteins pass through the channel in an unfolded conformation.
The exact mechanisms underlying translocon function have remained unclear despite decades of study. Mechanistic studies of Sec-dependent protein translocation have traditionally been carried out using protease protection experiments (Cunningham et al., 1989). Substrate proteins are imported into vesicles or proteoliposomes containing reconstituted translocon complexes. The addition of a non-specific protease to the reaction results in proteolysis of untranslocated polypeptides, whereas proteins translocated into the interior of the proteoliposomes are protected from digestion. The protected undigested proteins are subsequently quantitated after separation by gel electrophoresis. These measurements have been instrumental in elucidating the function of the Sec translocon [see for instance (Brundage et al., 1990; Schiebel et al., 1991; van der Wolk et al., 1997; Mao et al., 2013; Bauer et al., 2014; Mao et al., 2020)]. However, the time resolution of this assay is limited because samples need to be taken and processed individually for each timepoint; thus, detailed kinetic information about the translocation process cannot be obtained.
Recently, an assay for continuously monitoring translocation has been described (Pereira et al., 2019). This assay is based on complementation of a highly active luciferase, NanoLuc, which can be asymmetrically split into a large (18 kDa) and small (1.3 kDa) fragment, termed 11S and p86, respectively (Dixon et al., 2016). Neither fragment alone exhibits significant luciferase activity. When 11S is encapsulated into SecYEG/SecA proteoliposomes, complete translocation of a substrate protein C-terminally tagged with p86 restores luciferase activity. The high affinity of the 11S/p86 complex (KD = 700 pM (Dixon et al., 2016)) and the high catalytic activity after association of the fragments permits sensitive detection of substrate proteins accumulating inside the proteoliposomes after complete translocation.
We have combined the luminescence-based real-time translocation assay (Pereira et al., 2019) with a method of generating reversibly stalled translocation intermediates (Erlandson et al., 2008) to kinetically resolve Sec-dependent protein translocation (Gupta et al., 2020). Together with a detailed kinetic model of the underlying process (Gupta et al., 2020), this approach has allowed us to dissect individual components of the process. Here, we describe the protocols for these measurements, which should be useful for obtaining mechanistic insight into the function of the Sec translocon.
The methodology described here is ideally suited for mechanistic studies of Sec translocon activity. The continuous measurement of substrate import provides time resolution that is superior to that of the traditional protease protection assays. Together with the model that we developed for analysis, the approach enables detailed kinetic dissection of the process, providing mechanistic insight into the SecA function.
Materials and Reagents
SnakeSkinTM Dialysis Tubing, 10K MWCO, 22 mm (Thermo Fisher Scientific, catalog number: 68100)
Amicon Ultra-15 Centrifugal Filter Units (Millipore Sigma, catalog number: UFC905008)
Plasmids
pSecAΔcys: expression plasmid for N-terminally His6-tagged SecA, with all cysteines replaced with serines (Gupta et al., 2020)
pSecYEG: expression plasmid for N-terminally His6-tagged SecY, SecE, and SecG; this plasmid was a kind gift from Dr. Shu-ou Shan (Caltech)
pOA-mDHFR-p86: expression plasmid for a fusion protein containing the N-terminal 178 amino acids of proOmpA, a GSGS linker, mouse DHFR, and the p86 peptide (Dixon et al., 2016)
Note: A different protein of interest can be inserted instead of mouse DHFR after the GSGS linker and before the p86 peptide. Such a construct would allow one to use this assay to study a different protein of interest.
p11S: expression plasmid for the 11S NanoLuc fragment (Dixon et al., 2016) with an N-terminal His6-SUMO tag
pGST-dark: expression plasmid for an inactive p86 “dark” peptide fused to glutathione-S-transferase (Pereira et al., 2019)
Cells
BL21 (DE3) Competent cells (Agilent Technologies, catalog number: 230130)
MM52 competent cells [prepared according to Sambrook and Russel (2001); strain from Oliver and Beckwith (1981) #1128]
LB medium (Sambrook and Russel, 2001)
LB-agar plates with Amp (Sambrook and Russel, 2001)
Super Optimal Broth (SOB) (Sambrook and Russel, 2001)
Ampicillin (Amp) (Millipore Sigma, catalog number: 171254)
Prionex (Millipore Sigma, Sigma-Aldrich, catalog number: G0411)
Nano-Glo® Live Cell Assay System (Promega, catalog number: N2011)
cOmplete Protease Inhibitor Cocktail (Millipore Sigma, Roche, catalog number: CO-RO)
n-Dodecyl β-D-maltoside (DDM) (Millipore Sigma, Sigma-Aldrich, catalog number: D4641)
1,10-phenanthroline (Ph) (Millipore Sigma, Sigma-Aldrich, catalog number: 131377)
E. coli polar lipid extract (Avanti, catalog number: 100600)
Bio-Beads SM-2 Resin (Bio-Rad, catalog number: 1523920)
Ulp1 protease (prepared in-house according to Mossessova and Lima, 2000)
Adenosine 5′-triphosphate (ATP) disodium salt hydrate (Millipore Sigma, catalog number: FLAAS)
Protein purification buffers (see Recipes)
Preparation of SecYEG/SecA vesicles with encapsulated 11S (see Recipes)
Preparation of oxidized pOA-mDHFR-p86 (see Recipes)
Real-time translocation measurement (see Recipes)
Equipment
Ultracentrifuge (Beckman Coulter, model: Optima MAX-XP)
High Performance Centrifuge (Beckman Coulter, model: Avanti J-E)
Incubator Shaker (Innova Model 44R)
GloMax® Navigator System (Promega, model: GM2000 and 2010)
Ultracentrifuge (Beckman, model: Optima XL-80k)
Type 45 Ti Fixed Angle Titanium Rotor (Beckman Coulter, catalog number: 339160)
Emulsiflex C5 (Avestin)
Sonicator (Branson)
AKTA pure FPLC system (Cytiva)
HisTrap HP (5 ml) (Cytiva, catalog number: 17524801)
HiTrap Q Sepharose Fast Flow Columns (1 ml) (Cytiva, catalog number: 17505301)
SP Sepharose Fast Flow cation exchange chromatography resin (Cytiva, catalog number: 17072901)
HisPurTM Ni-NTA Resin (Thermo Fisher Scientific, catalog number: 88221)
Extruder (Avanti, model: 610020)
Hi-Prep 16/60 Sephacryl S-200 (Cytiva, catalog number: 17116601)
Poly-Prep® Chromatography Columns (Bio-Rad, catalog number: 7311550)
Procedure
Protein purification
Purification of SecA
Transform BL21 (DE3) cells with the plasmid containing SecAΔcys and plate on LB agar Amp plates. Grow colonies overnight.
Inoculate 1 L LB-Amp (100 μg/ml) with 10 colonies from the overnight plate. Shake at 225 rpm at 37°C.
Induce protein expression with IPTG (final concentration of 0.5 mM) when the OD600 reaches 0.4-0.6.
After 2 h, harvest cells by spinning down the contents of the flasks for 20 min at 6,000 × g.
Lyse cells using sonication in Buffer A with one dissolved tablet of protease inhibitor cocktail. Use seven 40-s cycles at duty cycle 50% and output 8. Between cycles, transfer to a cold beaker for 5 min.
Once the cell lysis suspension is less viscous and lighter in color, centrifuge at 30,000 × g at 4°C to remove cell debris.
Load the clarified supernatant onto a 5-ml HisTrap column (Cytiva) equilibrated with Buffer A. After loading the column, wash with 4% Buffer B until the UV absorbance at 280 nm levels off. Elute with 60% Buffer B.
Run the fractions on a 12% SDS-PAGE gel (Figure 1). Choose the purest fractions and pool.
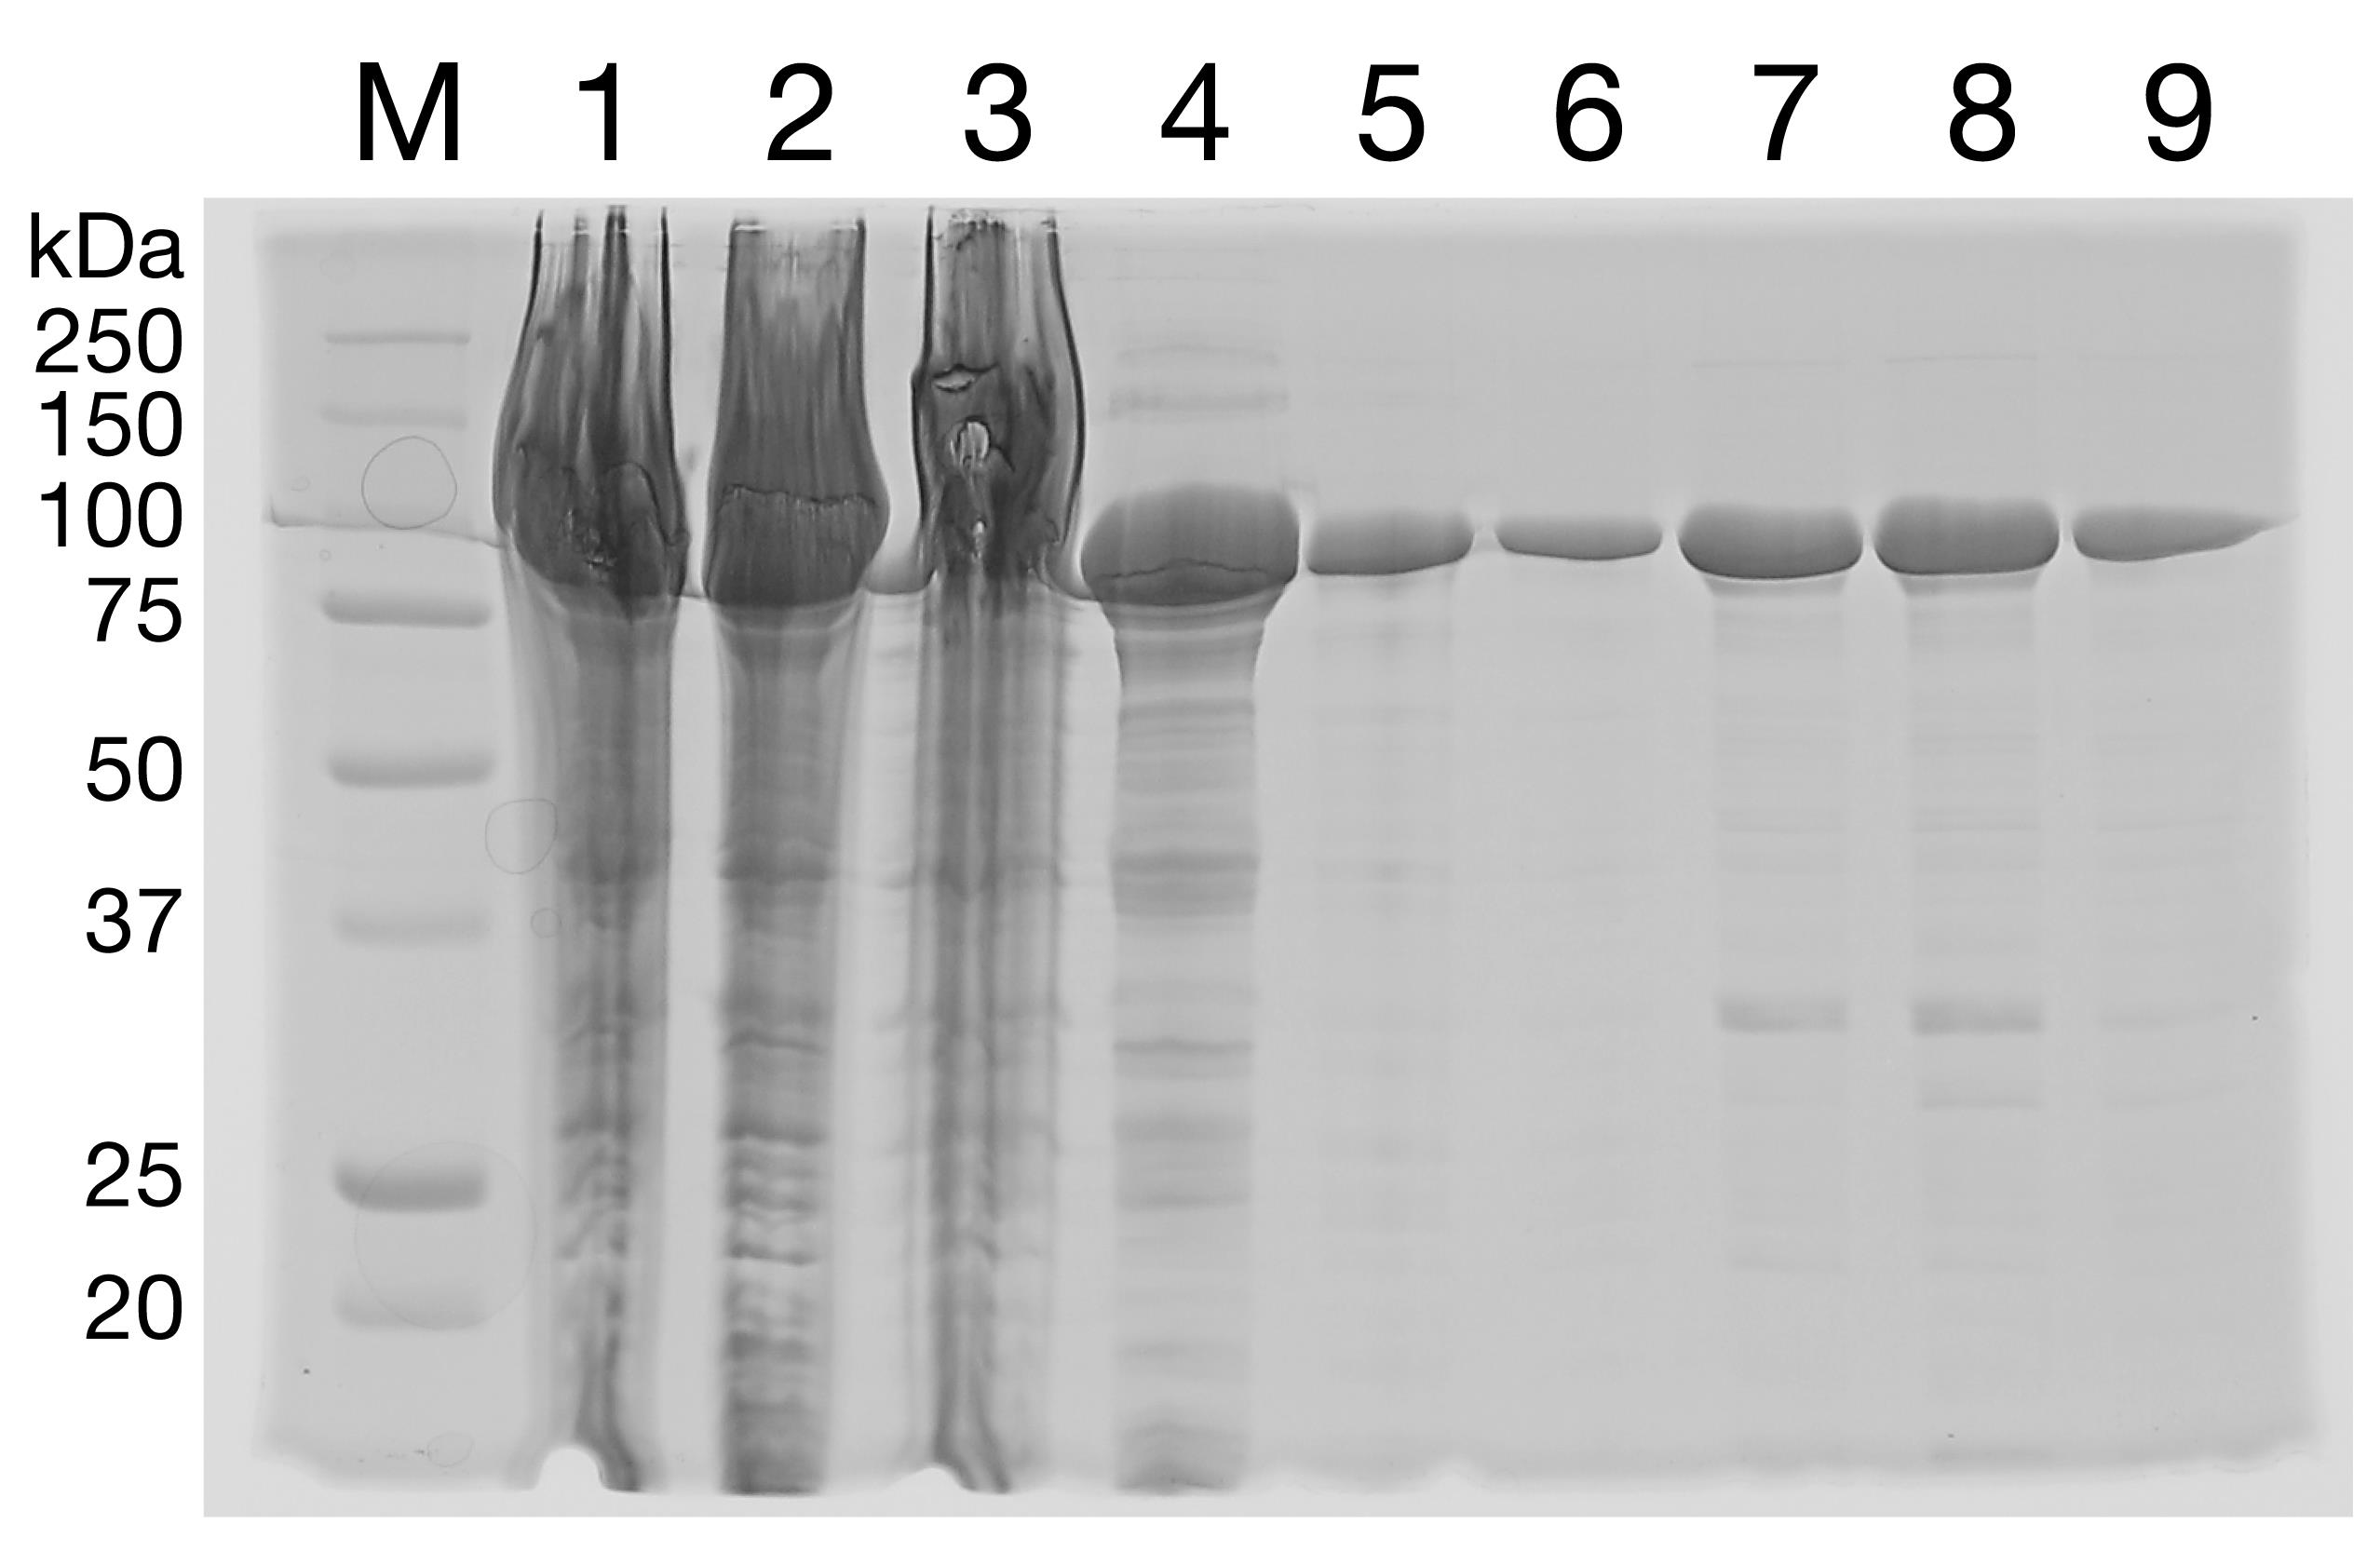
Figure 1. HisTrap Purification of SecA. His-tagged, cysteine-free SecA was expressed in E. coli, and the cells were lysed by sonication. The total cell lysate (lane 1) shows strong overexpression. Lane 1: total cell lysate. Lane 2: supernatant. Lane 3: pellet. Lane 4: flowthrough. Lane 5: 25 mM imidazole wash. Lanes 6-9: 300 mM imidazole eluate.Dialyze the pooled elution product overnight against Buffer A.
Inject the pooled fraction onto Hi-Prep 16/60 Sephacryl S-200. Collect 500-μl fractions.
Run the fractions on a 12% SDS-PAGE gel (Figure 2). Choose the purest fractions and pool.
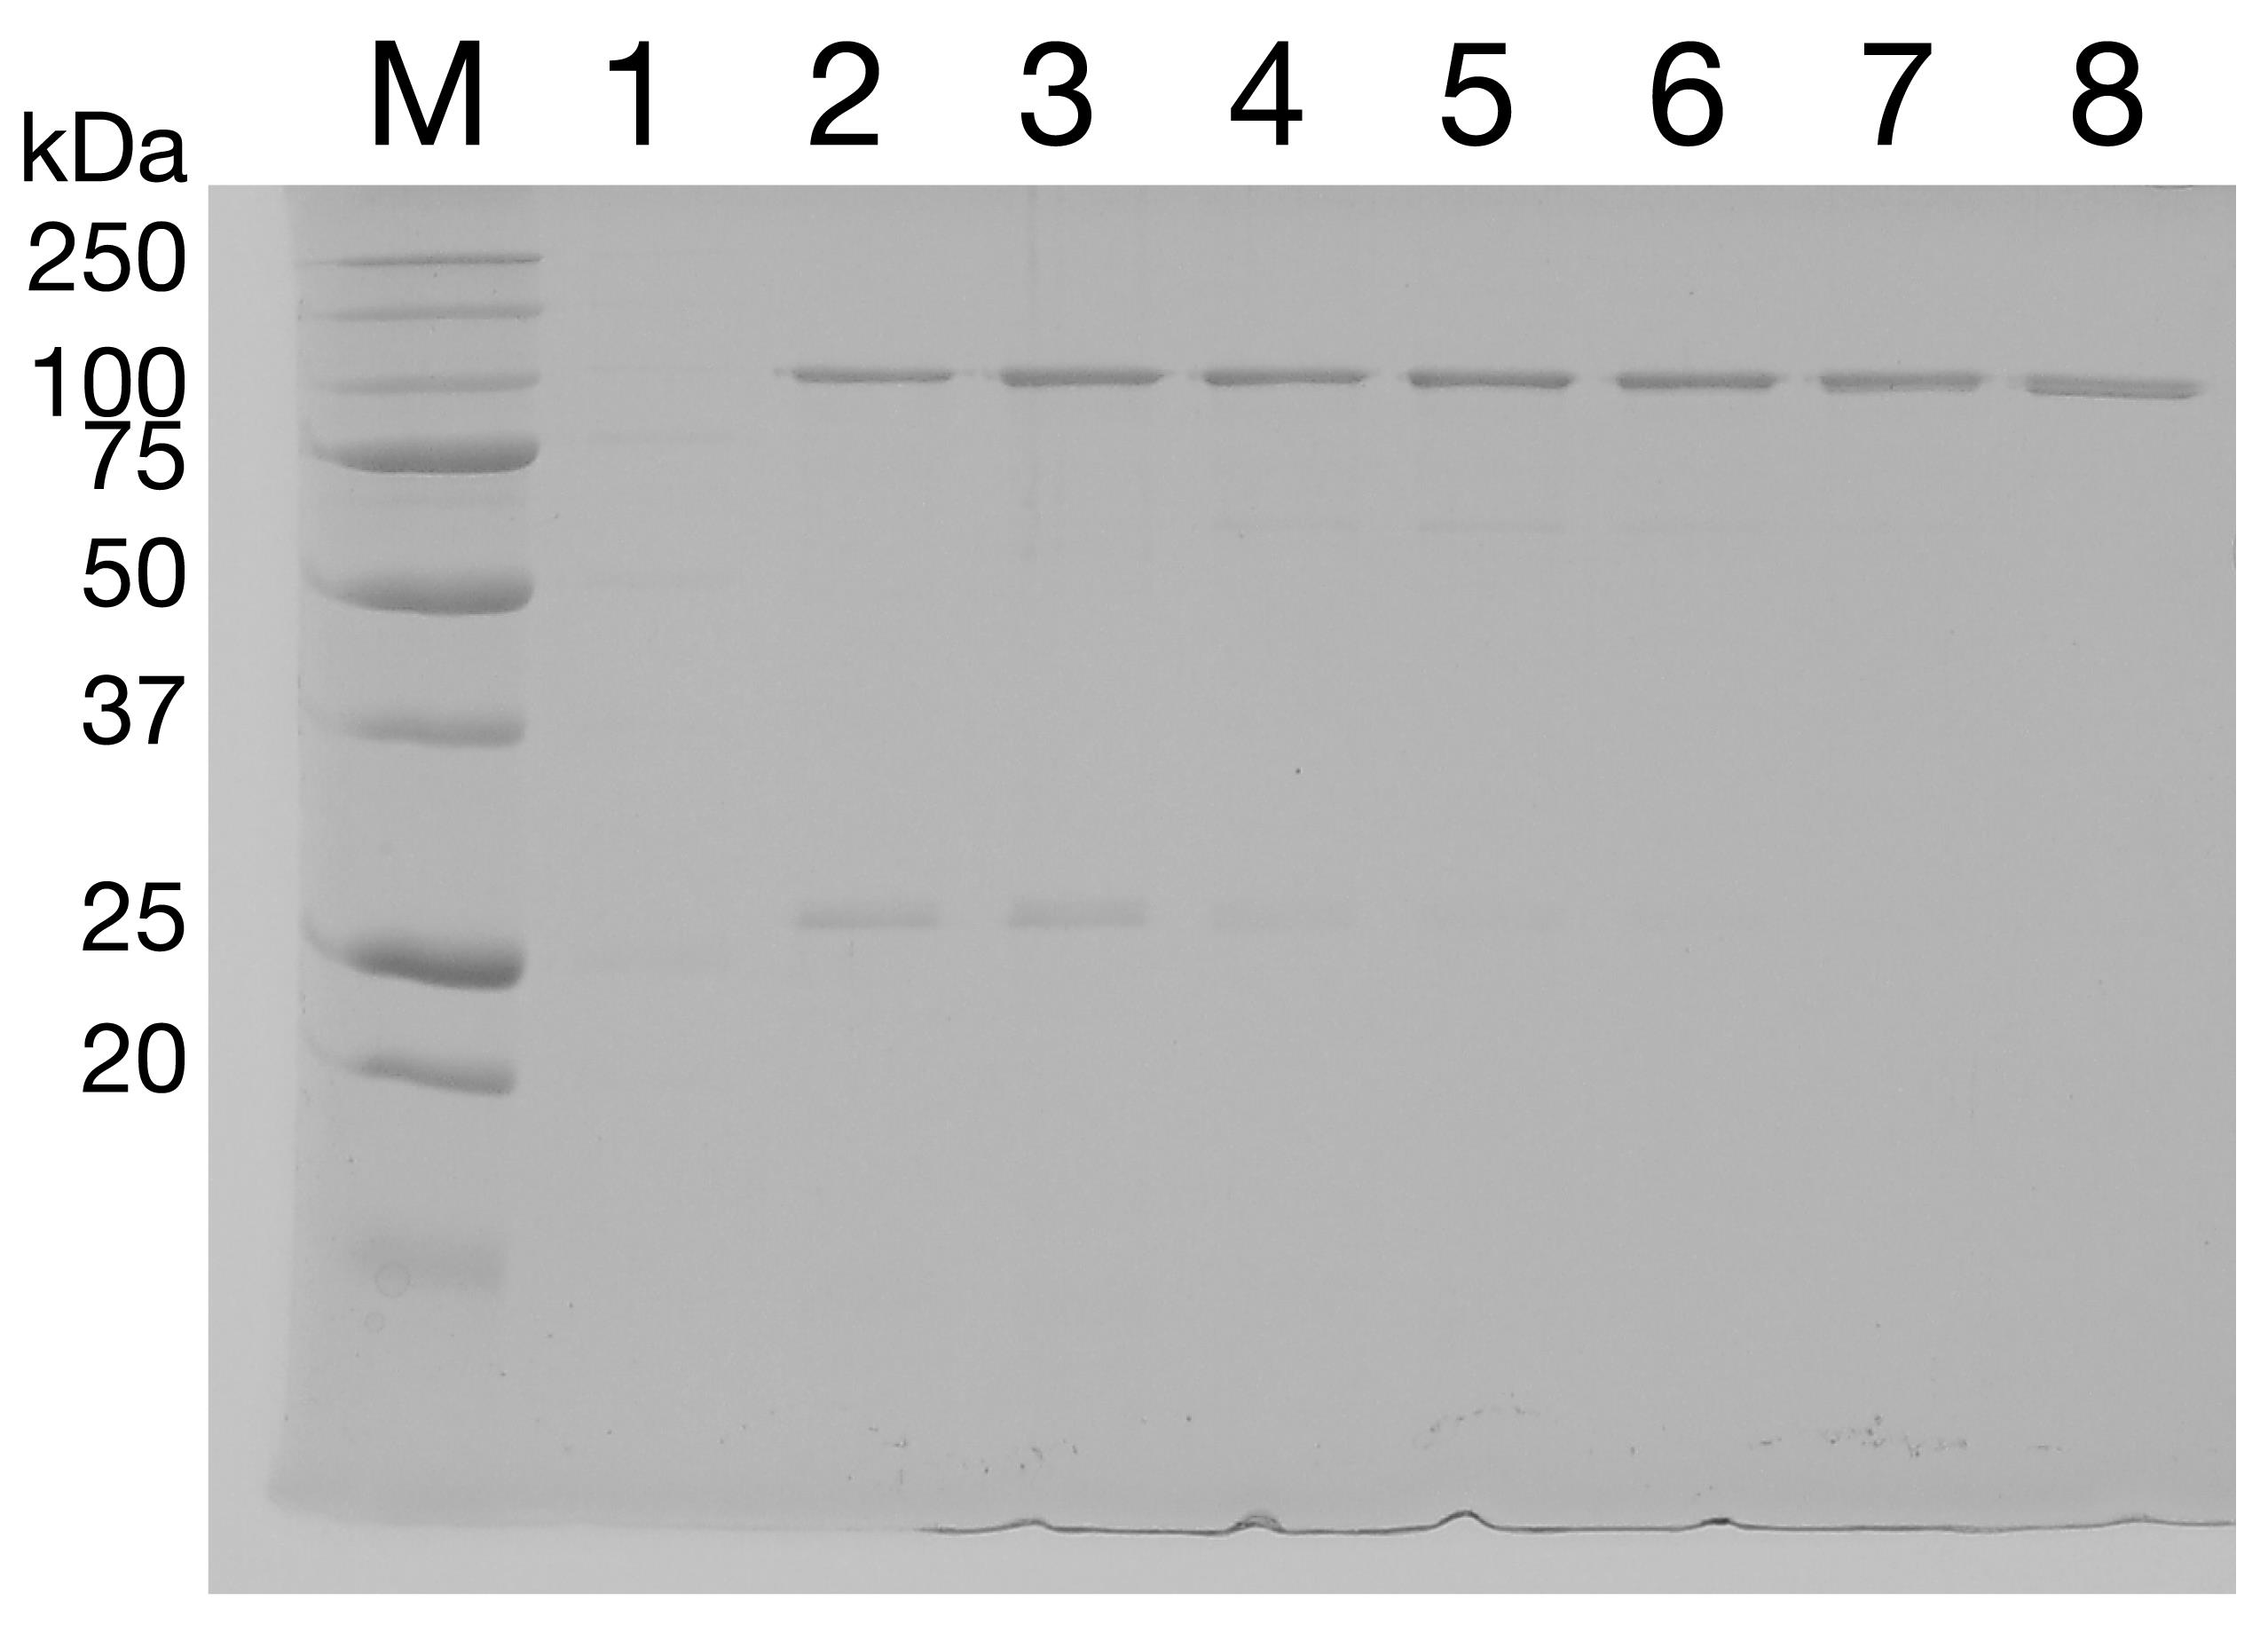
Figure 2. Purification of SecA by SEC. The eluate from HisTrap chromatography was separated by SEC. Lanes 1 and 2: column void volume. Lanes 3-8: eluate fractions.Concentrate protein to >100 μM SecA2 using a 50 kDa MWCO concentrator.
Aliquot protein and flash freeze using liquid nitrogen. Store at −80°C.
Verify protein activity after co-reconstitution with SecYEG using a protease protection-based translocation assay (Gupta et al., 2020).
Purification of SecYEG
Transform 50 μl BL21 (DE3) with 2 μl 30 ng/μl SecYEG plasmid. Allow to stand on ice for 30 min. Heat shock for 1 min and allow to recover on ice for 2 min. Add 900 μl SOB and shake at 37°C for 1 h. Spin down cells and resuspend in 200 μl fresh SOB. Plate entire volume on LB-agar Amp plates.
Inoculate 50 ml LB (100 μg/ml Amp) with one colony. Make three 100-fold serial dilutions. Grow all overnight.
Inoculate 8 L LB-Amp with 5 ml each overnight culture in mid-log phase.
Induce protein expression with a final concentration of 0.5 mM IPTG at 37°C once OD600 reaches ~0.5.
After 2 h, place the flasks at 4°C. Harvest by centrifugation at 4°C, 6,000 × g for 15 min.
Resuspend the total pellet mass in 35 ml ice-cold Buffer C. Add 2 pulverized protease inhibitor cocktail pills. Mix well.
Distribute into 50-ml Falcon tubes (~15 ml per tube) and freeze thoroughly in liquid nitrogen. Store cells for up to 1 week at -80°C.
When ready to proceed with purification, thaw tubes containing the cell pellet suspension in a room-temperature bath. Once thawed, move onto ice.
Lyse cells via sonication. Use seven 40-s cycles at duty cycle 50% and output 8. Between cycles, transfer to a cold beaker for 5 min.
Once sonication is complete, spin the lysate at 12,000 × g to remove cell debris.
Decant the supernatant and the viscous material above the cell debris into Ti 45 tubes. Add Buffer D to the cell lysate to fill the ultracentrifuge tubes completely. The tubes will deform during centrifugation if half-filled. Centrifuge at 42,000 × g in a Ti 45 rotor for 55 min. Discard the supernatant.
Use a 15-ml dounce homogenizer to homogenize the membrane pellet until the suspension is tan/pinkish and homogenous. Add enough 10% DDM so that the final DDM concentration is 1%. Set to tumble at 4°C for 1 h.
Centrifuge the homogenate for 45 min at 42,000 × g in a Ti 45 rotor to pellet intact membranes. Fill the tube completely with Buffer E.
Prepare an SP Sepharose column for ion-exchange chromatography. Equilibrate with five column volumes Buffer E.
Load the supernatant onto the column. Once done, collect the flowthrough and reload.
Wash the resin with ten column volumes Buffer E.
Elute with increasing concentrations of NaCl by increasing the percentage of Buffer F. Collect 3-ml fractions.
Run all fractions on a 15% SDS-PAGE gel (Figure 3) to check for the presence of SecYEG. Pool the fractions that contain a significant amount of SecYEG with a minimal amount of contaminants.
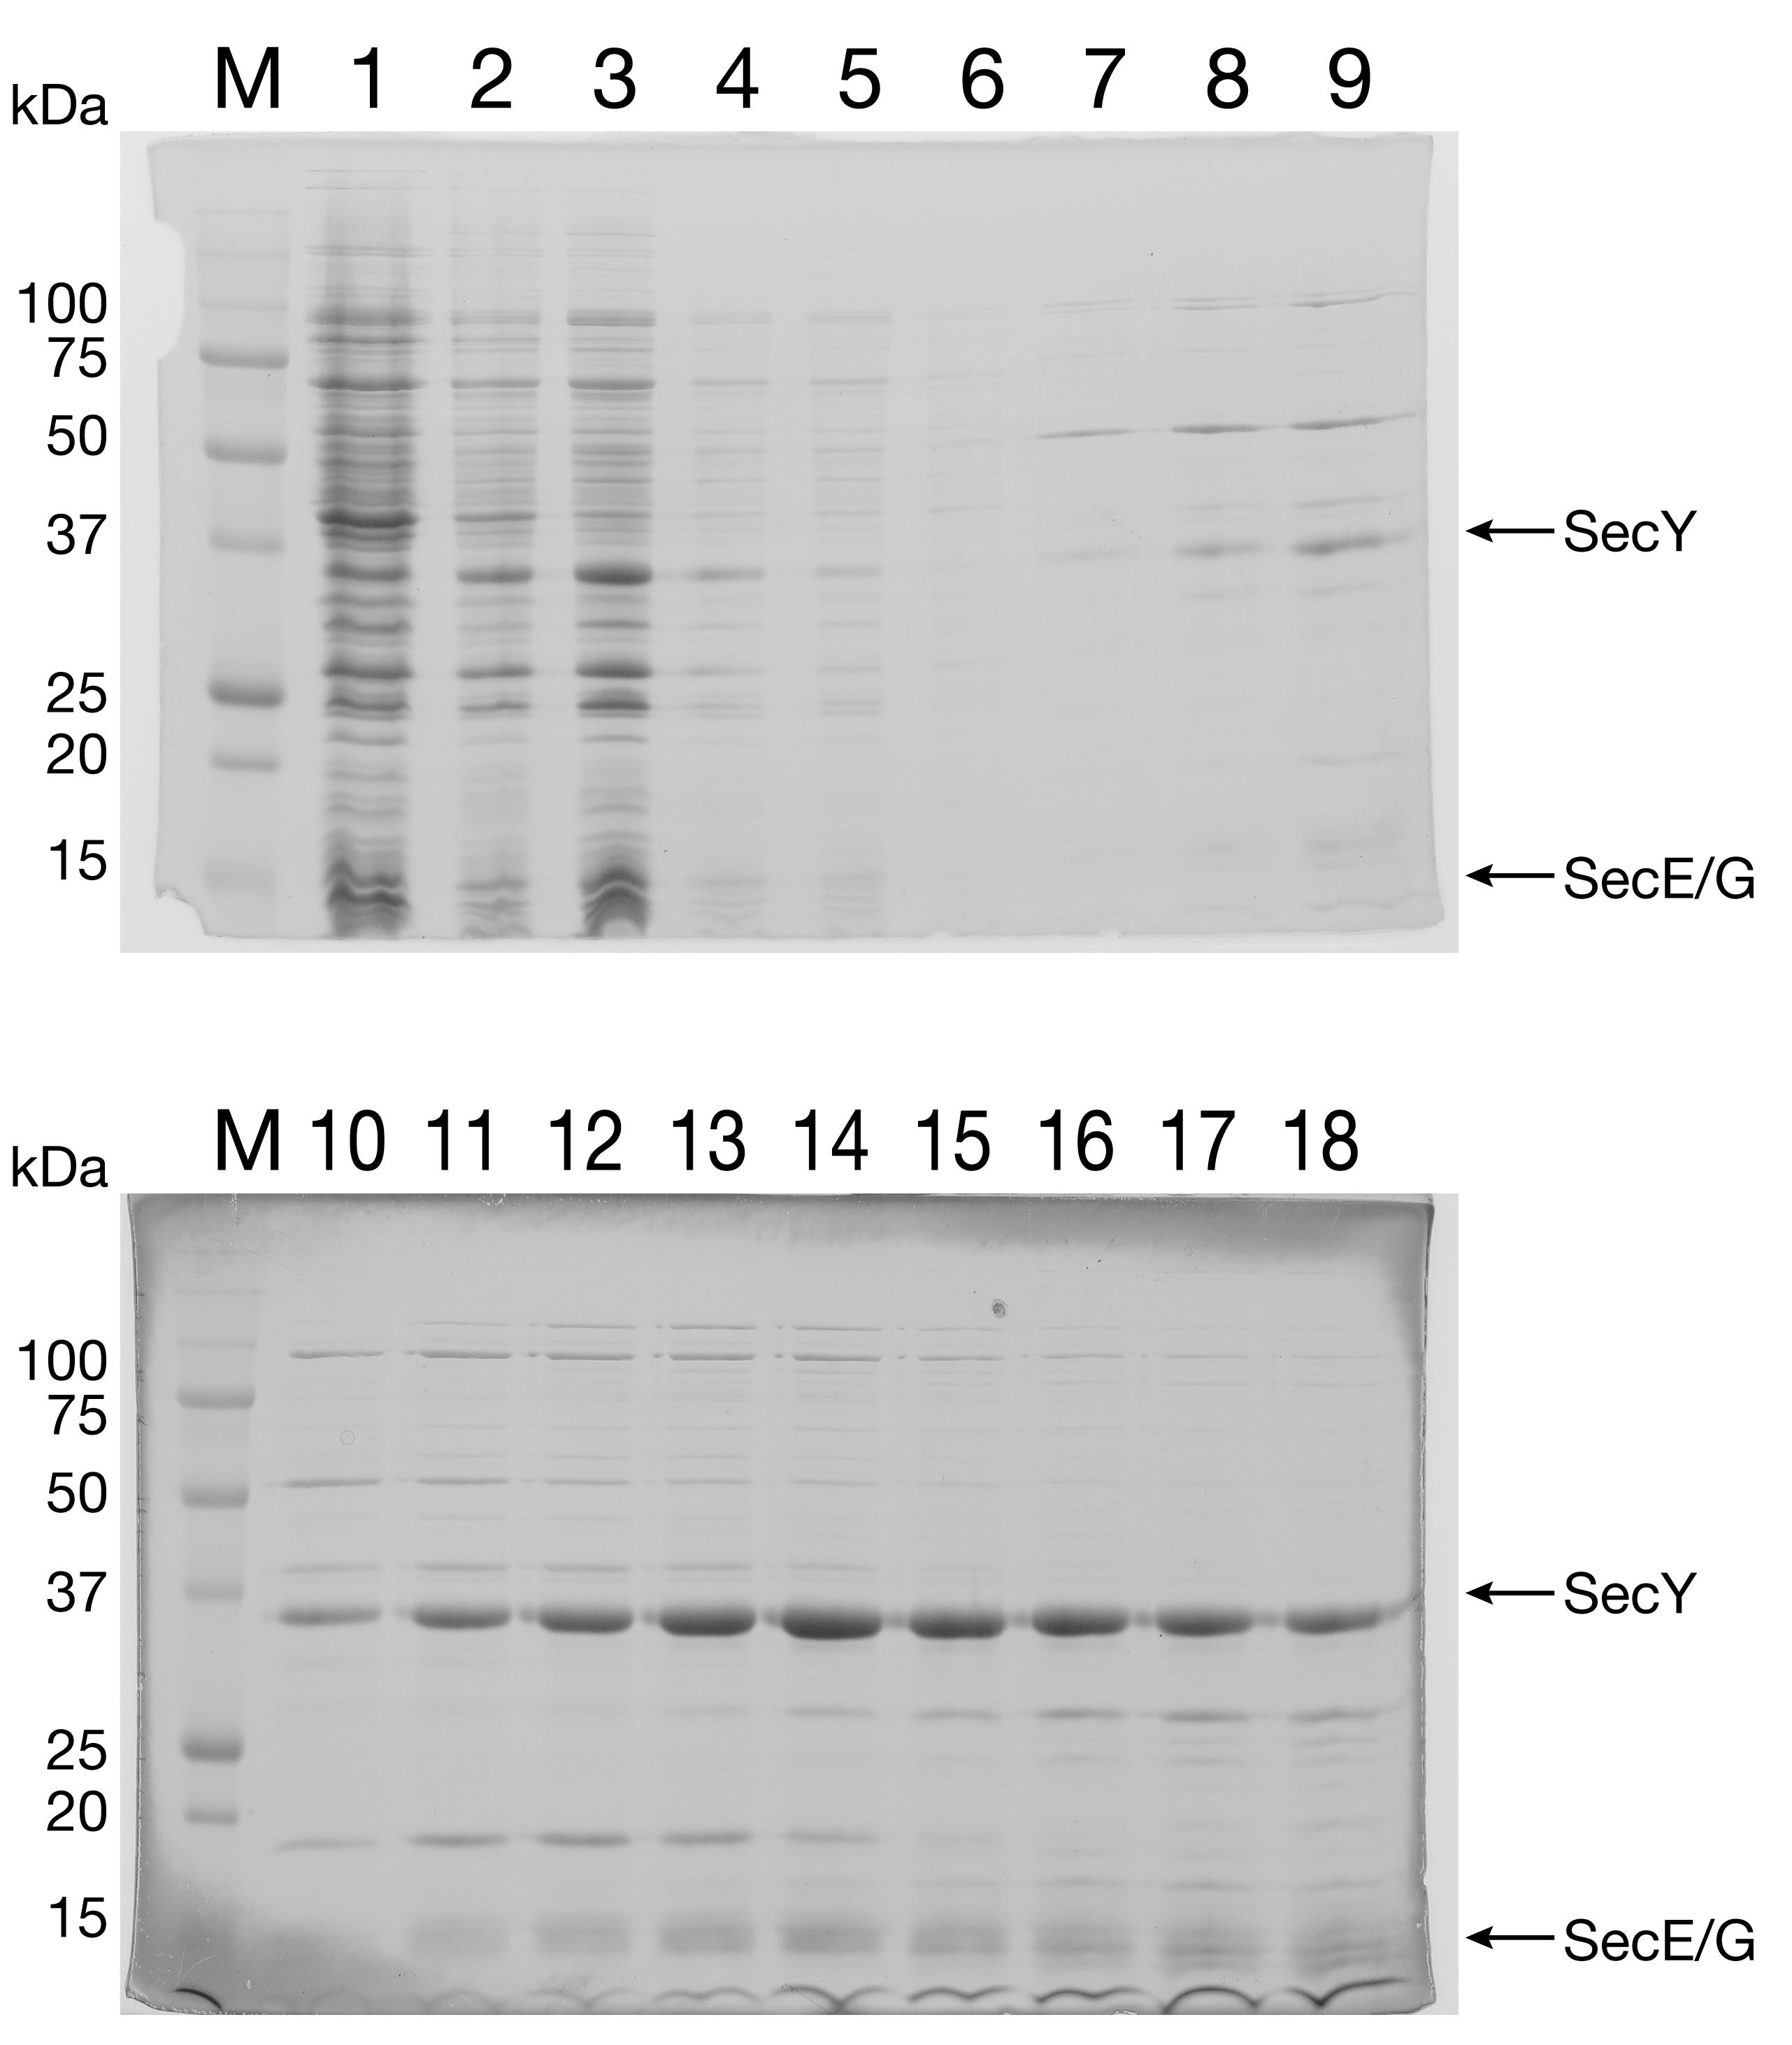
Figure 3. Purification of SecYEG by IEC. SecYEG (with a His6-tag at the N-terminus of SecY) was expressed in E. coli. Due to the relatively low expression levels for this heterotrimeric membrane protein complex, the proteins are not readily apparent in the total cell lysate (Lane 1, top gel) but can be identified in the eluate fractions (Lanes 10-13, bottom gel). Lane 1: whole cell lysate. Lane 2: pellet. Lane 3: homogenized membrane. Lane 4: input. Lane 5: flowthrough. Lane 6: wash. Lanes 7-18: eluate fractionsPlace 2 ml regenerated Ni-NTA agarose resin into a 50-ml Falcon tube. Treat as follows: 1) strip with 2 ml 100 mM EDTA pH 8, 500 mM NaCl; 2) wash with 10 ml H2O; 3) wash with 4 ml 6M Guanidine-HCl; 4) wash with 10 ml H2O; and 5) recharge with 2 ml 100 mM NiSO4. Between each step, spin at 3,000 × g for 2 min and decant the wash liquid.
Transfer the resin to a 50-ml Falcon tube, fill the tube with ddH2O, mix well, and spin at 3,000 × g for 2 min. Decant the wash liquid. Repeat the wash two more times.
Equilibrate the washed resin with Buffer G in the same manner as with water.
Prepare 5 ml 4 M stock imidazole solution in water and pH with concentrated HCl to pH 7.4. Store at 4°C protected from light.
Add enough 4 M Imidazole to the combined SecYEG fractions to have 20 mM final imidazole concentration. Mix the SecYEG fractions with the resin and place on a nutator for 3 h at 4°C. Spin the beads/protein mixture for 5 min at 3,000 × g. Save the flowthrough (FT).
Add 20 ml Buffer G to the resin and stir gently for 15 min. Spin as above and save the wash (W1).
Mix the resin with 7 ml Buffer G and transfer to a Poly-Prep chromatography column. Allow the resin to settle and collect the wash (W2).
Elute SecYEG in five 1-ml fractions using Buffer H as follows: Add 1 ml elution buffer to the resin containing Buffer G and collect the entire 1-ml by gravity (E1). Repeat four more times (E2-E5).
aa. Run FT, W, and E1-E5 on a 15% SDS-PAGE (Figure 4). Combine the fractions containing a significant amount of pure SecYEG.
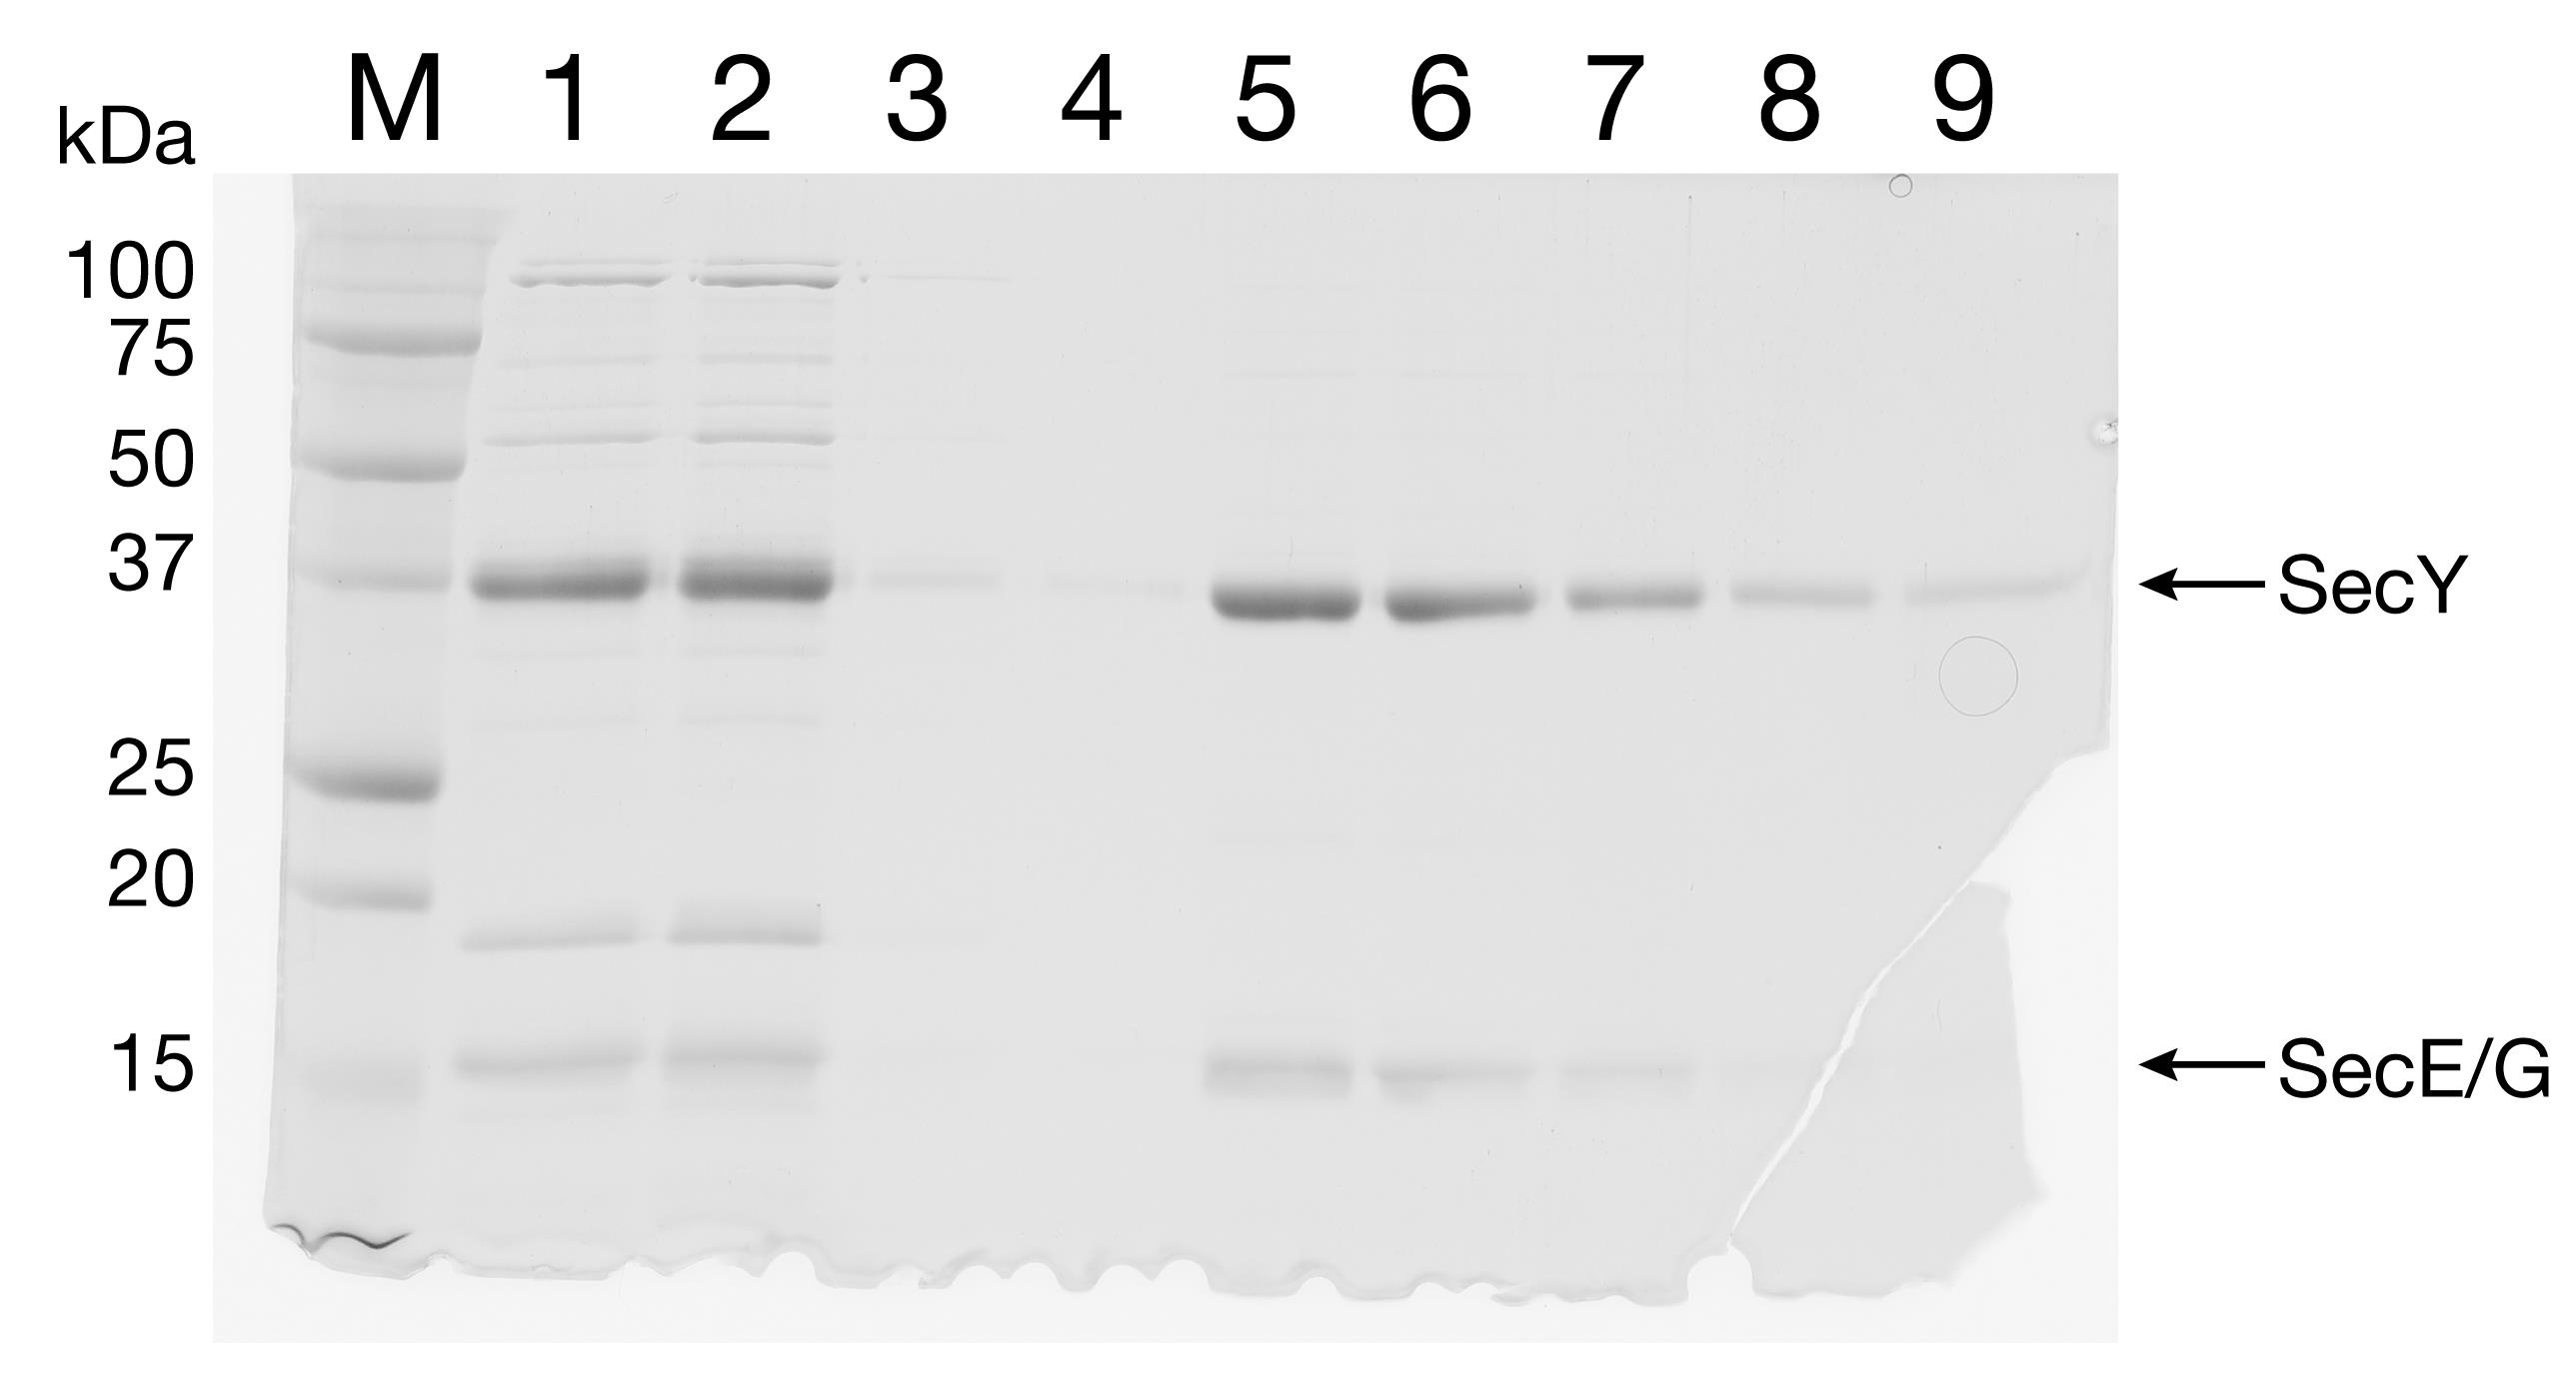
Figure 4. Purification of SecYEG by IMAC. The eluate from IEC was separated by IMAC. Lane 1: IMAC input. Lane 2: FT. Lanes 3-4: W1 and W2. Lanes 5-9: E1-E5.bb. Dialyze against 1 L Buffer I overnight using a 10,000 MW cut-off dialysis tubing. Perform dialysis at 4°C with gentle stirring.
cc. Concentrate to approximately 60 μM SecY2E2G2 using a 50,000 MW cut-off Amicon filter. Mix well and determine the concentration using molar absorptivity. Do not concentrate the protein above 80 μM final concentration dimer.
Purification of pOA-mDHFR-p86
Transform the strain MM52 (contains a temperature-sensitive SecA allele that is conditionally lethal) with the pOA-mDHFR-p86 plasmid.
Inoculate 1 L LB-Amp with one colony and grow overnight at 30°C. After reaching an OD600 of 0.5, increase the temperature to 37°C.
Induce protein expression by adding 1 mM IPTG at 37°C.
After growing for 4 h, harvest the cells and wash with cold Buffer J.
Lyse cells in Buffer K using sonication (10 min, 10-s pulse, 50% duty cycle).
Collect the inclusion bodies at 3,000 × g.
Dissolve the inclusion bodies in 9 ml Buffer L.
Clarify by centrifuging the sample at 225,000 × g at 25°C.
Equilibrate two HiTrap Q Sepharose Fast Flow columns in series by washing with 10 ml: 1) water; 2) Buffer L; 3) Buffer M; 4) Buffer L.
Pass the supernatant through the column and collect the flowthrough in 1-ml fractions.
Run all samples on SDS-PAGE gel to assess the concentration and purity (Figure 5).
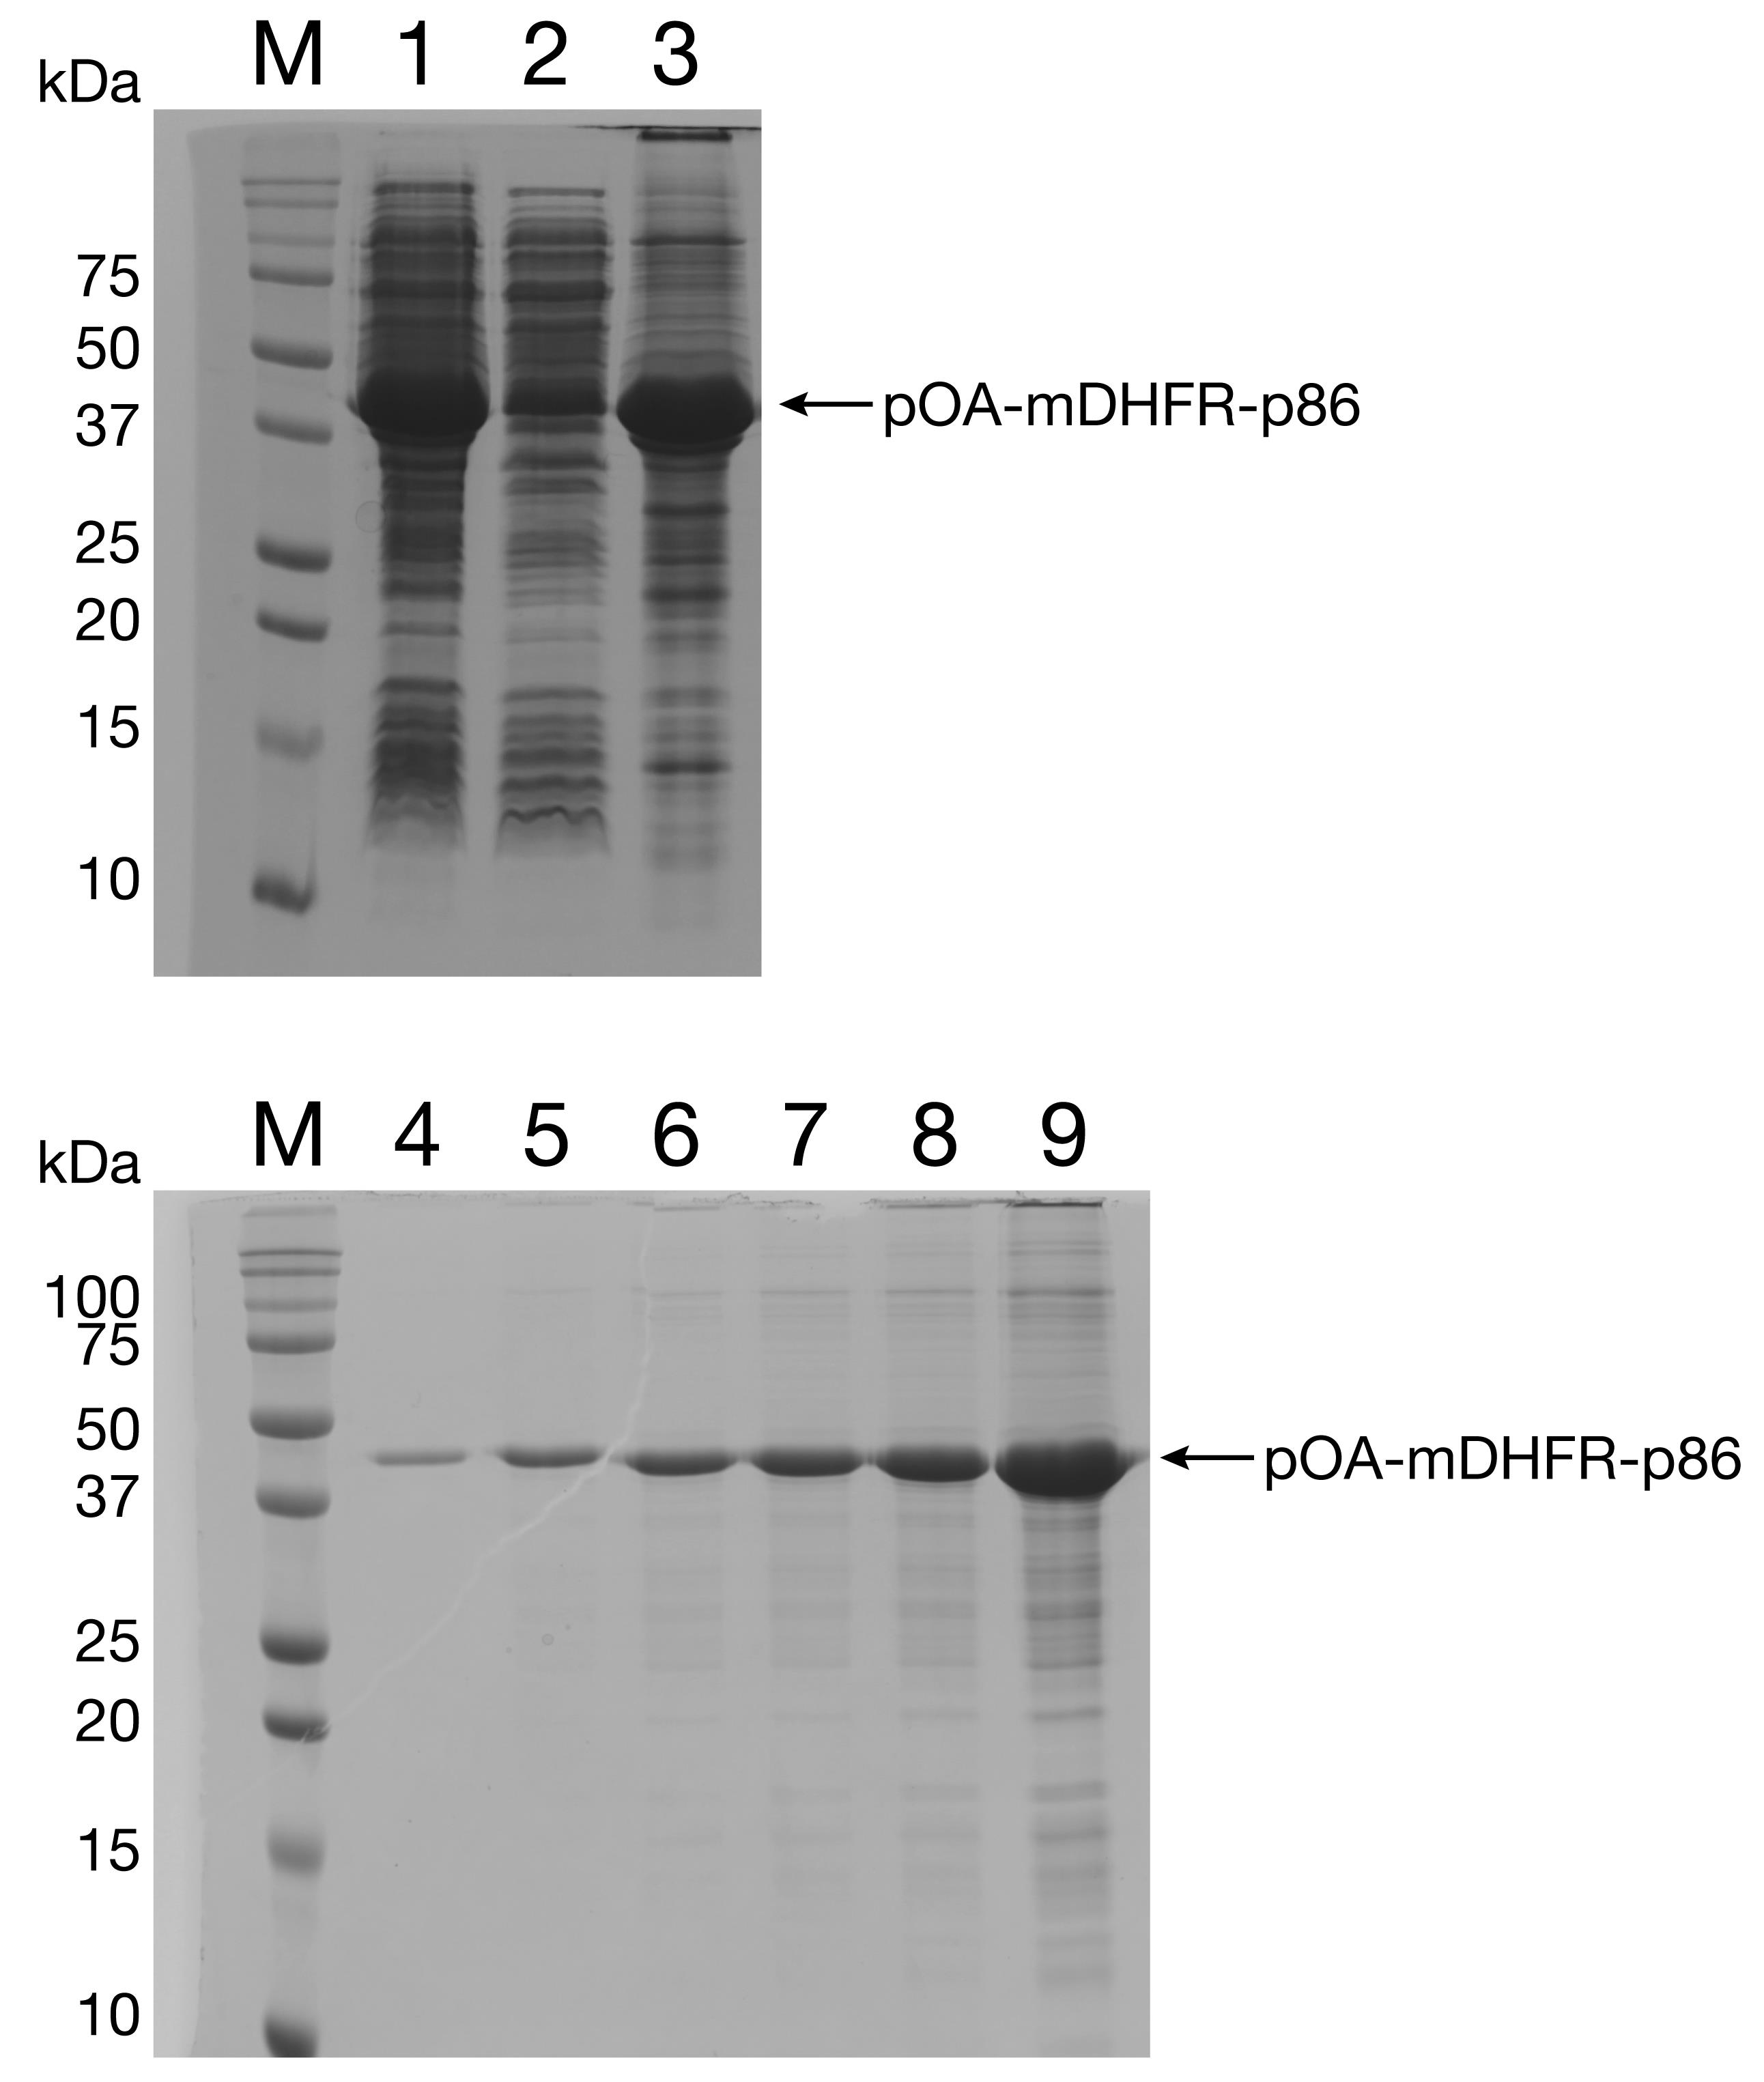
Figure 5. Purification of pOA-mDHFR-p86 from inclusion bodies. The fusion protein pOA-mDHFR-p86 is expressed in SecA-deficient cells and accumulates in inclusion bodies. Lane 1: total cell lysate. Lane 2: supernatant. Lane 3: solubilized inclusion bodies. Lanes 4-9: increasing amounts of pOA-mDHFR obtained after anion-exchange chromatography (100 ng, 300 ng, 500 ng, 700 ng, 1 µg, 6 µg).Pellet, aliquot, and freeze protein in liquid N2.
Purification of 11 S
Transform BL21 (DE3) with the plasmid containing 11 S and plate the cells on LB-agar Amp plates. Grow colonies overnight.
Innoculate 1 L LB-Amp (100 μg/ml) with 10 colonies from the overnight plate. Shake at 37°C, 225 rpm.
Induce protein expression with a final concentration of 0.2% arabinose at 37°C when the OD600 reaches 0.4-0.6.
Harvest cells 4 h after induction at 37°C.
Lyse cells using sonication in Buffer J with one dissolved tablet protease inhibitor cocktail. Use seven 40-s cycles at duty cycle 50% and output 8. Between cycles transfer to a cold beaker for 5 min.
Centrifuge lysed cells at 20,000 × g, 4°C to remove cell debris.
Load the clarified supernatant onto a 5-ml HisTrap column in Buffer J. Elute protein with Buffer N.
Run the fractions on a 12% SDS-PAGE gel (Figure 6). Pool the cleanest fractions.
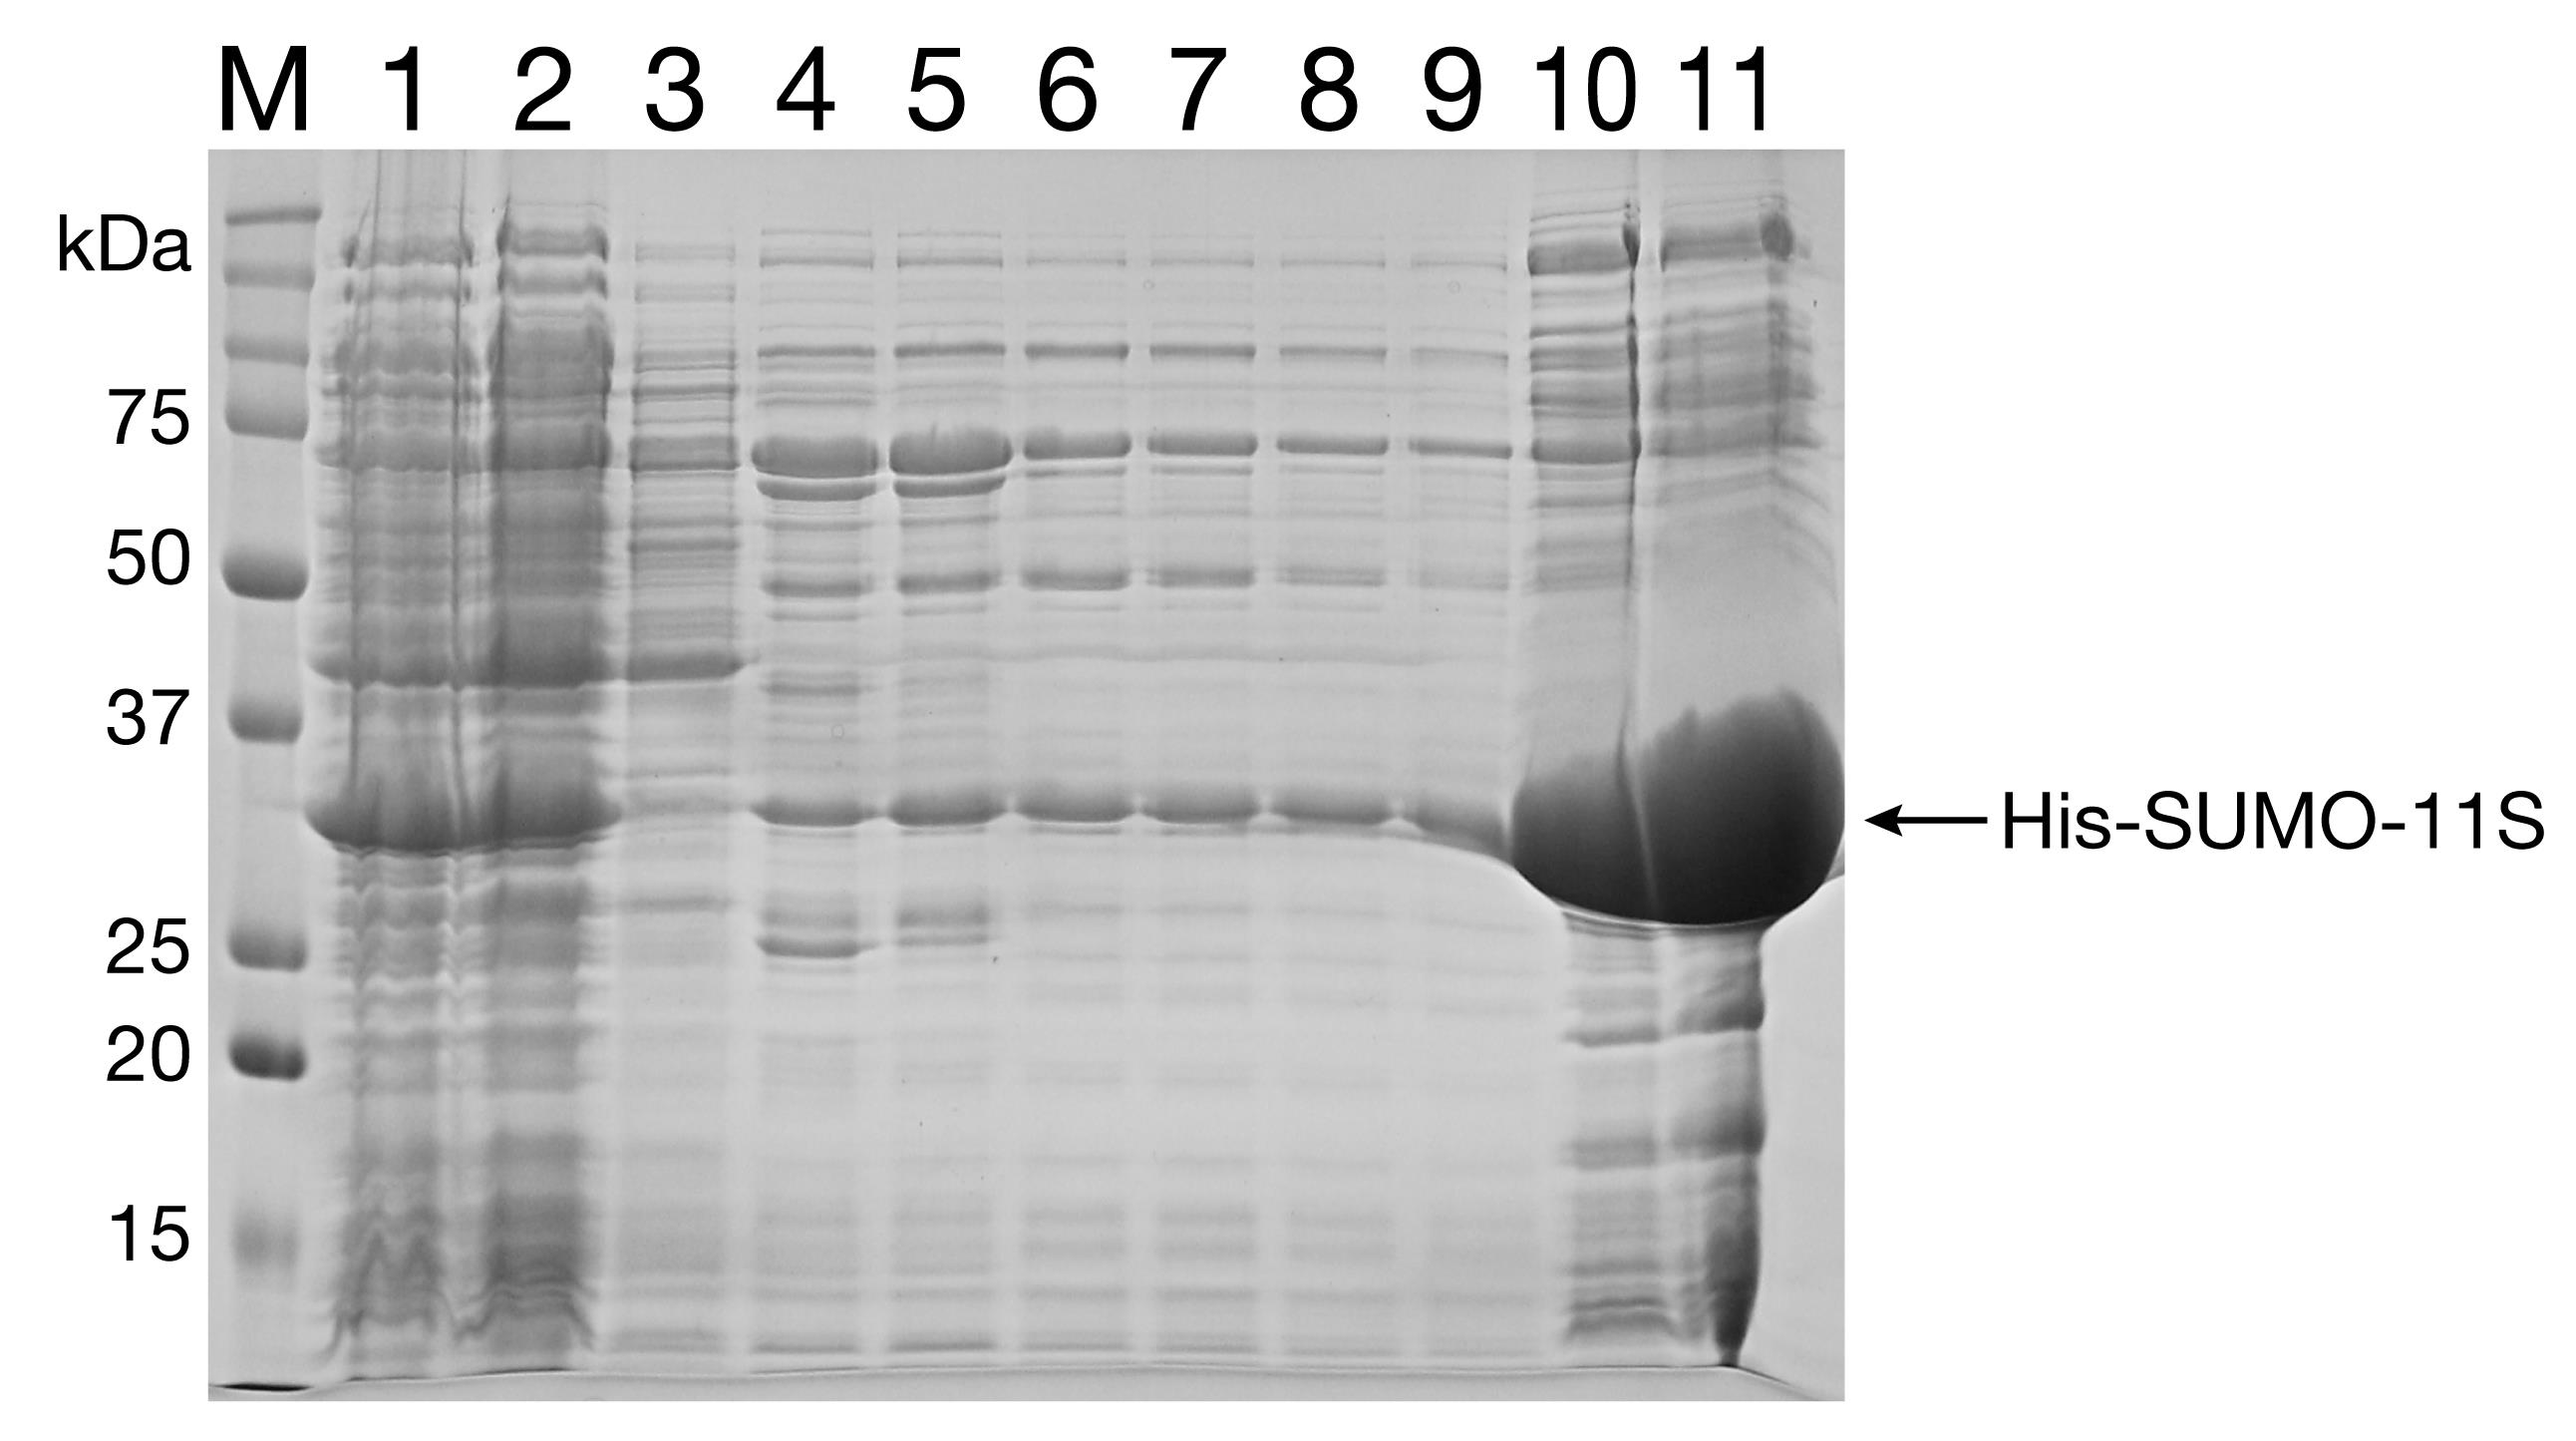
Figure 6. Ni-NTA purification of 11S. Lane 1: Whole cell lysate. Lane 2: Clarified cell lysate. Lane 3: Flowthrough. Lanes 4-8: 50 mM imidizole wash. Lanes 9-11: 300 mM imidizole wash.Add 1:1,000 Ulp1 and incubate on ice for 1.5 h to achieve His-SUMO cleavage.
Separate His-SUMO using reverse Ni-NTA affinity chromatography. Collect both the flowthrough fractions and the imidizole washes.
Run the fractions on a 12% SDS-PAGE to verify the removal of the His-SUMO tag (Figure 7). Pool the cleanest fractions and concentrate to 100 μM. Aliquot protein and flash freeze in liquid N2.
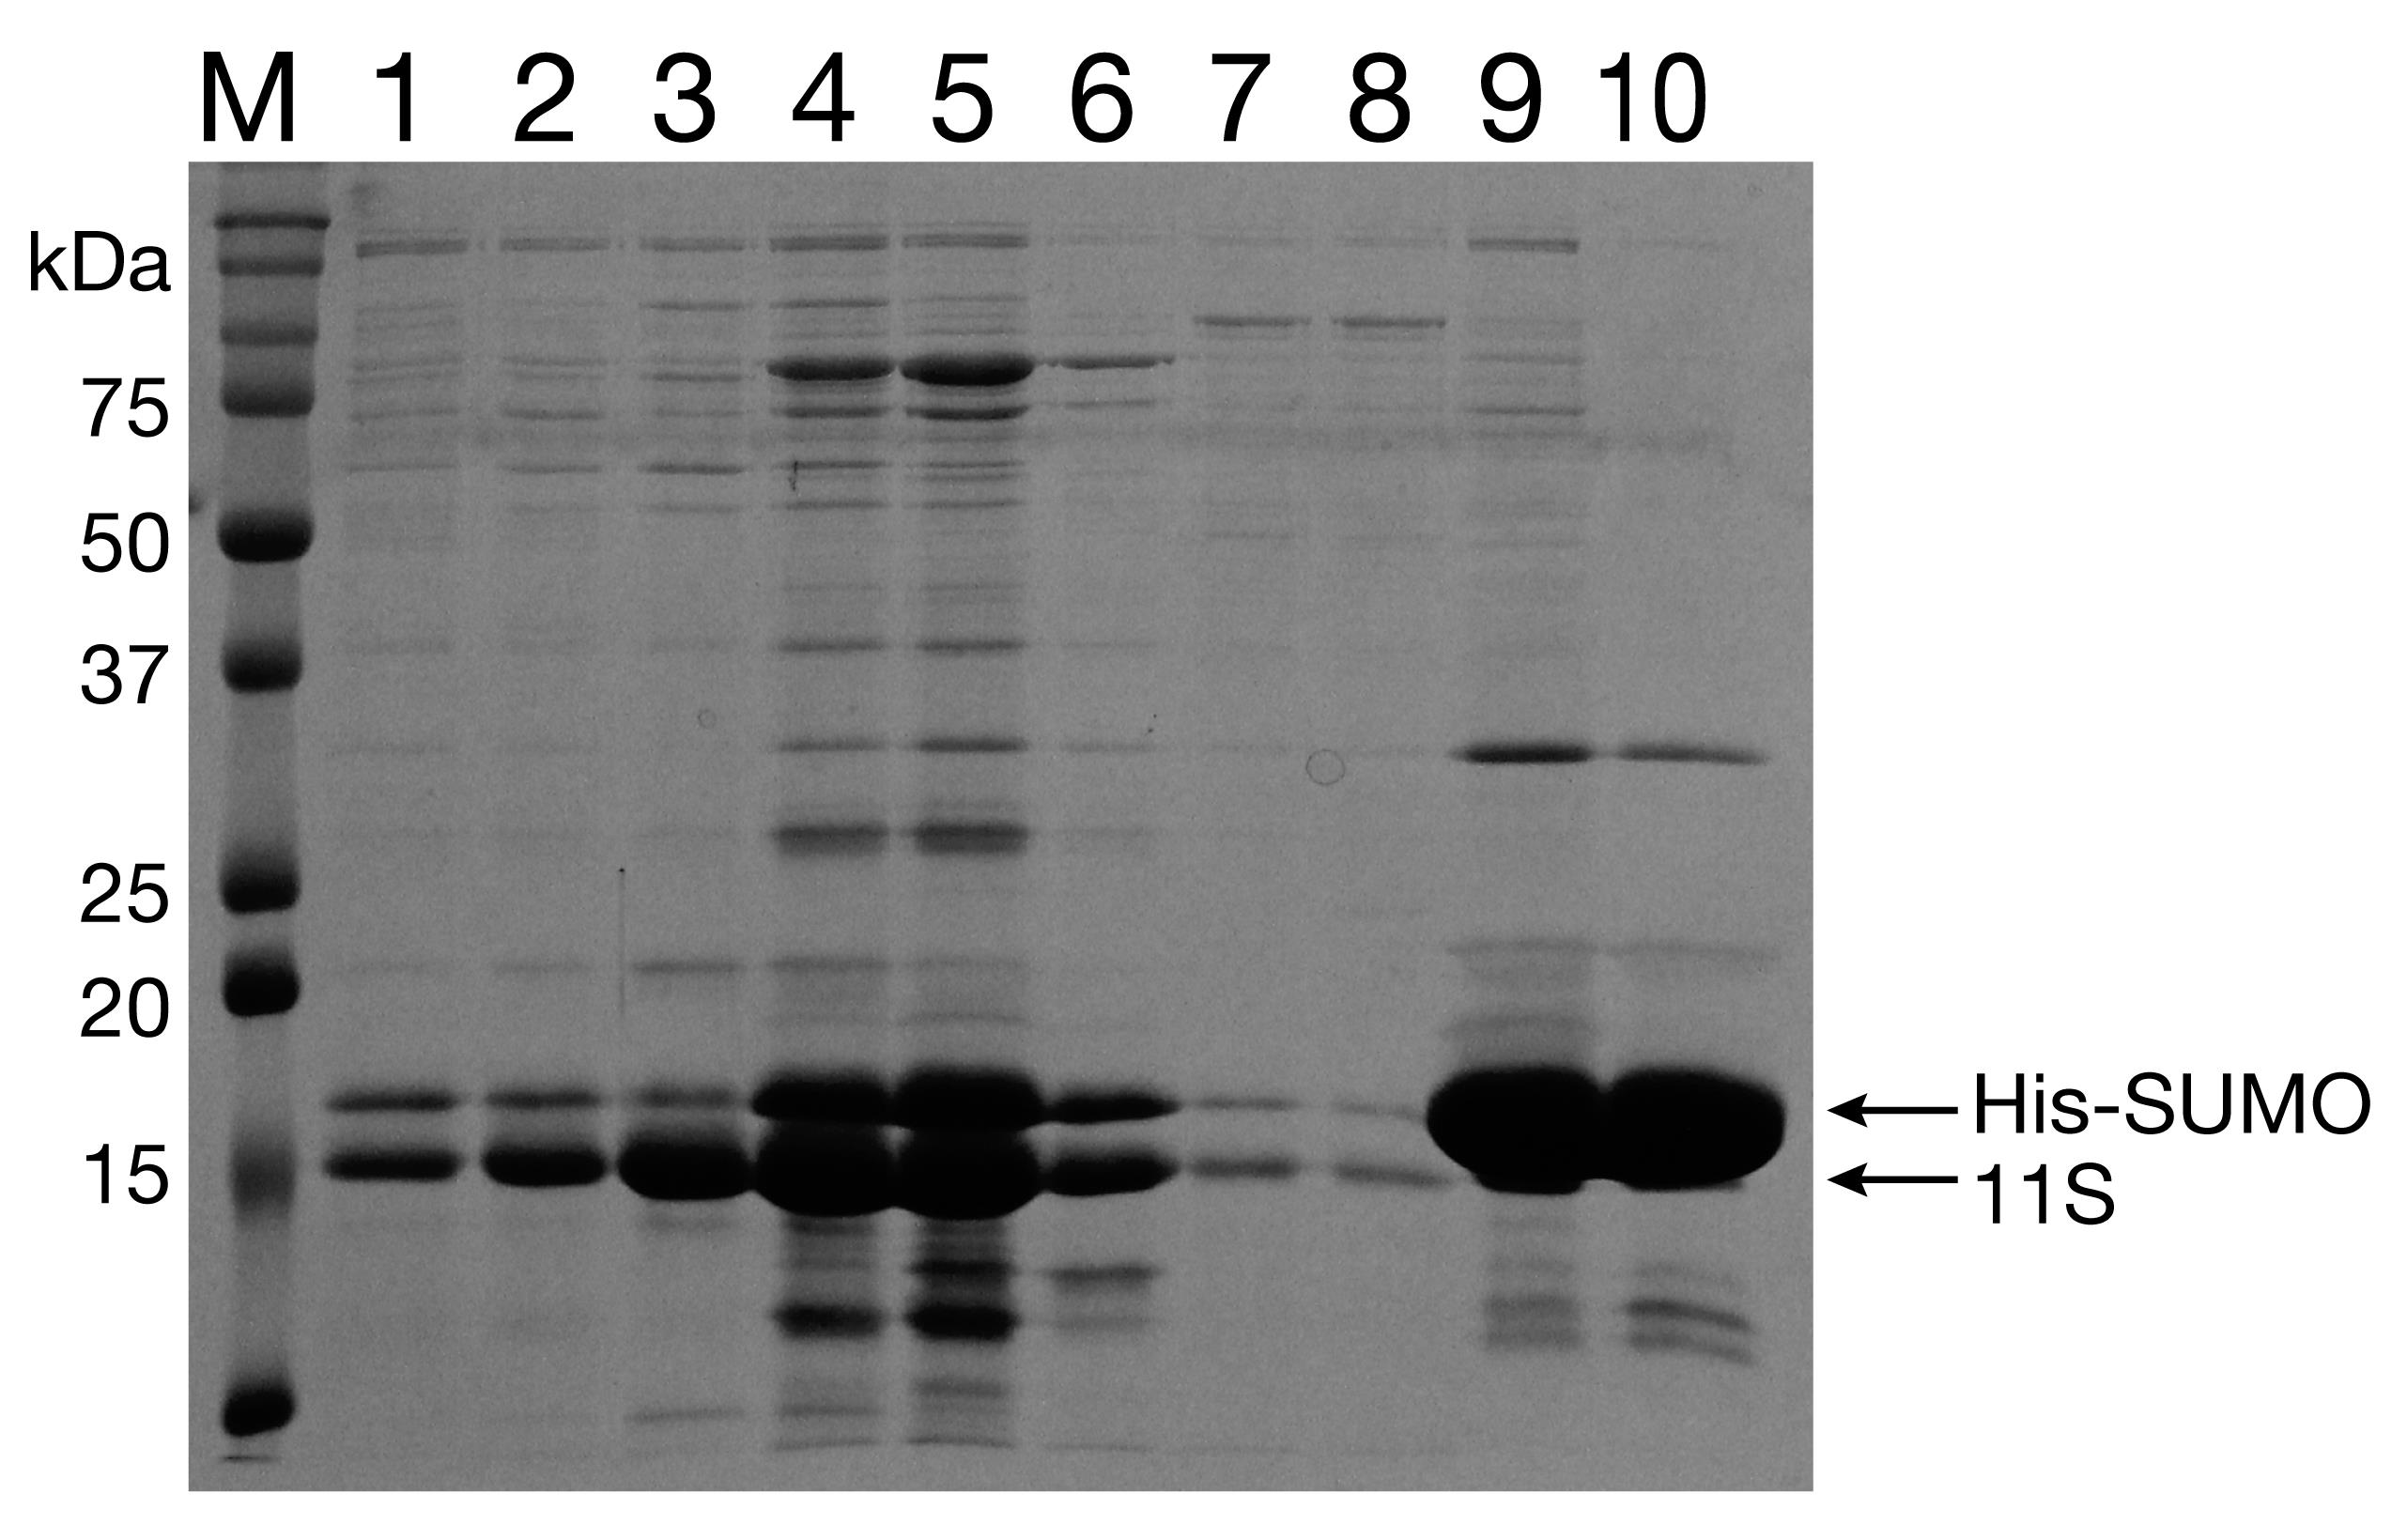
Figure 7. Reverse Ni-NTA purification of 11S. Lanes 1-7: Flowthrough (after digestion with Ulp1). Lanes 8-10: Elution with 300 mM imidizole.Purification of GST-dark
Transform BL21 (DE3) with the plasmid containing 11 S and plate cells on LB-agar Amp plates. Grow colonies overnight.
Innoculate 1 L LB-Amp (100 µg/ml) with 10 colonies from the overnight plate. Shake at 37°C, 225 × g.
Induce protein expression with a final concentration of 0.2% arabinose at 37°C when the OD600 reaches 0.4-0.6.
Harvest cells 4 h after induction at 37°C.
Lyse cells using sonication in Buffer J with one dissolved tablet protease inhibitor cocktail. Use seven 40-s cycles at duty cycle 50% and output 8. Between cycles transfer to a cold beaker for 5 min.
Centrifuge lysed cells at 20,000 × g, 4°C to remove cell debris.
Load the clarified supernatant onto a 5-ml HisTrap column in Buffer J. Elute protein with Buffer N.
Run the fractions on a 12% SDS-PAGE gel (Figure 8). Pool the cleanest fractions.
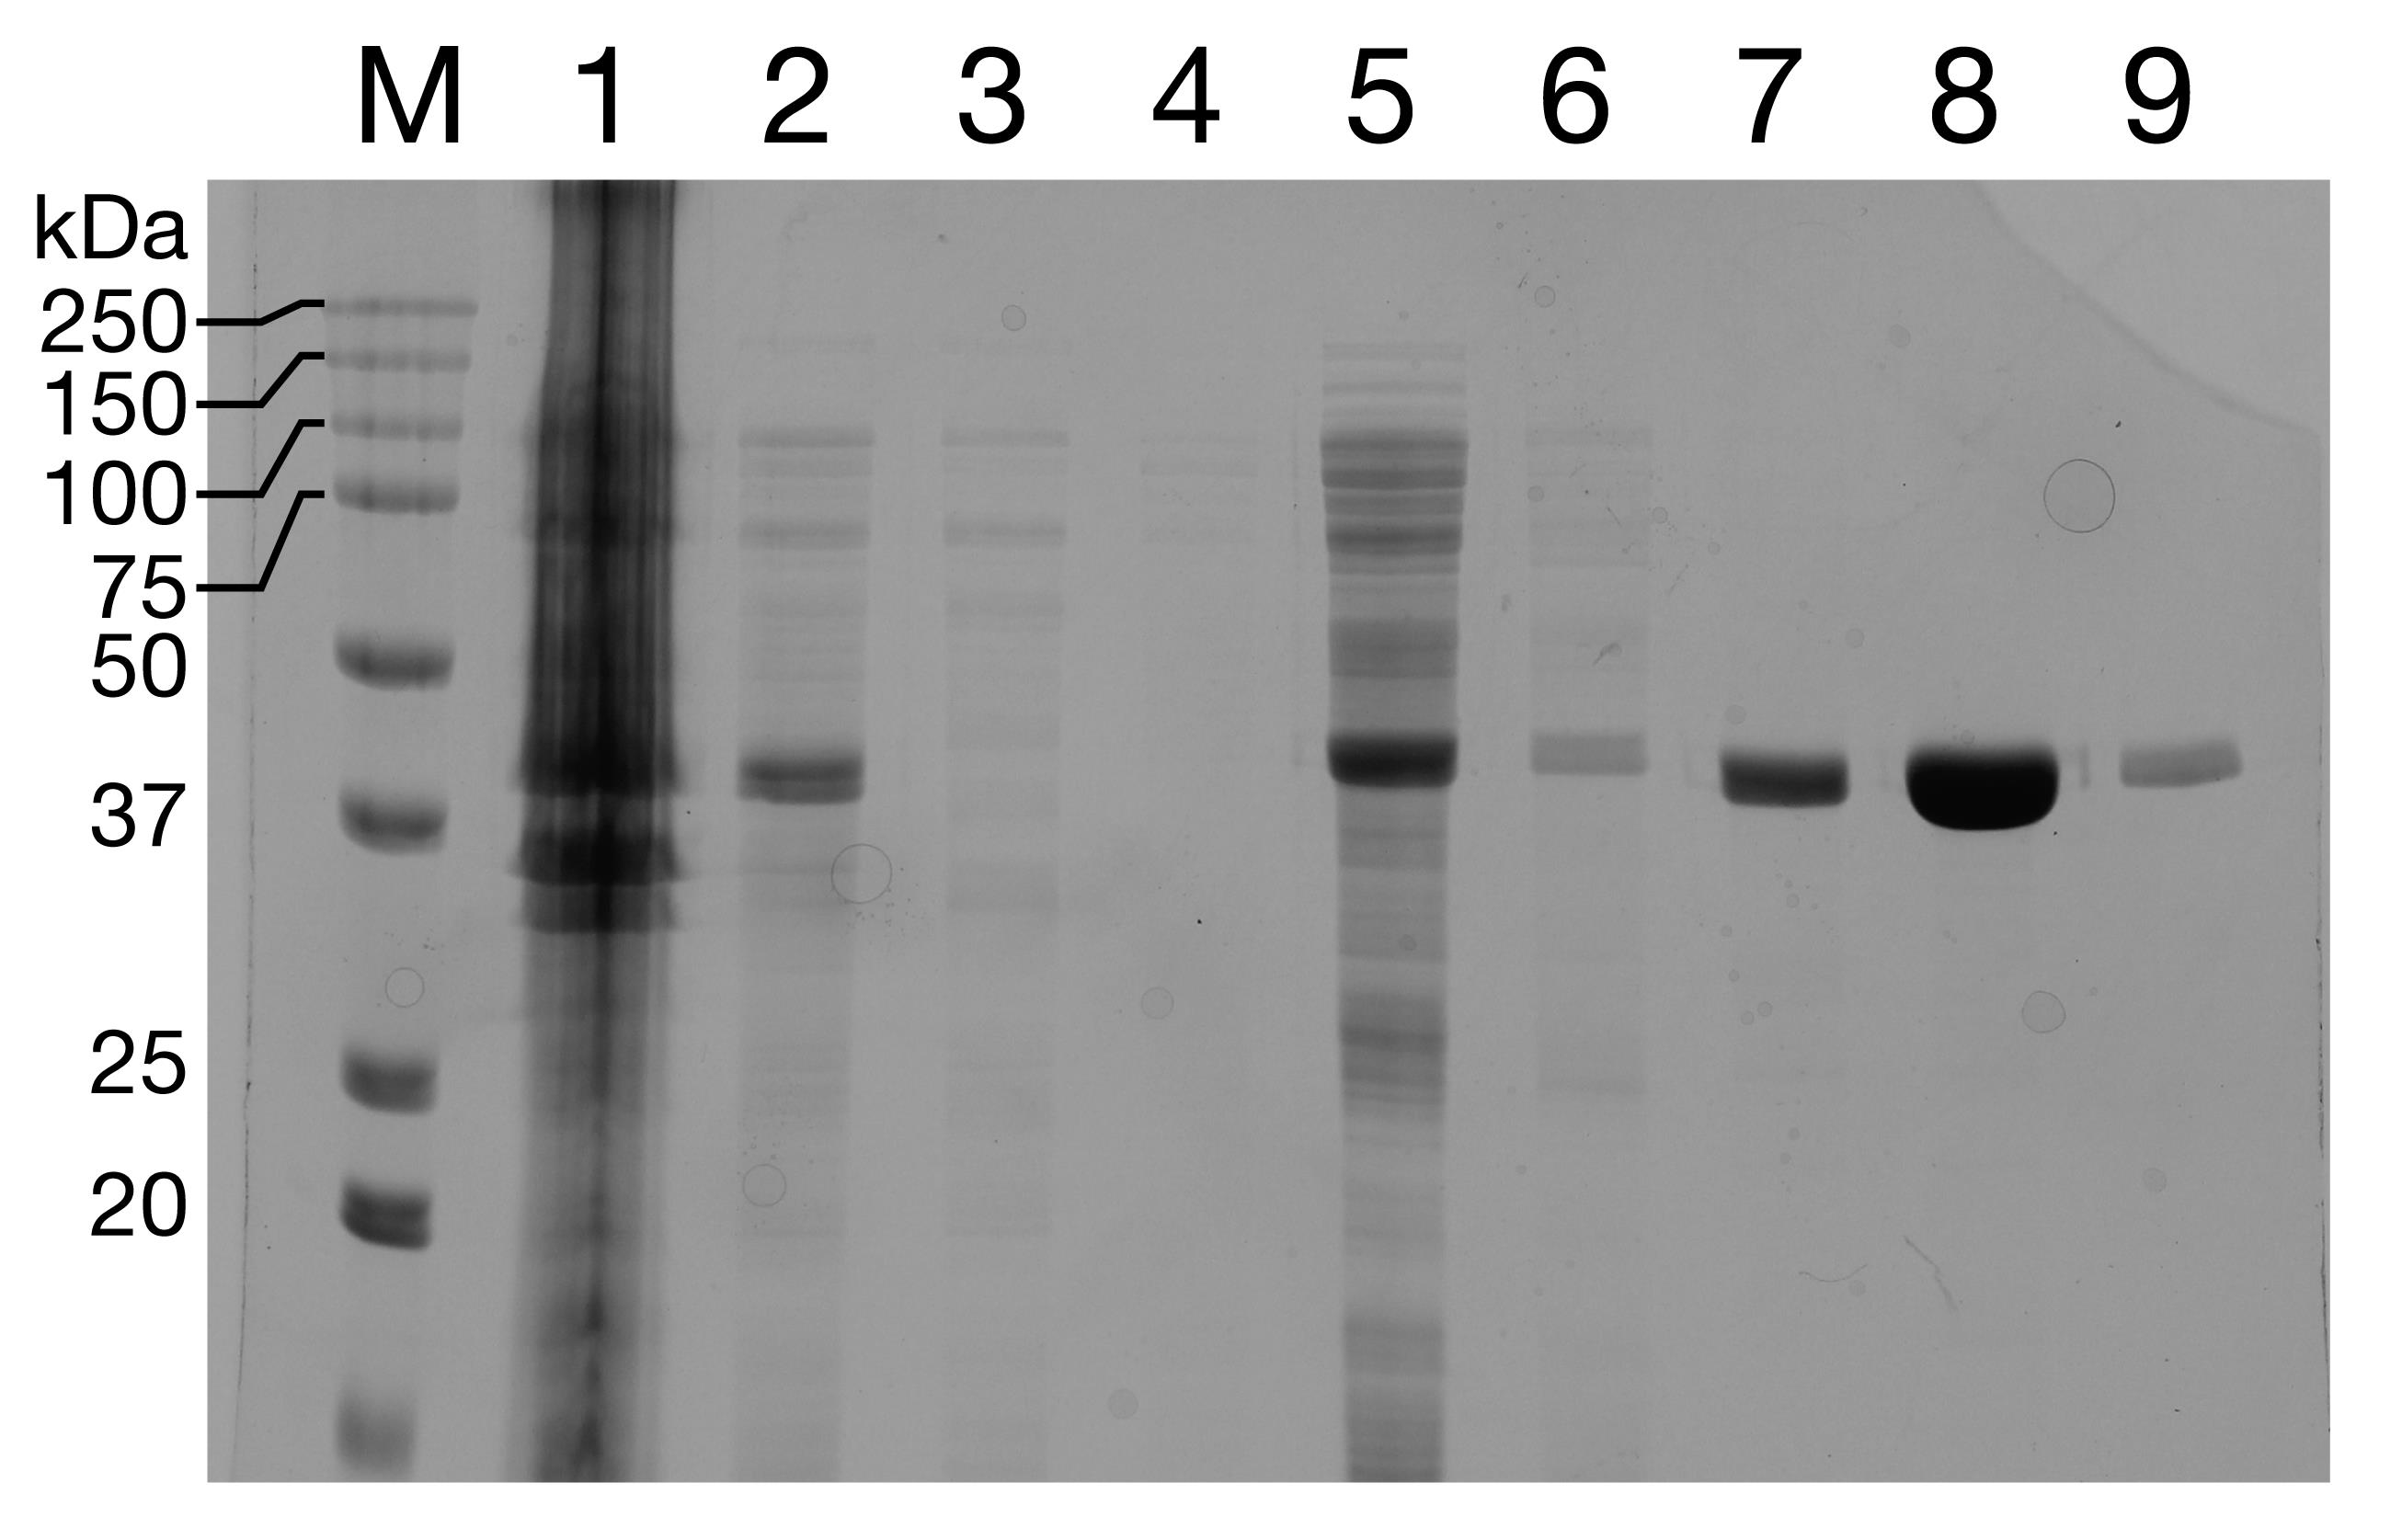
Figure 8. Purification of GST-dark. Lane 1: whole cell lysate. Lanes 2, 3: Lysate supernatant and pellet. Lanes 4-6: 100 mM imidazole wash. Lanes 7-9: Elution with 300 mM imidizole.Add 1:1,000 Ulp1 and incubate on ice for 1.5 h to achieve His-SUMO cleavage.
Separate His-SUMO using reverse Ni-NTA affinity chromatography.
Run the fractions on a 12% SDS-PAGE gel. Pool the cleanest fractions (Figure 9).
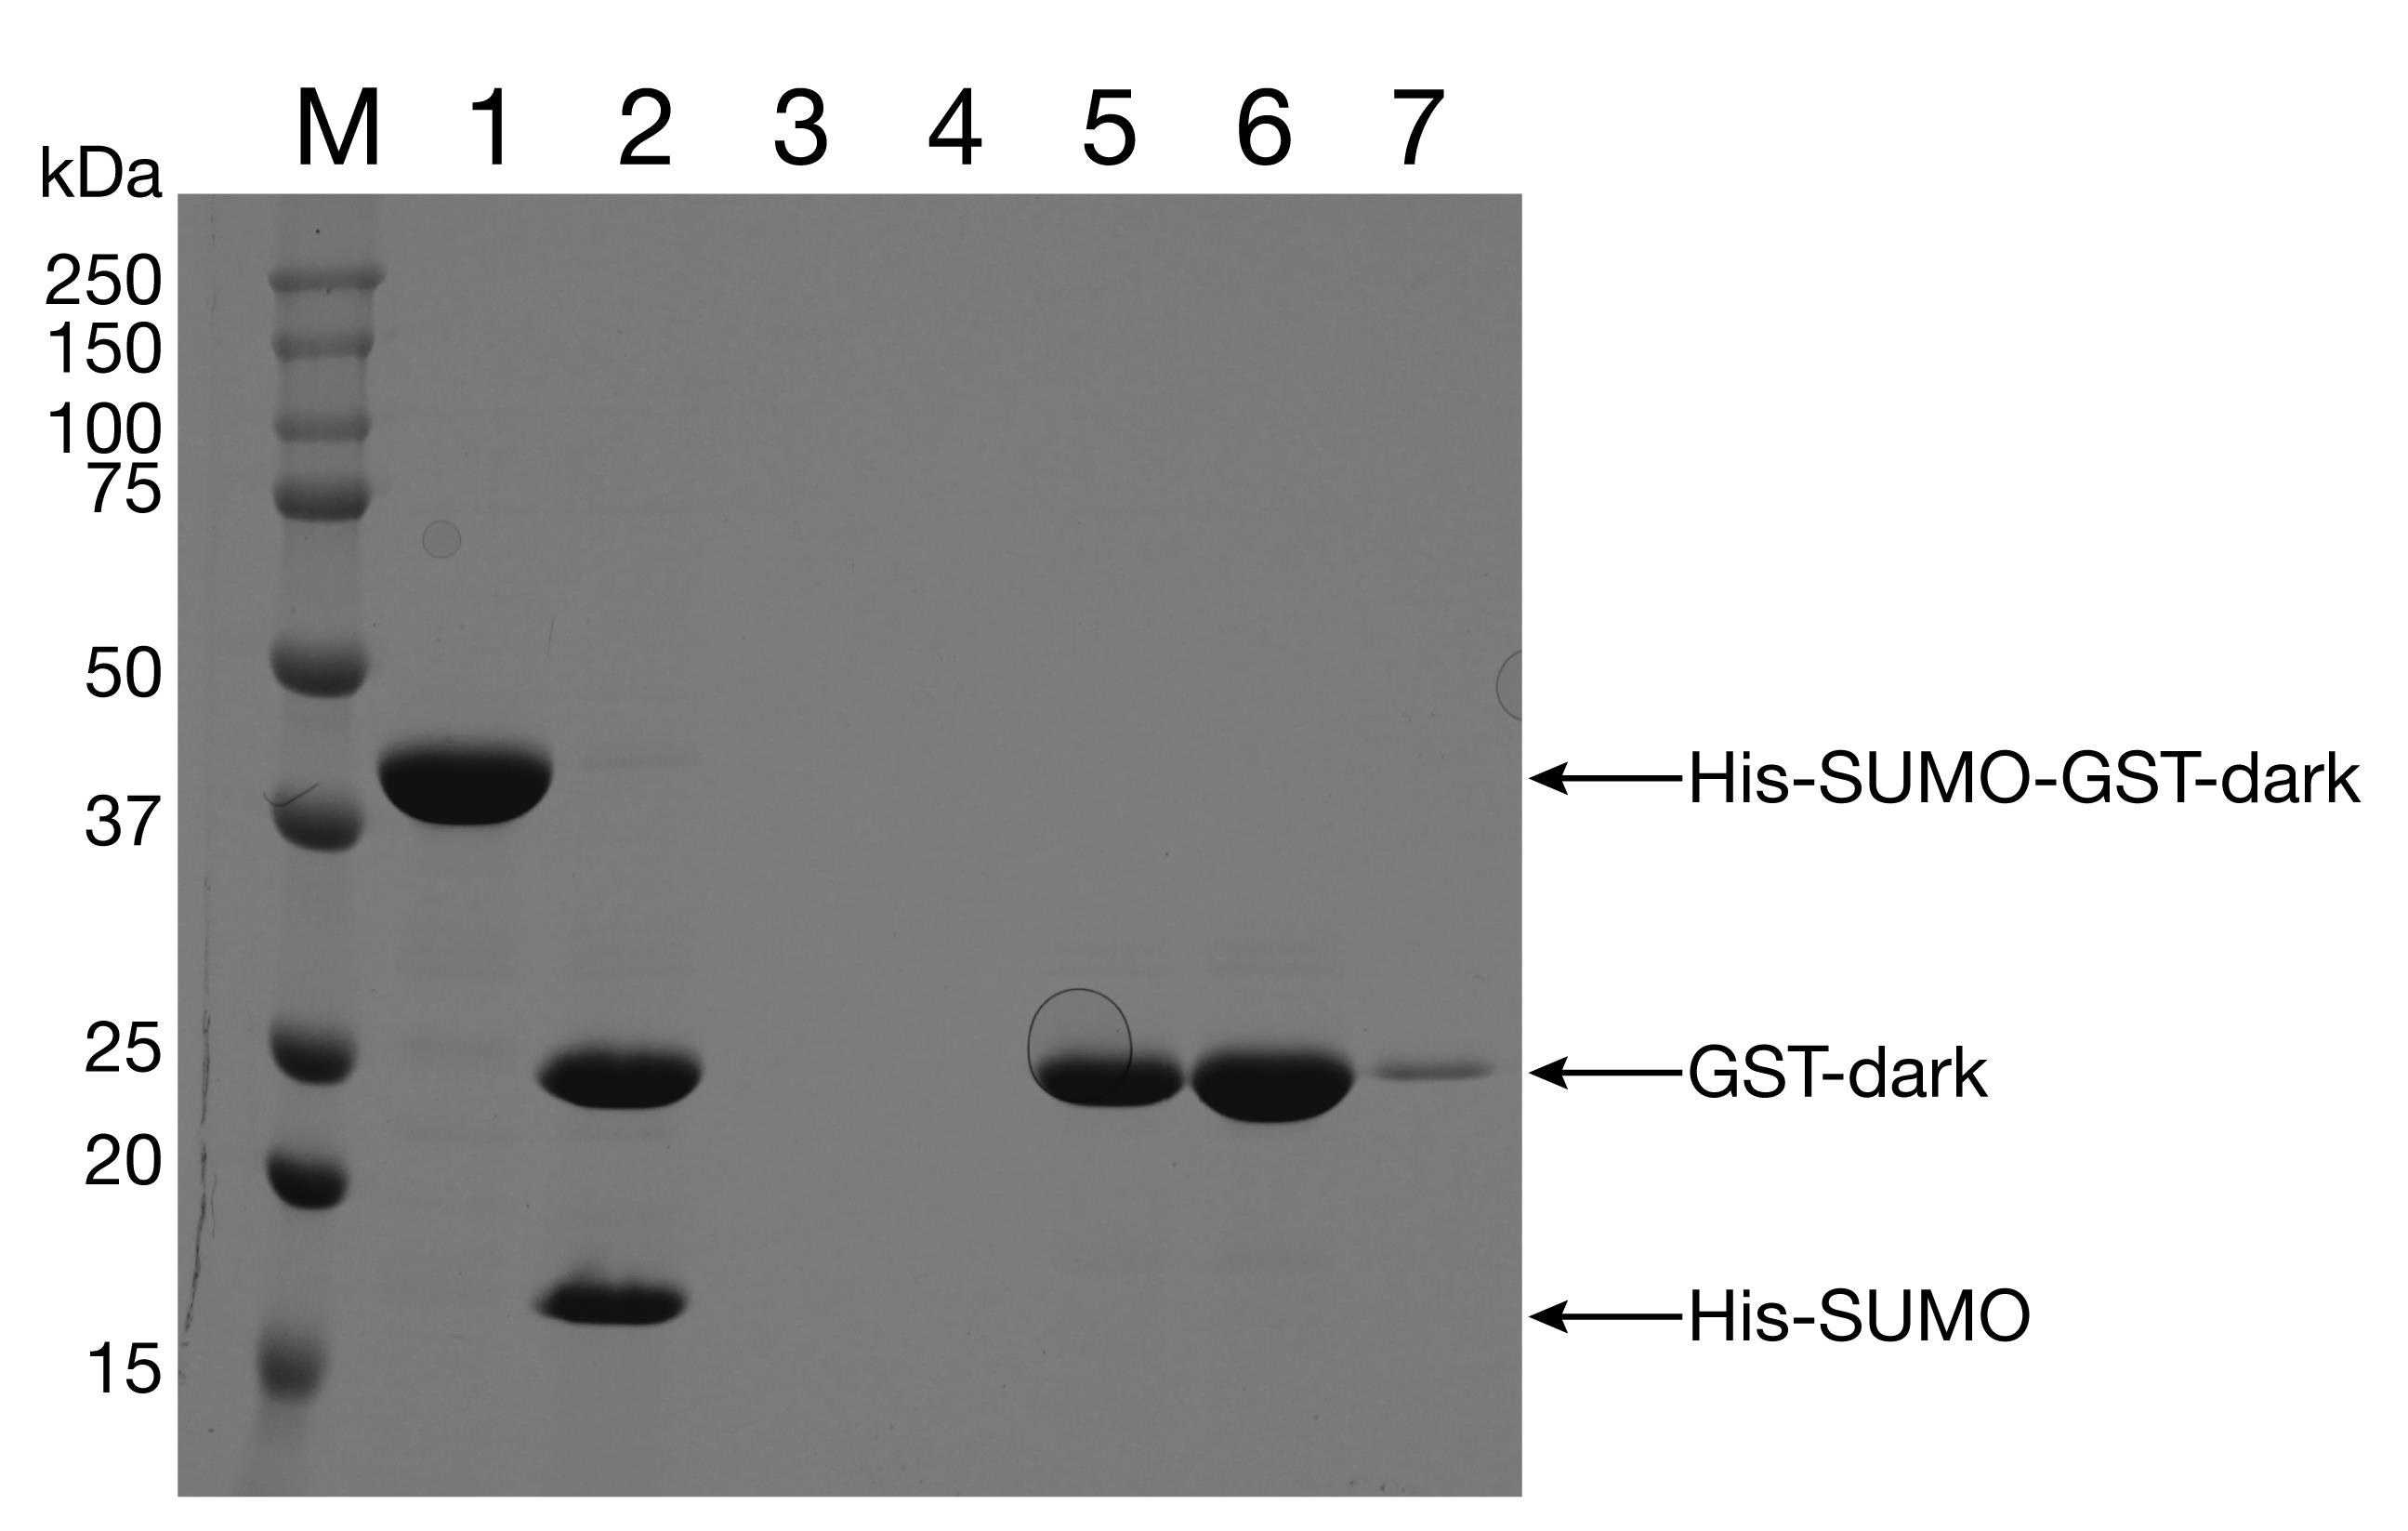
Figure 9. Purification of GST-dark. Lane 1: His-SUMO-GST-dark (eluate after first NiNTA column). Lane 2: His-SUMO-GST-dark, Ulp1-digested. Lanes 5-7: NiNTA column flowthrough.Run the fractions on a 12% SDS-PAGE gel to verify the removal of the His-SUMO tag. Pool the cleanest fractions and concentrate to 100 μM. Aliquot protein and flash freeze in liquid N2.
Preparation of SecYEG/SecA vesicles with encapsulated 11 S
Preparation of 200-nm unilamellar liposomes
Dry 10 mg E. coli polar lipids (Avanti) under a gentle stream of N2 to create a lipid film at the bottom of 13 × 100 mm glass test tubes. Leave lipids overnight under a vacuum to ensure complete drying.
Suspend lipids in 500 μl Buffer P to yield a final concentration of 20 mg/ml. Vortex until lipids have lifted off the glass tube surface and are in homogenous suspension.
Prepare the extruder with a 200-nm filter according to the manufacturer’s protocol. Before beginning extrusion of lipids, prewet the filter with extruding Buffer P 11 times.
Extrude 20 mg/ml liposome suspension 31 times or until the suspension turns from cloudy to opaque and glassy. Light should be reflected to create a rainbow effect.
Reconstitution of SecYEG/SecA into vesicles with encapsulated 11 S
Prepare liposomes according to Table 1. Scaling up the reaction is not recommended. Instead, conduct multiple reconstitutions in parallel if needed.
Table 1. Components for SecYEG/SecA proteoliposome reconstitution
Component Final concentration Volume (μl) 1× Polar lipid extract (200-nm vesicles)
8 mg/ml 160 49 mM DDM 4.7 mM 38.4 Buffer P - 201.6 Total 400 After preparing the reaction above, incubate on a nutator at room temperature for 3 h.
Add proteins at the following concentrations: SecYEG at 5 μM monomer, SecA at 5 μM dimer, and 11 S at 50 μM. The final reconstitution reaction volume is 800 μl.
Incubate the reaction for 1 h at 4°C on a nutator.
To remove detergent, conduct 4 incubations with Bio-Beads SM-2. For the first incubation, add 80 μl (dry bead volume) Bio-Beads and leave on a nutator at 4°C for 2 h.
Remove the reaction from the Bio-Beads by aspirating the sample into a new tube containing another 80 μl Bio-Beads. Leave the reaction on a nutator for 4 h at 4°C.
After 4 h, aspirate the sample into a new tube containing 160 μl Bio-Beads. Leave overnight on a nutator at 4°C.
For the final Bio-Bead incubation, aspirate the sample and add to 160 μl Bio-Beads. Leave on a nutator for 2 h at 4°C.
Completely aspirate the sample from the Bio-Beads and spin down at 6,000 × g for 5 min to remove any large particulates.
Run the supernatant over Hi-Prep 16/60 Sephacryl S-200 to remove any unincorporated 11 S from the proteoliposomes.
Isolate the proteoliposomes by centrifugation at 250,000 × g for 30 min at 4°C.
All tubes will contain a small glassy pellet. Resuspend the pellet in Buffer P to give a final SecYEG concentration of 1 μM SecYEG.
Run the final proteoliposome suspension on a 12% SDS-PAGE gel to ensure that the reconstituted proteoliposomes contain all the proteins of interest (Figure 10).
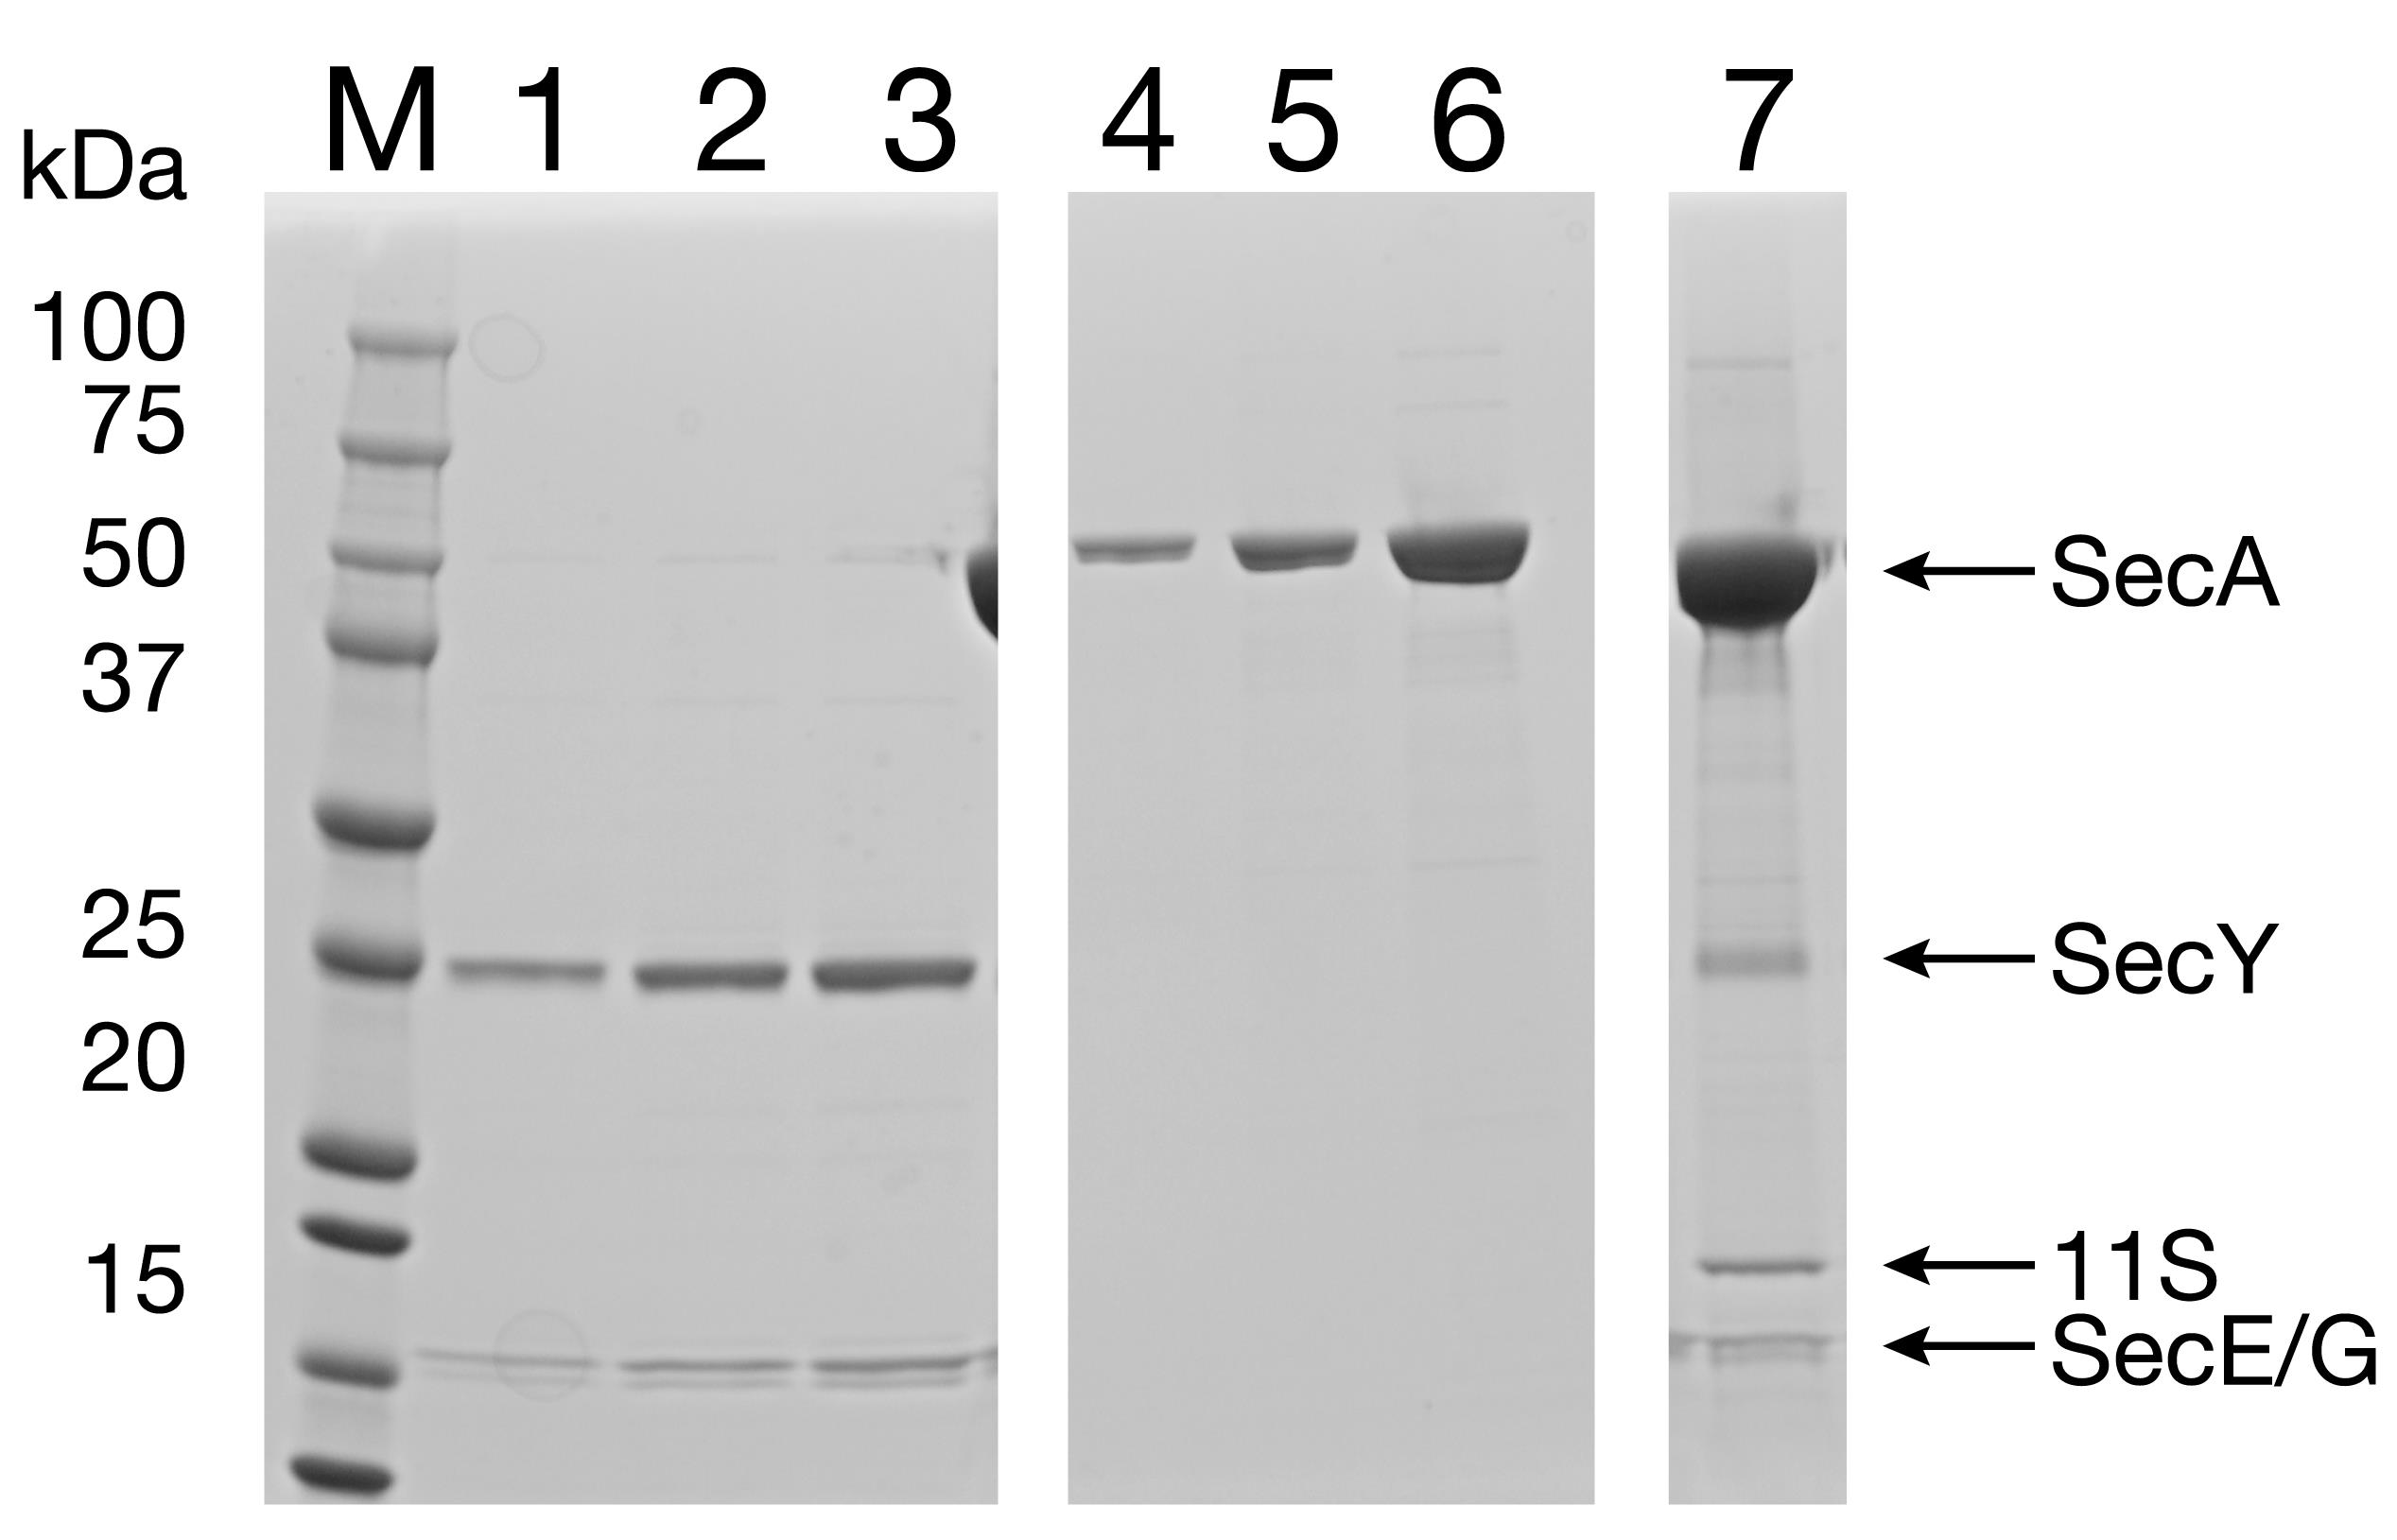
Figure 10. Reconstitution of SecYEG/SecA into proteoliposomes containing 11S. Lanes 1-3: Purified SecYEG protein (to assess the protein concentration in the final product). Lanes 4-6: Purified SecA protein (to assess the protein concentration in the final product). Lane 7: Final proteoliposome product.Flash freeze 20-μl aliquots in liquid N2 and store at -80°C.
Preparation of oxidized pOA-mDHFR-p86
Prepare 1 mM copper (II)/phenanthroline and add to 10 μM protein. Flick the tube to mix and incubate at 4°C for 18 h.
Assess disulfide bond formation on a 15% SDS-PAGE gel. Compare samples run using sample buffer containing reducing agent vs that without. Disulfide-bonded protein will run farther down the gel (Figure 11, Lane 3 vs. Lane 4).
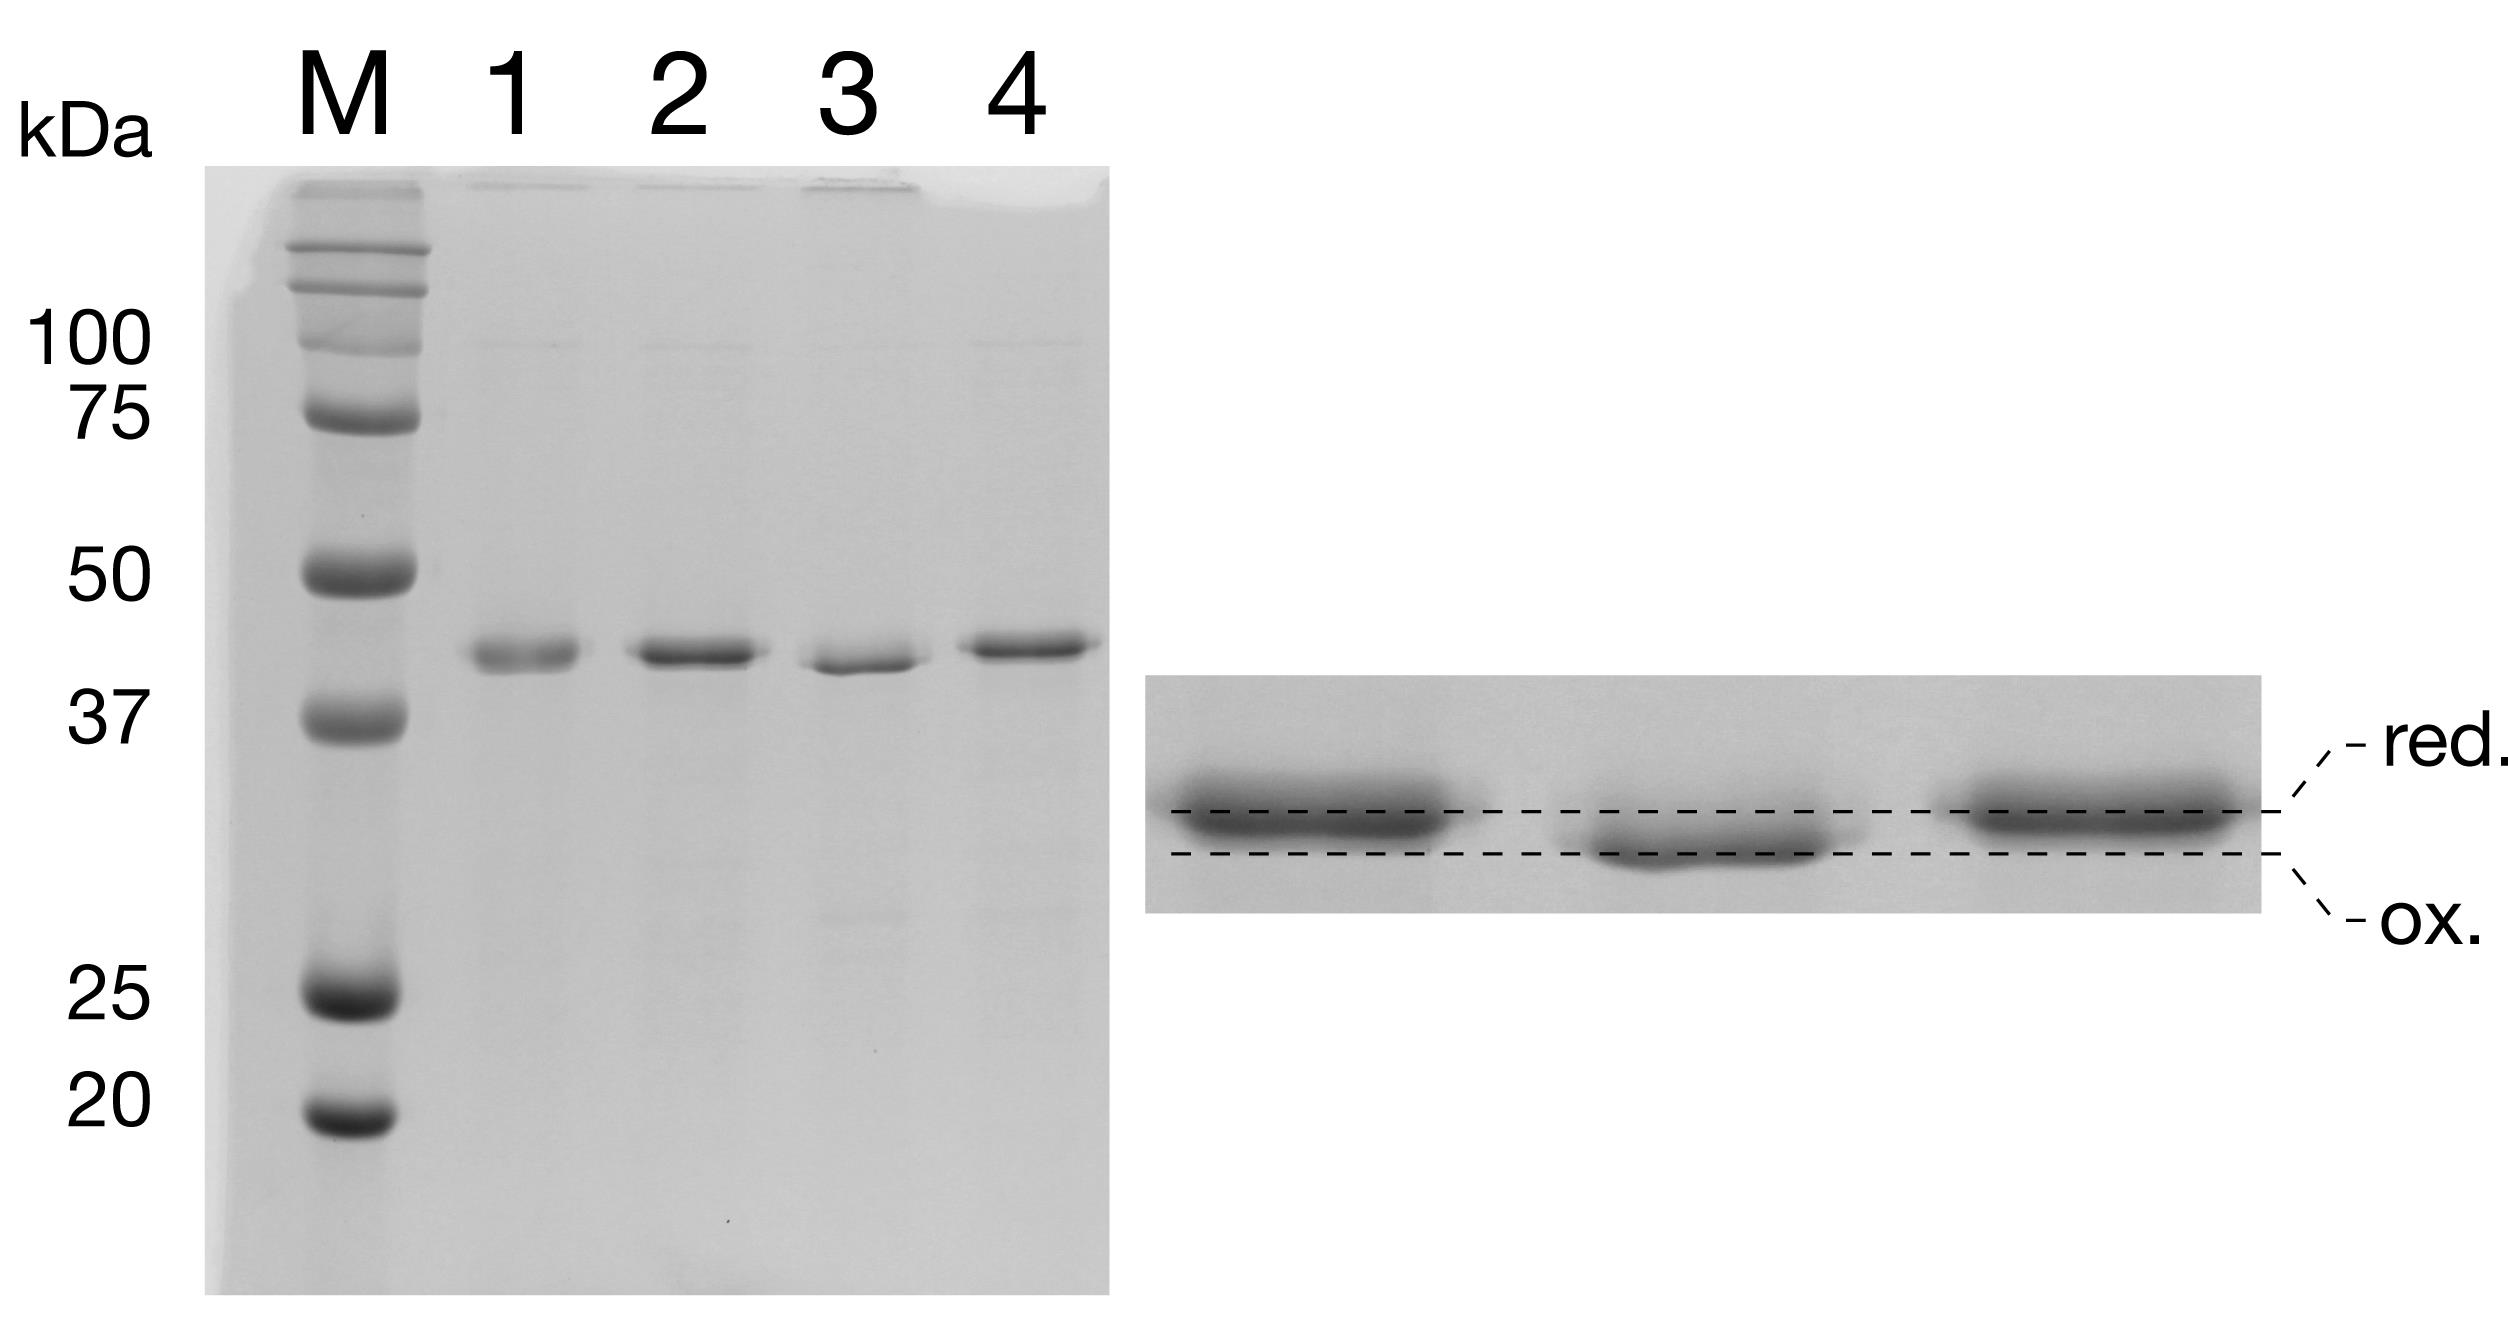
Figure 11. Oxidation of pOA-mDHFR-p86 assessed via 15% SDS-PAGE. Incubation of pOA-mDHFR-p86 with copper/phenanthroline (Cu2+/Ph) catalyzes the formation of an intramolecular disulfide bond. Oxidized pOAmDHFR-p86 migrates with higher electrophoretic mobility than the reduced form, as is expected for a protein containing a disulfide loop (lane 3 vs. lane 4). Lane 1: -β-ME, -Cu2+/Phenanthroline. Lane 2: +β-ME, -Cu2+/Phenanthroline. Lane 3: -β-ME, +Cu2+/Phenanthroline. Lane 4: -β-ME, +Cu2+/Phenanthroline.Disulfide-bonded protein was flash frozen in liquid N2 and stored at -80°C until needed for translocation experiments.
Real-time translocation measurement
Table 2 indicates the concentration and volume for each component in the real-time translocation reaction.
Table 2. Components for the real-time translocation assay
Component Final concentration Volume (μl) 1× SecYEG/11S proteoliposomes 10 nM 1 GST-dark 10 μM 10 Buffer Q - 20 Oxidized pOA-mDHFR-p86 1 nM 1 H2O - 48 Nano-Glo® substrate - 20 Total 100 To set up more than one reaction in parallel, prepare a mastermix with the base components as shown above. For example, if running both an –ATP and +ATP sample, prepare 2.2× the reaction shown. Split the reaction by adding 100 μl mastermix to each well before the addition of ATP.
Begin setting up the reaction by incubating 10 nM SecYEG proteoliposomes with encapsulated 11S with GST-dark for 10 min at room temperature.
Prepare the Nano-Glo® Live Cell Assay System substrate according to the manufacturer’s protocol by diluting 1:20 in the buffer provided in the Nano-Glo® Live Cell Assay System kit.
Add Buffer Q, 1 nM oxidized pOA-mDHFR-p86, Nano-Glo® Live Cell Assay System Buffer with Nano-Glo® substrate, and water to the proteoliposome/GST-dark reaction. Flick the tube gently to mix. Transfer 100 μl reaction mix to a well of a 96-well plate.
Add 5 mM ATP to start insertion and stalling. For the –ATP control, add an equal volume of H2O.
Place the plate in the GloMax Navigator and start the luminescence measurement (0.25-2 s integration time).
After 15-20 min, spike in 0.5 μM GST-dark.
After the luminsence signal plateaus (~30 min), add 1 μl 1 M DTT to reduce the disulfide bond and begin translocation.
Continue to collect luminesence data for 30 min (Figure 12).
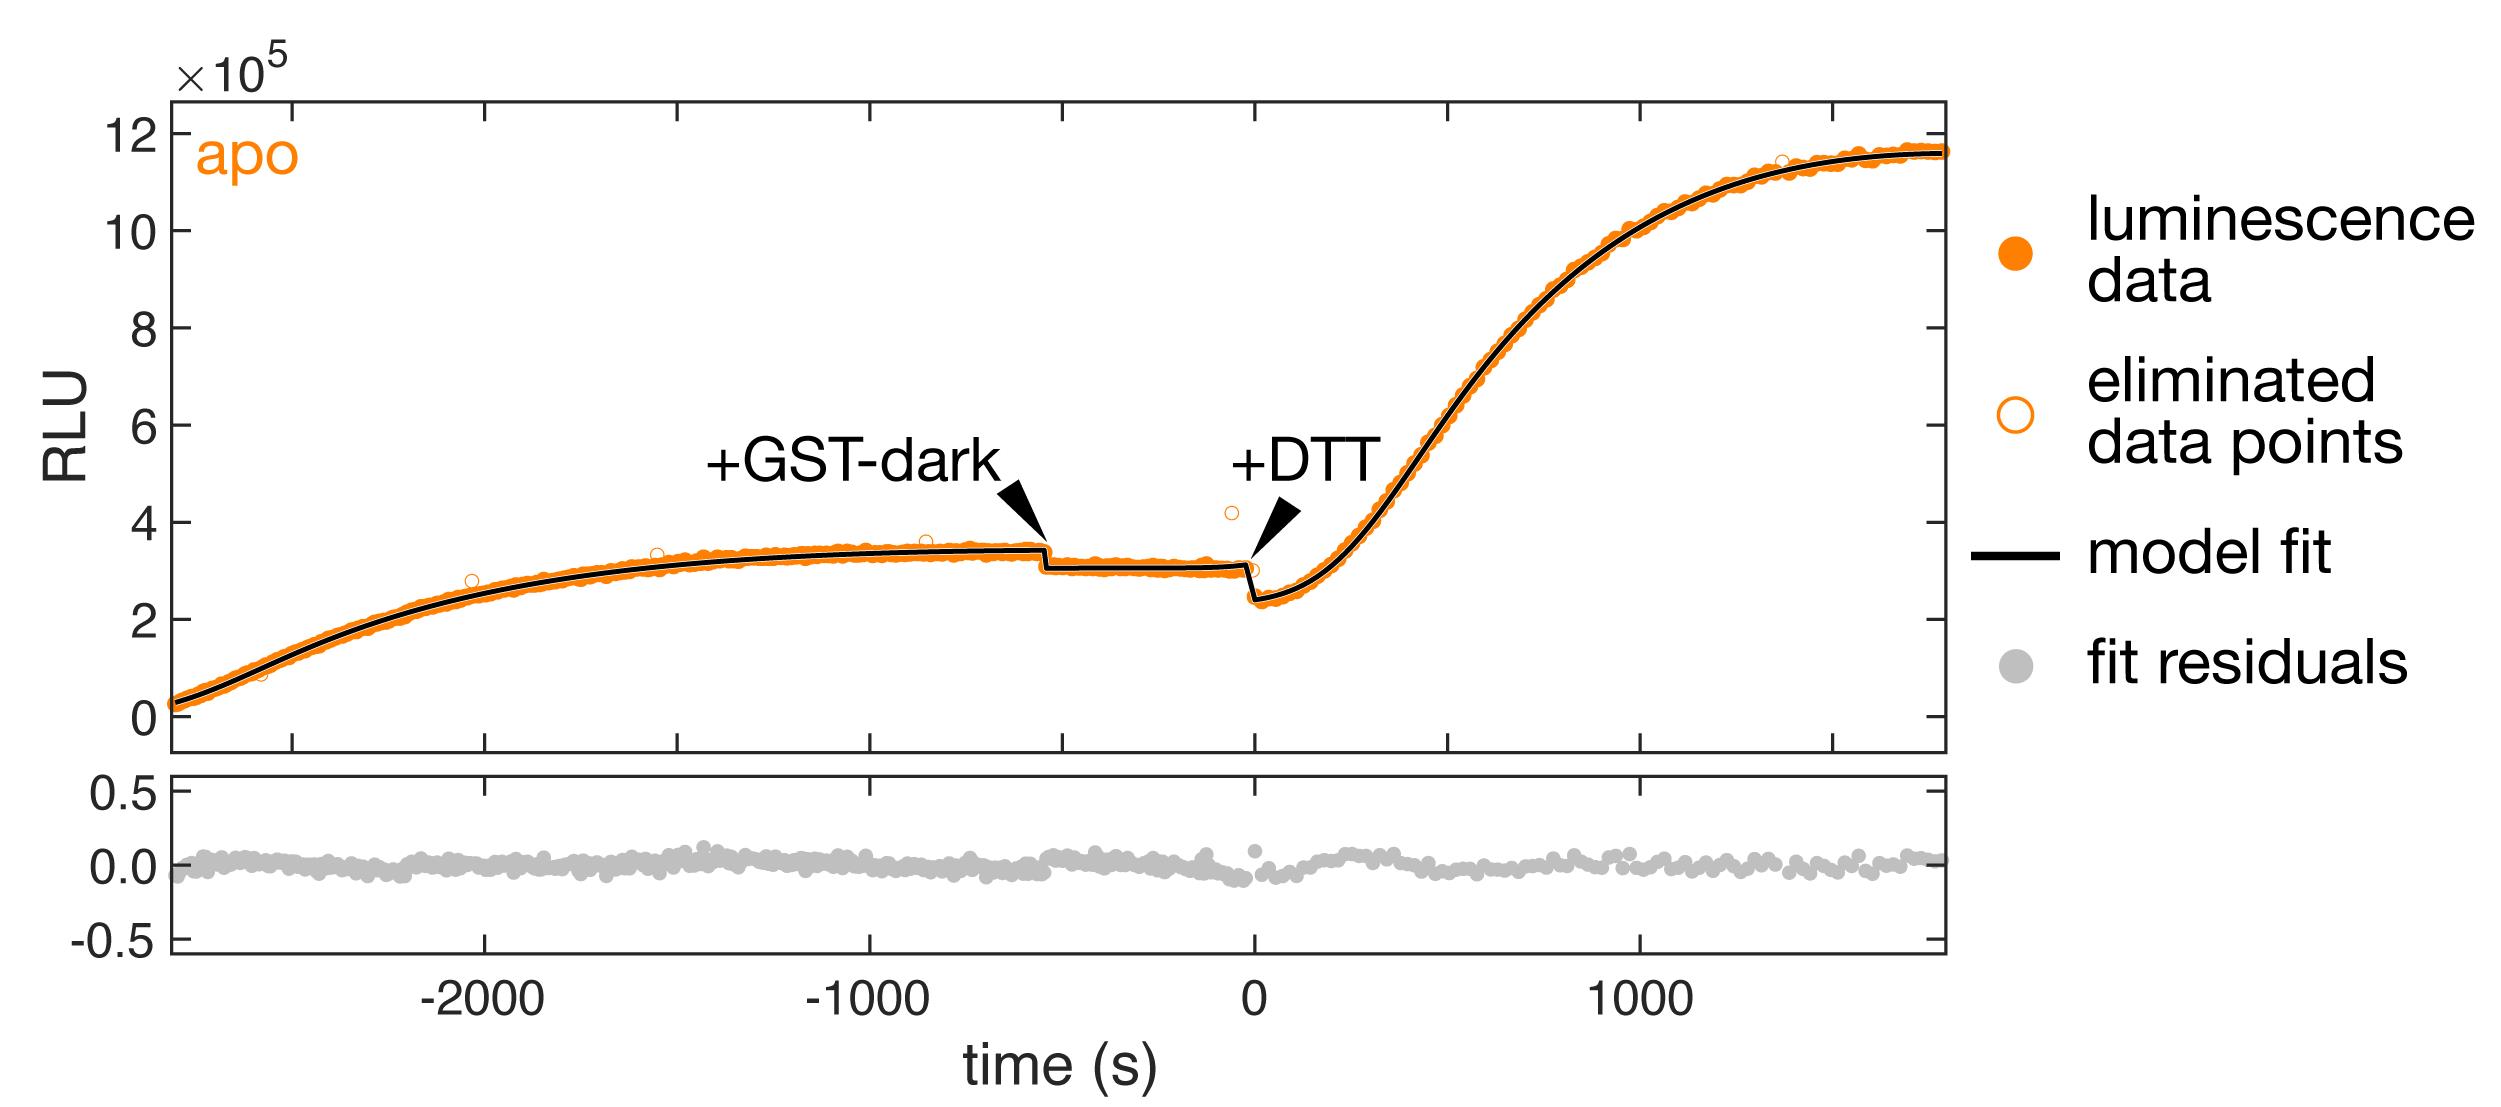
Figure 12. Synchronized real-time translocation measurement The upper graph shows the luminescence recording for a translocation experiment with oxidized pOA-mDHFR-p86 after mixing ATP, GST-dark, and SecYEG/SecA proteoliposomes containing encapsulated 11S. Closed orange circles are the data used to calculate a fit (black line) based on our detailed model (see Data analysis). Open orange circles are data points that were eliminated from the analysis due to an unusually high variance. The initial increase in luminescence results from side reactions that occur while stalled translocation substrate accumulates. Arrowheads indicate the addition of extra GST-dark and DTT to the reaction, as described in the Procedure (Section D). Additional GST-dark quenches any 11S protein that is accessible on the outside of the proteoliposomes. DTT reduces the substrate protein, restarting translocation and resulting in an increase in luminescence. The graph on the bottom shows the residuals from the fit.
Data analysis
In the following, we provide a summary of the kinetic model that we developed to analyze translocation kinetics. For a detailed explanation, we refer the reader to Gupta et al. (2020).
Introduction
In the translocation measurements described here, luminescence is generated when the p86-tagged C-terminus of the substrate protein is translocated into the interior of SecYEG/SecA proteoliposomes and restores luciferase activity by binding to 11S. We developed a kinetic model, described in detail in a previous publication (Gupta et al., 2020), that takes into account the following processes during the translocation reaction:
The oxidized substrate protein engages with the translocon and is partially translocated. Full translocation is prevented by the disulfide loop in the substrate protein.
DTT addition induces disulfide loop opening, and translocation resumes. Full translocation is prevented by the tertiary structure of the mDHFR moiety of the translocation substrate protein.
Unfolding of mDHFR permits translocation to continue. Upon completion of translocation, light is generated by the encapsulated NanoLuc luciferase.
In addition, the model takes into account undesired processes that affect the time evolution of the luminescence signal:
Substrate proteins with reduced cysteines bypass disulfide-loop stalling and reach the interior of the proteoliposomes, generating a signal before DTT is added to the reaction.
A side reaction, which we term “incapacitation,” results in irreversible inactivation and prevents substrate import.
NanoLuc substrate depletion results in a time-dependent decrease in light intensity.
Our model describes the time evolution of the luminescence intensity, I, as a function of 11 parameters, as described in Section E3 (below). Here, we describe an approach for global fitting of multiple experiments. In the case discussed here, the unfolding rates vary across experiments, whereas other parameters are the same for all experiments, as described previously (Gupta et al., 2020). The analysis can easily be adjusted to other studies by choosing the global parameters appropriately.
Background subtraction and error statistics
A luminescence plate reader quasi-simultaneously counts the number of photons emitted by the sample, Am,n, and that emitted by the blank, Bm,n. Here, index m denotes the number of the experiment (the difference in the experimental conditions results in different unfolding rates, but other model parameters are the same for all experiments, which calls for global analysis). Index n enumerates the readings in the order of increasing times tn. The background Bm,n is obtained using a nearly identical sample that contains all ingredients except for ATP. Since translocation is impossible without ATP, the photons counted in the absence of ATP represent the background. The difference
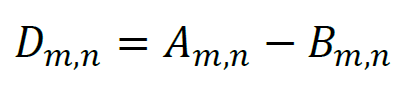
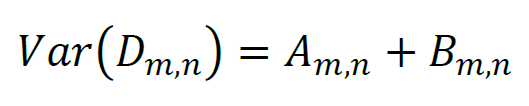
represents the data that must be fit by a model function. Since Am,n and Bm,n represent statistically independent photon counts that obey Poisson statistics, the variance estimate for Am,n equals Am,n, the variance estimate for Bm,n equals Bm,n, and the variance estimate for Dm,n can be determined as:
Global χ2 definition
When the data obtained in more than one experiment are fit simultaneously, and some of the model parameters are shared among all experiments, the procedure represents global fitting. During a global fitting, one function that represents the global goodness-of-fit must be minimized. In Hamilton (1964), it has been shown that to achieve the highest possible accuracy of the model parameter estimates, the goodness-of-fit function must equal the χ2 defined as the sum over all data of the squared differences between the data and the model, divided by the corresponding variances:
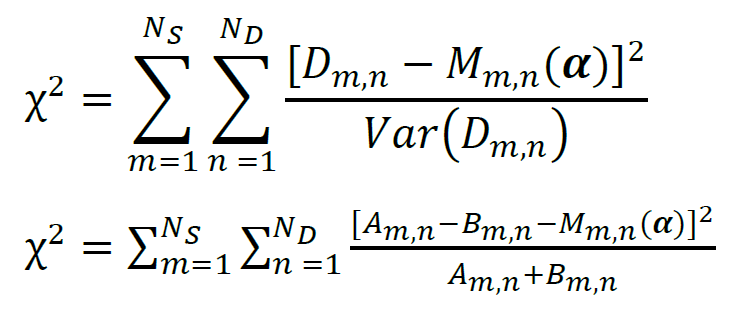
Here, NS denotes the total number of experiments, ND denotes the number of data points per experiment, Mm,n(α) denotes the model function, and α denotes the vector of model parameters. Note that the χ2 defined above is not reduced. The reduced χ2 is sometimes used to characterize the goodness-of-fit; it is calculated as χ2/NF, where NF is the number of degrees of freedom, NF = NS × NDNP, and NP is the number of independent model parameters that are not fixed during the fitting procedure.
χ2 minimization algorithm
The Levenberg–Marquardt algorithm (Marquardt, 1963) is used to find the model parameters that result in the minimum χ2. The Levenberg-Marquardt algorithm is essentially the Gauss-Newton algorithm with an improved ability to converge when the initial guesses for the model parameters α are far away from the minimum. If the model parameters α are close to the minimum, then the Gauss-Newton algorithm can also be used; it converges faster than the Levenberg–Marquardt algorithm. The algorithms that do not require calculation of the Hessian matrix (for example, the method of gradient descent) have no chance of finding the global minimum in a problem with NP≈30 model parameters. The GNU Scientific Library (GSL) contains a function for multidimensional nonlinear weighted least-squares fitting based on the Levenberg–Marquardt algorithm; this function is adequate for the global fitting described here. Alternatively, one can write custom functions in C or a FORTRAN subroutine (we did the latter).
Model equations
The model, Mm,n(α), describes the time evolution of the luminescence intensity, I, as a function of time, t, and the model parameters, α,
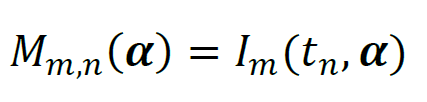
The parameter vector α contains one set of global parameters, which are shared between all experiments, and NS sets of local parameters that apply to one experiment only. The choice of which parameter is global and which is local depends on the experimental conditions. For the experiments that used the same stock solutions and were conducted quasi-simultaneously, it is reasonable to assume that the parameters describing initial reagent concentrations and instrument sensitivity should have equal values across all experiments; these parameters are treated as global. If the parameters that should have equal values across all experiments are not treated as global parameters, then the problem will likely have no unique solution; in this case, precisely identical χ2 values can be achieved with different combinations of model parameters.
The list of parameters corresponding to one experiment:
α1: Unfolding rate of mDHFR
α2: Incapacitation rate
α3: Molar fraction of preprotein with oxidized disulfide at t = T0
α4: Mean translocation time for oxidized mDHFR
α5: RMS deviation of translocation time for oxidized mDHFR
α6: Mean translocation time for reduced mDHFR minus the time delay between mixing components and starting the luminescence measurement
α7: RMS deviation of translocation time for reduced mDHFR
α8: Furimazine substrate depletion rate
α9: Scaling factor for instrument sensitivity
α10: Relative change in luminescence reading after dilution (at TG)
α11: Relative change in luminescence reading after dilution (at TR)
At t = T0, the experiment is set up by mixing proteoliposomes with substrate and ATP. At t = TG, GST-dark is added to the reaction. At t = TR, DTT is added to the reaction.
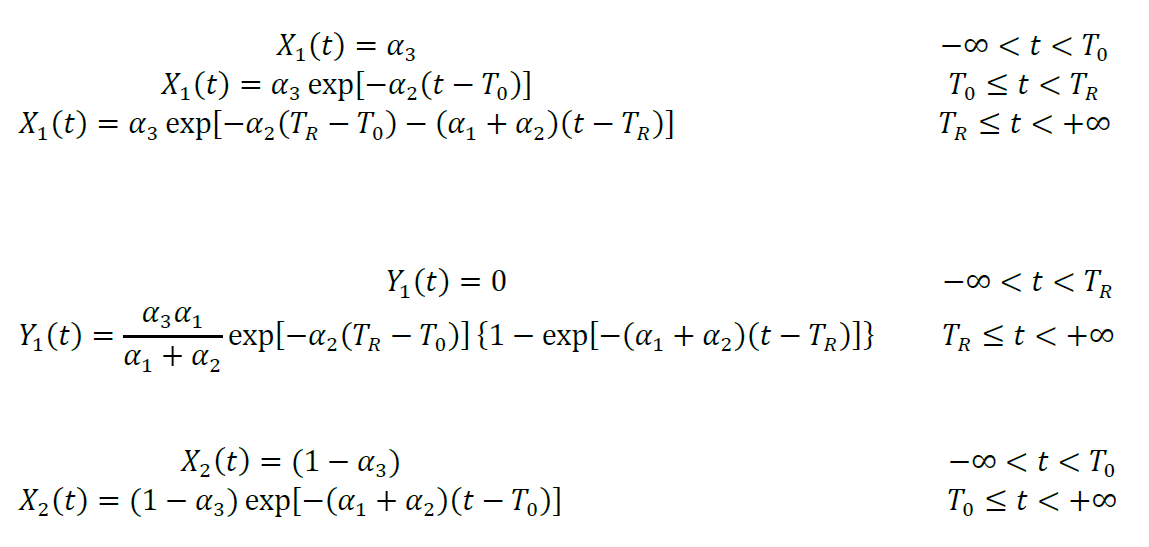
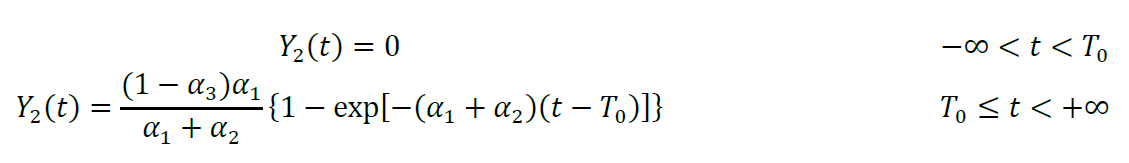
To calculate luminescence intensity, we define the functions X1(t), Y1(t), Z1(t), X2(t), Y2(t), and Z2(t), where the subscripts 1 and 2 refer to substrate proteins that were oxidized and reduced, respectively, at t = T0. Functions X1(t) and X2(t) describe the molar fraction of pOA-DHFR molecules that are waiting for mDHFR to unfold and are still translocation-competent at time t. Functions Y1(t) and Y2(t) describe the molar fraction of pOA-DHFR that has resumed translocation after mDHFR unfolding. Functions X1(t), Y1(t), Z1(t), X2(t), Y2(t), and Z2(t) are different for every experiment m; therefore, these functions should also carry the additional subscript m. The additional subscript is omitted for notation simplicity:
Functions Z1(t) and Z2(t) describe the molar fraction of pOA-DHFR that has completed translocation. They are calculated as convolutions of Y1(t) and Y2(t) with corresponding translocation time distributions Pn(τ), where τ is the translocation time:
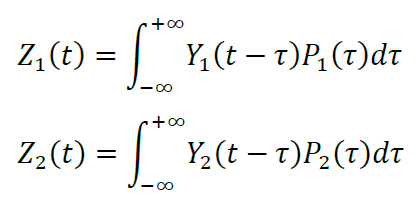
The convolutions have to be calculated numerically using the method of discrete convolution. One can find miscellaneous examples of functions and subroutines for discrete convolution in C and in FORTRAN.
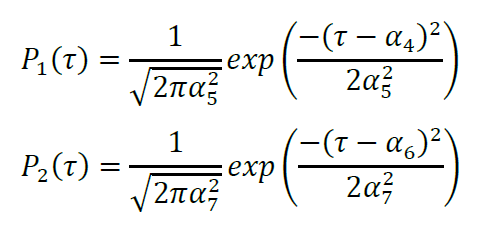
Parameterization using Gaussian distributions for Pn(τ) gives:
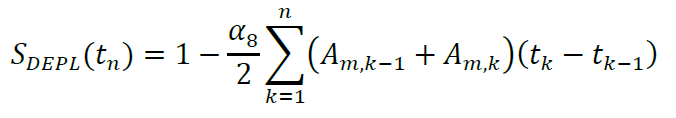
Luminescence intensity is directly proportional to [Z1(t)+Z2(t)]S(t), where S(t) is the concentration of the furimazine substrate at time t divided by the concentration at T0. The depletion of substrate due to enzymatic activity can be described by:
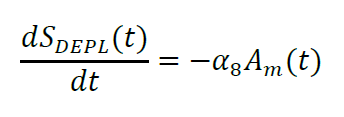
This differential equation is integrated numerically:
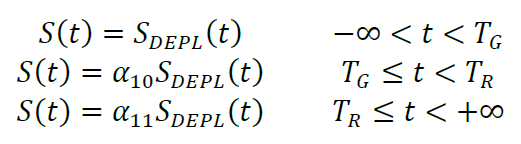
Dilution and change in detection sensitivity between measurements (which could result from small variations in the exact positioning of the plate in the plate reader) are taken into account by α10 and α11. These parameters report the ratio of the luminescence readings after and before the first and second dilution step (at t = TG and t = TR, respectively). The furimazine concentration at each of these time intervals is thus:
The model function, i.e., luminescence intensity I (t,α), is directly proportional to the product of the total concentration of pOA-DHFR that has completed translocation times the furimazine substrate concentration:
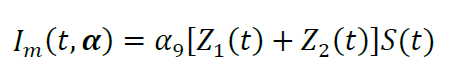
The combination of equations from paragraphs E1 through E9 represents the model function that is globally fit to the experimental data. An example of a fit is shown in Figure 12.
Recipes
Protein purification
Purification of SecA
Buffer A: 50 mM HEPES-KOH pH 7.6, 150 mM KOAc, 10% Glycerol
Buffer B: 50 mM HEPES-KOH pH 7.6, 150 mM KOAC, 10 % Glycerol, 500 mM Imidazole
Purification of SecYEG
Buffer C: 50 mM HEPES-KOH (pH 7.5), 300 mM NaCl, 10% Glycerol
Buffer D: 50 mM HEPES-KOH (pH 7.5), 50 mM NaCl, 10% Glycerol
Buffer E: 50 mM HEPES-KOH (pH 7.5), 50 mM NaCl, 10% Glycerol, 0.02% DDM
Buffer F: 50 mM HEPES-KOH (pH 7.5), 1 M NaCl, 10% Glycerol, 0.02% DDM
Buffer G: 50 mM HEPES-KOH (pH 7.5), 300 mM NaCl, 10% Glycerol, 0.02% DDM, 20 mM Imidazole
Buffer H: 50 mM HEPES-KOH (pH 7.5), 300 mM NaCl, 10% Glycerol, 0.02% DDM, 300 mM Imidazole
Buffer I: 50 mM HEPES-KOH (pH 7.5), 150 mM KOAC, 10 mM Mg(OAc)2, 20% Glycerol, 0.02% DDM
Purification of pOA-mDHFR-p86
Buffer J: 1× PBS pH 7.5
Buffer K: 10 mM Tris-HCl pH 7.0
Buffer L: 8 M Urea, 50 mM Tris-HCl pH 7.0
Buffer M: 8 M Urea, 50 mM Tris-HCl pH 7.0, 500 mM NaCl
Purification of 11S
Buffer J: 1× PBS pH 7.5
Buffer N: 1× PBS pH 7.5, 300 mM imidazole
Purification of GST-dark
Buffer J: 1× PBS, pH 7.5
Buffer N: 1× PBS, pH 7.5, 300 mM imidazole
Preparation of SecYEG/SecA vesicles with encapsulated 11S
Buffer P: 10 mM HEPES pH 7.5, 100 mM NaCl
Preparation of oxidized pOA-mDHFR-p86
10 mM Cu2+/Phenanthroline
Prepare 20 mM 1,10 phenanthroline solution in 20% EtOH.
Prepare 300 mM CuSO4 solution.
Using these stock solutions, prepare a final solution containing 10 mM 1,10 phenathroline and 30 mM Cu2+ in 20% EtOH
Real-time translocation measurement
Buffer Q: 50 mM HEPES pH 8, 500 mM KOAc, 25 mM Mg(OAc)2, 0.5% Prionex
Acknowledgments
This work was supported by the National Institutes of Health (5R21AI133514 and 5R01GM121567 to C.M.K, and Training Grant 5T32GM007231) and the Pew Charitable Trusts (Pew Biomedical Scholars Program grant to C.M.K.). This protocol is derived from a publication in Nature Communications (Gupta et al., 2020).
Competing interests
The authors declare no competing interests.
References
- Bauer, B. W., T. Shemesh, Y. Chen and T. A. Rapoport (2014). A "push and slide" mechanism allows sequence-insensitive translocation of secretory proteins by the SecA ATPase. Cell 157(6): 1416-1429.
- Brundage, L., J. P. Hendrick, E. Schiebel, A. J. Driessen and W. Wickner (1990). The purified E. coli integral membrane protein SecY/E is sufficient for reconstitution of SecA-dependent precursor protein translocation. Cell 62(4): 649-657.
- Cunningham, K., R. Lill, E. Crooke, M. Rice, K. Moore, W. Wickner and D. Oliver (1989). SecA protein, a peripheral protein of the Escherichia coli plasma membrane, is essential for the functional binding and translocation of proOmpA. EMBO J 8(3): 955-959.
- Dixon, A. S., M. K. Schwinn, M. P. Hall, K. Zimmerman, P. Otto, T. H. Lubben, B. L. Butler, B. F. Binkowski, T. Machleidt, T. A. Kirkland, M. G. Wood, C. T. Eggers, L. P. Encell and K. V. Wood (2016). NanoLuc Complementation Reporter Optimized for Accurate Measurement of Protein Interactions in Cells. ACS Chem Biol 11(2): 400-408.
- Erlandson, K. J., E. Or, A. R. Osborne and T. A. Rapoport (2008). Analysis of polypeptide movement in the SecY channel during SecA-mediated protein translocation. J Biol Chem 283(23): 15709-15715.
- Gupta, R., D. Toptygin and C. M. Kaiser (2020). The SecA motor generates mechanical force during protein translocation. Nat Commun 11(1): 3802.
- Hamilton, W. C. (1964). Statistics in Physical Science: Estimation, Hypothesis Testing, and Least Squares. New York, Ronald Press.
- Mao, C., P. Bariya, Y. Suo and L. L. Randall (2020). Comparison of Single and Multiple Turnovers of SecYEG in Escherichia coli. J Bacteriol 202(24).
- Mao, C., C. E. Cheadle, S. J. Hardy, A. A. Lilly, Y. Suo, R. R. Sanganna Gari, G. M. King and L. L. Randall (2013). Stoichiometry of SecYEG in the active translocase of Escherichia coli varies with precursor species. Proc Natl Acad Sci U S A 110(29): 11815-11820.
- Marquardt, D. W. (1963). An algorithm for least-squares estimation of nonlinear parameters. J Soc Indust Appl Math 11(2): 431-441.
- Mossessova, E. and Lima, C. D. (2000). Ulp1-SUMO crystal structure and genetic analysis reveal conserved interactions and a regulatory element essential for cell growth in yeast. Mol Cell 5(5): 865-876.
- Oliver, D. B. and Beckwith, J. (1981). E. coli mutant pleiotropically defective in the export of secreted proteins. Cell 25(3): 765-772.
- Pereira, G. C., Allen, W. J., Watkins, D. W., Buddrus, L., Noone, D., Liu, X., Richardson, A. P., Chacinska, A. and Collinson, I. (2019). A High-Resolution Luminescent Assay for Rapid and Continuous Monitoring of Protein Translocation across Biological Membranes. J Mol Biol 431(8): 1689-1699.
- Sambrook, J. F. and Russel, D. W. (2001). Molecular Cloning: A Laboratory Manual. Cold Spring Harbor Press.
- Schiebel, E., Driessen, A. J., Hartl, F. U. and Wickner, W. (1991). ΔμH+ and ATP function at different steps of the catalytic cycle of preprotein translocase. Cell 64(5): 927-939.
- van der Wolk, J. P., de Wit, J. G. and Driessen, A. J. (1997). The catalytic cycle of the escherichia coli SecA ATPase comprises two distinct preprotein translocation events. EMBO J 16(24): 7297-7304.
Article Information
Copyright
© 2021 The Authors; exclusive licensee Bio-protocol LLC.
How to cite
Gupta, R., Toptygin, D. and Kaiser, C. M. (2021). Synchronized Real-time Measurement of Sec-mediated Protein Translocation. Bio-protocol 11(16): e4129. DOI: 10.21769/BioProtoc.4129.
Category
Biophysics > Force spectroscopy
Biochemistry > Protein > Activity
Molecular Biology > Protein > Intercellular translocation
Do you have any questions about this protocol?
Post your question to gather feedback from the community. We will also invite the authors of this article to respond.