- Protocols

- Articles and Issues
- For Authors
- About
- Become a Reviewer

A Gel-Based Assay for Probing Protein Translocation on dsDNA
Published: Vol 11, Iss 14, Jul 20, 2021 DOI: 10.21769/BioProtoc.4094 Views: 4377
Reviewed by: Emilia KrypotouLaura Molina-García
Original research article
The authors used this protocol in:

Jul 2020
Advertisement


Protocol Collections
Comprehensive collections of detailed, peer-reviewed protocols focusing on specific topics


Abstract
Protein translocation on DNA represents the key biochemical activity of ssDNA translocases (aka helicases) and dsDNA translocases such as chromatin remodelers. Translocation depends on DNA binding but is a distinct process as it typically involves multiple DNA binding states, which are usually dependent on nucleotide binding/hydrolysis and are characterized by different affinities for the DNA. Several translocation assays have been described to distinguish between these two modes of action, simple binding as opposed to directional movement on dsDNA. Perhaps the most widely used is the triplex-forming oligonucleotide displacement assay. Traditionally, this assay relies on the formation of a DNA triplex from a dsDNA segment and a short radioactively labeled oligonucleotide. Upon translocation of the protein of interest along the DNA substrate, the third DNA strand is destabilized and eventually released off the DNA duplex. This process can be visualized and quantitated by polyacrylamide electrophoresis. Here, we present an effective, sensitive, and convenient variation of this assay that utilizes a fluorescently labeled oligonucleotide, eliminating the need to radioactively label DNA. In short, our protocol provides a safe and user-friendly alternative.
Graphical abstract:
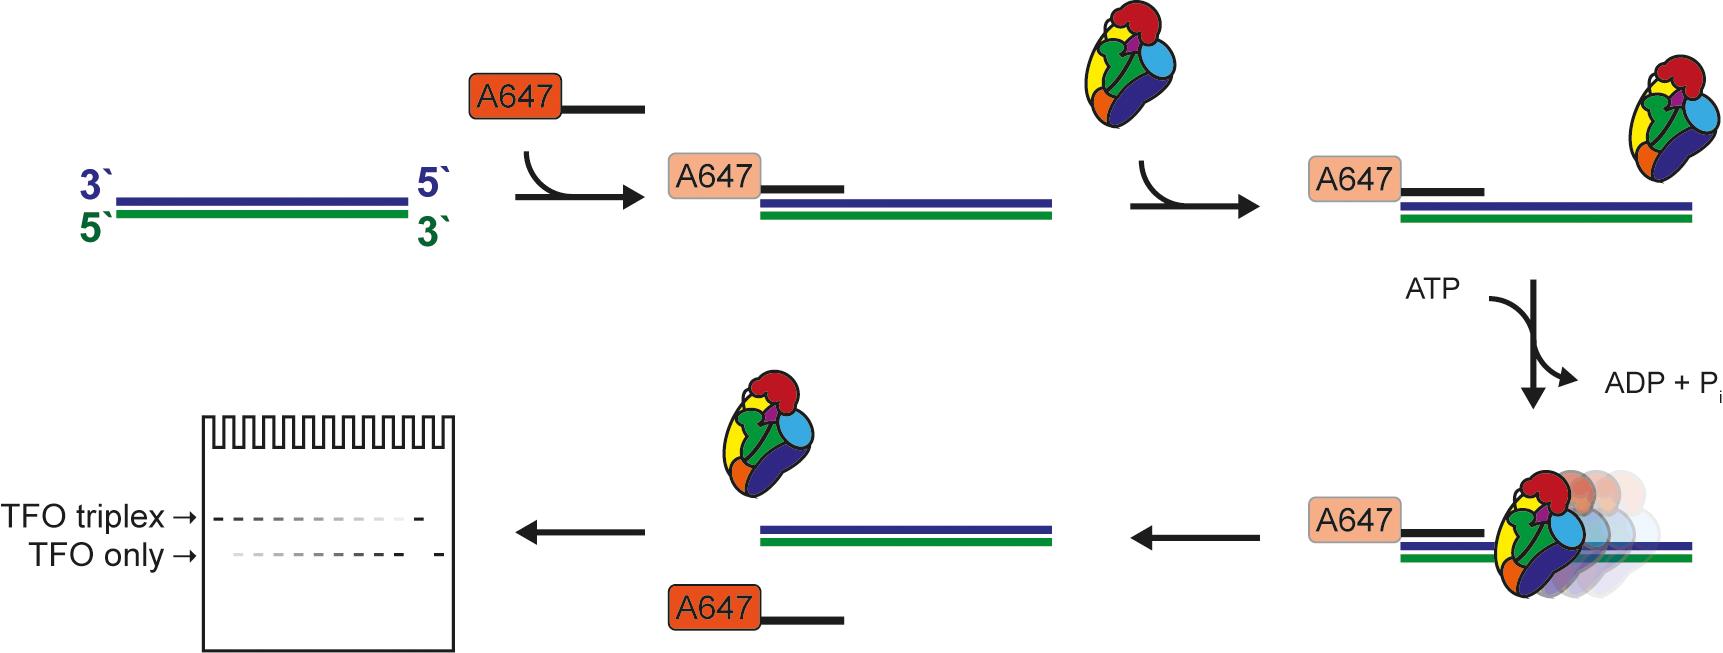
Figure 1. Schematic of the triplex-forming oligonucleotide displacement assay.
Background
DNA translocases and DNA helicases are structurally related and typically contain an ATP-binding core composed of two RecA-type lobes (Singleton et al., 2007) connected to accessory and family-specific domains that modulate the activity of the motor. While DNA helicases have the ability to processively move along single-stranded DNA or RNA, thereby unwinding the two strands, dsDNA translocases cannot, as these move on dsDNA instead with varied processivities. Altogether, ss/ds-DNA tracking ATPases are clustered into superfamilies (SF1-SF6) depending on their translocation mechanism, domain organization, and oligomerization state (Brosh and Matson 2020). Translocation requires multiple steps – at least two – first binding of the protein to the nucleic acid (loading) and second, sliding along it. The role of nucleotide in these processes is very much family-specific and does not always require ATP hydrolysis (Fairman-Williams et al., 2010). Therefore, translocases can have varied processivities and can operate using an active, inchworming mechanism or as Brownian motors (Briggs and Fischer 2014). Crystal structures of translocases mostly belonging to SF1 and SF2 (Subramanya et al., 1996; Korolev et al., 1997; Velankar et al., 1999; Tomko et al., 2007; Gu and Rice 2010), and, more recently, electron microscopy studies of chromatin remodelers (Yan et al., 2019; Han et al., 2020; Wagner et al., 2020), have contributed insightful mechanistic details. However, one must bear in mind that these provide still images of isolated steps in the catalytic cycle and rarely the complete trajectory of states underlying translocation.
Unlike assays for helicase activity, assays to monitor translocation on dsDNA are more challenging for the simple fact that no easily quantifiable product is formed. Some dsDNA translocases, such as select chromatin remodelers, have been tested in “cruciform extrusion” assays quantifying changes in superhelicity, which can be correlated with translocation (Havas et al., 2000). However, the most popular assay for dsDNA translocation remains, by far, the triplex-forming oligonucleotide (TFO) displacement assay (Firman and Szczelkun 2000).
As a general principle, a DNA triplex is formed by annealing a short TFO to a dsDNA substrate with a TFO binding site (TBS), and the structure is held together via Hoogsteen base-pairing (Gowers and Fox 1999). Triplex formation requires a low pH environment. Once the triplex is formed, it is no longer pH dependent, and the assay can be performed at neutral pH (Kopel et al., 1996) if Mg2+ is present (Singleton and Dervan 1993). The substrate can differ in length, depending on the protein to be tested and its processivity (if known), and the TFO is either labeled with 32P or a fluorophore. The translocase will bind preferentially or exclusively to the double-stranded portion of the substrate, move along the DNA, and eventually dislodge the weakly bound TFO, which can then be detected. There are caveats to be considered when labeling the TFO either radioactively or fluorescently. In the former case, safety precautions regarding work with, storage, and disposal of radioactive materials have to be considered. On the other hand, fluorophores can interact non-specifically with proteins. Radioactivity-based assays are end-point and discontinuous based on detection of bound and free TFO on agarose or polyacrylamide gels (Firman and Szczelkun 2000; Smith et al., 2007). In contrast, the use of a fluorescently-labeled TFO can be coupled with either a gel-based end-point or continuous monitoring assays. The continuous assay exploits the attribute of fluorophores to change the intensity of the fluorescent signal when bound by the DNA duplex. In short, the signal will be “brighter” for the free TFO and “dimmer” when the TFO is incorporated within the triplex (McClelland et al., 2005). Although using a continuous assay has the advantage of monitoring translocation at every step, it requires access to a stop-flow fluorimeter.
In our assay, we combined elements of both approaches, e.g., the use of a fluorescently-labeled TFO and the ease of quantitation based on electrophoresis through standard commercially available gels. This makes this assay accessible for the majority of biochemical labs.
Special Considerations When Designing a TFO Displacement Assay
The key requirement for designing a successful TFO displacement assay is the sequence of the TFO – a single mismatch between TFO and dsDNA substrate can be destabilizing (Puri et al., 2004). Often, the following TFO sequence is used: TTTCTTTCTTCTTTCTTTTCTT. Next, the assembly of the triplex DNA has to be performed under low pH conditions (Maher et al., 1990; Plum et al., 1990). During the displacement assay, the pH can be raised to neutral as long as Mg2+ is present in the reaction buffer (Singleton and Dervan 1993). Depending on the protein of interest, the length of the dsDNA substrate can differ between short (in the range of 50 bp) and long (in the kb range). If the studied protein recognizes a specific DNA motif, it can be integrated into the substrate. Protein concentration is important, and 100-500 nM is a good starting point, but high protein concentrations can interfere with translocation. The assay can be performed at a range of temperatures, but temperatures above 40°C lead to significant spontaneous dissociation of the DNA triplex, and the timeframe of the experiment has to be adjusted. In case of contaminating DNAses, an unlabeled single-stranded oligonucleotide can be added to act as a nuclease trap as long as this has negligible affinity for the DNA translocase of interest
Materials and Reagents
Eppendorf tubes (Denville Scientific, catalog number: C2170; store at RT)
Opaque tubes (Argos Technologies, catalog number: T7456-001; store at RT)
PCR tubes (Corning Thermowell Gold PCR 0.2 ml, 1×8 strips, catalog number: 3741; store at RT)
Protein of interest
Tris Base (Fisher Bioreagents, catalog number: BP152-1; store at RT)
MES (2-(N-Morpholino)ethanesulphonic acid monohydrate) (Alfa Aesar, catalog number: A16104-22; store at RT)
MOPS (3-(N-Morpholino)propanesulfonic acid) (Sigma Aldrich, catalog number: M3183-500g; store at RT)
HCl (Hydrochloric acid) (Fisher Chemical, catalog number: A144-500; store at RT)
Acetic acid (Fisher Chemical, catalog number: A38-212; store at RT)
NaCl (Fisher Scientific, catalog number: S271-500; store at RT)
MgCl2·6H2O (Fisher Scientific, catalog number: M33-500; store at RT)
Glucose (Sigma Aldrich, catalog number: G8270-1kg; store at RT)
SDS (Fisher BioReagents, catalogue number: BP8200500; store at RT)
EDTA (Ethylenediaminetetraacetic acid) (Sigma Aldrich, catalog number: EDS-500g; store at RT)
DTT (Dithiothreitol) (Gold Biotechnology, catalog number: DTT50; store at -20°C)
Beta-mercaptoethanol (Arcos Organics, catalog number: AC125472500; store at RT)
NuPAGE 3-8%Tris Acetate Protein Gels, 1-0 mm, 12 well (Thermo Fisher Scientific, catalog number: EA03752BOX; store at 4°C)
Alexa-647 labeled TFO oligonucleotide (Invitrogen; store at -20°C in opaque tubes, avoid repeated thaw-freeze cycles, TTTCTTTCTTCTTTCTTTTCTT)
Single-stranded DNA substrate with TFO binding site (TBS) (Invitrogen; store at -80°C, top and bottom strand)
Short single-stranded DNA oligonucleotide (Invitrogen; store at -20°C)
ATP (Roche Applied Science, catalog number: 10519987001; store at -80°C)
Running buffer (see Recipes)
GSM buffer (see Recipes)
Reaction buffer (see Recipes)
Dialysis buffer (see Recipes)
Triplex formation buffer (see Recipes)
Annealing buffer (see Recipes)
1× TE buffer (see Recipes)
Equipment
Power Source (BioRad, model: Powerpac HC 1645052)
Novex Bolt Mini Gel Tank (Invitrogen, model: A25977)
Heat block (American Scientific Products, model: H2025-1)
PCR machine (Eppendorf, model: Mastercycler EP Gradient Model 5341)
ChemiDoc MP (BioRad, model: 12003154)
Software
Image Lab (BioRad, https://www.bio-rad.com/en-us/product/image-lab-software?ID=KRE6P5E8Z) or equivalent software like ImageJ (https://imagej.nih.gov/ij/)
Microsoft Excel (Microsoft, https://www.microsoft.com/en-us/microsoft-365/excel)
GraphPad Prism 7 (GraphPad, https://www.graphpad.com/scientific-software/prism/)
Procedure
DNA triplex preparation and protein dialysis (2-1 d before experiment)
Generating dsDNA (2 d before experiment)
Depending on the length of the DNA fragment, either order oligonucleotides or generate the fragments by restriction enzyme digest or PCR amplification.
To anneal oligonucleotides for duplex formation, mix top and bottom strand oligonucleotides with annealing buffer at a 1 μM final concentration of each oligonucleotide. Incubate in a heat block at 90°C for 10 min and let cool slowly to room temperature by turning off the hot block.
Triplex DNA formation (1 d before experiment)
Resuspend Alexa-647 labeled oligonucleotide in 1× TE to 100 μM and aliquot in opaque tubes. Dilute to 1 μM with Triplex formation buffer immediately before triplex formation.
Prepare reactions for DNA triplex in opaque tubes in a 1.2:1 molar ratio of dsDNA to TFO. Prepare a free TFO mix in the same volume.
Incubate for 15 min at 57°C and cool down to 4°C o/n by transferring the tubes in the heat block to the cold room or fridge. The DNA triplex and free oligonucleotide can be aliquoted and stored at -20°C but avoid repeated thaw-freeze cycles.
Protein dialysis (1 d before experiment)
Dialyze proteins for at least 4 h or preferably overnight. If the protein of interest is sensitive to salt concentrations, these can be adjusted during dialysis and diluted to 100 mM NaCl immediately before the assay is started to avoid precipitation or excessive aggregation. In the example gel below, a hyperactive mutant of Mfd (Mfd D7AAA) is used. Mfd is an E. coli transcription repair coupling factor (TRCF) that is essential for the repair of DNA damage on transcribed DNA strands. The ability to translocate along the DNA is common to all TRCFs – and thus to Mfd (Adebali et al., 2017; Deaconescu and Suhanovsky 2017).
DNA translocation assay (day of experiment)
Prepare the reaction mix (day of experiment)
Thaw reagents (DNA triplex, free TFO, single-stranded DNA, DTT, and ATP) and prepare reaction buffer.
Measure concentration of dialyzed protein and prepare reactions with DNA triplex (or free TFO) at 10 nM and single-stranded DNA oligonucleotide at 50 nM (Figure 2); do not add ATP at this step. The protein concentration can be adjusted as needed. Add dialysis buffer instead of protein solution to control samples to ensure consistent salt concentrations.
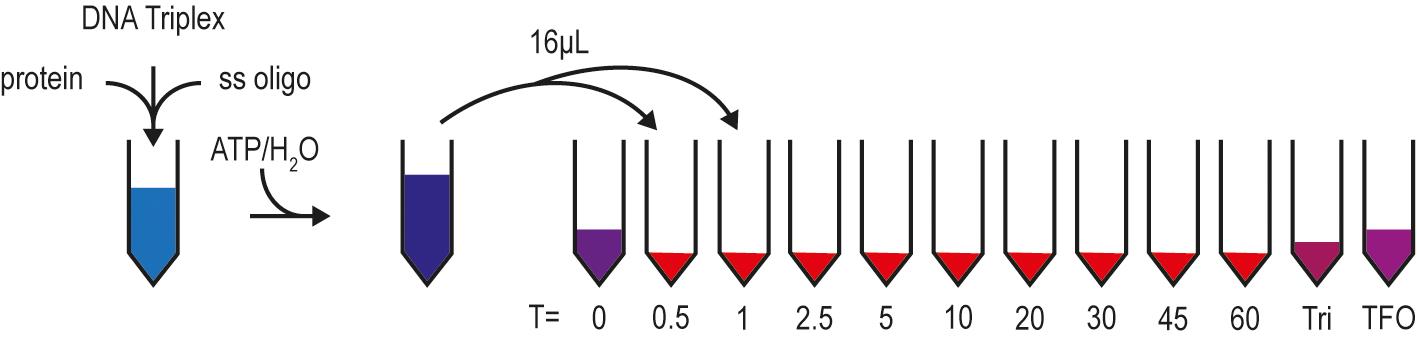
Figure 2. Pipetting scheme for the DNA TFO displacement assay. The reaction is prepared without ATP/H2O. While the mixture pre-incubates, tubes with GSM buffer and controls (DNA Triplex and TFO) are prepared for each timepoint. ATP/H2O is added to initiate the reaction, and samples are withdrawn at the indicated timepoints and stopped with GSM buffer.
DNA translocation assay (day of experiment)
Prepare a tube for each timepoint with 4 μl GSM buffer. Include a DNA triplex and a free TFO control.
Pre-run 3-8% Tris-Acetate gels with icepacks for 90 min at 75 V in the cold room.
Transfer tubes to PCR machine and set to preferred temperature. After 5 min of pre-incubation, add 5 mM ATP (or H2O) to reaction.
Take 16 μl of the reaction at every timepoint and mix with GSM buffer in the prepared tubes. At the last timepoint, add 4 μl GSM buffer to the DNA triplex control.
Load 15 μl of each reaction on the pre-run gel (be careful when loading the samples as they do not contain dye) and run for an additional 150 min at 75 V. Make sure that light exposure is kept at a minimum (wrap gel tank in aluminum foil or run gel in a dark room).The running time can be adjusted, but keeping the running buffer cool is essential to avoid melting of the triplex due to excessive heat. For very different template sizes, adjust the percentage of the gel acrylamide.
Transfer the gel cassettes to a tray full of water to prevent ripping gels during removal from the cassettes. Image them using settings for your fluorophore of choice, in this case, Alexa-647 (BioRad ChemiDoc MP, Alexa647, 10 s exposure). If multiple gels are being imaged, keep the exposure time constant rather than relying on autoexposure (Figures 3B and 3C).
Data analysis
Quantification of DNA triplex
Open image files in Image Lab and assign lanes using the Lane and Bands tool from the Analysis Tool Box [see labels (1) and (2) in Figure 3A]. Manually pick bands and adjust peak borders under “Lane Profile” [see label (3) in Figure 3A]. Copy the data to an Excel file.Band intensities can be measured with a vast array of software; ImageJ is a commonly used and freely available software.
Remove all bands except one and expand the borders so that they cover the whole lane. This measures the total amount of DNA loaded and acts as a loading control. Copy the data to the same Excel file.
Calculate the percentage of Triplex remaining at each timepoint relative to t = 0 and normalize with the loading control. Alternatively, the accumulation of free TFO can be directly quantified.
Once all gels are analyzed, copy the data to GraphPad Prism and plot the signal corresponding to the triplex remaining vs. time (Figure 3D).
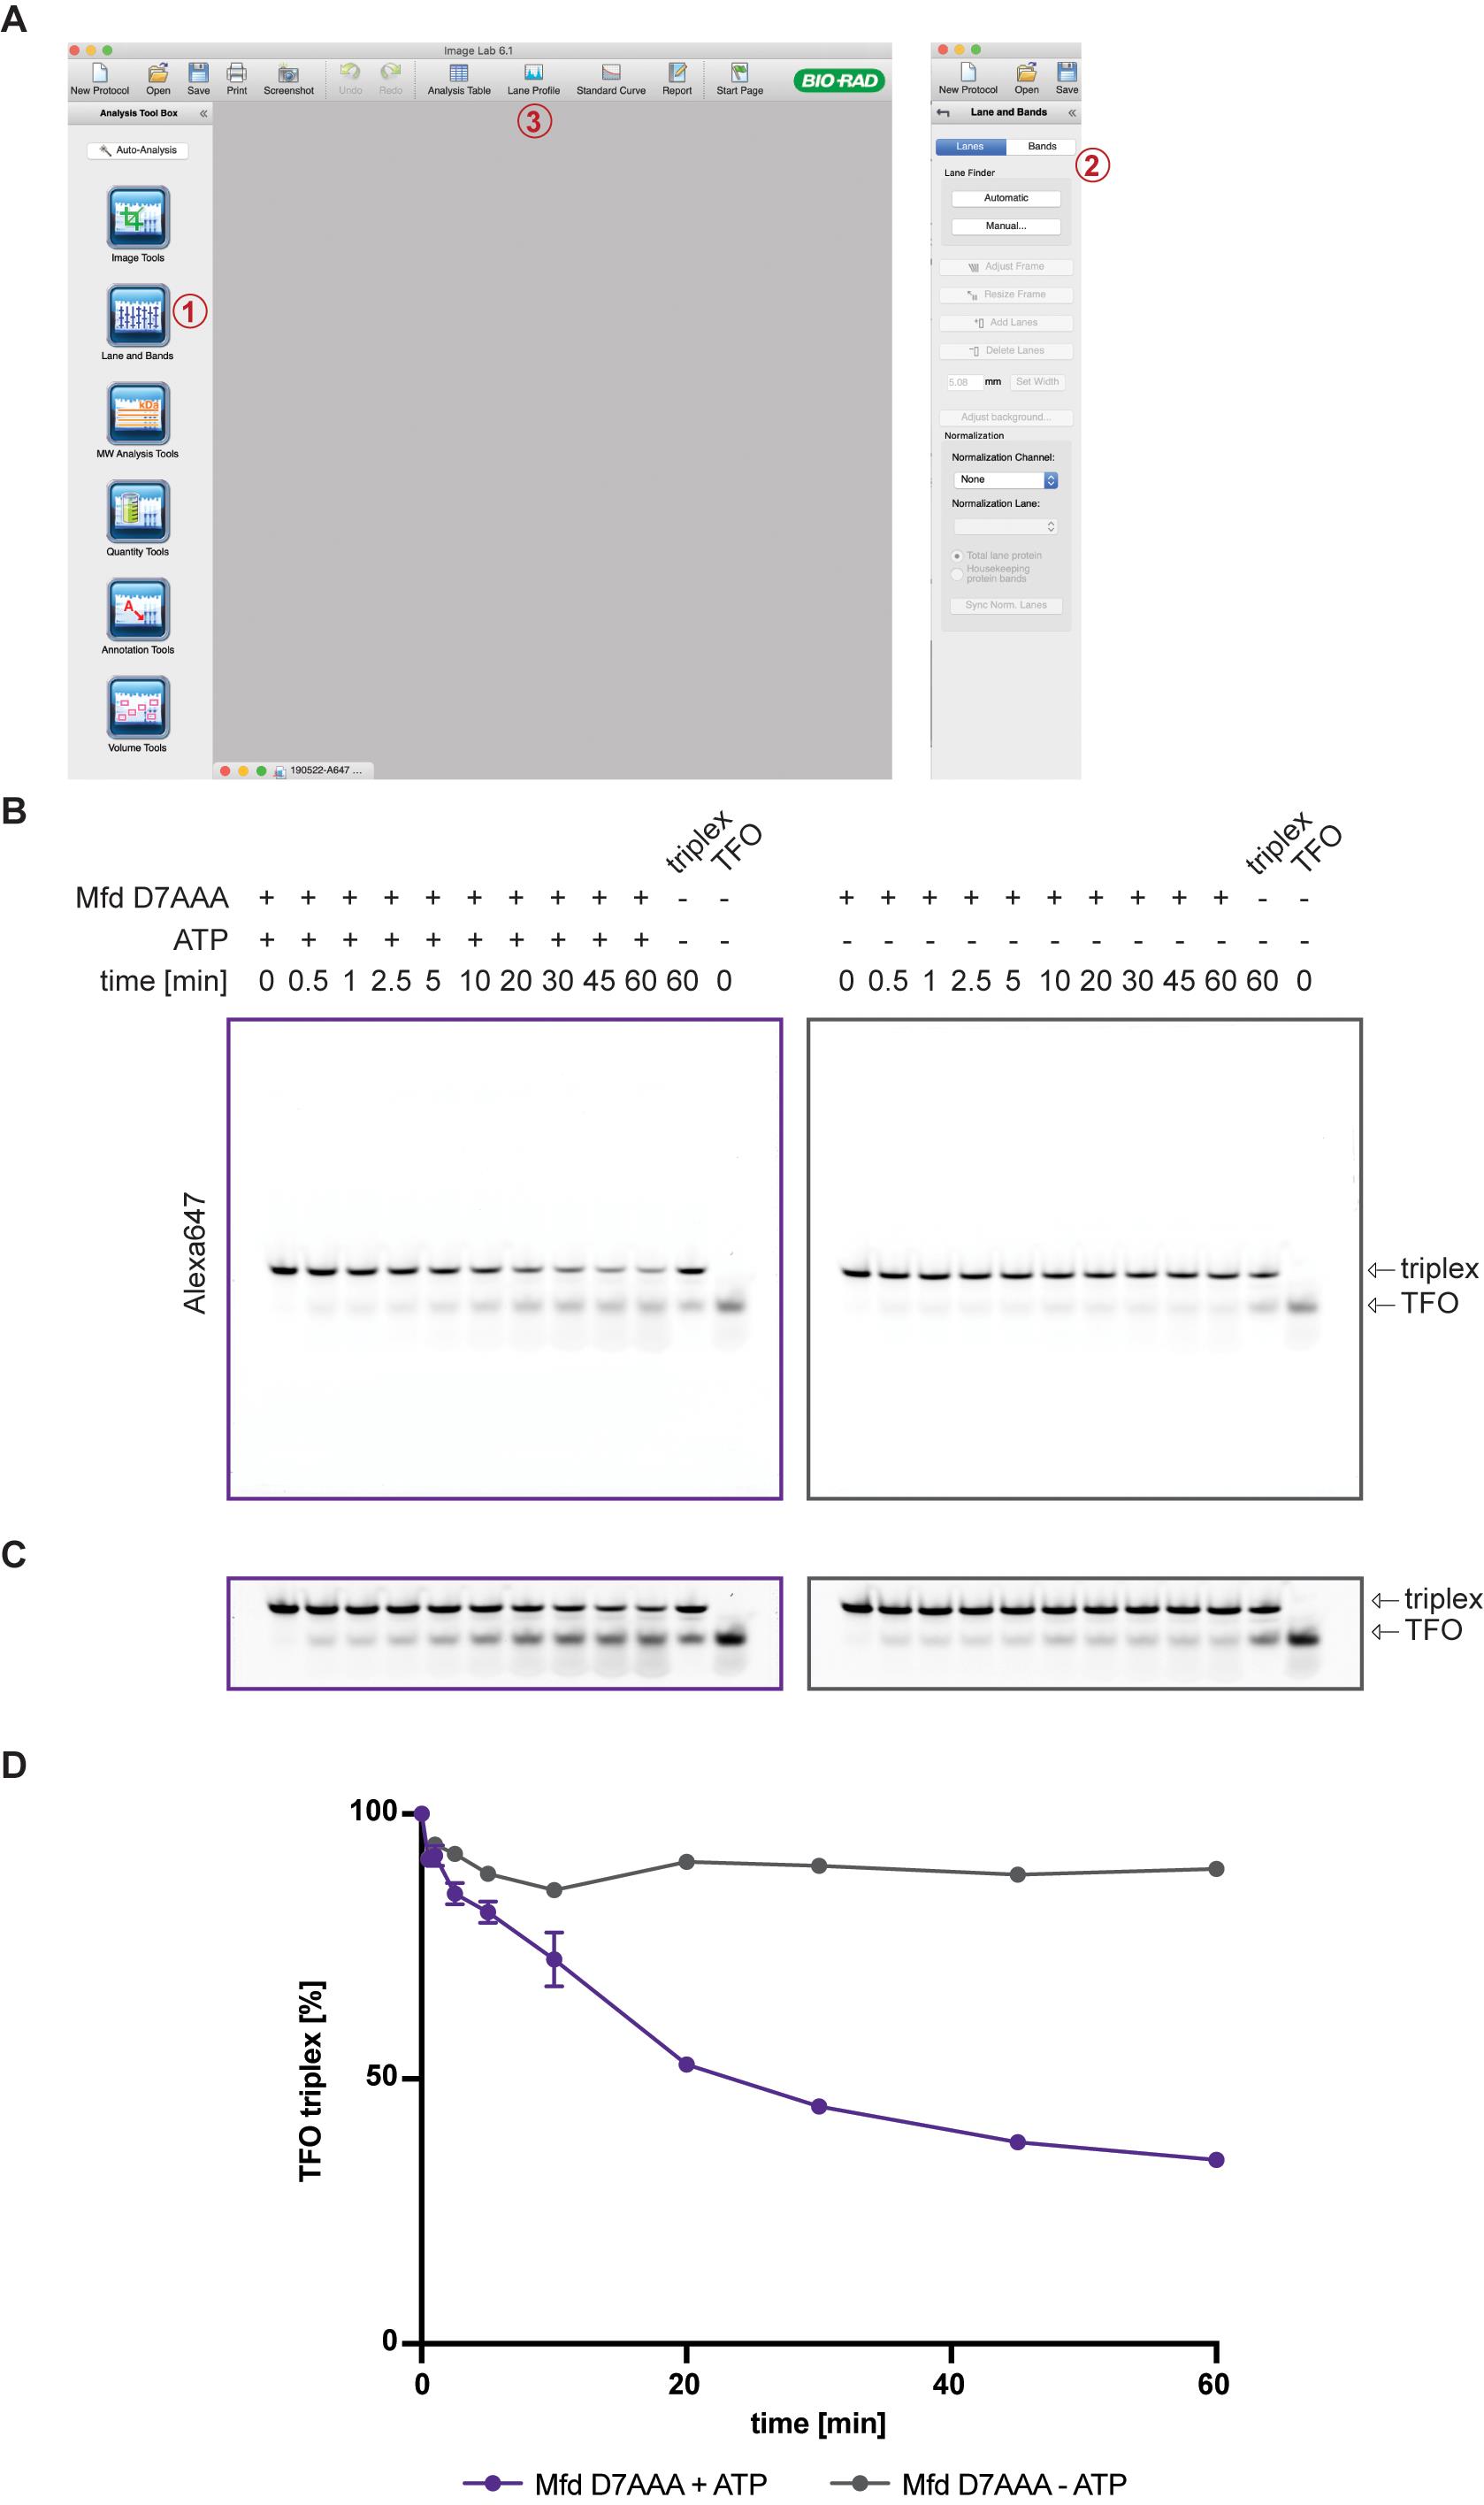
Figure 3. Quantification of DNA triplex. (A) ImageLab software with lane-picking (1 and 2) and lane profile (3) highlighted. (B) Raw images after scanning are used to quantify the DNA triplex. (C) Gels are enhanced by increasing the contrast for better visualization of free TFO. (D) Normalized percentages of TFO triplex are plotted vs. time using GraphPad Prism 7.
Notes
The single-stranded DNA oligonucleotide is added to act as a DNAse trap; Mfd has a much lower affinity for ssDNA than for dsDNA.
The position of the TFO binding site can be varied, depending on the protein to be tested.
Timepoints can be varied depending on the protein to be tested.
The protein concentration can be adjusted; 100-500 nM is a good starting point. High protein concentrations can be a limiting factor as multiple molecules can potentially be loaded onto the DNA and inhibit translocation.
The assay can be performed at a variety of temperatures, but if the temperature is raised, the triplex can dissociate over time, creating a significant amount of background and possibly inhibiting the protein if this has high affinity for ssDNA.
Gels are run in the cold room with ice packs at low voltage to prevent excess heat, which could lead to triplex dissociation.
Because no loading dye is used, samples have to be loaded carefully. The absence of loading dye and low voltage makes it difficult to see if the gels are running properly. Loading dyes were omitted because they can emit a strong fluorescent signal depending on the dye used and can hinder the visualization of the DNA bands. E.g., Coomassie-based dyes fluoresce strongly at 465 nm or 595 nm when bound to protein. Because glucose is present in the stop buffer, samples will sink into the gel pockets.
Overall, the assay is very reproducible and easy to perform.
Recipes
Running buffer
40 mM Tris-Acetate, pH 5.5
5 mM NaAc
1 mM MgCl2GSM buffer
15% (w/v) glucose
3% (w/v) SDS
250 mM MOPSReaction buffer
50 mM Tris-HCl, pH 8
10 mM MgCl2
1 mM DTTDialysis buffer
10 mM Tris-HCl, pH 8
100 mM NaCl
10 mM MgCl2
2 mM BMeTriplex formation buffer
10 mM MES, pH 5.5
12.5 mM MgCl2Annealing buffer
10 mM Tris-HCl, pH 8
50 mM NaCl
1 mM EDTA, pH 81× TE buffer
10 mM Tris-HCl, pH 8
1 mM EDTA, pH 8
Acknowledgments
Work in the Deaconescu laboratory is supported by grants from the National Institute of Health GM121975 attributed to AD. The protocol described here has been derived from the work of Brugger et al. (2020).
Competing interests
The authors declare no conflict of interest.
References
- Adebali, O., Sancar, A. and Selby, C. P. (2017). Mfd translocase is necessary and sufficient for transcription-coupled repair in Escherichia coli. J Biol Chem 292(45): 18386-18391.
- Briggs, K. and Fischer, C. J. (2014). All motors have to decide is what to do with the DNA that is given them. Biomol Concepts 5(5): 383-395.
- Brosh, R. M., Jr. and Matson, S. W. (2020). History of DNA Helicases. Genes (Basel) 11(3).
- Brugger, C., Zhang, C., Suhanovsky, M. M., Kim, D. D., Sinclair, A. N., Lyumkis, D. and Deaconescu, A. M. (2020). Molecular determinants for dsDNA translocation by the transcription-repair coupling and evolvability factor Mfd. Nat Commun 11(1): 3740.
- Deaconescu, A. M. and Suhanovsky, M. M. (2017). From Mfd to TRCF and Back Again-A Perspective on Bacterial Transcription-coupled Nucleotide Excision Repair. Photochem Photobiol 93(1): 268-279.
- Fairman-Williams, M. E., Guenther, U. P. and Jankowsky, E. (2010). SF1 and SF2 helicases: family matters. Curr Opin Struct Biol 20(3): 313-324.
- Firman, K. and Szczelkun, M. D. (2000). Measuring motion on DNA by the type I restriction endonuclease EcoR124I using triplex displacement. EMBO J 19(9): 2094-2102.
- Gowers, D. M. and Fox, K. R. (1999). Towards mixed sequence recognition by triple helix formation. Nucleic Acids Res 27(7): 1569-1577.
- Gu, M. and Rice, C. M. (2010). Three conformational snapshots of the hepatitis C virus NS3 helicase reveal a ratchet translocation mechanism. Proc Natl Acad Sci U S A 107(2): 521-528.
- Han, Y., Reyes, A. A., Malik, S. and He, Y. (2020). Cryo-EM structure of SWI/SNF complex bound to a nucleosome. Nature 579(7799): 452-455.
- Havas, K., Flaus, A., Phelan, M., Kingston, R., Wade, P. A., Lilley, D. M. and Owen-Hughes, T. (2000). Generation of superhelical torsion by ATP-dependent chromatin remodeling activities. Cell 103(7): 1133-1142.
- Kopel, V., Pozner, A., Baran, N. and Manor, H. (1996). Unwinding of the third strand of a DNA triple helix, a novel activity of the SV40 large T-antigen helicase. Nucleic Acids Res 24(2): 330-335.
- Korolev, S., Hsieh, J., Gauss, G. H., Lohman, T. M. and Waksman, G. (1997). Major domain swiveling revealed by the crystal structures of complexes of E. coli Rep helicase bound to single-stranded DNA and ADP. Cell 90(4): 635-647.
- Maher, L. J., 3rd, Dervan, P. B. and Wold, B. J. (1990). Kinetic analysis of oligonucleotidedeoxyribonucleotide-directed triple-helix formation on DNA. Biochemistry 29(37): 8820-8826.
- McClelland, S. E., Dryden, D. T. and Szczelkun, M. D. (2005). Continuous assays for DNA translocation using fluorescent triplex dissociation: application to type I restriction endonucleases. J Mol Biol 348(4): 895-915.
- Plum, G. E., Park, Y. W., Singleton, S. F., Dervan, P. B. and Breslauer, K. J. (1990). Thermodynamic characterization of the stability and the melting behavior of a DNA triplex: a spectroscopic and calorimetric study. Proc Natl Acad Sci U S A 87(23): 9436-9440.
- Puri, N., Majumdar, A., Cuenoud, B., Miller, P. S. and Seidman, M. M. (2004). Importance of clustered 2'-O-(2-aminoethyl) residues for the gene targeting activity of triple helix-forming oligonucleotidenucleotides. Biochemistry 43(5): 1343-1351.
- Singleton, M. R., Dillingham, M. S. and Wigley, D. B. (2007). Structure and mechanism of helicases and nucleic acid translocases. Annu Rev Biochem 76: 23-50.
- Singleton, S. F. and Dervan, P. B. (1993). Equilibrium association constants for oligonucleotidenucleotide-directed triple helix formation at single DNA sites: linkage to cation valence and concentration. Biochemistry 32(48): 13171-13179.
- Smith, A. J., Szczelkun, M. D. and Savery, N. J. (2007). Controlling the motor activity of a transcription-repair coupling factor: autoinhibition and the role of RNA polymerase. Nucleic Acids Res 35(6): 1802-1811.
- Subramanya, H. S., Bird, L. E., Brannigan, J. A. and Wigley, D. B. (1996). Crystal structure of a DExx box DNA helicase. Nature 384(6607): 379-383.
- Tomko, E. J., Fischer, C. J., Niedziela-Majka, A. and Lohman, T. M. (2007). A nonuniform stepping mechanism for E. coli UvrD monomer translocation along single-stranded DNA. Mol Cell 26(3): 335-347.
- Velankar, S. S., Soultanas, P., Dillingham, M. S., Subramanya, H. S. and Wigley, D. B. (1999). Crystal structures of complexes of PcrA DNA helicase with a DNA substrate indicate an inchworm mechanism. Cell 97(1): 75-84.
- Wagner, F. R., Dienemann, C., Wang, H., Stutzer, A., Tegunov, D., Urlaub, H. and Cramer, P. (2020). Structure of SWI/SNF chromatin remodeller RSC bound to a nucleosome. Nature 579(7799): 448-451.
- Yan, L., Wu, H., Li, X., Gao, N. and Chen, Z. (2019). Structures of the ISWI-nucleosome complex reveal a conserved mechanism of chromatin remodeling. Nat Struct Mol Biol 26(4): 258-266.
Article Information
Copyright
© 2021 The Authors; exclusive licensee Bio-protocol LLC.
How to cite
Brugger, C. and Deaconescu, A. M. (2021). A Gel-Based Assay for Probing Protein Translocation on dsDNA. Bio-protocol 11(14): e4094. DOI: 10.21769/BioProtoc.4094.
Category
Biochemistry > Protein > Interaction > Protein-DNA interaction
Molecular Biology > DNA > DNA-protein interaction
Do you have any questions about this protocol?
Post your question to gather feedback from the community. We will also invite the authors of this article to respond.