- Protocols

- Articles and Issues
- For Authors
- About
- Become a Reviewer

Surface Engineering and Multimodal Imaging of Multistage Delivery Vectors in Metastatic Breast Cancer
Published: Vol 11, Iss 10, May 20, 2021 DOI: 10.21769/BioProtoc.4030 Views: 6241
Reviewed by: Raghuveer KavarthapuHaotong LiAnonymous reviewer(s)
Original research article
The authors used this protocol in:

Jun 2020
Advertisement


Protocol Collections
Comprehensive collections of detailed, peer-reviewed protocols focusing on specific topics


Abstract
The design of effective nanoformulations that target metastatic breast cancers is challenging due to a lack of competent imaging and image analysis protocols that can capture the interactions between the injected nanoparticles and metastatic lesions. Here, we describe the integration of in vivo whole-body PET-CT with high temporal resolution, ex vivo whole-organ optical imaging and high spatial resolution confocal microscopy to deconstruct the trafficking of injectable nanoparticle generators encapsulated with polymeric doxorubicin (iNPG-pDox) in pulmonary metastases of triple-negative breast cancer. We describe the details of image acquisition and analysis in a step-wise manner along with the development of a mouse model for metastatic breast cancer. The methods described herein can be easily adapted to any nanoparticle or disease model, allowing a standardized pipeline for in vivo preclinical studies that focus on delineating nanoparticle kinetics and interactions within metastases.
Keywords: In vivo imagingBackground
Metastatic cancer accounts for >90% of mortality in cancer patients; yet, effective therapeutic strategies are missing due to the small size, heterogeneity, and dispersed nature of metastatic cancers (Bianchini et al., 2016; Elia et al., 2019). A series of biological barriers hinder the accumulation, and hence, the efficacy of conventional small molecule drugs and nanoparticle-based delivery systems in metastatic cancers (Blanco et al., 2015). Our group has previously demonstrated the sequential and successful negotiation of most, if not all, biological barriers using iNPG-pDox composed of porous silicon microparticle-based injectable nanoparticle generators (iNPG) packaged with poly(lactic-co-glycolic acid) polymer-doxorubicin (pDox) conjugates (Xu et al., 2016). pDox molecules self-assemble into nanoparticles after their release from iNPGs, and iNPG-pDox treatment significantly inhibited tumor metastasis, including a functional cure in 40-50% of mice with pulmonary metastatic breast cancer (Xu et al., 2016). Visualization of the spatiotemporal kinetics of such nanomedicines that effectively target metastases can allow the directed development and rational improvement of other advanced therapies in the future (Goel, 2017).
Despite significant progress in the development of drug delivery systems, limited studies have evaluated the distribution and interactions of such systems in in vivo metastatic settings. Molecular imaging modalities can uncover a wealth of information across multiple length- and time-scales in disease settings; however, the application of rationally combined multiscale imaging methods to assess the biodistribution of complex drug delivery systems in metastatic tumors remains to be performed (Goel, 2017). Such knowledge, in conjunction with mathematical modeling approaches, can predict and evaluate therapeutic responses and efficacies of complex drug delivery systems, eventually being employed to guide the reverse engineering of advanced therapies (Michor, 2011). In this protocol, we provide a detailed guide to designing and implementing a multiscale and multimodal imaging toolkit for the systematic deconstruction of the trafficking and interactions of nanotherapeutics in a metastatic model of breast cancer, as described in our earlier work (Goel et al., 2020).
We first designed a modular orthogonal surface engineering approach for the modification of iNPG-pDox to render them amenable to multimodal imaging (both nuclear and fluorescence imaging) and microscopy without affecting their intrinsic biophysical properties. Such an approach is independent of carrier type, cargo, formulation method, or delivery route, and can be adopted for any nano- or bioengineered platform and implemented in any disease model. Next, we designed and implemented a systematic imaging toolkit composed of: (1) positron emission tomography/computed tomography (PET/CT) for longitudinal in vivo whole-body imaging at a high spatiotemporal resolution; (2) multispectral optical imaging (OI) for ex vivo whole-organ imaging of metastatic lungs; and (3) multispectral confocal microscopy for intra-tissue imaging of iNPG-pDox distribution in metastatic lungs with high spatial resolution (Goel et al., 2020). This protocol includes methods for each of the approaches described above.
Materials and Reagents
T-75 cell culture flasks
Serological pipettes (Thermo Fisher Scientific, catalog numbers: 13-676-10F and 13-676-10M)
FalconTM conical centrifuge tubes (Thermo Fisher Scientific, catalog number: 14-959-53A)
1 cc Exel insulin syringes (28 G, 1 ml, Fisher, catalog number: 14-841-31)
BD 1 ml insulin syringe with slip tip (Fisher, catalog number: 22-253-260)
Sterile filter pipette tips
EppendorfTM tubes (various sizes)
Coverslips
31 G disposable insulin syringes (BD, catalog number: 324921)
ParafilmTM M PM996 all-purpose laboratory film
MilliporeSigmaTM silica gel 60G TLC plates, glass-backed (MilliporeSigma, Catalog number: 1.00384.0001)
26 G × ¾” mouse and rat tail vein Monoject IV catheter (Patterson Veterinary, catalog number: 07-836-8403)
BalB/c mice: Female, 4-6 weeks old (Invigo or The Jackson Laboratory) or another strain suitable for the selected cancer cell line
Murine triple-negative breast cancer cell line expressing luciferase: 4T1-GFP-Luc (ATCC) or another cancer cell line
Discoidal porous silicon particles (iNPG) and pDox nanoparticles (prepared in-house) or another amine-modified nanoparticle of choice (Xu et al., 2016)
2-S-(4-isothiocyanatobenzyl)-1,4,7-triazacyclononane-1,4,7-triacetic acid (p-SC-Bn-NOTA) (Macrocyclics, Dallas, ID: B-605)
0.9% sodium chloride injection USP, 100 ml fill in 150 ml PAB® (B. Braun, NDC number: 00264-1800-32)
Sterile de-ionized water
Phosphate-buffered saline (PBS) solution, pH 7.4 (Thermo Fisher Scientific, catalog number: 10010023)
100 ml filter-sterilized 50 mM EDTA solution
N,N′-dimethylformamide (DMF; MiliporeSigma, catalog number: 227056-100ML)
Dimethyl sulfoxide (DMSO; MiliporeSigma, catalog number: 317275-100ML)
Diisopropylethylamine (MiliporeSigma, catalog number: 387649-100ML)
Isopropanol
0.1 M sodium acetate solution
0.1 M HCl solution
Copper-64 (64Cu; Washington University St. Louis)
AlexaFluorTM 647 NHS ester (Thermo Fisher, catalog number: A20006)
Mouse serum (MiliporeSigma, catalog number: M5905-5ML)
OCT freezing compound (Tissue-Tek® O.C.T. Compound, Sakura® Finetek; VWR, catalog number: 25608-930)
Tissue-Tek® Cryomold® molds/adapters (Sakura® Finetek)
4′,6-diamidino-2-phenylindole (DAPI; Thermo Scientific, prepared according to vendor instructions; catalog number: 62247)
ProLongTM Gold Antifade Mountant (ProLong, catalog number: P36930)
RPMI-1640 medium (ATCC, catalog number: ATCC® 30-2001TM)
Fetal bovine serum (FBS) (GibcoTM, catalog number: 10-082-147)
Pencillin-streptomycin antibiotics (GibcoTM, catalog number: 15-640-055)
Isoflurane (MiliporeSigma, catalog number: Y0000858)
Aluminium stubs (PELCO® pin mount starter kit; PELCO, catalog number: 76250-10)
Recombinant Anti-CD31 antibody [EPR17260-263] (Abcam, catalog number: ab222783)
Goat anti-rabbit IgG H&L (FITC) (Abcam, catalog number: ab6717)
Complete culture medium (see Recipes)
50 mM EDTA solution (see Recipes)
Equipment
InveonTM PET/CT (Siemens Medical Inc., INVEON, catalog number: 138757)
IVIS® Spectrum In vivo Imaging System (PerkinElmer, catalog number: 124262)
Bioscan AR-2000 Radio-TLC Imaging Scanner (Eckert & Ziegler, Valencia, CA)
Scanning electron microscope (Nova NanoSEM 230, Thermo Fisher Scientific, USA)
Zetasizer Nano ZS (Malvern Instruments Ltd., Worcestershire, UK)
Ultraviolet-visible-NIR spectrophotometer (Synergy H4 Hybrid, BioTek, USA)
Wizard2 2-Detector Gamma Counter (PerkinElmer, catalog number: 2470-0020)
EVOS Auto FL System (Thermo Fisher Scientific, USA)
Nikon Eclipse Ti microscope
Centrifuge (Beckman Coulter, model: Avanti® J-26 XPI, catalog number: 393127)
Tissue culture incubator (Sanyo Scientific, catalog number: 133060)
Biological safety cabinet (The Baker company, SterilGARD, catalog number: 101951)
FisherbrandTM IsotempTM Hot Plate Stirrer, Ambient to 540 °C, Ceramic (Fisherbrand, catalog number: SP88854200)
PCR thermal cycler (Bio-Rad Laboratories, model: T100TM, catalog number: 1861096)
Braintree Scientific Diversity Partner Mouse Tail Illuminator Restrainer (Fisher, catalog number: NC0772753)
SimportTM Scientific StainTrayTM Slide Staining System (Fisher, catalog number: 22-045-035)
Software
Inveon Research Workplace (INVEON, Siemens)
Living Image Software (PerkinElmer)
Nikon Elements software (Nikon)
FIJI (NIH)
Microsoft Office Suite
GraphPad Prism
Procedure
Animal models for pulmonary metastasis of triple-negative breast cancer
Grow and expand the cells according to the recommended conditions. Typically, 4T1-GFP-Luc cells are cultured in RPMI-1640 medium supplemented with 10% FBS and 1% Pencillin-streptomycin.
Harvest cells while in the exponential growth phase (approximately 80-90% confluence) using trypsin or an appropriate enzyme for the specific cell line. Resuspend cells in medium containing serum.
Count cells.
Centrifuge cells at 225 × g, 4°C for 5 min. Resuspend cells in 1× PBS to a concentration of 1 × 10⁵ cells/200 µl.
Place cells on ice and transport to the vivarium.
Restrain the mouse in a restrainer and position the tail such that the vein is facing upwards.
Draw 200 μl cells into a 28 G disposable insulin syringe and gently inject into the tail vein. The contents of the needle should inject easily without resistance.
Monitor tumor development regularly via bioluminescence imaging. Typically, 4T1-Luc cells take 10 days to develop lung metastases.
Surface modification of iNPG-pDox or other amine-modified nano/microparticles
For details of the structure of iNPG-pDox vectors and chemistry, readers are referred to the following references (Goel et al., 2020; Xu et al., 2016).
Dissolve 3 × 10⁹ amine-modified iNPG (or other nanoparticles of choice) in 0.5 ml DMF in a 1.5-ml EppendorfTM tube. Shake gently.
Dissolve 0.8 mg p-SCN-Bn-NOTA in 0.5 ml DMSO and add to the iNPG solution.
Sonicate the mixture until a homogenous solution is formed.
Add 20 µl diisopropylethylamine and incubate the reaction mixture at 25°C for 4 h under vigorous shaking at 700 rpm. This step can be performed on a hot plate stirrer or in a thermal cycler.
After the 4-h incubation, wash the iNPG-NOTA conjugates by centrifugation at 5,000 rpm for 5 min with DMSO as the solvent. Briefly, spin the conjugates down, carefully discard the supernatant and resuspend the pelleted nanoparticles in 0.5 ml DMSO by sonication. Repeat the wash step with DMSO (for a total of 2 times), followed by 0.5 ml isopropanol (one time) and 0.5 ml DI water (one time). The speed and time of the centrifugation can be adjusted according to the nanoparticles used.
After the final wash step, resuspend the iNPG-NOTA pellet in DI water and freeze at -80°C or freeze-dry (depending on the nanoparticle used) for further use (for up to 1 week).
Use the same process to obtain iNPG-AF647 by conjugating fluorescent dyes (e.g., AlexaFluorTM 647 NHS ester) for optical imaging.
Radiolabeling of iNPG-NOTA
Resuspend iNPG-NOTA in 0.5 ml 0.1 M sodium acetate solution.
Adjust the pH of the solution to 5.5 using 0.1 M HCl.
Add 37 MBq 64CuCl2 to the nanoparticle solution. All handling of radioisotopes and radiolabeled solutions should be performed behind a lead shield in a fume hood, in accordance with institutional radiosafety guidelines.
Carefully wrap parafilm around the cap and incubate the tube at 37°C for 1 h with gentle shaking. This step should be performed in a thermal cycler or on a hot plate stirrer behind a protective lead shield.
Remove the excess unchelated 64Cu by centrifugation at ~1,610 × g for 5 min. Wash twice with DI water to obtain the final radiolabeled constructs ([64Cu]NOTA-iNPG). All radioactive waste should be appropriately discarded.
To calculate radiolabeling yield, radio thin-layer chromatography (radio TLC) is performed (Figure 1). Briefly, drop 2 µl [64Cu]NOTA-iNPG on one end (origin) of a silica gel TLC plate. Dip the strip vertically in 2 ml 50 mM EDTA solution in a 50-ml conical tube.
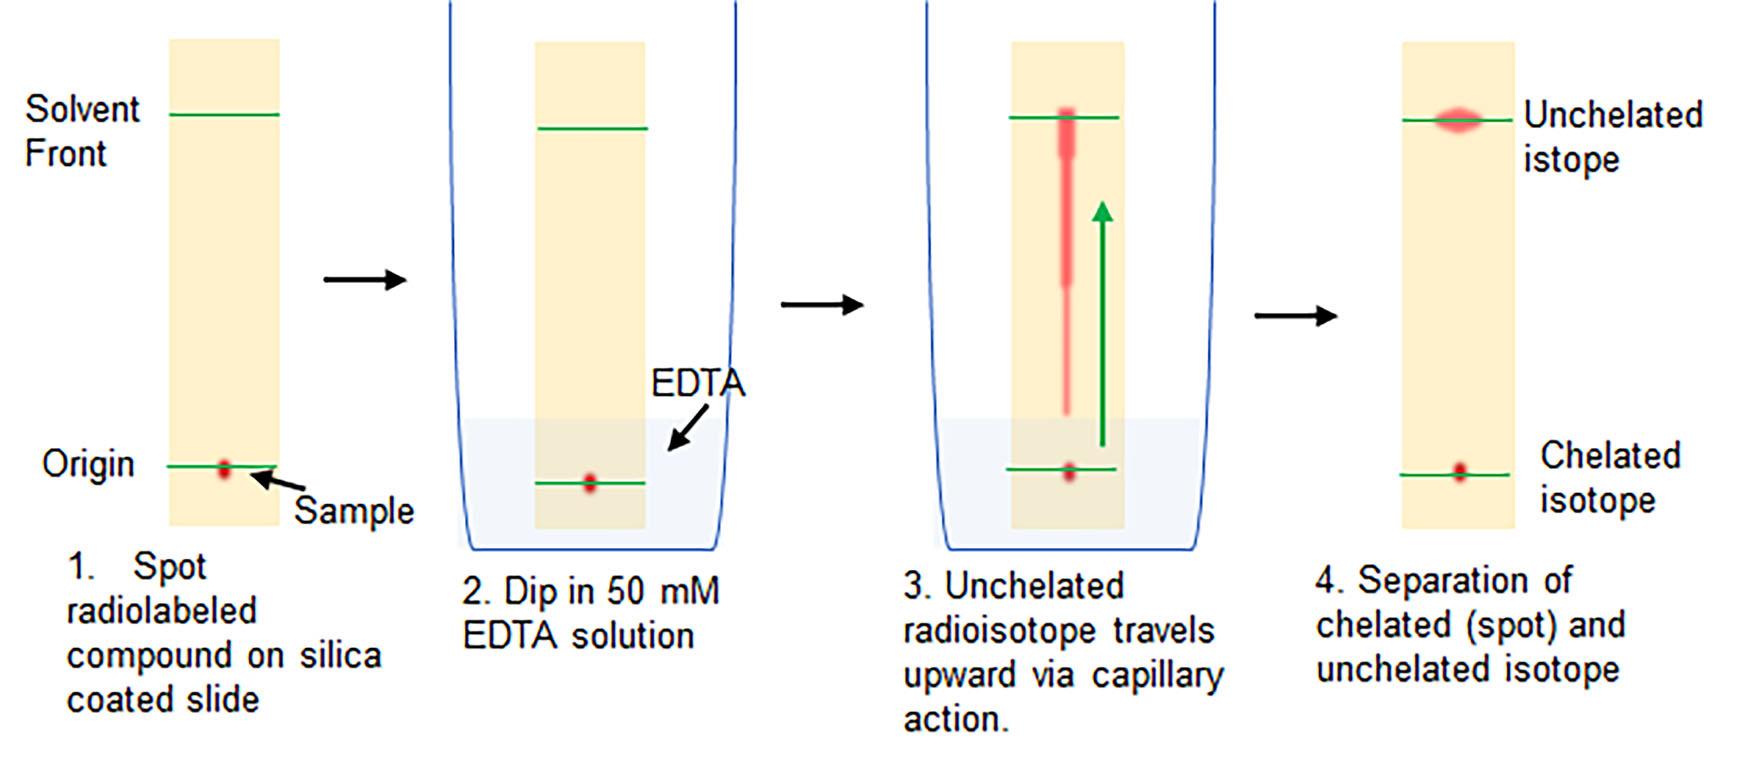
Figure 1. Schematic of the radio TLC procedure to calculate radiolabeling yieldThe solution will slowly travel upward by capillary action. Once the solution has moved 2–4 cm upward (or 1 cm from the top of the strip; solvent front), remove the strip from the EDTA solution and allow to dry.
Scan the strip on a Bioscan AR-2000 RadiobTLC Imaging Scanner according to the vendor’s instructions.
Typical radiolabeling yields using with this procedure range from 50% to 70%, with >99% radiochemical purity.
Loading pDox into [64Cu]NOTA-iNPG or iNPG-AF647
Suspend 3 mg polymeric pDox monomers in DMSO (70 mg/ml) and add the solution to the [64Cu]NOTA-iNPG or iNPG-AF647 conjugates.
Incubate the mixture for 3 h at room temperature with vigorous shaking. This step can be performed in a thermal cycler.
Remove unloaded pDox polymers by washing twice with DI water using centrifugation, as described in B above, to obtain the final constructs: [64Cu]NOTA-iNPG-pDox for PET/CT imaging and iNPG-AF647-pDox for optical imaging and confocal microscopy. Resuspend the final conjugates in 1 ml PBS.
Draw 200 μl [64Cu]NOTA-iNPG-pDox (~60-80 µCi per mouse) solution into a 1-ml syringe for injections in the next step.
Small animal PET/CT imaging
Anesthetize 4T1 tumor-bearing mice under 2% isoflurane (in 100% O2 gas).
Transfer each mouse to a mouse restrainer, carefully placing the nose cone to maintain anesthesia.
Insert the micro-catheter into the tail vein and flush with 50 μl PBS. Leave the syringe with PBS attached to the catheter.
Secure the mouse onto the microPET/CT scanner bed under 2% isoflurane anesthesia administered via the nose cone manifold. To minimize movement, the limbs can be secured to the side of the bed with tape.
Switch the PBS syringe in the catheter with the syringe containing [64Cu]NOTA-iNPG-pDox.
Acquire a whole-body CT calibration image of the mouse.
The PET/CT acquisition protocol will depend on the particular experiment and the requirements of the researcher.
For dynamic PET scans, a 30-min dynamic PET mode, data are acquired using the 3D-OSEM iterative algorithm with a 256 × 256 × 256 voxel volume.
Immediately after the dynamic PET scan is started, slowly inject the radiolabeled nanoparticle solution as a single bolus dose over 30 s.
Continue the dynamic PET acquisition.
If PET images are required at more time points, data are acquired using the standard 3D PET acquisition protocol. To account for radioactive decay, longer scan times may be necessary.
Datasets are acquired as: standard static 3D PET reconstruction and dynamic 3D PET reconstruction with 6 × 300 s frames. CT attenuation correction is applied to all PET images.
Ex vivo gamma counting
When the PET/CT scans are at the final time point, euthanize the animal according to institutional protocols.
Harvest and weigh the major organs including the tumor-bearing lungs.
Radioactivity in the organs is measured using a gamma counter per the manufacturer’s instructions.
Ex vivo whole-organ optical imaging
In a separate cohort of 4T1-tumor bearing mice, inject 200 μl iNPG-AF647-pDox prepared in section D via the tail vein (described in section A).
At the desired time point post-injection, euthanize the mouse according to institutional protocols.
Harvest the lungs and place on a black sheet in the IVIS Spectrum Scanner.
Acquire multiplexed ex vivo fluorescence images using the vendor’s preset filter sets encompassing the excitation and emission spectra for GFP (tumor), doxorubicin (pDox), and AF647. For this combination of fluorophores, 18 filter sets are automatically selected when using the IVIS Spectrum system.
Set the field of view, acquisition time, and binning number. Data acquisition settings will vary from user to user but should be kept constant throughout the experimental study.
After image acquisition, rinse the tissues in PBS, preserve in OCT compound in cryomolds, and store at -80°C for sectioning.
Immunofluorescence microscopy
Cryo-section the frozen tissues into 6-µm-thick sections using a cryotome.
Incubate the sectioned tissues in cold acetone for 10 min. All steps for staining and incubation in this section should be performed in a staining tray or similarly fashioned light-blocking device.
Prepare the blocking solution as follows: Mix horse and goat serum at a 1:1 v/v ratio and add 0.1% (by volume) Triton X-100.
Note: The choice (species) of blocking serum depends on the host of the primary and secondary antibodies used for staining.
Add 100 μl blocking solution per tissue section. Incubate at 4°C for 1 h.
Prepare the solution of primary antibody for a total volume of 100 μl per tissue section. The anti-CD31 antibody can be used at a 1:200 dilution. For other primary antibodies, refer to the vendor’s instructions for the suggested dilution.
After 1 h, gently tap the slide on its side to discard the blocking solution.
Add 100 μl primary antibody cocktail to each tissue section and incubate overnight at 4°C.
After overnight incubation, wash the tissue sections gently in PBS. For each wash, incubate the tissue section in PBS for 3 min, tap the slide on its side to drain the solution, and add fresh PBS. Repeat the wash step 3 times.
Prepare the secondary antibody in blocking solution at the vendor’s recommended dilution. For the goat anti-rabbit-FITC secondary antibody, a 1:50 dilution is recommended.
Incubate the sections in secondary antibody solution for 1 h at 4°C.
Wash the secondary antibody with PBS as described in Step H8.
Add 50 μl DAPI solution to the tissue sections and incubate for 10 min.
Wash twice with PBS as outlined in Step H8.
Clean and dry the portions of the slide adjacent to the tissue, taking care not to disturb or dislodge the tissue.
Add a drop (or 5 μl) Gold Anti-fade Mounting Medium and gently place a coverslip on the tissue sections. Care must be taken to prevent the introduction of bubbles.
Dry the slide by tapping gently with Kimwipes and keep protected from light in a black box or slide cassette covered with aluminum foil. It is recommended to perform confocal microscopy within a day of staining.
Observe and photograph immunofluorescent slides by mounting on the stage of a confocal microscope according to the vendor’s instructions, using the appropriate objectives. Typically, 10× and 40× objectives are sufficient for nanoparticle uptake studies. Take images of 5-10 fields of view per tissue section distributed over the entire section.
Prevent overexposure or stain bleaching of the samples. All images are acquired under identical conditions.
FITC and DAPI can be observed with their dedicated filter sets. To oberve iNPG-AF647, use the cy5 common filter set. To observe fluorescence from pDox nanoparticles, the RFP common filter can be used.
Data analysis
MicroPET/CT analysis
PET/CT analysis varies by the user experimental system and institutional software and hardware set up. In this work, the following steps were followed:
Input the injected radioactivity dose, time of injection, name of isotope, and time of scan into the software.
Analyze the whole-body PET images of the mouse using the Inveon Workstation Software (Siemens Medical Inc.).
Manually draw the region-of-interest (ROI) centered around the organs of interest (e.g., lungs, liver, spleen, kidney, bone, muscle, and heart) on the co-registered PET/CT images (Figure 2). The decay-corrected radioactivity in each ROI is computed automatically by the software as the percentage of the injected dose per gram of organ (%ID/g).
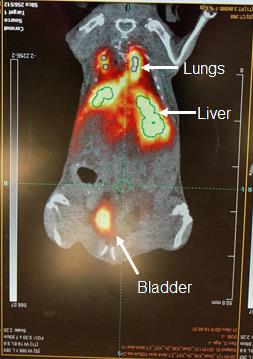
Figure 2. Example of PET image quantitation using the Inveon Workstation Software (Siemens Medical Inc.). Coronal view of the whole-body distribution of [64Cu]NOTA-iNPG-pDox in a mouse bearing lung 4T1 lung metastases. White arrows depict the different organs, while ROI outlines are shown in green.Dynamic time-activity curves are plotted for each ROI using the dynamic 3D dataset.
To save images, select a coronal, axial, or sagittal view and export as .TIFF files. 3D maximum intensity projection (MIP) reconstructions can be also obtained using the software.
Optical imaging analysis
Analysis of multiplexed optical imaging will vary from user to user depending on the experimental and hardware/software setups. The following steps were used in this protocol.
Analyze the data using the LivingImageTM software (PerkinElmer).
Perform spectral unmixing using the automatic mode with four-component principal components analysis. Autofluorescence is subtracted from all images during analysis.
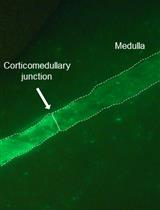
Draw volume- and area-matched ROIs on the spectrally unmixed images for each component (GFP for the tumor, AF647 for iNPG, and doxorubicin for pDox) (Figure 3).
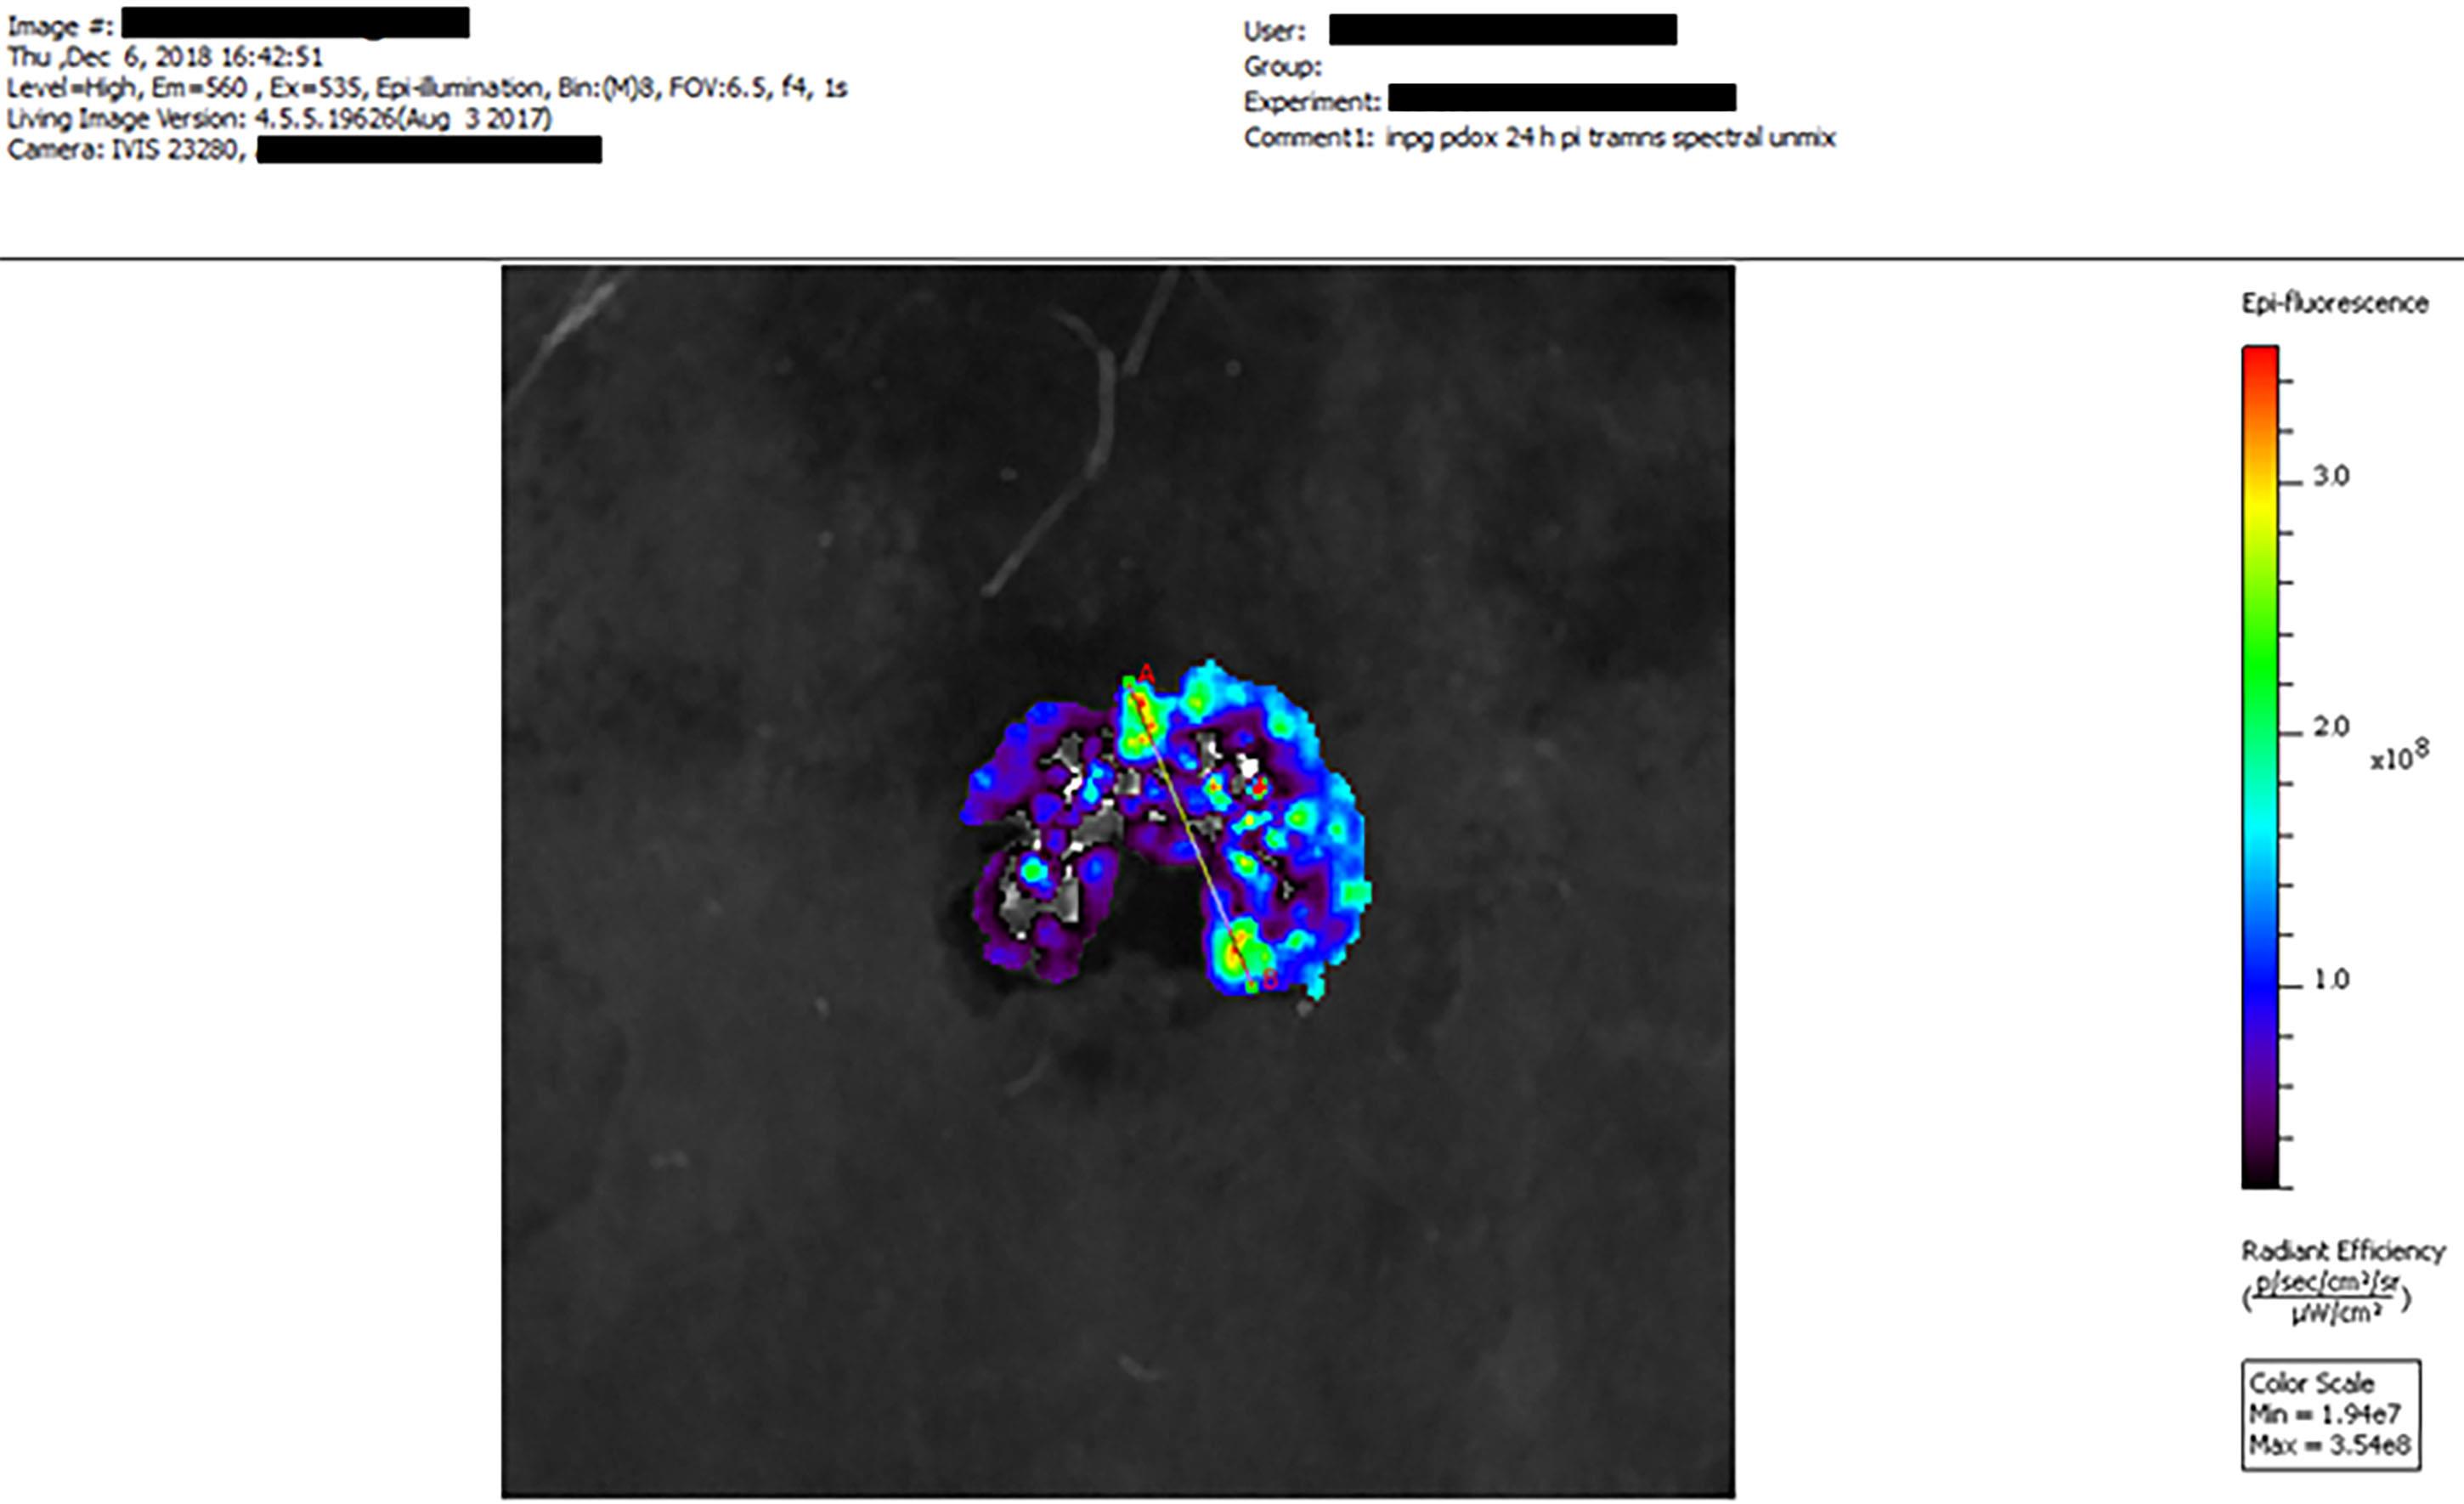
Figure 3. Example of ex vivo multiplexed optical imaging (IVIS® Imaging System) depicting the distribution of AF647-iNPG-pDox in 4T1 lung metastases using the PerkinElmer Living ImageTM software. Fluorescence signal from Dox (excitation: 535 nm, emission 560 nm) is shown.ROIs are computed automatically and are presented as the average radiant efficiency [units: (p/s/ cm2/ sr)/(μW/cm2)].
Pixelwise line analysis can also be performed using the software.
Export data as .TIFF files.
Confocal microscopy analysis
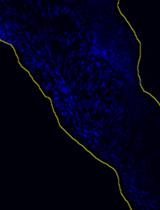
In the present work, images were analyzed using the Nikon Elements (Figure 4) and FIJI software.
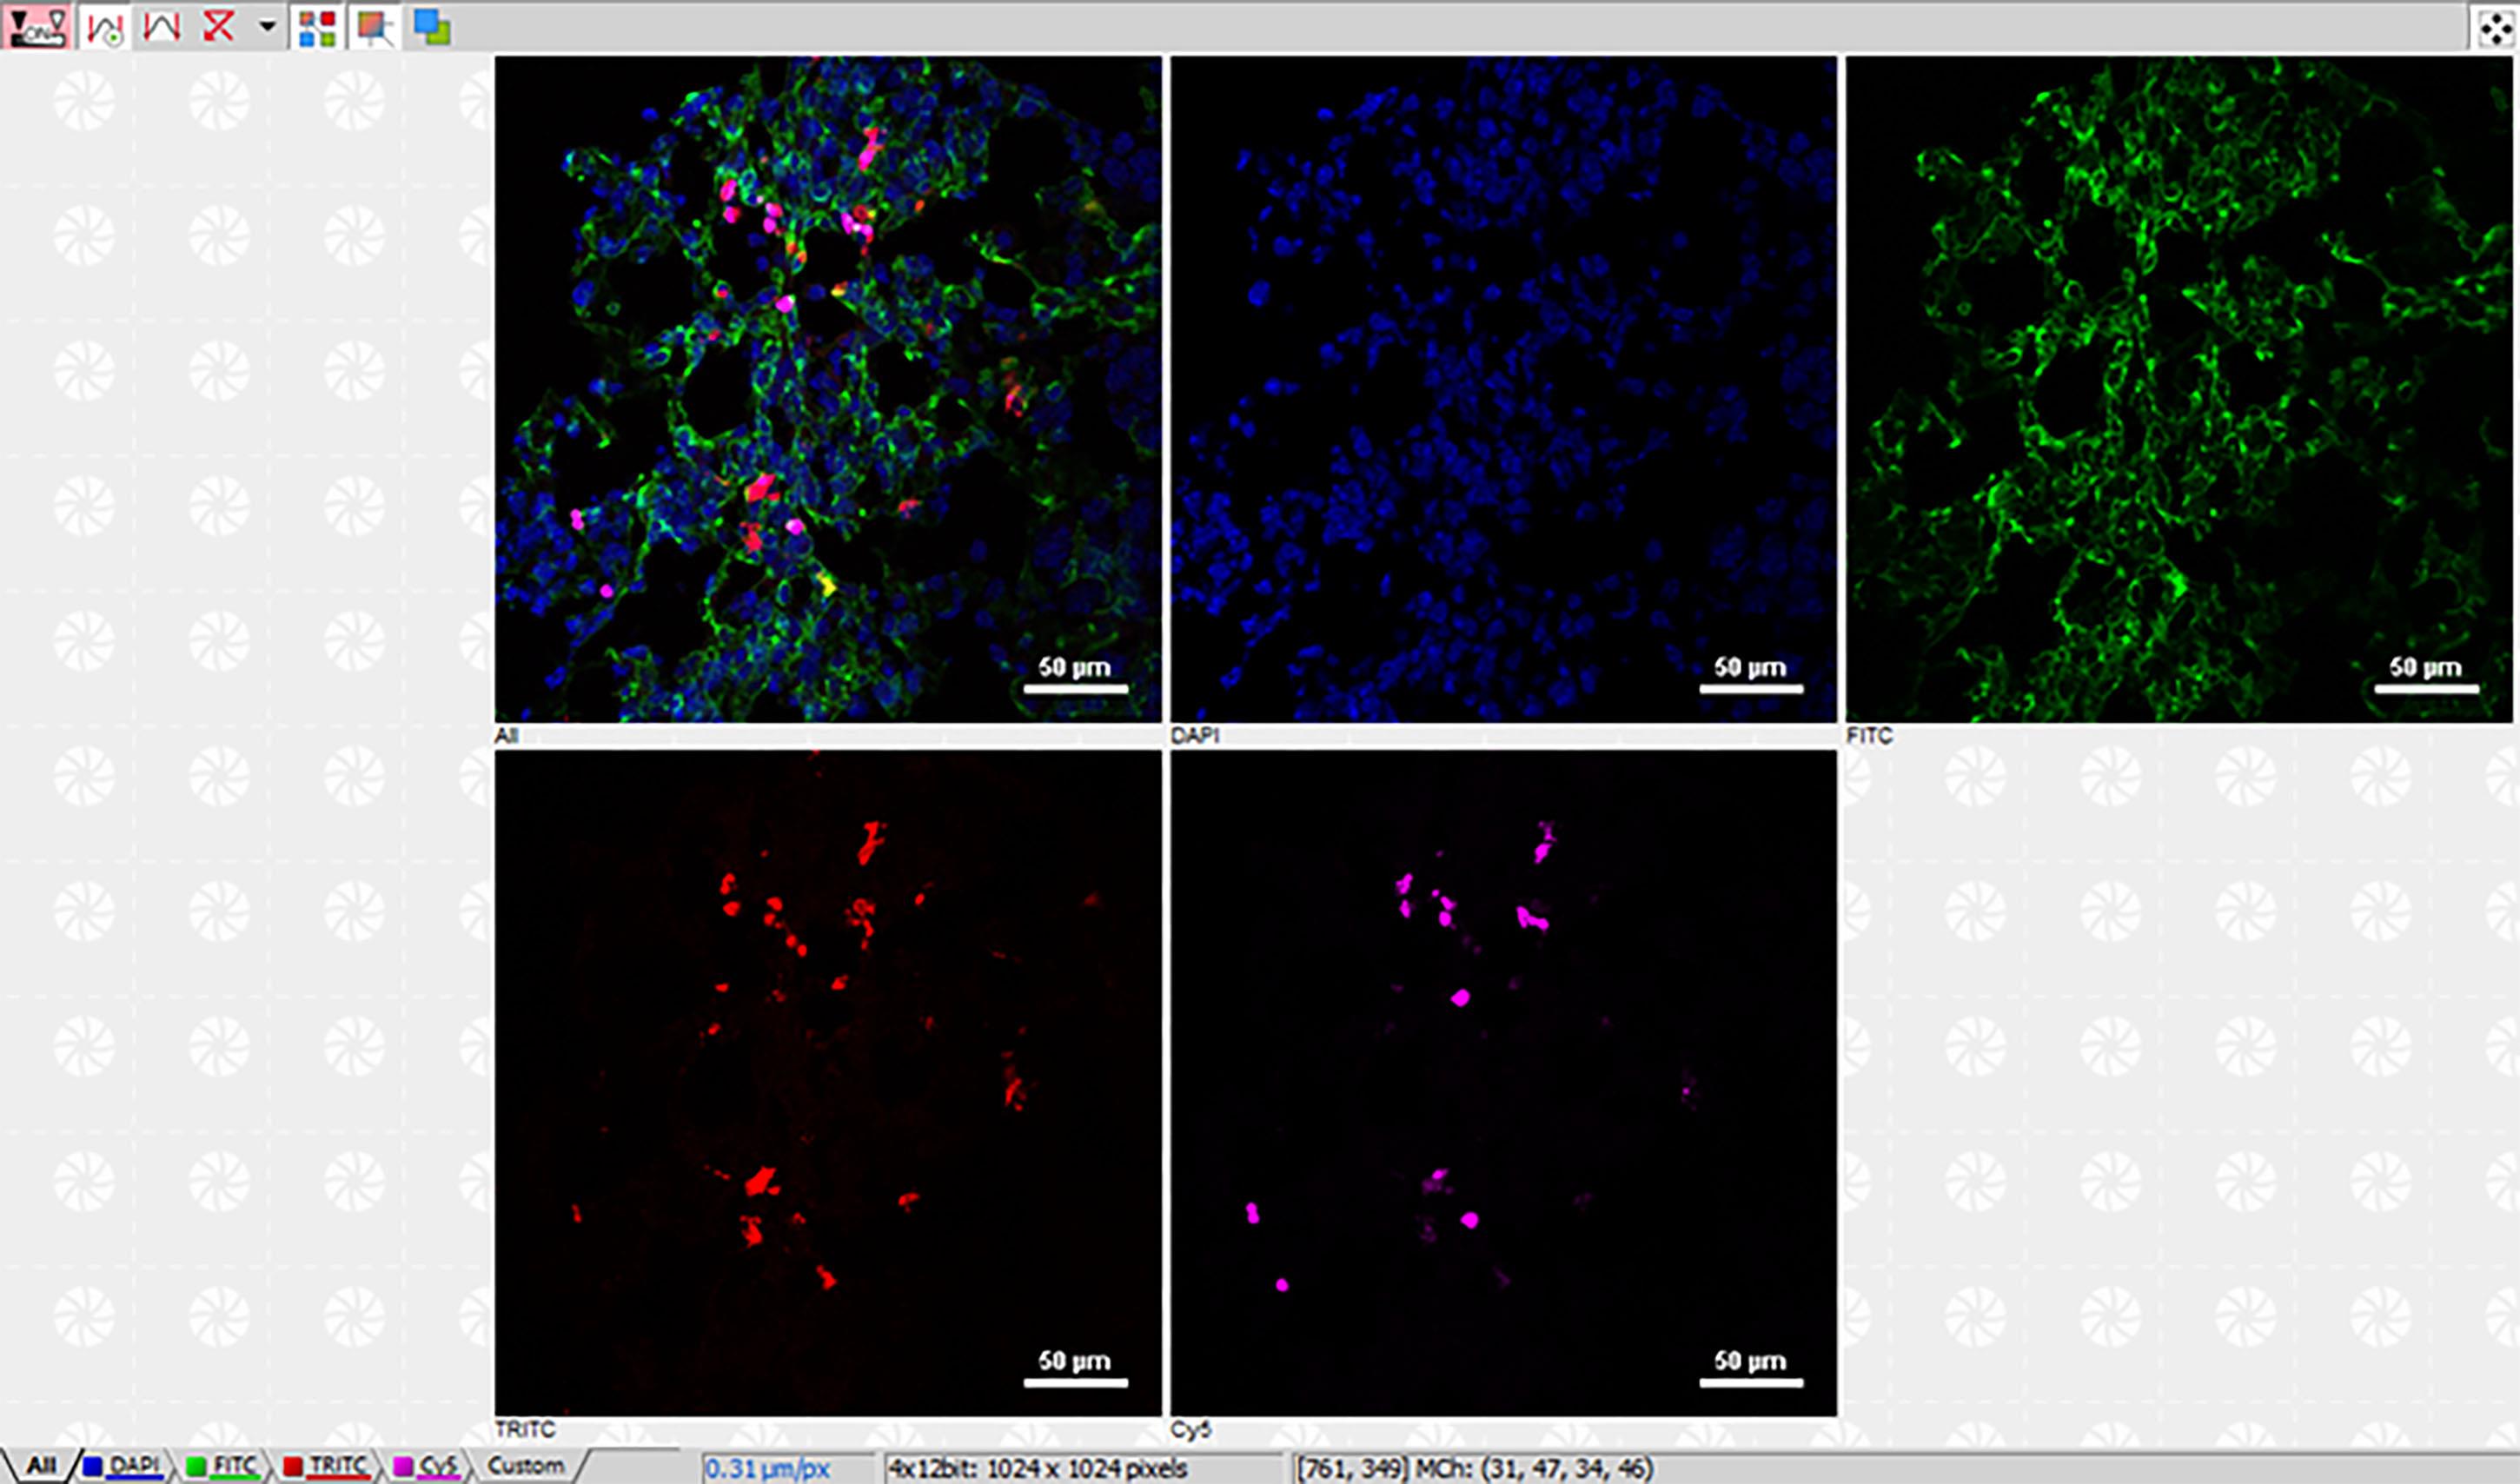
Figure 4. Example of multiplexed confocal microscopy immunofluorescence imaging analysis using the Nikon NIS-ElementsTM software. Merged (first panel) and single-channel images of DAPI (blue), blood vessels (CD31, green), AF647-iNPG (magenta), and pDox (red) in 4T1 metastases-bearing lungs. Scale bars as shown.Use constant settings for image analysis throughout the study.
Apply Gaussian blur and automatic thresholding to segment the images for quantitation.
Perform pixelwise quantitation of fluorescence intensity and area fraction coverage by drawing an ROI over the entire organ or individual tumor nodules.
Typically, quantitation is performed over 5 random fields of view per stain.
Recipes
Complete culture medium for murine 4T1 triple-negative breast cancer cell line:
500 ml RPMI 1640 Medium
50 ml 1:10 Gibco fetal bovine serum, Premium Plus
5.5 ml 1:100 Penicillin-Streptomycin (Pen/Strep) antibiotics
Notes:
We recommend aliquoting FBS and Pen/Strep into 50 5.5-ml batches (sufficient to make one batch of 500 ml complete cell culture medum) to prevent repeated freezing/thawing of the components.
The complete medium can be pre-prepared in advance and stored in 4°C for an extended period.
We recommend warming the complete cell culture medium in a water bath at 37°C prior to use.
100 ml filter-sterilized 50 mM EDTA solution:
1.87 g EDTA (disodium ethylenediaminetetraacetate·2H2O)
De-ionized water
Add sterile de-ionized water to EDTA powder to a final volume of 100 ml
Pass the solution through a 0.2-µm Nalgene bottle top sterile filter unit
Store in 4°C for an extended period
Acknowledgments
The protocols described in this work are derived from the original research publication, Sci Adv. 2020 Jun 24;6(26):eaba4498 (Goel et al., 2020). This work was partially supported by the NIH grants U54CA210181, R01CA193880, and R01CA222959, in addition to the U.S. Department of Defense grant W81XWH-17-1-0389.
Competing interests
Mauro Ferrari is the inventor of a U.S. patent from The University of Texas-Houston (patent no. US 8,920,625 B2, granted 30th December, 2014). Mauro Ferrari and Haifa Shen are inventors of a non-provisional patent application from the Houston Methodist Hospital (PCT/US 2014/0010879 A1). Both inventions are related to the scientific research described herein. More recently, Mauro Ferrari has formed a company (BrYet LLC) and has secured certain commercial rights on said patents. Though not an executive officer, he remains a majority shareholder, director, and scientific advisor of the company. All other authors declare that they have no competing interests.
Ethics
All animal studies were performed in accordance with the guidelines from the Institutional Animal Care and Use Committee (IACUC ID: IS00004452; Validity: 01/02/2018-01/01/2021) at the Houston Methodist Research Institute.
References
- Bianchini, G., Balko, J. M., Mayer, I. A., Sanders, M. E. and Gianni, L. (2016). Triple-negative breast cancer: challenges and opportunities of a heterogeneous disease. Nat Rev Clin Oncol 13(11): 674-690.
- Blanco, E., Shen, H. and Ferrari, M. (2015). Principles of nanoparticle design for overcoming biological barriers to drug delivery. Nat Biotechnol 33(9): 941-951.
- Goel, S., England, C. G., Chen, F. and Cai, W. (2017). Positron emission tomography and nanotechnology: A dynamic duo for cancer theranostics. Advanced Drug Delivery Reviews 113: 157-176.
- Goel, S., Zhang, G., Dogra, P., Nizzero, S., Cristini, V., Wang, Z., Hu, Z., Li, Z., Liu, X., Shen, H. and Ferrari, M. (2020). Sequential deconstruction of composite drug transport in metastatic breast cancer. Science Advances 6(26): eaba4498.
- Michor, F., Liphardt, J., Ferrari, M. and Widom, J. (2011). What does physics have to do with cancer? Nat Rev Cancer 11(9): 657-670.
- Elia, I., Rossi, M., Stegen, S., Broekaert, D., Doglioni, G., van Gorsel, M., Boon, R., Escalona-Noguero, C., Torrekens, S., Verfaillie, C., Verbeken, E., Carmeliet, G. and Fendt, S. M. (2019). Breast cancer cells rely on environmental pyruvate to shape the metastatic niche. Nature 568(7750): 117-121.
- Xu, R., Zhang, G., Mai, J., Deng, X., Segura-Ibarra, V., Wu, S., Shen, J., Liu, H., Hu, Z., Chen, L., Huang, Y., Koay, E., Huang, Y., Liu, J., Ensor, J. E., Blanco, E., Liu, X., Ferrari, M. and Shen, H. (2016). An injectable nanoparticle generator enhances delivery of cancer therapeutics. Nat Biotechnol 34(4): 414-418.
Article Information
Copyright
© 2021 The Authors; exclusive licensee Bio-protocol LLC.
How to cite
Readers should cite both the Bio-protocol article and the original research article where this protocol was used:
- Goel, S., Ferrari, M. and Shen, H. (2021). Surface Engineering and Multimodal Imaging of Multistage Delivery Vectors in Metastatic Breast Cancer. Bio-protocol 11(10): e4030. DOI: 10.21769/BioProtoc.4030.
- Goel, S., Zhang, G., Dogra, P., Nizzero, S., Cristini, V., Wang, Z., Hu, Z., Li, Z., Liu, X., Shen, H. and Ferrari, M. (2020). Sequential deconstruction of composite drug transport in metastatic breast cancer.Science Advances 6(26): eaba4498.
Category
Cancer Biology > General technique
Biophysics > Bioengineering > Medical biomaterials
Molecular Biology > Nanoparticle
Do you have any questions about this protocol?
Post your question to gather feedback from the community. We will also invite the authors of this article to respond.