- Protocols

- Articles and Issues
- For Authors
- About
- Become a Reviewer

Proteomics Profiling of S-sulfurated Proteins in Acinetobacter baumannii
Published: Vol 11, Iss 9, May 5, 2021 DOI: 10.21769/BioProtoc.4000 Views: 5166
Reviewed by: Emilia KrypotouMilos FilipovicAnonymous reviewer(s)
Original research article
The authors used this protocol in:

Jun 2020
Advertisement


Protocol Collections
Comprehensive collections of detailed, peer-reviewed protocols focusing on specific topics


Related protocols
Abstract
Hydrogen sulfide (H2S) is emerging as an important modulator in bacterial cytoprotection against the host immune response in infected animals, which may well be attributed to downstream highly oxidized sulfur species, termed reactive sulfur species (RSS), derived from H2S. One mechanism by which H2S/RSS may signal in the cell is through proteome S-sulfuration (persulfidation), which is the conversion of protein thiols (-SH) to protein persulfides (-SSH). While several analytical methods have been developed to profile sites of protein persulfidation, few have been applied to bacterial cells. The analytical workflow presented here was recently utilized to profile proteome persulfidation in the major human pathogen Acinetobacter baumannii treated with an exogenous sulfide source, Na2S. The data obtained using this protocol allow quantitation of the change in persulfidation status of each cysteine in the proteome normalized to the change in protein abundance, thus identifying sites of persulfidation that may constitute regulatory modifications. These can be validated using follow-up biochemical studies.
Keywords: Protein persulfidationBackground
To combat the increasing threat of drug-resistant and life-threatening pathogens, new antimicrobial strategies must be developed. One important approach to achieving this is to understand bacterial adaptation to the host immune response. Recent studies that build on prior work (Shatalin et al., 2011) suggest that bacterial H2S biogenesis may well be a clinically important adaptive response during infection (Mironov et al., 2017; Shukla et al., 2017; Luhachack et al., 2019; Toliver-Kinsky et al., 2019; Saini et al., 2020). The beneficial traits attributed to H2S are likely due to highly oxidized sulfur species termed reactive sulfur species (RSS), e.g., organic persulfides (RSSH), which have been shown to be potent antioxidants in mammalian cells (Ida et al., 2014). Recently, RSS has been quantitated in a number of different bacterial pathogens, suggesting that the antioxidant and cytoprotective findings in mammalian cells may well extend to bacterial cells (Peng et al., 2017a and 2017b; Shen et al., 2018; Walsh et al., 2020).
The mechanism by which H2S/RSS signals in the cell is not completely understood but almost certainly involves the protein post-translational modification (PTM) termed S-sulfuration (persulfidation) (Filipovic et al., 2018; Walsh and Giedroc, 2020). This PTM may provide protection against over-oxidation of protein thiols or perform a regulatory role by altering the chemistry of active-site thiols, thiols in regulatory domains, or those found in transcriptional regulators. Investigating the regulatory nature of protein persulfidation is complicated by the fact that protein thiols can form a number of other redox modifications, e.g., S-sulfenylation (RSOH) or S-nitrosation (RSNO), rendering it difficult to distinguish those proteins for which persulfidation is regulatory versus a consequence of a highly reactive or surface-exposed thiol. Most published methods for the detection of protein persulfidation incorporate: i) streptavidin-based alkylation probes to enrich for thiols and persulfide-harboring peptides followed by selective reduction of the mixed disulfide originating from alkylated persulfides (Gao et al., 2015; Peng et al., 2017b); and/or ii) a tag-switch approach that further exploits the unique reactivity of this mixed disulfide toward a specific nucleophile (Zhang et al., 2014; Park et al., 2015; Zivanovic et al., 2019). Recently, low-pH quantitative thiol reactivity profiling (QTRP) was introduced to directly detect protein persulfides and thiols in the same sample, an important step toward defining the ratio of persulfide to thiol at all cysteines (Fu et al., 2020).
The proteomics workflow presented here was recently applied to the major human pathogen Acinetobacter baumannii, in which several hundred proteins were identified as sites of persulfidation in both untreated and Na2S-treated cells (Walsh et al., 2020). This method relies on the alkylation of both thiol and persulfide residues using a biotinylated iodoacetamide probe. The proteins are then digested into peptides and enriched using streptavidin bead capture, after which peptides containing a mixed disulfide that is derived only from persulfidated residues are selectively reduced, alkylated, and identified by LC-MS/MS (Figure 1A). Although false positives can result from the reaction of these electrophilic probes with sulfenylated cysteines (Reisz et al., 2013), lower concentrations of reagent and shorter alkylation times can minimize this. In addition, it is important to point out that H2S reacts directly with a sulfenylated cysteine to form a persulfide (Cuevasanta et al., 2015 and 2019); therefore, the extent to which sulfenylated cysteines would be present in a proteome following incubation of bacterial cell cultures with excess H2S is unknown, but may well be relatively low.
In a parallel experiment, protein abundance is determined for the entire bacterial lysate without enrichment using a widely used label-free quantitation method (Zhu et al., 2010). The two data sets are then used to calculate or simply compare the change in persulfidation status normalized to the change in protein abundance (Figure 1B), thus pinpointing cysteine thiols for which persulfidation may well be regulatory in nature. This workflow leads to the identification of over 40 proteins in A. baumannii characterized by a ≥2-fold change in the normalized persulfidation status, a significant number of which are transcriptional regulators, including two implicated in biofilm formation (Walsh et al., 2020).
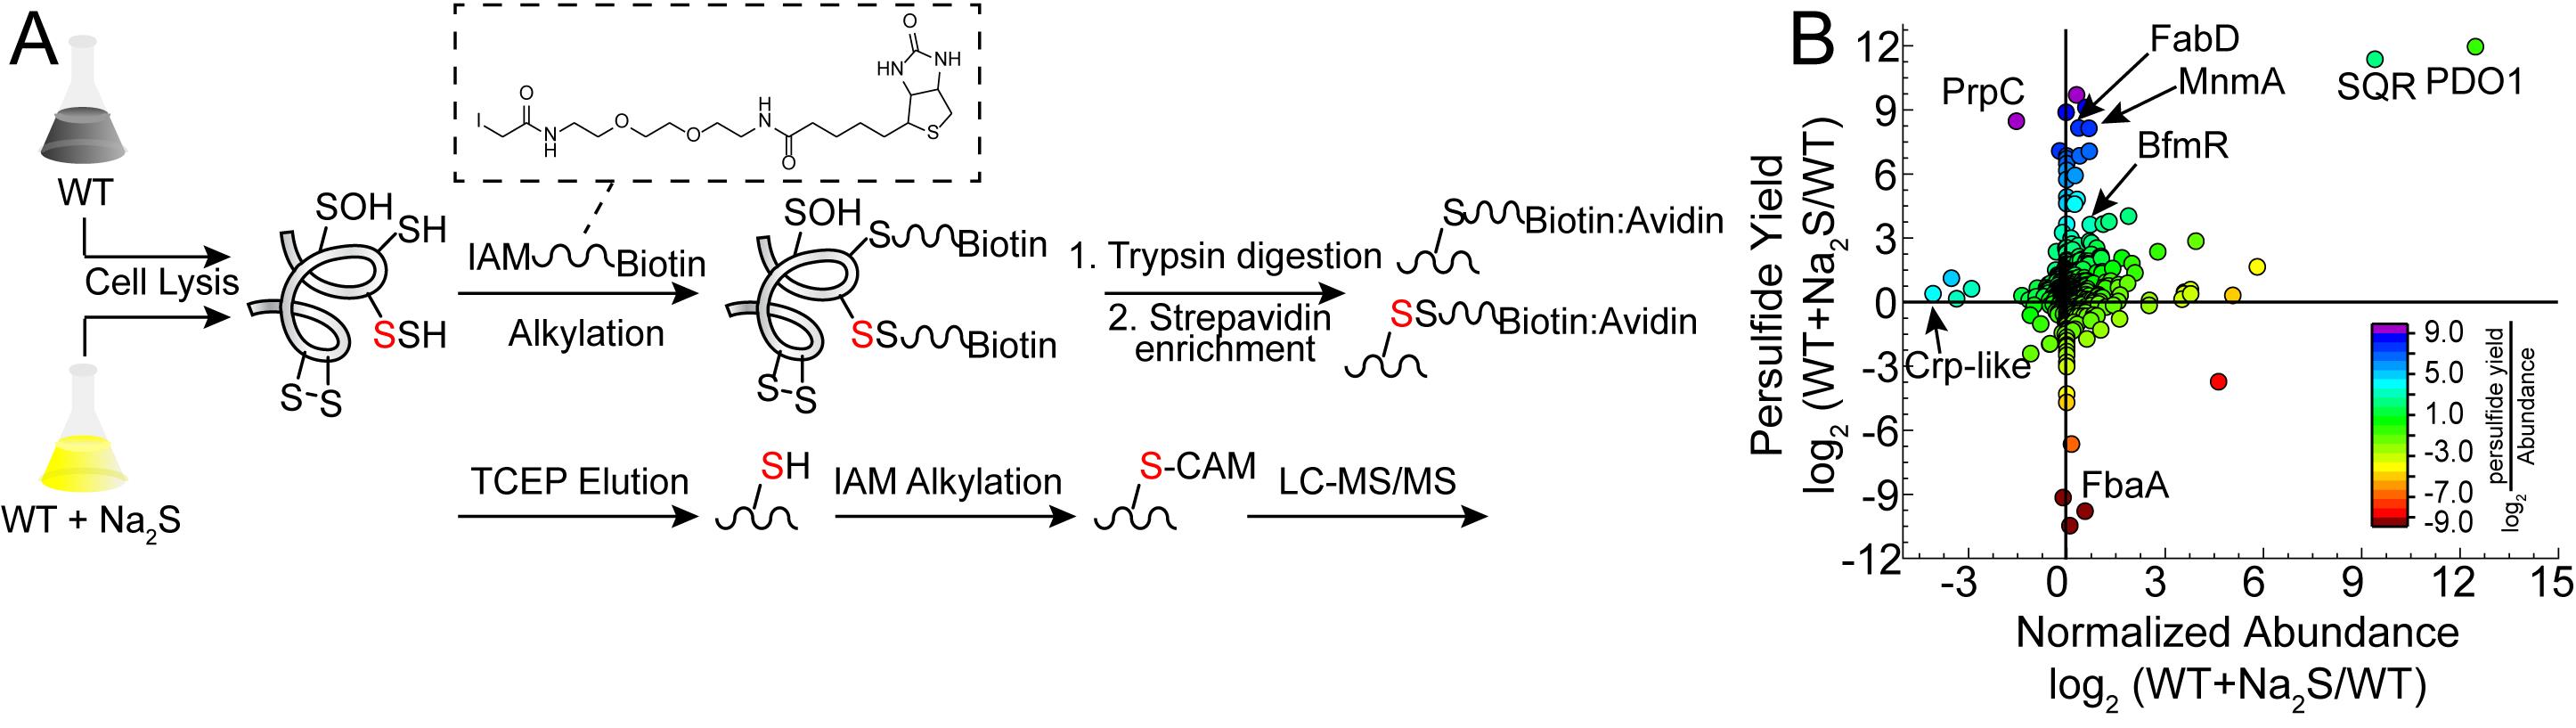
Figure 1. Proteome persulfidation profiling. A. General workflow for the enrichment and identification of proteome persulfides (Peng et al., 2017b). Both untreated (WT) and treated (WT+Na2S) samples are processed using the same workflow and analyzed independently of one another. B. Resulting data are plotted as a change in persulfidation status for a cysteine-containing peptide in a protein versus a change in the normalized abundance of that protein in WT vs. Na2S-treated cells (Walsh et al., 2020). Abbreviations: BfmR, biofilm response regulator; Crp-like, cAMP-activated regulator; FabD, ACP-malonyl transferase; FbaA, fructose-bisphosphate aldolase; MnmA, tRNA 2-thiouridine synthase; PDO1, persulfide dioxygenase-1; PrpC, 2-methylcitrate synthase; SQR, sulfide-quinone oxidoreductase.
Materials and Reagents
Note: Catalog numbers for specific suppliers that we use are given for many of the reagents listed below; an equivalent quality reagent from an alternative supplier can be substituted, with comparable results. Standard materials and reagents for cell culture are required and are not explicitly listed below. Reagents are listed in the approximate order of use in the protocol.
Culture tubes (VWR, catalog number: 60818-667)
50 ml centrifuge tubes (VWR, catalog number: 89039-656)
1.5 ml centrifuge tubes (VWR, catalog number: 20170-038)
Lysing Matrix B, 2 ml tubes (MP Biomedical, catalog number: 116911050)
2 ml centrifuge tubes (VWR, catalog number: 20170-170)
C18 Sep-Pak (Waters, catalog number: WAT051910)
Omix C18 tips (Agilent, catalog number: A57003100)
pH indicator paper
Acinetobacter baumannii (A. baumannii) ATCC 17978 strain
Luria-Bertani (LB) broth (Fisher, catalog number: BP1426)
Na2S (Sigma, catalog number: 407410)
Na2HPO4 (Fisher, catalog number: S374-500)
KH2PO4 (Fisher, catalog number: P285-500)
KCl (Sigma, catalog number: 7300-500GM)
NaCl (Macron, catalog number: 7581-06)
2-Morpholinoethanesulfonic acid, free acid (MES) (GoldBio, catalog number: M-095-1)
Liquid nitrogen
Bradford reagent (Thermo, catalog number: 23238)
Bovine serum albumin (BSA) (Sigma, catalog number: A4503)
3 kDa cut-off concentrators (Millipore Sigma, catalog number: UFC500396)
Urea (Fisher, catalog number: U15)
Ammonium bicarbonate (ABC) (J.T. Baker, catalog number: 3003-01)
EZ-LinkTM Iodoacetyl-PEG2-Biotin (Biotinylated iodoacetamide, BIAM) (Thermo, catalog number: 21334)
Sequencing grade trypsin (Promega, catalog number: V5117)
Avidin acrylamide resin (Thermo, catalog number: 53151)
Tris(2-carboxyethyl)phosphine (TCEP) (ChemImpex, catalog number: 23004)
Iodoacetamide (IAM) (Sigma, catalog number: I1149)
Trichloroacetic acid (TCA) (Sigma, catalog number: 91228)
Diluted solutions of organic acid (0.1-10%) commonly used in mass spectrometry, e.g., trifluoroacetic acid or formic acid
LC-MS grade acetonitrile (OmniSolv, catalog number: AX0156)
LC-MS grade water (OmniSolv, catalog number: WX0001-1)
Na2S stock (see Recipes)
Phosphate-buffered saline (PBS) (see Recipes)
Lysis buffer (see Recipes)
Sep-Pak Aqueous Buffer (see Recipes)
Sep-Pak Organic buffer (see Recipes)
Equipment
Note: Typical biochemistry lab equipment is required; therefore, it is not explicitly listed below. Catalog numbers are given for most of the equipment as examples; instruments from alternative manufacturers may be substituted, provided equivalent functionality. Equipment is listed in the approximate order of use in the protocol.
Shaker
Spectrophotometer and cuvettes
Various centrifuges with the appropriate rotors capable of centrifuging a variety of volumes ranging from 1.5 ml to 50 ml or greater (depending on the cell culture volume)
Water bath
Bead Ruptor 12 Homogenizer (Omni, model: 19-050A)
Anaerobic chamber (Vacuum Atmospheres Company, model: HE-453-2-245)
Rotor-Barnstead Thermolyne Labquake Shaker (Barnstead International, model: 400110)
Vacuum manifold (Thermo Fisher Scientific, model: 60104-232)
ISS 110 SpeedVac System (Thermo Fisher Scientific, model: ISS 110)
Trapping column: Symmetry C18 trap column (180 μm × 20 mm, 5 μm)
Analytical column: nanoACQUITY HPLC HHS T3 analytical column (75 μm × 150 mm, 1.8 μm)
Orbitrap FusionTM LumosTM TribridTM Mass Spectrometer (Thermo Fisher Scientific) interfaced with a nano-flow liquid chromatography (LC) system (e.g., Thermo Scientific EASY-nLC 1200)
Software
UniProt
Proteome Discoverer 2.1 (Thermo Scientific)
Procedure
Cell culture
Streak A. baumannii ATCC 17978 onto LB agar plates from frozen glycerol stocks and incubate at 37°C overnight.
Use single colonies to inoculate 3 ml LB broth and shake at 37°C overnight.
Note: The experiment should be performed in biological triplicate and A. baumannii is grown at a liquid-to-air ratio of 1:5, e.g., 10 ml LB in a 50-ml centrifuge tube.
Dilute the overnight cultures 1:50 in 10 ml LB and grow for approximately 1 h until OD600 = 0.1, at which time the culture should be diluted 1:100 into sterilized flasks containing 250 ml LB and shaken at 37°C until OD600 = 0.2.
Note: Six samples will be collected in total; a biological triplicate of wild-type (WT) untreated and a biological triplicate of WT treated with Na2S. The volume of culture required depends on the organism of choice and how much protein is needed for the workflow. Typically, 2 mg total protein is required for each replicate but more may be necessary depending on the sensitivity of the MS instrument used.
Add Na2S to three of the six cultures at a final concentration of 0.2 mM and incubate for an additional 30 min at 37°C. Then proceed with the following steps.
Centrifuge all cultures at 4,226 × g for 15 min at 4°C, discard the supernatant, and place the pellets on ice.
Note: Untreated cultures should be centrifuged when OD600 = 0.2 and Na2S-treated cultures should be centrifuged 30 min post-addition of Na2S.
Wash cell pellets with 5 ml cold PBS, centrifuge at 4,226 × g for 15 min at 4°C, and discard the supernatant.
Wash the cell pellets with 1 ml cold PBS, transfer to 1.5-ml Eppendorf tubes, centrifuge at 19,090 × g for 3 min, and discard the supernatant.
Note: Cell pellets can be stored at -80°C until ready to proceed to lysis.
Cell Lysis
Note: Step B1 should utilize buffer that has been degassed, purged with argon, and stored in an anaerobic chamber. If an anaerobic chamber is not available, prepare fresh buffer each time and degas the buffer thoroughly and purge with argon. Steps B3 and B5 are performed in an anaerobic chamber. The aliquot used in Step B4 can be removed from the chamber to complete the assay.
Resuspend the pellets in 1 ml Lysis Buffer (see Recipes) and freeze/thaw 5 times in liquid nitrogen and a 37°C water bath.
Note: Lysis buffer can be modified, e.g., detergent, salt, pH, etc. It is important to make sure that the buffer is degassed and purged with argon (preferably stored in an anaerobic chamber) to minimize exposure to oxygen during Steps B1-B2, which take approximately 1 h.
Transfer the lysate to Matrix B lysing tubes and shake on a homogenizer for 45 s (5 s on, 90 s off intervals) at 6.8 m/s and 4°C.
Transfer the samples to an anaerobic chamber (<1 ppm O2) and centrifuge using a standard microcentrifuge for 15 min at 4°C. Transfer the supernatant to a clean 1.5-ml Eppendorf tube, centrifuge again, and transfer to a clean tube to ensure that no cellular debris is present.
Remove 2-10 μl supernatant and perform a standard Bradford assay to determine the protein concentration using bovine serum albumin as a protein standard.
Based on the Bradford assay, aliquot a volume of lysate that corresponds to 6 mg protein for each replicate. The remaining lysate can be flash frozen and stored at -80°C until whole proteome analysis (Procedure E).
Alkylation and tryptic digestion
Note: Steps C1-C3 should be performed in an anaerobic chamber. If one is not available, use buffer prepared according to the note in Procedure B and minimize sample exposure to oxygen. Alternative buffer exchange protocols may be substituted to reduce time.
Buffer exchange the samples from Step B5 in the anaerobic chamber using a 3 kDa cut-off concentrator by repeated cycles of the addition of 8 M urea in 100 mM ABC followed by centrifugation at 4°C for 10 min. Repeat this process 7-8 times. When complete, transfer the sample to a clean 1.5-ml tube, by inverting the concentrator, and centrifuge for 30 s.
Optional: 8 M urea in 100 mM ABC can be added to increase the sample volume (no more than 500 µl total is recommended).
Note: Other methods of buffer exchange may be used.
Add 2 mg BIAM at room temperature protected from light and incubate for 90 min.
Buffer exchange the samples as described previously (Step C1) using 100 mM ABC, until the concentration of urea is approximately 1 M (or less), and transfer to a clean tube.
Optional: Additional buffer may be added to increase the sample volume (no more than 500 µl is recommended).
Remove the samples from the anaerobic chamber, add 60 µg trypsin, and check that the pH of the samples is basic by adding 1 μl sample to pH indicator paper; add an additional 100 mM ABC buffer to adjust the pH if needed. Incubate the samples in a 37°C water bath for 18 h.
Desalt the peptides and remove undigested proteins by running the C18 Sep-Pak protocol.
Sample Preparation
Acidify the samples using 10% solutions of trifluoroacetic acid or formic acid to a final concentration of 0.2% and check that the pH is acidic using pH indicator paper; if not acidic, add more acid.
Pellet the insoluble material using a microcentrifuge operating at 16,363 × g for 15 min at 4°C and transfer the supernatant to a clean 1.5-ml tube.
Sep-Pak Preparation
Using a clean razor blade, trim the long end of the Sep-Pak down to the cartridge.
Trim the short side half-way down; this short side is where the syringe will be attached.
Condition the Sep-Pak by passing 20 ml organic buffer (see Recipes) followed by 20 ml aqueous buffer (see Recipes) using a 20-ml syringe.
Note: Ensure that air is not pulled or pushed through the cartridge here or at any subsequent step.
Apply the sample using a 3-ml syringe, rinse the sample tube with 1 ml aqueous buffer, and apply to cartridge.
Wash the cartridge with 30 ml aqueous buffer.
Elute the peptides from the cartridge using 1.6 ml organic buffer.
Dry the samples in a SpeedVac concentrator and resuspend in 500 μl 100 mM ABC.
Streptavidin enrichment and elution of persulfide-containing peptides
Centrifuge 1 ml avidin acrylamide resin at 845 × g for 1 min. Discard the supernatant.
Note: Resin is in 50% buffer, so 2 ml is required to achieve 1 ml total resin. Determine the volume of resin required for the amount (in mg) of protein used for each sample, according to the manufacturer’s specifications.
Equilibrate the resin three times by resuspending in 1 ml 100 mM ABC, centrifuging at 845 × g for 1 min, and removing the supernatant.
Add the resuspended peptides (Step C5 above) to the resin and incubate at room temperature for 1 h on a rotor.
Wash the resin with 75 ml 2 M NaCl in 100 mM ABC, warmed in a 37°C water bath, using a vacuum manifold.
Wash the resin with 15 ml 100 mM ABC warmed in a 37°C water bath.
Resuspend the resin in 1 ml 100 mM ABC, transfer to a clean 1.5-ml tube, and add TCEP to a final concentration of 20 mM. Incubate at 37°C on a rotor for 1 h. Centrifuge at 845 × g for 1 min and transfer the supernatant to a clean tube.
Repeat Step D6 and combine the supernatants as the eluent.
Add 37 mg IAM to the 2 ml combined eluent from Steps D6-D7 above and incubate at room temperature protected from light for 45 min.
Use a C18 Omix tip to concentrate and desalt the peptides using a standard protocol and analyze by LC-MS/MS (Procedure F).
Whole proteome analysis for data normalization
Dry 25-μg portions of protein from lysates (Procedure B) in a SpeedVac concentrator.
Resuspend proteins in 100 μl 8 M urea in 100 mM ABC containing 50 mM IAM and 5 mM TCEP and incubate at room temperature in the dark for 45 min.
Precipitate proteins by adding 25 μl 100% TCA (20% (v:v)) and place the samples at -20°C for 1 h. Subsequently, centrifuge the samples at 19,090 × g for 20 min at 4°C and discard the supernatant.
Wash the pellets with 500 μl cold acetone and centrifuge again at 19,090 × g for 20 min at 4°C.
Dry the samples in a SpeedVac concentrator, resuspend in 10 μl 8 M urea in 100 mM ABC, dilute to 1 M urea with 100 mM ABC, and digest overnight at 37°C by adding a 1:100 (w/w) ratio of trypsin.
Desalt the peptides with a C18 Omix Tip using a standard protocol and analyze by LC-MS/MS (Procedure F).
Mass spectrometry
Inject 1 μg peptides in 0.1% formic acid into the HPLC system and load onto a Symmetry C18 trapping column (180 μm × 20 mm, 5 μm).
Elute the peptides using a nanoACQUITY HPLC HHS T3 analytical column (75 μm × 150 mm, 1.8 μm) with an acetonitrile-based gradient (Solvent A: 0% acetonitrile, 0.1% formic acid; Solvent B: 80% acetonitrile, 0.1% formic acid) at a flow rate of 400 nl/min. Use a 90-min gradient as follows: 0-0.5 min, 0-14% B; 0.5-72 min, 14-50% B; 72-74 min, 50-100% B; 74-77 min, 100% B; 77-78 min, 100-0% B; 78-90 min, isocratic flow at 0% B.
Carry out the electrospray ionization with a nanoESI source at a capillary temperature of 260°C and a spray voltage of 1.8 kV.
Operate the Orbitrap Fusion instrument in data-dependent acquisition mode with a mass range of 350-2,000 m/z. Select the precursor ions for tandem mass (MS/MS) analysis in Orbitrap, with a 3-s cycle time using HCD at 35% collision energy. Set the intensity threshold at 5e3 and the dynamic exclusion with a repeat count of 1 and an exclusion duration of 30 s.
Search the resulting data against the A. baumannii ATCC 17978 database (UniProt UP000094982, 3,780 entries) in Proteome Discoverer 2.1. Allow trypsin digestion specificity with two missed cleavages. Set the mass tolerance for precursor and fragment ions to 10 ppm and 0.6 Da, respectively. Set the carbamidomethylation (CAM) of cysteine residues as a fixed modification. Set protein N-terminal acetylation, oxidation of methionine, protein N-terminal methionine loss, protein N-terminal methionine loss and acetylation, and pyroglutamine formation as variable modifications. Allow a total of three variable modifications.
Data analysis
For persulfidation enrichment (Procedure D), the total peptide peak area for all cysteine-containing peptides for each protein is used to estimate the fold-change and is filtered to exclude proteins found in fewer than two replicates of either condition. For whole proteome analysis (Procedure E), peptides found in greater than or equal to two replicates are used to calculate the total area for each protein. The fractional abundance of each protein is calculated relative to the total lysate (protein area/total lysate area) and used to estimate the fold-change. In both datasets, to eliminate division by zero, proteins that are not identified in one of the two conditions are assigned a peptide area or fractional abundance that is equal to or one order of magnitude lower than the least abundant protein identified by the peak area.
While in the past we have analyzed protein persulfidation in terms of a sigma ratio, σR (Peng et al., 2017b), this approach is obviously unable to distinguish increased persulfidation status from increased protein abundance. We therefore normalize the change in persulfidation ((S/N)SSH) to the change in protein abundance ((S/N)Abund) as shown in Eq. 1. Those with normalized persulfidation changes that are greater than 4-fold are considered potential regulatory targets. This significance threshold can be altered depending on how many proteins are identified. Alternatively, these data can be visualized in a log-log plot of persulfidation vs. abundance change (Figure 1B). In this manner, we recommend filtering the proteins based on P-value for the change in persulfidation. Typically, a threshold of P < 0.05 is applied, but more stringent criteria can be used. We note that a P-value cannot be assigned to proteins identified only in either WT or Na2S-treated cells and should not be eliminated from the analysis. In the log-log plot (Figure 1B), proteins that have significantly increased persulfidation status with either little-to-no change in protein abundance or decreased abundance are considered strong candidate regulatory targets of protein persulfidation, which requires validation using biochemical approaches using purified proteins.

Notes
While this protocol compares wild-type untreated cells with 0.2 mM Na2S-treated cells, different amounts of Na2S, incubation time (more or less than 30 min), or other sulfur donors, e.g., small molecule H2S or intracellular persulfide donors (Walsh and Giedroc, 2020) can be used to investigate proteome persulfidation. We note, however, that the vast majority (≥85%) of cysteines detected as persulfidated in this workflow as a result of exogenous sulfide treatment are also persulfidated in untreated cells, consistent with significant “background” persulfidation of the proteome in exponentially growing bacterial cells (Peng et al., 2017b; Walsh et al., 2020).
The LC-MS analysis was performed by the Laboratory of Biological Mass Spectrometry at Indiana University.
Recipes
Na2S stock
Weigh a small amount of Na2S in a 1.5-ml screw cap vial and dissolve in sufficient water to prepare a 0.2 M solution.
Immediately prepare 100-μl aliquots in 1.5-ml tubes and store at -80°C.
Discard Na2S stocks that are yellow in color as this is indicative of polysulfide impurities (Greiner et al., 2013; Luebke et al., 2014).
It is best to dissolve the Na2S inside an anaerobic chamber using water that has been degassed and purged with argon. If an anaerobic chamber is not available, prepare the Na2S stock immediately before use using degassed water.
PBS
8 g NaCl
0.2 g KCl
1.44 g Na2HPO4
0.24 g KH2PO4
Dissolve in 800 ml distilled H2O
Adjust pH to 7.4
Sterilize by autoclaving
Lysis Buffer
25 mM MES
500 mM NaCl
pH 6.0
It is essential that these buffers be extensively degassed, purged with argon, and stored in an anaerobic chamber to minimize oxidation during cell lysis.
Sep-Pak Aqueous Buffer
5 ml 10% trifluoroacetic acid or formic acid
455 ml distilled H2O
Sep-Pak Organic buffer
5 ml 10% trifluoroacetic acid or formic acid
250 ml acetonitrile
245 ml distilled H2O
Acknowledgments
This work was supported by R35 GM118157 from the National Institutes of Health (NIH). B.J.C.W. was supported by a Kratz Fellowship and a Quantitative and Chemical Biology Graduate Training Fellowship provided by the NIH (T32 GM109825; T32 GM131994). This content does not necessarily represent the views of the NIH and is solely the responsibility of the authors.
Competing interests
The authors have no competing interests to declare.
References
- Cuevasanta, E., Lange, M., Bonanata, J., Coitino, E. L., Ferrer-Sueta, G., Filipovic, M. R. and Alvarez, B. (2015). Reaction of Hydrogen Sulfide with Disulfide and Sulfenic Acid to Form the Strongly Nucleophilic Persulfide. J Biol Chem 290(45): 26866-26880.
- Cuevasanta, E., Reyes, A. M., Zeida, A., Mastrogiovanni, M., De Armas, M. I., Radi, R., Alvarez, B. and Trujillo, M. (2019). Kinetics of formation and reactivity of the persulfide in the one-cysteine peroxiredoxin from Mycobacterium tuberculosis. J Biol Chem 294(37): 13593-13605.
- Filipovic, M. R., Zivanovic, J., Alvarez, B. and Banerjee, R. (2018). Chemical Biology of H2S Signaling through Persulfidation. Chem Rev 118(3): 1253-1337.
- Fu, L., Liu, K., He, J., Tian, C., Yu, X. and Yang, J. (2020). Direct Proteomic Mapping of Cysteine Persulfidation. Antioxid Redox Signal 33(15): 1061-1076.
- Gao, X. H., Krokowski, D., Guan, B. J., Bederman, I., Majumder, M., Parisien, M., Diatchenko, L., Kabil, O., Willard, B., Banerjee, R., Wang, B., Bebek, G., Evans, C. R., Fox, P. L., Gerson, S. L., Hoppel, C. L., Liu, M., Arvan, P. and Hatzoglou, M. (2015). Quantitative H2S-mediated protein sulfhydration reveals metabolic reprogramming during the integrated stress response. Elife 4: e10067.
- Greiner, R., Palinkas, Z., Basell, K., Becher, D., Antelmann, H., Nagy, P. and Dick, T. P. (2013). Polysulfides link H2S to protein thiol oxidation. Antioxid Redox Signal 19(15): 1749-1765.
- Ida, T., Sawa, T., Ihara, H., Tsuchiya, Y., Watanabe, Y., Kumagai, Y., Suematsu, M., Motohashi, H., Fujii, S., Matsunaga, T., Yamamoto, M., Ono, K., Devarie-Baez, N. O., Xian, M., Fukuto, J. M. and Akaike, T. (2014). Reactive cysteine persulfides and S-polythiolation regulate oxidative stress and redox signaling. Proc Natl Acad Sci U S A 111(21): 7606-7611.
- Luebke, J. L., Shen, J., Bruce, K. E., Kehl-Fie, T. E., Peng, H., Skaar, E. P. and Giedroc, D. P. (2014). The CsoR-like sulfurtransferase repressor (CstR) is a persulfide sensor in Staphylococcus aureus. Mol Microbiol 94(6): 1343-1360.
- Luhachack, L., Rasouly, A., Shamovsky, I. and Nudler, E. (2019). Transcription factor YcjW controls the emergency H2S production in E. coli. Nat Commun 10(1): 2868.
- Mironov, A., Seregina, T., Nagornykh, M., Luhachack, L. G., Korolkova, N., Lopes, L. E., Kotova, V., Zavilgelsky, G., Shakulov, R., Shatalin, K. and Nudler, E. (2017). Mechanism of H2S-mediated protection against oxidative stress in Escherichiacoli. Proc Natl Acad Sci U S A 114(23): 6022-6027.
- Park, C. M., Macinkovic, I., Filipovic, M. R. and Xian, M. (2015). Chapter Three - Use of the "tag-switch" method for the detection of protein S-sulfhydration. Methods Enzymol 555:39-56.
- Peng, H., Shen, J., Edmonds, K. A., Luebke, J. L., Hickey, A. K., Palmer, L. D., Chang, F. J., Bruce, K. A., Kehl-Fie, T. E., Skaar, E. P. and Giedroc, D. P. (2017a). Sulfide Homeostasis and Nitroxyl Intersect via Formation of Reactive Sulfur Species in Staphylococcus aureus. mSphere 2(3): e00082-00017.
- Peng, H., Zhang, Y., Palmer, L. D., Kehl-Fie, T. E., Skaar, E. P., Trinidad, J. C. and Giedroc, D. P. (2017b). Hydrogen Sulfide and Reactive Sulfur Species Impact Proteome S-Sulfhydration and Global Virulence Regulation in Staphylococcus aureus. ACS Infect Dis 3(10): 744-755.
- Reisz, J. A., Bechtold, E., King, S. B., Poole, L. B. and Furdui, C. M. (2013). Thiol-blocking electrophiles interfere with labeling and detection of protein sulfenic acids. FEBS J 280(23): 6150-6161.
- Saini, V., Chinta, K. C., Reddy, V. P., Glasgow, J. N., Stein, A., Lamprecht, D. A., Rahman, M. A., Mackenzie, J. S., Truebody, B. E., Adamson, J. H., Kunota, T. T. R., Bailey, S. M., Moellering, D. R., Lancaster, J. R., Jr. and Steyn, A. J. C. (2020). Hydrogen sulfide stimulates Mycobacterium tuberculosis respiration, growth and pathogenesis. Nat Commun 11(1): 557.
- Shatalin, K., Shatalina, E., Mironov, A. and Nudler, E. (2011). H2S: a universal defense against antibiotics in bacteria. Science 334(6058): 986-990.
- Shen, J., Walsh, B. J. C., Flores-Mireles, A. L., Peng, H., Zhang, Y., Zhang, Y., Trinidad, J. C., Hultgren, S. J. and Giedroc, D. P. (2018). Hydrogen Sulfide Sensing through Reactive Sulfur Species (RSS) and Nitroxyl (HNO) in Enterococcusfaecalis. ACS Chem Biol 13(6): 1610-1620.
- Shukla, P., Khodade, V. S., SharathChandra, M., Chauhan, P., Mishra, S., Siddaramappa, S., Pradeep, B. E., Singh, A. and Chakrapani, H. (2017). "On demand" redox buffering by H2S contributes to antibiotic resistance revealed by a bacteria-specific H2S donor.Chem Sci 8(7): 4967-4972.
- Toliver-Kinsky, T., Cui, W., Toro, G., Lee, S. J., Shatalin, K., Nudler, E. and Szabo, C. (2019). H2S, a Bacterial Defense Mechanism against the Host Immune Response. Infect Immun 87(1): e00272-00218.
- Walsh, B. J. C. and Giedroc, D. P. (2020). H2S and reactive sulfur signaling at the host-bacterial pathogen interface. J Biol Chem 295(38): 13150-13168.
- Walsh, B. J. C., Wang, J., Edmonds, K. A., Palmer, L. D., Zhang, Y., Trinidad, J. C., Skaar, E. P. and Giedroc, D. P. (2020). The Response of Acinetobacter baumannii to Hydrogen Sulfide Reveals Two Independent Persulfide-Sensing Systems and a Connection to Biofilm Regulation. mBio 11(3): e01254-01220.
- Zhang, D., Macinkovic, I., Devarie-Baez, N. O., Pan, J., Park, C. M., Carroll, K. S., Filipovic, M. R. and Xian, M. (2014). Detection of protein S-sulfhydration by a tag-switch technique. Angew Chem Int Ed Engl 53(2): 575-581.
- Zhu, W., Smith, J. W. and Huang, C. M. (2010). Mass spectrometry-based label-free quantitative proteomics. J Biomed Biotechnol 2010: 840518.
- Zivanovic, J., Kouroussis, E., Kohl, J. B., Adhikari, B., Bursac, B., Schott-Roux, S., Petrovic, D., Miljkovic, J. L., Thomas-Lopez, D., Jung, Y., Miler, M., Mitchell, S., Milosevic, V., Gomes, J. E., Benhar, M., Gonzalez-Zorn, B., Ivanovic-Burmazovic, I., Torregrossa, R., Mitchell, J. R., Whiteman, M., Schwarz, G., Snyder, S. H., Paul, B. D., Carroll, K. S. and Filipovic, M. R. (2019). Selective Persulfide Detection Reveals Evolutionarily Conserved Antiaging Effects of S-Sulfhydration. Cell Metab 30(6): 1152-1170 e1113.
Article Information
Copyright
© 2021 The Authors; exclusive licensee Bio-protocol LLC.
How to cite
Walsh, B. J. C. and Giedroc, D. P. (2021). Proteomics Profiling of S-sulfurated Proteins in Acinetobacter baumannii. Bio-protocol 11(9): e4000. DOI: 10.21769/BioProtoc.4000.
Category
Biochemistry > Protein > Posttranslational modification
Microbiology > Microbial proteomics > Whole organism
Do you have any questions about this protocol?
Post your question to gather feedback from the community. We will also invite the authors of this article to respond.