- Protocols

- Articles and Issues
- For Authors
- About
- Become a Reviewer

Resolving Structural Changes of Photoreceptors in Living Escherichia coli via In-cell Infrared Difference Spectroscopy
Published: Vol 11, Iss 3, Feb 5, 2021 DOI: 10.21769/BioProtoc.3909 Views: 4568
Reviewed by: Ali Asghar KermaniShailesh KumarAnonymous reviewer(s)
Original research article
The authors used this protocol in:
Aug 2020
Advertisement


Protocol Collections
Comprehensive collections of detailed, peer-reviewed protocols focusing on specific topics


Related protocols
Abstract
Several in-cell spectroscopic techniques have been developed recently to investigate the structure and mechanism of proteins in their native environment. Conditions in vivo differ dramatically from those selected for in vitro experiments. Accordingly, the cellular environment can affect the protein mechanism for example by molecular crowding or binding of small molecules. Fourier transform infrared (FTIR) difference spectroscopy is a well-suited method to study the light-induced structural responses of photoreceptors including changes in cofactor, side chains and secondary structure. Here, we describe a protocol to study the response of cofactor and protein in living E. coli cells via in-cell infrared difference (ICIRD) spectroscopy using the attenuated total reflection (ATR) configuration. Proteins are overexpressed in E. coli, the cells are transferred into saline solution and the copy number per cell is determined using fluorescence spectroscopy. The suspension is centrifuged and the concentrated cells transferred onto the ATR cell inside the FTIR spectrometer. The thermostatted cell is sealed and illuminated from the top with an LED. Intensity spectra are recorded before and after illumination to generate the difference spectrum of the receptor inside the living cell. With ICIRD spectroscopy, structural changes of soluble photoreceptors are resolved in a near-native environment. The approach works in H2O at ambient conditions, is label free, without any limitations in protein size and does not require any purification step.
Graphic abstract:
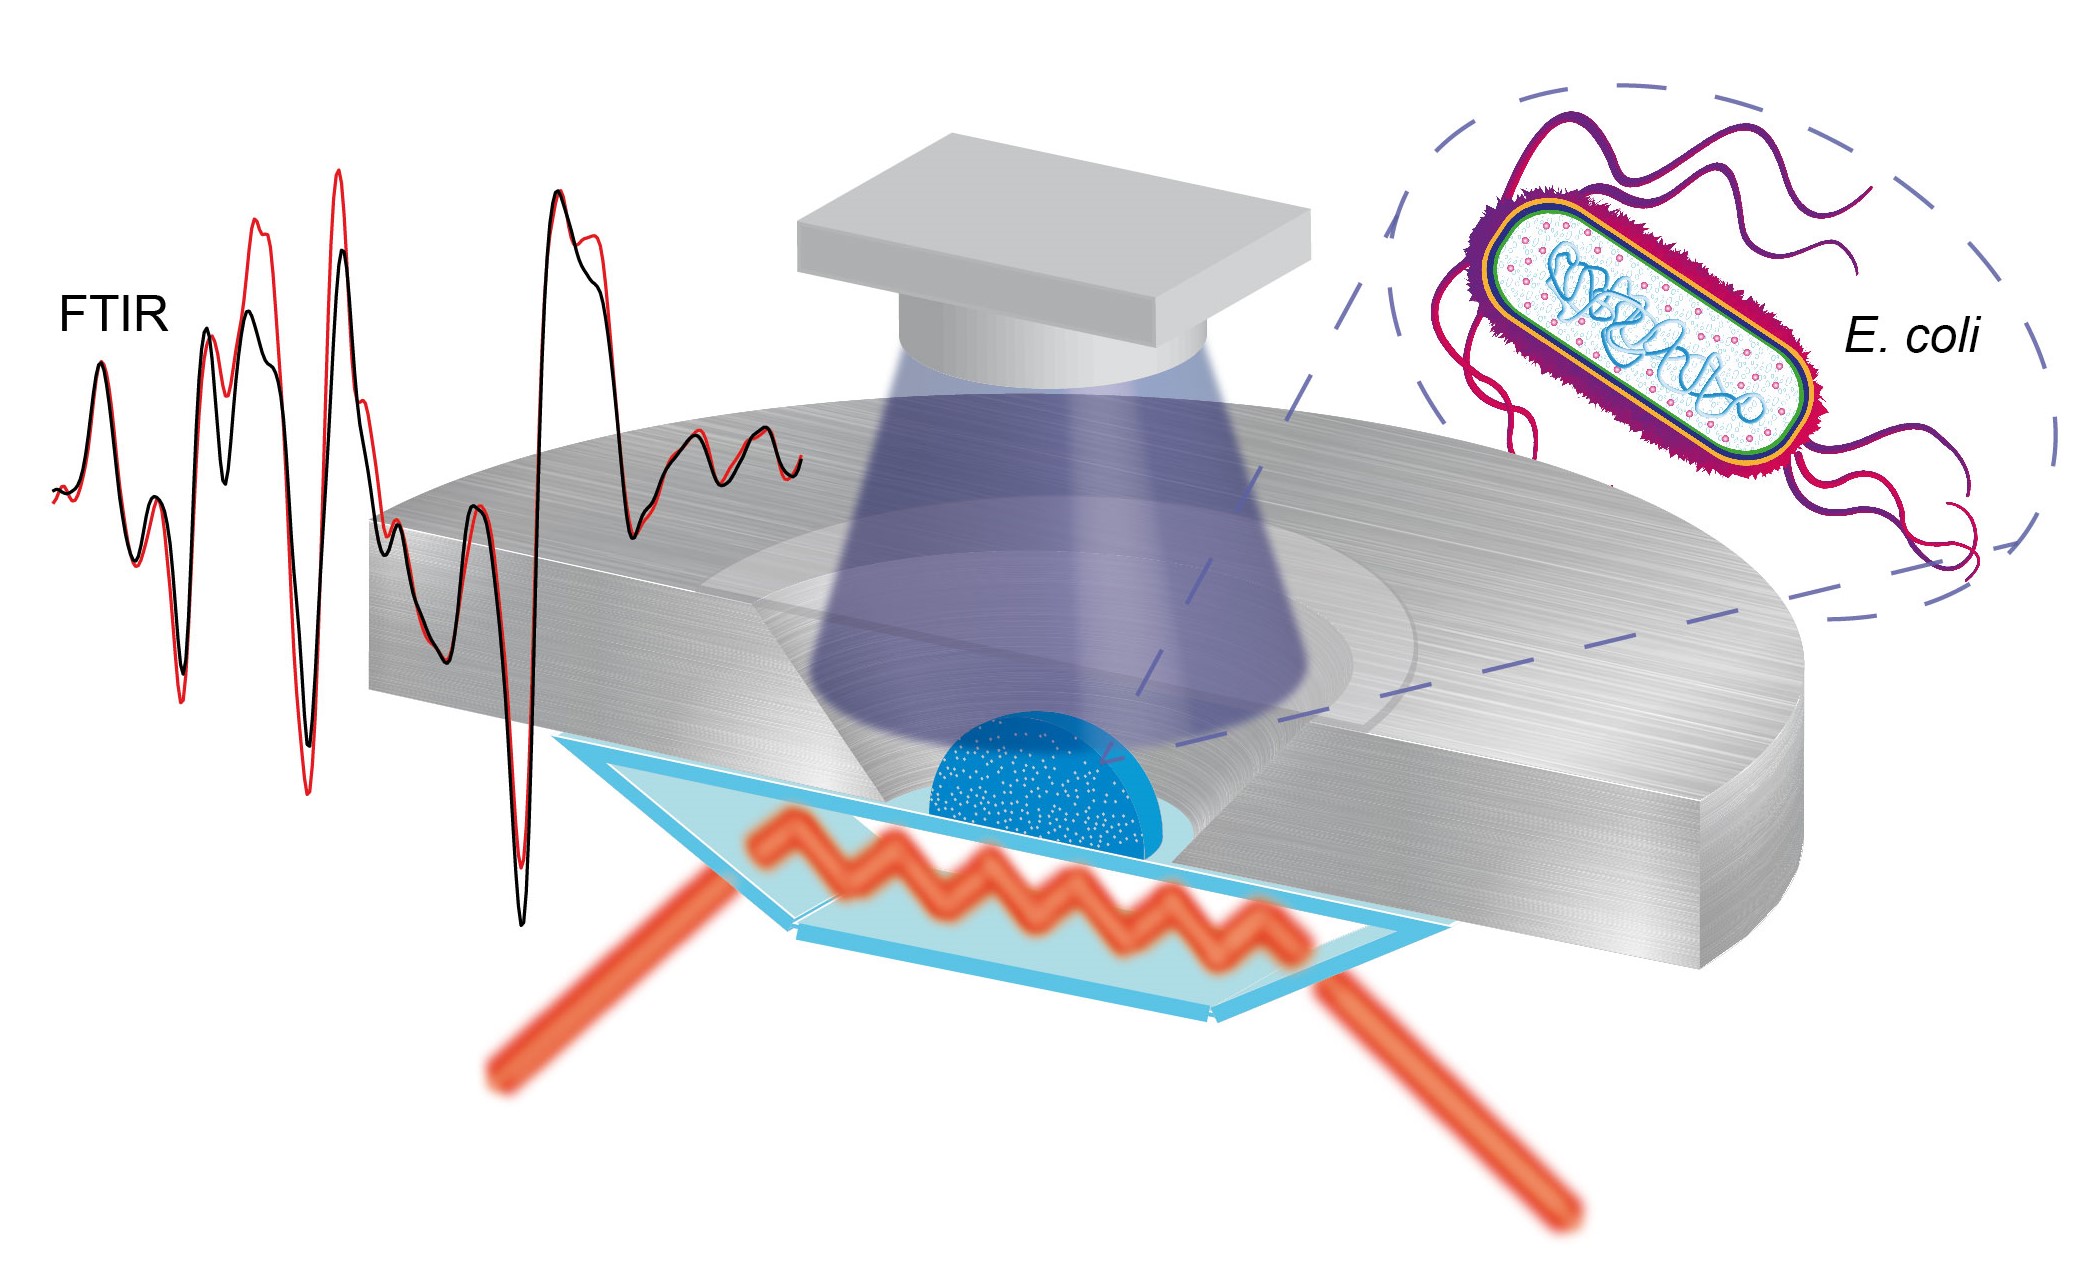
In-cell infrared difference spectroscopy on photoreceptors in living E. coli using attenuated total reflection.
Background
Photoreceptors play an essential role in light sensing and light adaption in organisms varying from bacteria, fungi, algae and plants to animals (Möglich et al., 2010; Gomelsky and Hoff, 2011; Losi and Gärtner, 2012; Ernst et al., 2014; Jaubert et al., 2017). The photoreceptors are usually studied in a well-defined buffer in vitro, but deviations between in vitro and in vivo conditions might change the mechanisms of the receptors. Methods to investigate the light-induced response of photoreceptors in the cellular environment have been developed including UV-visible, fluorescence and EPR spectroscopy (Butler et al., 1963; Hennig et al., 1999; Banerjee et al., 2007; Bouly et al., 2007). These important studies address the investigation of the cofactor and its photoreaction, but provide only limited information about the protein moiety.
FTIR difference spectroscopy is a well-established method to reveal the structural response to light of cofactor and protein moiety in vitro (Mäntele, 1993; Barth and Zscherp, 2002; Garczarek and Gerwert, 2006; Kottke et al., 2017). IR difference spectroscopy was applied to study the response of the insoluble membrane photoreceptor rhodopsin to light in single animal rod cells using synchrotron radiation (Quaroni et al., 2011). Rod cells were chosen, because they contain a high native concentration of rhodopsin in the membrane. Soluble photoreceptors include many different receptor families such as the light, oxygen and voltage (LOV) proteins, cryptochromes, blue light using flavin proteins, phytochromes or photoactive yellow proteins, and are usually present at low concentrations in the cytosol of the native host. We recently developed the ICIRD spectroscopy in the transmission mode and the ATR configuration to study the light-induced structural response of the soluble LOV domains in tandem with the effector domain in living E. coli cells at only 300,000 copies per cell using an FTIR spectrometer (Goett-Zink et al., 2020). ICIRD spectroscopy might be extended to study members of other photoreceptor families and the evolution of structural changes by combination with a time-resolved approach. Moreover, other receptors and enzymes might be investigated in living cells by a combination with optogenetic tools.
Materials and Reagents
Disposable cuvettes 2.5 ml macro PMMA (Brand, catalog number: 7591 05 )
Centrifuge tubes 50 ml (VWR, catalog number: 525-1099 )
Eppendorf tubes 2 ml (Merck, catalog number: BR780546-500EA )
Pipette tips 0.5-5 ml (Roth, catalog number: HL73.1 )
Pipette tips 200 µl (Th. Geyer, catalog number: 7695843 )
Fluorescence cuvette for magnetic stirrers, 10 × 4 mm (Hellma, catalog number: 119004F-10-40 )
Round coverslip Ø 15 mm (Roth, catalog number: P232.1 )
BL21 (DE3) competent cells (Thermo Fisher Scientific, catalog number: EC0114 )
Milli-Q water
Agar-Agar, BioScience (Roth, catalog number: 6494.1 )
Kanamycin monosulfate (MP Biomedicals, catalog number: 11476412 )
Sodium chloride (Roth, catalog number: 9265.1 )
Potassium chloride (Roth, catalog number: 6781.1 )
di-Potassium hydrogen phosphate (VWR, catalog number: 71003-452 )
Potassium di-hydrogen phosphate (VWR, catalog number: BDH9268-500G )
Tryptone (MP Biomedicals, catalog number: 1010817 )
Yeast extract powder (MP Biomedicals, catalog number: 103303 )
Isopropyl-β-d-thiogalactopyranoside (MP Biomedicals, catalog number: 102101 )
Liquid nitrogen (Linde)
Silicone-free laboratory grease (VWR, catalog number: DECO514215.00-CA15 )
Double yeast tryptone (DYT) medium (see Recipes)
Saline solution (see Recipes)
Phosphate buffer 50 mM, pH 8.0, NaCl 300 mM (see Recipes)
Equipment
Pipette 2-20 µl (Brand, catalog number: 705870 )
Pipette 20-200 µl (Brand, catalog number: 705882 )
Pipette 0.5-5 ml (Brand, catalog number: 705882 )
Erlenmeyer flask 500 ml (Roth, catalog number: C139.1 )
Erlenmeyer flask with chicanes (Roth, catalog number: C139.1 ) (chicanes home-built)
Magnetic stir bar Ø 3-4 mm, length 6-7 mm (Hellma, catalog number: 323-300-VE10 )
Incubator, Multitron Standard (INFORS HT)
Refrigerated centrifuge, Multifuge 3 L-R (Thermo Fisher Scientific, catalog number: 10563772 )
Centrifuge, Mikro 200 (Hettich, catalog number: 2405 )
Cell density meter, Ultrospec 10 (Biochrom, catalog number: 80-2116-300 )
Fluorescence spectrometer, Spectrofluorometer FP-8300 (Jasco)
Absorptive neutral density filter, Schott NG 4, Ø 25 mm, 3 mm thickness, 2.6% (Edmund Optics, catalog number: 14-091 )
FTIR spectrometer, IFS 66v or IFS 66/s (Bruker)
ATR unit for FTIR spectrometer, MIRacle Base Optics/Platform Assembly (Pike Technologies, catalog number: 025-1850 )
Nine-reflection diamond/ZnSe performance crystal plate, with trough (Pike Technologies, catalog number: 025-2218 )
IR bandpass filter, 5% cut-on at 5.35 µm, 5% cut-off at 9 µm, Ø 25 mm (Laser Components, catalog number: 3007570 )
Dry air generator, dew point -70 °C (Balston)
Water cooling unit for crystal plate (home-built), alternative: digital temperature control module (Pike Technologies, catalog number: 076-1220 and 076-1420 )
Refrigerated circulator, digital temperature controller (PolyScience)
LED 451 nm, 60 mW·cm-2 at the sample, Luxeon Star/O (Phillips Lumileds) (might be adapted for photoreceptors other than LOV)
LED holder (home-built)
Light shaping diffuser, 5°, diffuser kit, circular light shaping, narrow, Ø 25.4 mm (Newport, catalog number: 10DKIT-C1 )
Software
OPUS 7.5 (Bruker, www.bruker.com)
OriginPRO 2020 (OriginLab, www.originlab.com)
Procedure
Protein expression (might be adapted for photoreceptors other than LOV)
Transform competent E. coli BL21 (DE3) cells with your desired plasmid and grow them on agar plate with 50 µg/ml Kanamycin as selection antibiotic.
Pick one colony from agar plate and transfer it to 200 ml DYT medium with 50 µg/ml Kanamycin as selection antibiotic in an Erlenmeyer flask without chicanes.
Incubate cells over night (approx. 15 h) at 37 °C and 120 rpm.
Transfer 2 ml of the cell culture to 200 ml of fresh DYT medium with 50 µg/ml Kanamycin as selection antibiotic in an Erlenmeyer flask with chicanes.
Incubate at 37 °C and 120 rpm.
Reduce the temperature to 18 °C when the cell culture reaches an OD600 of 0.5. Check the optical density with the cell density meter and disposable cuvettes.
Add isopropyl-β-d-thiogalactopyranoside (final concentration 10 µM) when the cell culture reaches OD600 of 0.8.
Incubate cell culture over night (approx. 18 h) at 18 °C and 120 rpm in the dark.
From now on, all preparation steps need to be performed in the dark using a red headlamp or at very low light intensities.
Sample preparation
Sample preparation for ICIRD spectroscopy
Precool the centrifuge to 4 °C.
Transfer 45 ml of the cell culture to a 50 ml centrifuge tube.
Centrifuge the cell culture at 4 °C and 3,500 × g for 15 min.
Discard the supernatant and add 30 ml precooled saline solution.
Gently resuspend the cell pellet by pipetting up and down with a 5 ml pipette.
Centrifuge the cell suspension at 4 °C and 3,500 × g for 15 min.
Repeat Steps B1d, B1e and B1f two more times.
Discard the supernatant and remove the remaining supernatant with a 200 µl pipette.
Add 200 µl of the saline solution.
Gently resuspend the cell pellet by stirring the cells with a pipette tip.
Keep cells on ice. Use the sample on the same day for investigation.
Sample preparation for validation of expression (if photoreceptor shows fluorescence)
Precool the centrifuge to 4 °C.
Transfer 45 ml of the cell culture to a 50 ml centrifuge tube.
Centrifuge the cell culture at 4 °C and 3,500 × g for 15 min.
Discard the supernatant and add 30 ml precooled phosphate buffer.
Gently resuspend the cell pellet by pipetting up and down with a 5 ml pipette.
Centrifuge the cell suspension at 4 °C and 3,500 × g for 15 min.
Repeat Steps B2d, B2e and B2f two more times.
Discard the supernatant
Resuspend the cell pellet in phosphate buffer and dilute the cell suspension to an OD600 of 1.5.
Keep cells on ice. Use the sample on the same day for investigation.
Validation of expression level with fluorescence spectroscopy (if photoreceptor shows fluorescence)
Transfer 1.5 ml of the cell suspension from Step B2 in a fluorescence cuvette with a magnetic stir bar.
Set the magnetic stirrer to 800 rpm.
Reduce the excitation light with a 2.6% transmission filter to prevent photobleaching.
Set temperature control to 20 °C.
Place the fluorescence cuvette in the fluorescence spectrometer and record an emission spectrum. For flavin-binding photoreceptors such as LOV the settings in Table 1 are applied.
Table 1. Settings for in-cell fluorescence spectroscopy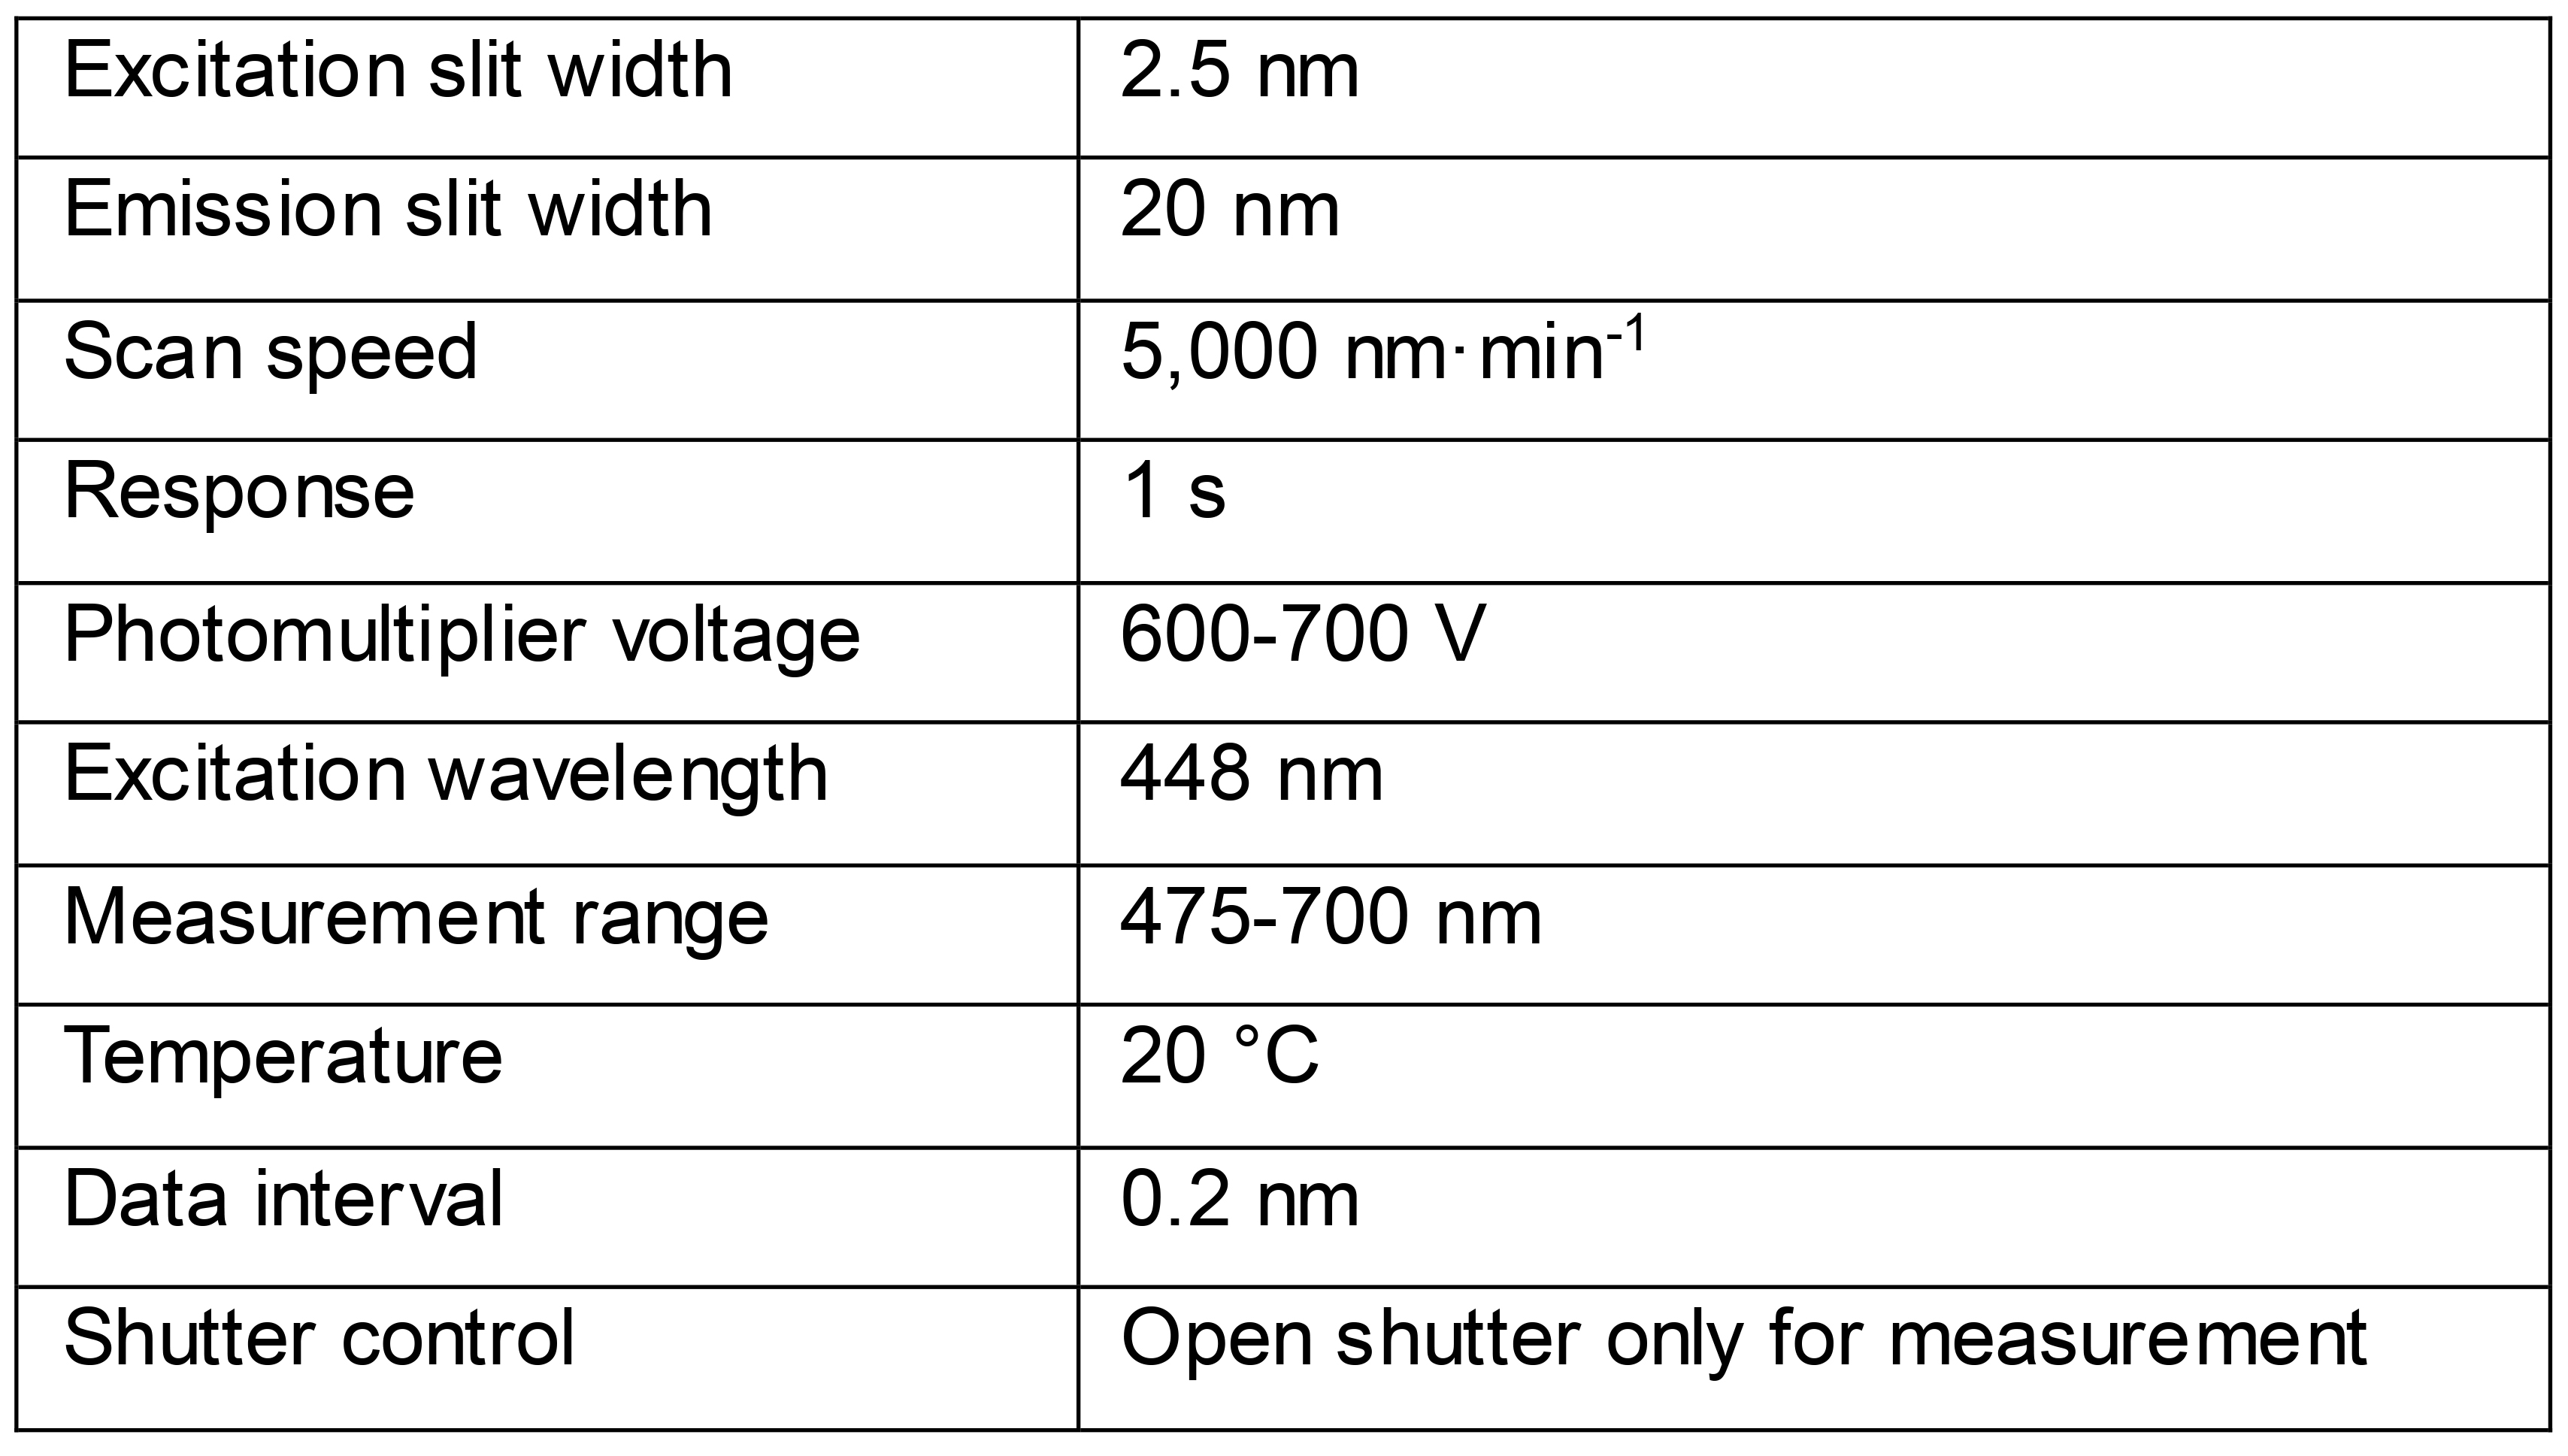
Repeat the measurements in an interval of 30 min until the fluorescence emission is constant.
Compare emission spectrum with literature data on purified protein. Use non-transformed cells once to check for autofluorescence.
The protein copy number per cell can be determined by cell counting and correlating the fluorescence intensity with the protein concentration (Goett-Zink et al., 2020).
ICIRD spectroscopy
Cool down the mercury cadmium telluride detector with liquid nitrogen and let the detector equilibrate for 30 min.
Place the IR filter in the ATR unit to block light ≥ 2,000 cm-1 (see Figure 1B, red arrow) and attach the telescopic tubes (see Figure 1C).
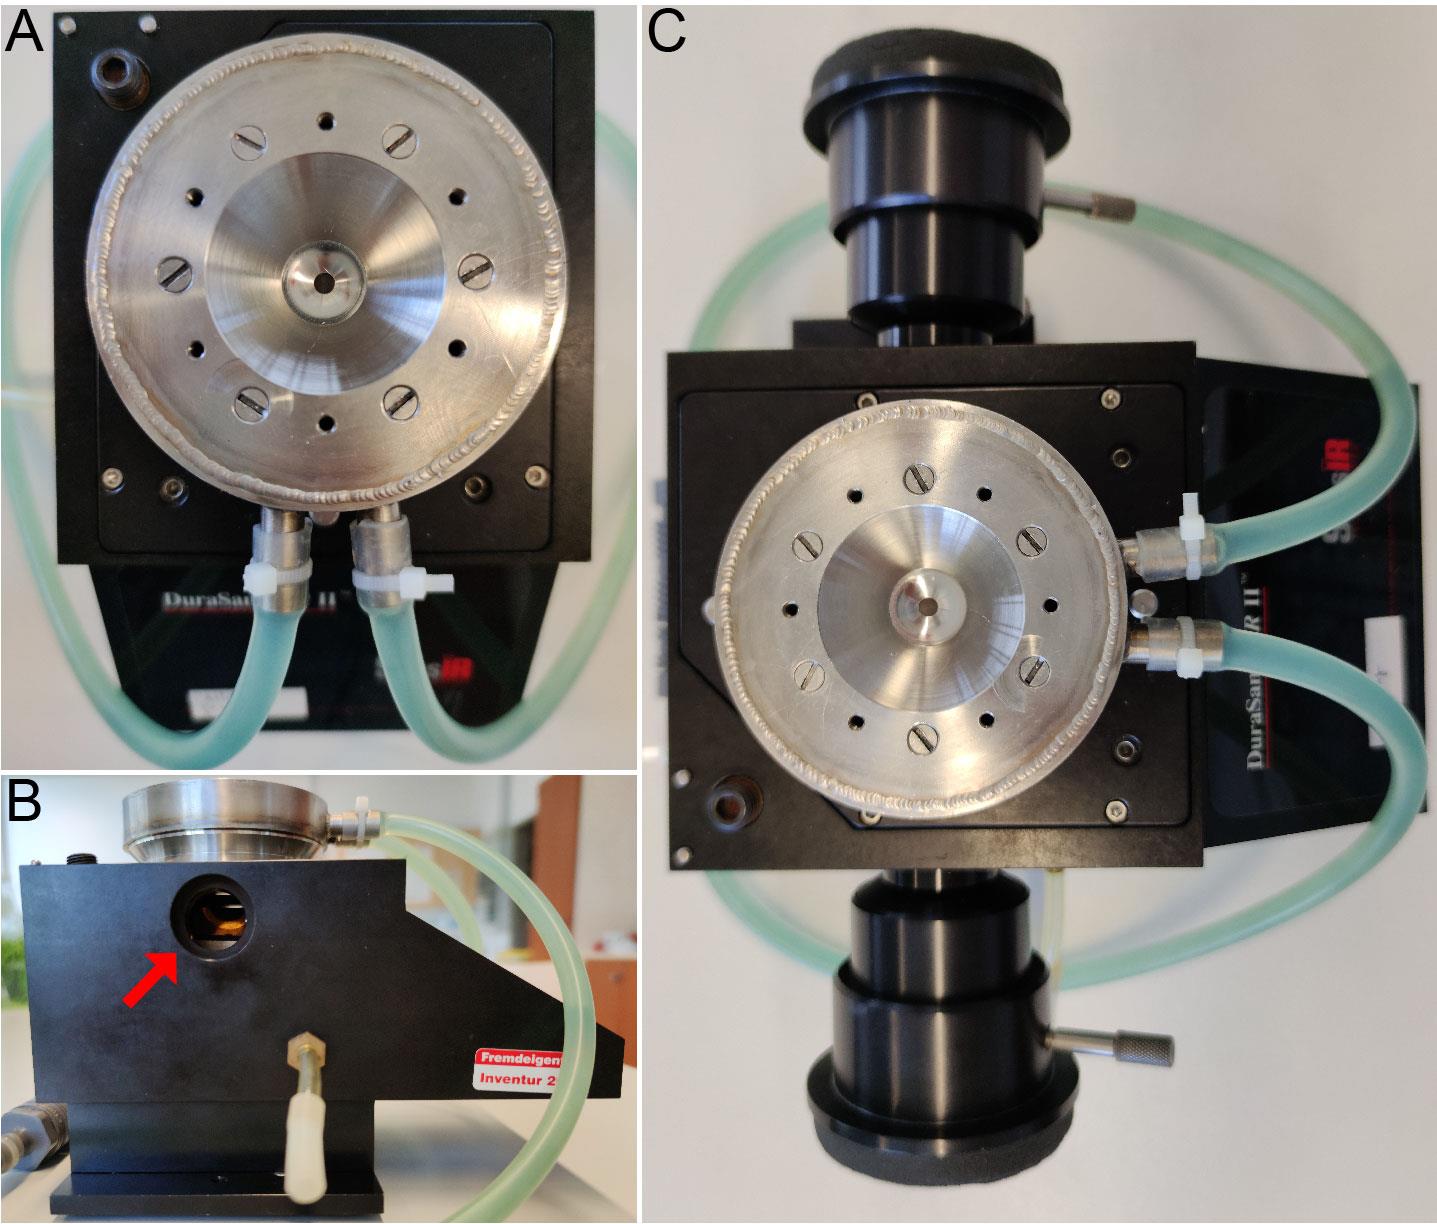
Figure 1. ATR unit mounted with a crystal plate and a water cooling unit. The ATR unit for ICIRD spectroscopy is shown in the top view (A), the side view (B) and with mounted telescopic tubes (C). The red arrow in (B) indicates the position for mounting the IR filter.Place the ATR unit with the crystal plate in the IR spectrometer and align to maximal counts.
Purge the ATR unit with dry air and connect the refrigerated circulator to the water cooling unit.
Cool down the crystal plate to 10 °C.
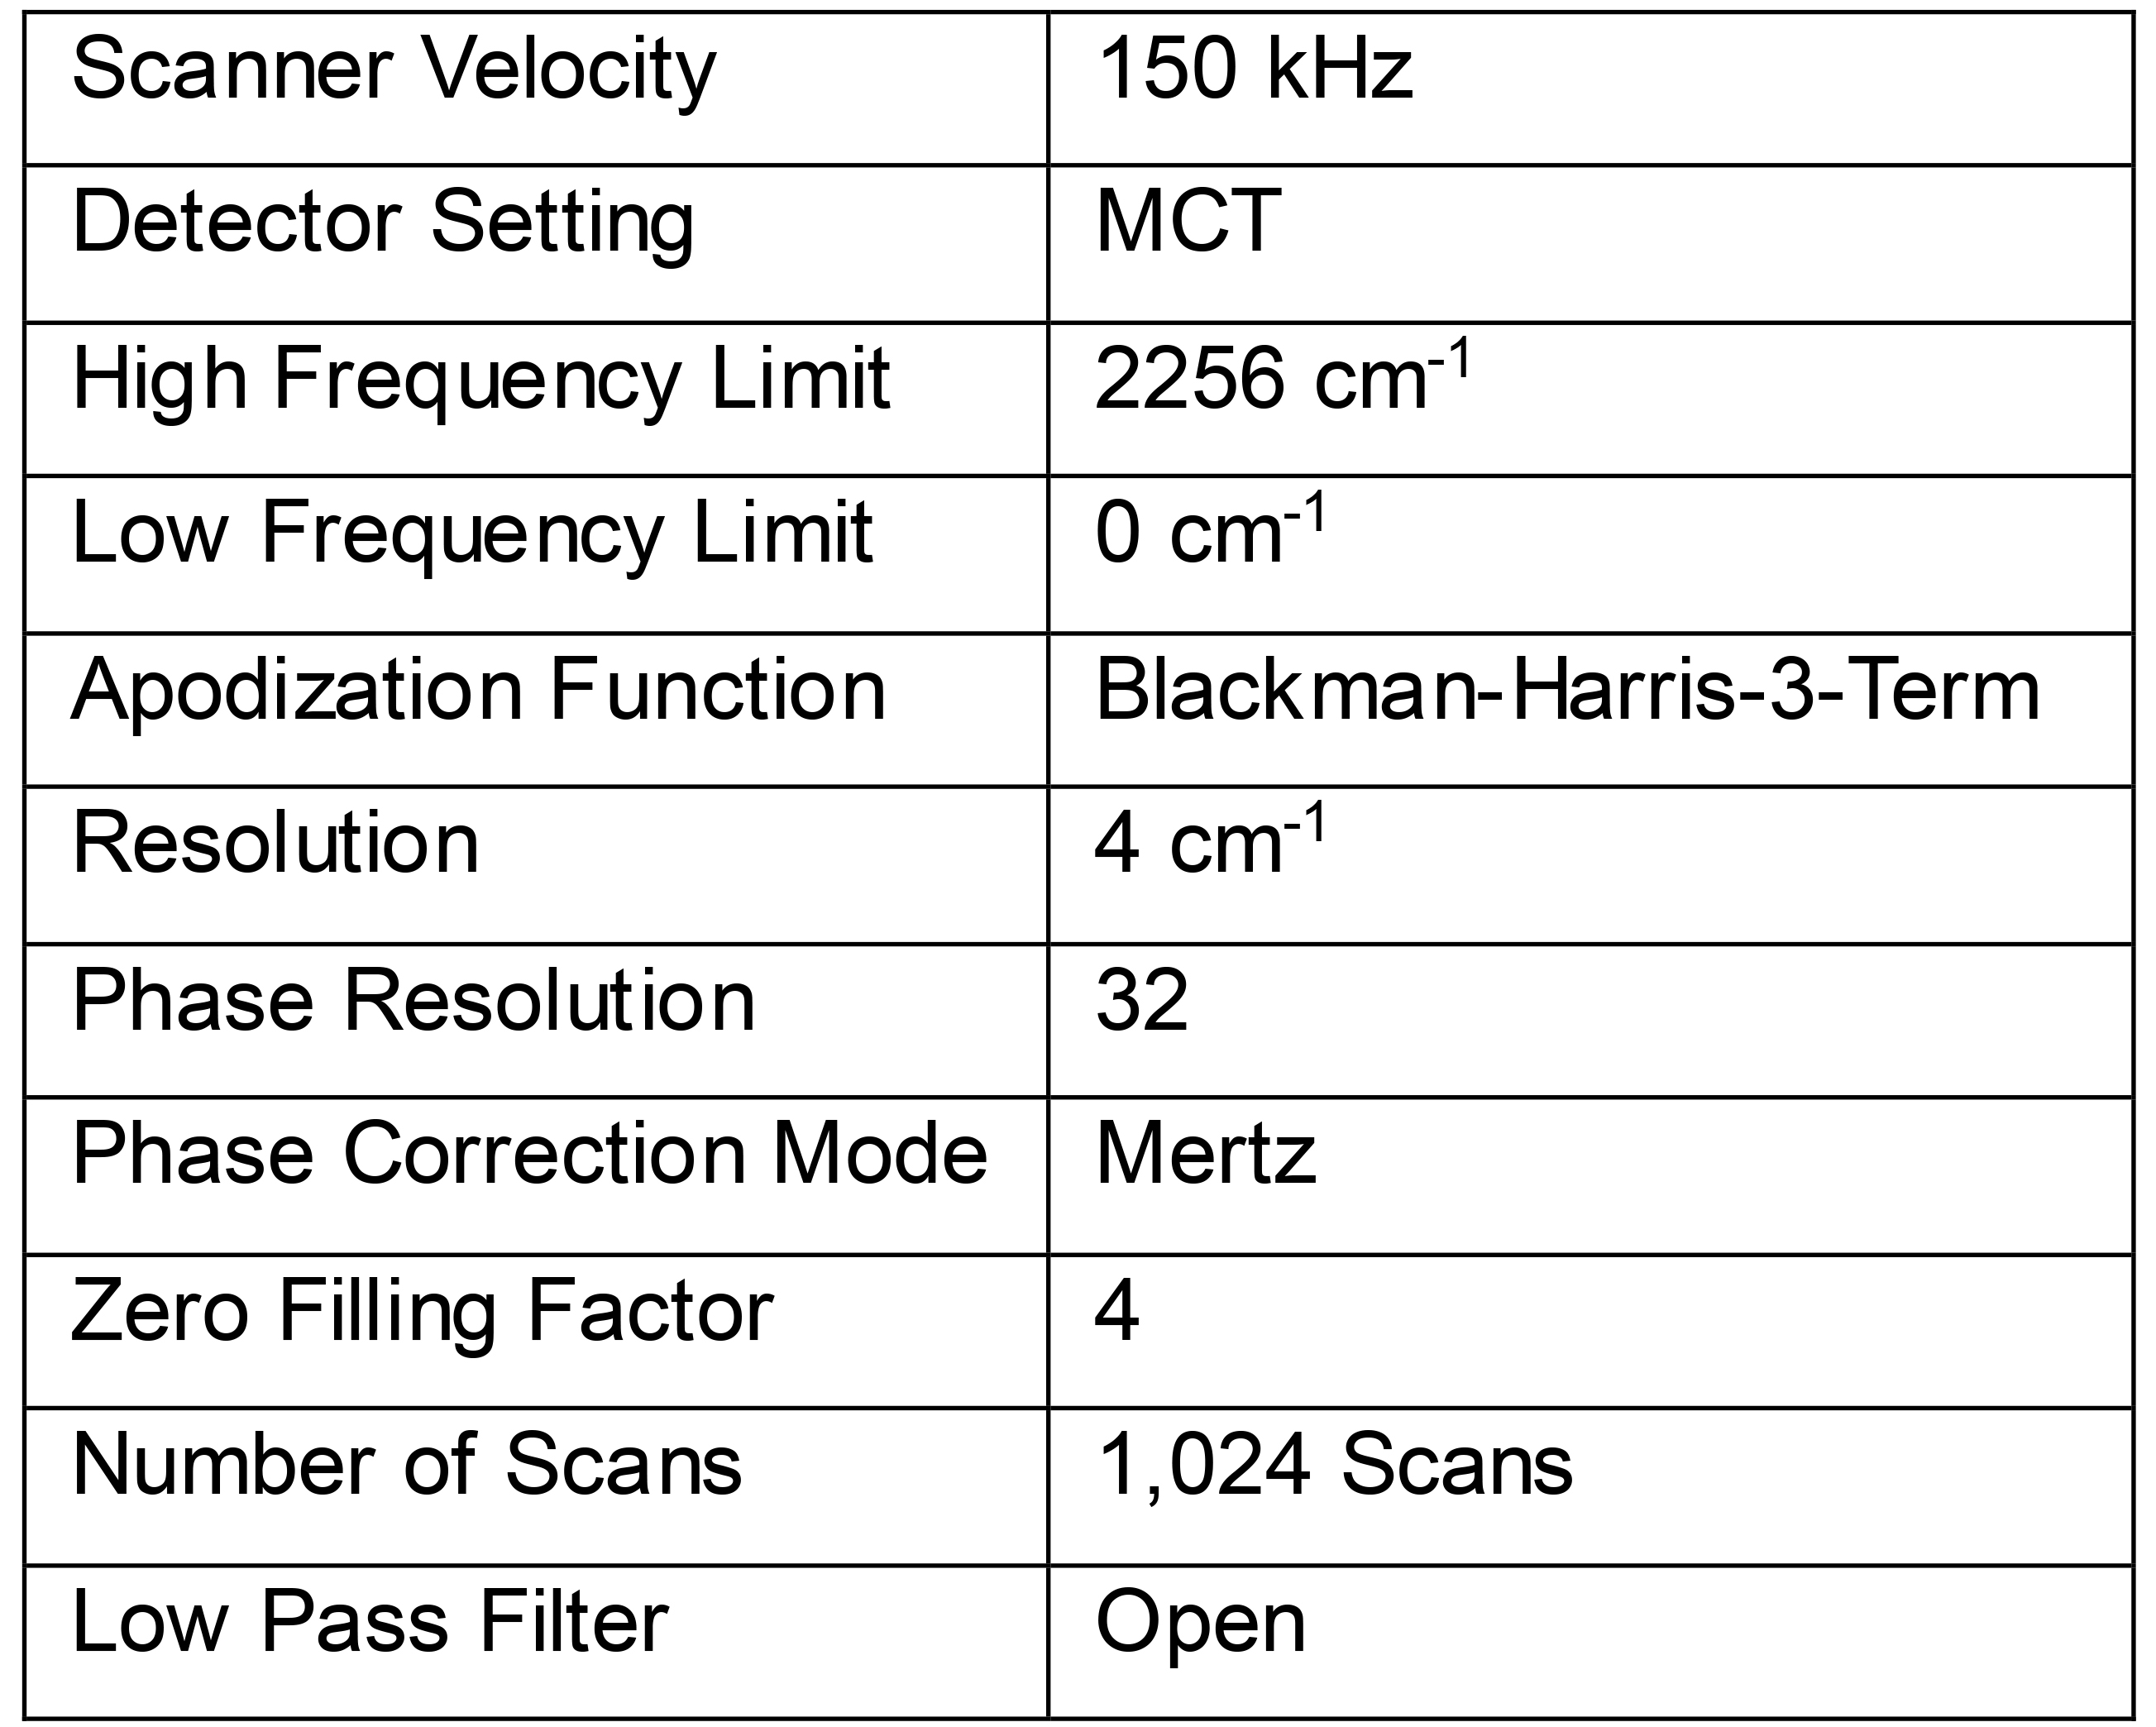
Select the following settings for FTIR experiments (Table 2):
Table 2. Settings for an ICIRD spectroscopic experiment
Record 1,024 scans of background intensity of the empty crystal.
Place 15 µl of the cell suspension from Step B1 on the crystal plate and make sure that the crystal is fully covered with the sample.
Put silicone-free laboratory grease on the sidelines of a round coverslip, place it on top of the crystal plate and make sure that the grease fully encloses the compartment to prevent evaporation.
Install the LED with the circular light shaping diffuser (5°) on top of the water cooler unit for the crystal plate and record 1,024 scans of sample intensity of the cells. Make sure that in the resulting absorbance spectrum the ratio of amide I/water to amide II is ≥ 2.2 to provide for sufficient hydration of the sample. A typical absorbance spectrum of E. coli cells in saline solution is shown in Figure 2.
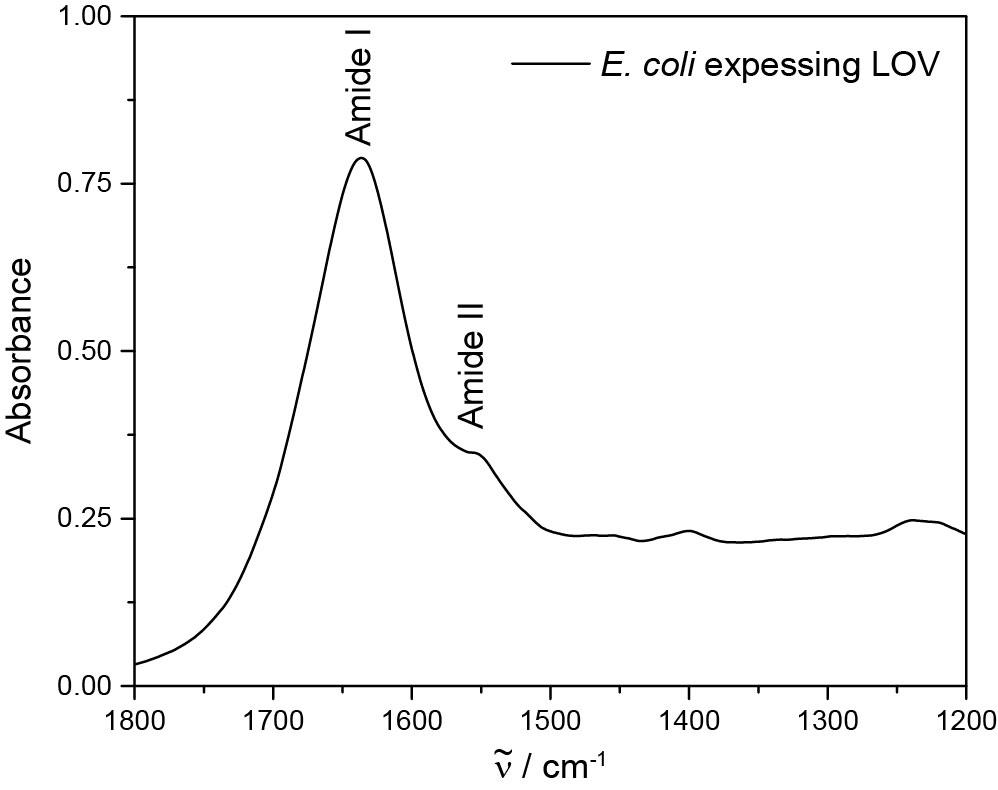
Figure 2. FTIR absorbance spectrum of E. coli BL21 expressing LOV protein. The amide I band and the amide II band appear at around 1,640 cm-1 and 1,550 cm-1, respectively, overlayed by strong water contributions at around 1,650 cm-1. The ratio of amide I/water to amide II needs to be higher than 2.2 to ensure a sufficient hydration of the sample. The spectrum is not corrected for the wavelength dependence of the penetration depth.Let the sample equilibrate for at least 30 min and record baselines of the sample with 3,072 scans (background and sample intensities without illumination) until the difference absorbance approaches zero in the region of 1,800-1,200 cm-1. A representative baseline is shown in Figure 3.
Record 3,072 scans of background intensity, illuminate the sample directly for 2-10 s (keep illumination time as short as possible) and afterwards record 3,072 scans of sample intensity. The resulting difference absorbance spectrum shows characteristic difference signals. A single experiment of the LOV domain of the aureochrome1a from Phaeodactylum tricornutum is shown in Figure 3.
Wait for recovery of the photoreceptor to the dark state and repeat Step D12. If the photoreceptor recovery takes too long (more than one hour) or is irreversible, clean up the crystal plate and start again with Step D7 for a new sample preparation. Average enough difference absorbance spectra for a good signal-to-noise ratio.
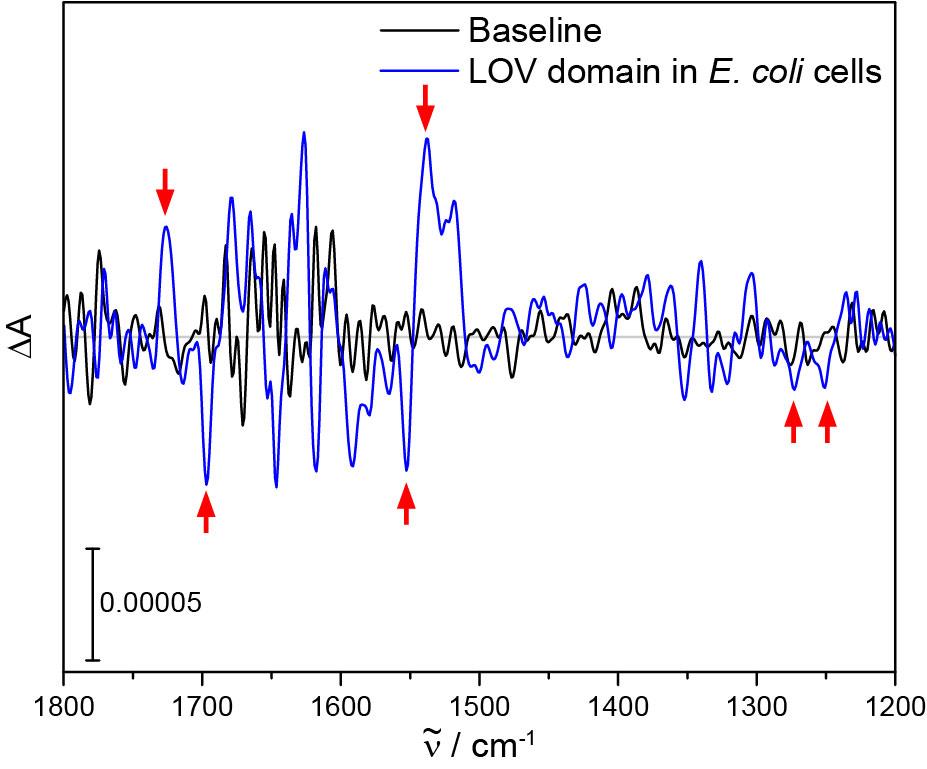
Figure 3. Light-induced FTIR difference spectrum of LOV proteins in E. coli BL21 cells. A total copy number of 500,000 LOV proteins per cell is already sufficient to see small but characteristic signals of the light-induced structural response of LOV (red arrows) in the difference spectrum after one experiment with 3,072 scans. In the difference spectrum, signals originate from vibrational modes that are changed by illumination. Positive signals represent contributions from the sample after illumination and negative signals represent those from the sample before illumination. The noise level can be estimated from a baseline measured with 3,072 scans.
Validation of the intracellular localization of proteins and of intactness of the cells (might be adapted for photoreceptors other than LOV)
Remove the coverslip from the crystal plate after the difference absorption experiment.
Add 800 µl of the saline solution to the cells placed on the crystal plate (after the ICIRD experiments in Step D12) and gently resuspend the cells by pipetting up and down.
Transfer the cell suspension in a 50 ml centrifuge tube and dilute the suspension to an OD600 of 1.5 with the saline solution.
Transfer the diluted cell suspension in a fluorescence cuvette with a magnetic stir bar.
Set the magnetic stirrer to 800 rpm.
Reduce the excitation light with a 2.6% transmission filter.
Set the temperature control to 20 °C.
Place the fluorescence cuvette in the fluorescence spectrometer and record an emission spectrum. Use settings from Table 1.
Transfer the cell suspension from the fluorescence cuvette to a 2 ml Eppendorf tube and centrifuge the cell suspension at 3,500 × g for 15 min.
Transfer the supernatant to a clean fluorescence cuvette and record an emission spectrum. The cells are intact and the protein is located intracellularly, if fluorescence emission is detected in the cell suspension but not in the supernatant.
Data analysis
Use OPUS to evaluate the difference spectra and to average representative spectra.
Use the OPUS tool for rubberband baseline correction to correct the averaged difference spectrum for possible baseline drifts.
Spectra can be plotted and finalized for publication with OriginPRO 2020.
If an in vitro difference spectrum of the photoreceptor is available, compare it with the in-cell difference spectrum by scaling to the signals of the cofactor.
Notes
Do not touch the crystal plate with the pipette tip. Clean the crystal plate only with Milli-Q water, ethanol (p.a.) and precision wipes.
Positive signals in the amide I and amide II regions in the baseline of the difference absorbance measurements are caused by cell sedimentation. Do not record any difference spectra, while this sedimentation occurs. If these signals do not disappear after one hour of equilibration, exchange the cell sample.
The difference absorbance spectrum is calculated from the intensity spectrum before illumination Idark and the intensity spectrum after illumination Iilluminated using the following equation:

The resulting difference spectrum in Figure 3 shows the difference absorbance ΔA as a function of the wavenumber.
Recipes
DYT medium (autoclaved)
5 g Yeast extract powder
10 g Tryptone
5 g NaCl
Fill up to 1,000 ml with MilliQ water
Saline solution (sterile by filtration)
8.766 g NaCl
0.373 g KCl
Fill up to 1,000 ml with MilliQ water
Phosphate buffer 50 mM, pH 8.0, NaCl 300 mM (sterile by filtration)
0.819 g K2HPO4
0.041 g KH2PO4
17.532 g NaCl
Fill up to 1,000 ml with MilliQ water
Acknowledgments
This work was supported by Deutsche Forschungsgemeinschaft Grant KO3580/7-1 and Heisenberg Fellowship KO3580/4-2. We thank Ina Ehring for technical assistance and Carolin Metzger for designing the illustration. The protocol has been employed for the study of LOV photoreceptors (Goett-Zink et al., 2020).
Competing interests
The authors declare no conflicts of interest or competing interests.
References
- Banerjee, R., Schleicher, E., Meier, S., Viana, R. M., Pokorny, R., Ahmad, M., Bittl, R. and Batschauer, A. (2007). The signaling state of Arabidopsis cryptochrome 2 contains flavin semiquinone. J Biol Chem 282(20): 14916-14922.
- Barth, A. and Zscherp, C. (2002). What vibrations tell us about proteins. Q Rev Biophys 35(4): 369-430.
- Bouly, J. P., Schleicher, E., Dionisio-Sese, M., Vandenbussche, F., D., Van Der Straeten, Bakrim, N., Meier, S., Batschauer, A., Galland, P., Bittl, R. and Ahmad, M. (2007). Cryptochrome blue light photoreceptors are activated through interconversion of flavin redox states. J Biol Chem 282(13): 9383-9391.
- Butler, W. L., Lane, H. C. and Siegelman, H. W. (1963). Nonphotochemical transformations of phytochrome in vivo. Plant Physiol 38(5): 514-519.
- Ernst, O. P., Lodowski, D. T., Elstner, M., Hegemann, P., Brown, L. S. and Kandori, H. (2014). Microbial and animal rhodopsins: structures, functions, and molecular mechanisms. Chem Rev 114(1): 126-163.
- Garczarek, F. and Gerwert, K. (2006). Functional waters in intraprotein proton transfer monitored by FTIR difference spectroscopy. Nature 439(7072): 109-112.
- Goett-Zink, L., Klocke, J. L., Bögeholz, L. A. K. and Kottke, T. (2020). In-cell infrared difference spectroscopy of LOV photoreceptors reveals structural responses to light altered in living cells. J Biol Chem 295(33): 11729-11741.
- Gomelsky, M. and Hoff, W. D. (2011). Light helps bacteria make important lifestyle decisions. Trends Microbiol 19(9): 441-448.
- Hennig, L., Büche, C., Eichenberg, K. and Schäfer, E. (1999). Dynamic properties of endogenous phytochrome A in Arabidopsis seedlings. Plant Physiol 121(2): 571-577.
- Jaubert, M., Bouly, J.-P., M., Ribera d’Alcalà and Falciatore, A. (2017). Light sensing and responses in marine microalgae. Current Opinion in Plant Biology 37: 70-77.
- Kottke, T., Lórenz-Fonfría, V. A. and Heberle, J. (2017). The grateful infrared: sequential protein structural changes resolved by infrared difference spectroscopy. J Phys Chem B 121(2): 335-350.
- Losi, A. and Gärtner, W. (2012). The evolution of flavin-binding photoreceptors: an ancient chromophore serving trendy blue-light sensors. Annu Rev Plant Biol 63: 49-72.
- Mäntele, W. (1993). Reaction-induced infrared difference spectroscopy for the study of protein function and reaction mechanisms. Trends Biochem Sci 18(6): 197-202.
- Möglich, A., Yang, X., Ayers, R. A. and Moffat, K. (2010). Structure and function of plant photoreceptors. Annu Rev Plant Biol 61: 21-47.
- Quaroni, L., Zlateva, T. and Normand, E. (2011). Detection of weak absorption changes from molecular events in time-resolved FT-IR spectromicroscopy measurements of single functional cells. Anal Chem 83(19): 7371-7380.
Article Information
Copyright
© 2021 The Authors; exclusive licensee Bio-protocol LLC.
How to cite
Readers should cite both the Bio-protocol article and the original research article where this protocol was used:
- Goett-Zink, L., Klocke, J. L. and Kottke, T. (2021). Resolving Structural Changes of Photoreceptors in Living Escherichia coli via In-cell Infrared Difference Spectroscopy. Bio-protocol 11(3): e3909. DOI: 10.21769/BioProtoc.3909.
- Goett-Zink, L., Klocke, J. L., Bögeholz, L. A. K. and Kottke, T. (2020). In-cell infrared difference spectroscopy of LOV photoreceptors reveals structural responses to light altered in living cells. J Biol Chem 295(33): 11729-11741.
Category
Biophysics > Infrared spectroscopy
Microbiology > in vivo model > Bacterium
Biochemistry > Protein > Structure
Do you have any questions about this protocol?
Post your question to gather feedback from the community. We will also invite the authors of this article to respond.