- Protocols

- Articles and Issues
- For Authors
- About
- Become a Reviewer

Analysis of Pseudomonas aeruginosa c-di-GMP High and Low Subpopulations Using Flow-assisted Cell Sorting (FACS) and Quantitative Reverse Transcriptase PCR (qRT-PCR)
Published: Vol 11, Iss 2, Jan 20, 2021 DOI: 10.21769/BioProtoc.3891 Views: 4841
Reviewed by: RAVI THAKURJan-Ulrik Dahl
Original research article
The authors used this protocol in:

Jun 2019
Advertisement


Protocol Collections
Comprehensive collections of detailed, peer-reviewed protocols focusing on specific topics


Related protocols

Abstract
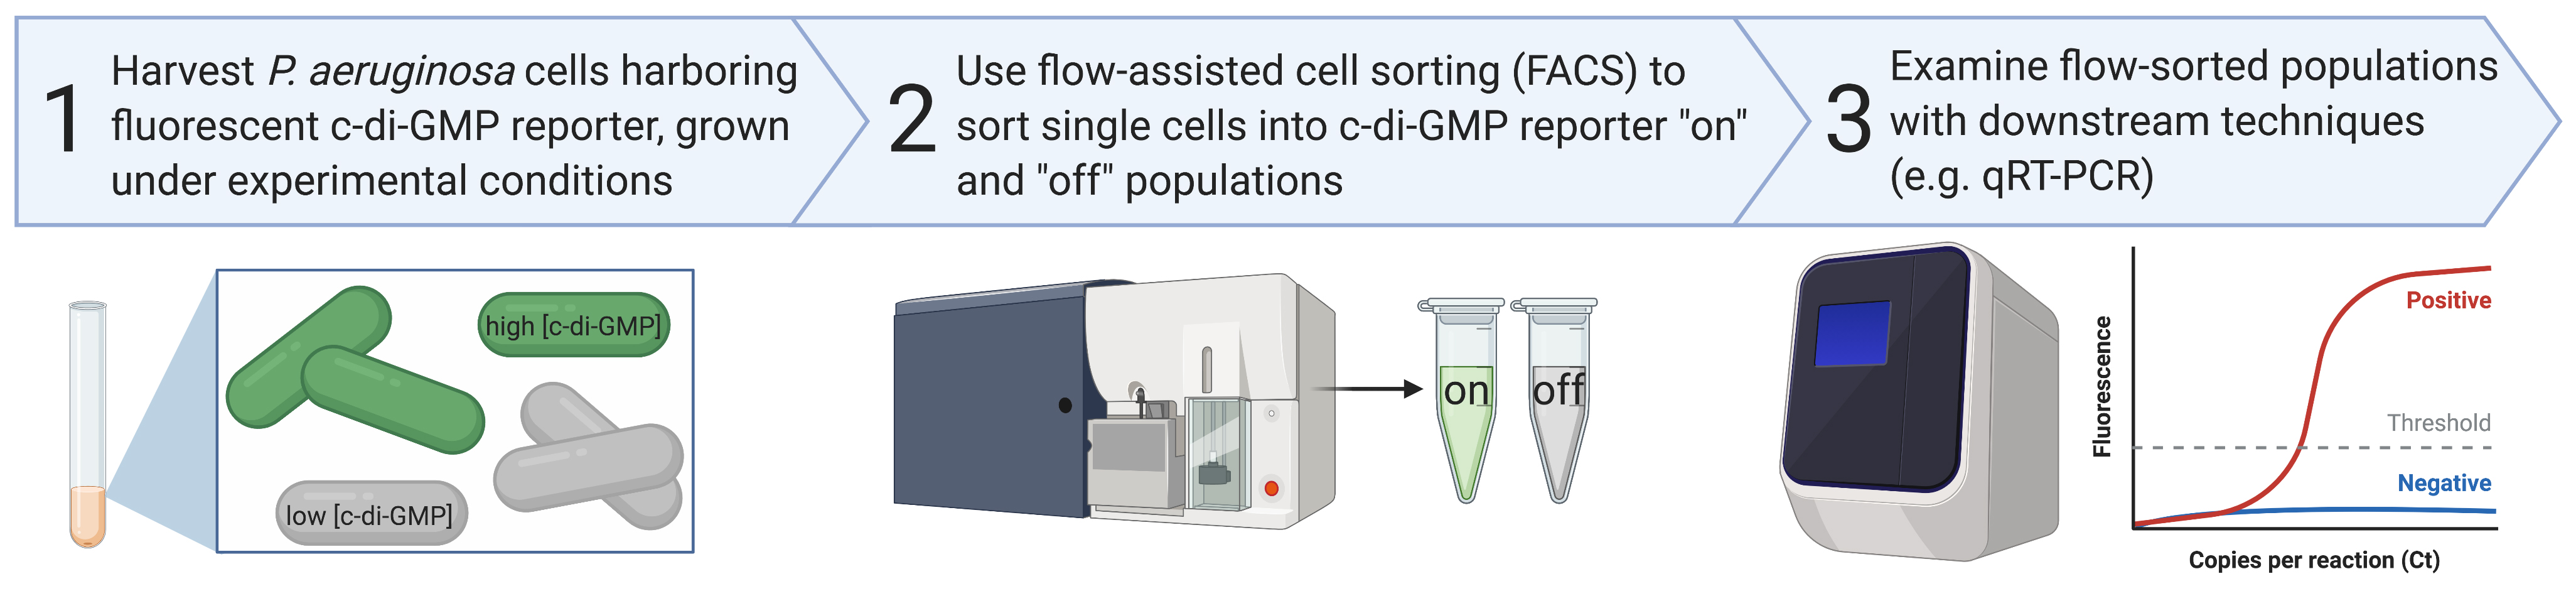
Cyclic diguanylate monophosphate (c-di-GMP) is a second messenger signaling molecule that drives the transition from planktonic to the biofilm mode of growth in many bacterial species. Pseudomonas aeruginosa has at least two surface sensing systems that produce c-di-GMP in response to surface attachment, the Wsp and Pil-Chp systems. We recently used a plasmid-based c-di-GMP reporter (pPcdrA::gfp) to describe how the Wsp system generates heterogeneity in surface sensing, resulting in two physiologically distinct subpopulations of cells during early biofilm formation. One subpopulation has elevated c-di-GMP and produces biofilm matrix, serving as the founders of initial microcolonies. The other subpopulation has low c-di-GMP and engages in surface motility, allowing for exploration of the surface. Here, we describe the protocol for a key experiment to confirm our initial observation of c-di-GMP heterogeneity during surface sensing: the use of flow-assisted cell sorting (FACS) to isolate subpopulations of cells with high and low c-di-GMP reporter activity, followed by quantitative Reverse Transcriptase PCR (qRT-PCR) of genes that are known to be transcriptionally regulated in response to cellular c-di-GMP levels (pelA, pslA). This protocol can be adapted by others to isolate subpopulations of high- and low- c-di-GMP P. aeruginosa cells that are genetically identical, but phenotypically distinct for future experiments examining specific mRNA transcripts as we did or, presumably, for additional applications like RNAseq, proteomics, or TNseq.
Graphical abstract
Background
The second messenger signaling molecule cyclic diguanylate monophosphate (c-di-GMP) allows bacteria to rapidly modify their cell surface in response to environmental conditions. Diguanylate cyclases (DGC) are proteins containing a GGDEF amino acid sequence motif that synthesize c-di-GMP from two molecules of GTP, and phosphodiesterases (PDE) are proteins with EAL or HD-GYP motifs that hydrolyze c-di-GMP into linear pGpG or GMP (Hengge, 2009). The genomes of Pseudomonas aeruginosa lab strains PAO1 and PA14 each encodes almost 40 of these putative c-di-GMP-modulating enzymes, the majority of which contain additional predicted domains involved in environmental sensing (including PAS, GAF, and HAMP domains) and signal transduction (e.g., REC domains) (Kulasakara et al., 2006). Through the activity of these DGCs and PDEs that modulate intracellular levels of c-di-GMP, P. aeruginosa integrates diverse environmental signals in order to coordinate a variety of bacterial behaviors, including the transition from planktonic to the biofilm mode of growth.
In P. aeruginosa, elevated c-di-GMP levels promote cell surface adhesiveness by interacting with specific receptors and effectors that activate production of biofilm extracellular matrix components and suppress expression of motility genes. The c-di-GMP binding transcriptional regulator FleQ acts in complex with FleN to inversely regulate transcription of genes involved in flagellar biosynthesis and biofilm matrix production (Arora et al., 1997; Hickman and Harwood, 2008; Baraquet et al., 2012; Baraquet and Harwood 2016). When cellular levels of c-di-GMP are high, such as during growth on a surface, FleQ binds c-di-GMP and derepresses transcription of genes encoding the Pel and Psl polysaccharide biosynthetic machinery, as well as the adhesin CdrA (Borlee et al., 2010). The c-di-GMP reporters described in this protocol contain the promoter region of cdrA and can be used in P. aeruginosa strains that express functional FleQ and FleN proteins (Figure 1).
Phenotypic heterogeneity is a common phenomenon in nature, occurring when a population of genetically identical organisms (in the present case, bacteria) display diverse behaviors, despite experiencing the same environmental conditions (Ackermann, 2015). Testing hypotheses related to changes in gene expression in phenotypically heterogeneous populations requires the ability to separate out these sub-populations. For example, when analyzed as a single batch (combining both sub-populations together), the high gene expression by one sub-population would be averaged with the low expression from the other sub-population, resulting in the erroneous conclusion that expression of the gene of interest is at some intermediate level. Therefore, the purpose of developing this protocol was to separate genetically identical, but apparently physiologically distinct sub-populations of P. aeruginosa cells with high and low intracellular levels of c-di-GMP in order to determine whether these two subpopulations may differ in their expression of genes involved in biofilm formation (genes encoding Pel and Psl polysaccharide biosynthetic machineries). The protocol uses either of two versions of a plasmid-based, transcriptional reporter of c-di-GMP levels in P. aeruginosa (pPcdrA::gfp and pPcdrA::gfpASV) (Armbruster et al., 2019). These two reporter plasmids differ by which GFP allele they express, either the stable GFP (GFPmut3) or an unstable variant with a shorter half-life (GFPASV) (Andersen et al., 1998; Rybtke et al., 2012). The benefit of the stable GFP version of the reporter is that it tends to have a higher dynamic range, whereas the benefit of the short half-life GFP version is that it can be used in time course experiments when the levels of c-di-GMP may decrease. The protocol also makes use of a number of controls to help draw flow cytometry gates that separate cells with high and low c-di-GMP reporter activity (as measured by GFP fluorescence). Controls for gating include promotorless vector control plasmids harboring stable or unstable GFP (pMH487 or pMH489) and 2 P. aeruginosa strains with clean deletions of key proteins in the Wsp chemosensory system (PAO1 ΔwspR and PAO1 ΔwspF ΔpelC ΔpslBCD) that will have constitutively low or high levels of c-di-GMP reporter activity (Güvener and Harwood, 2007).
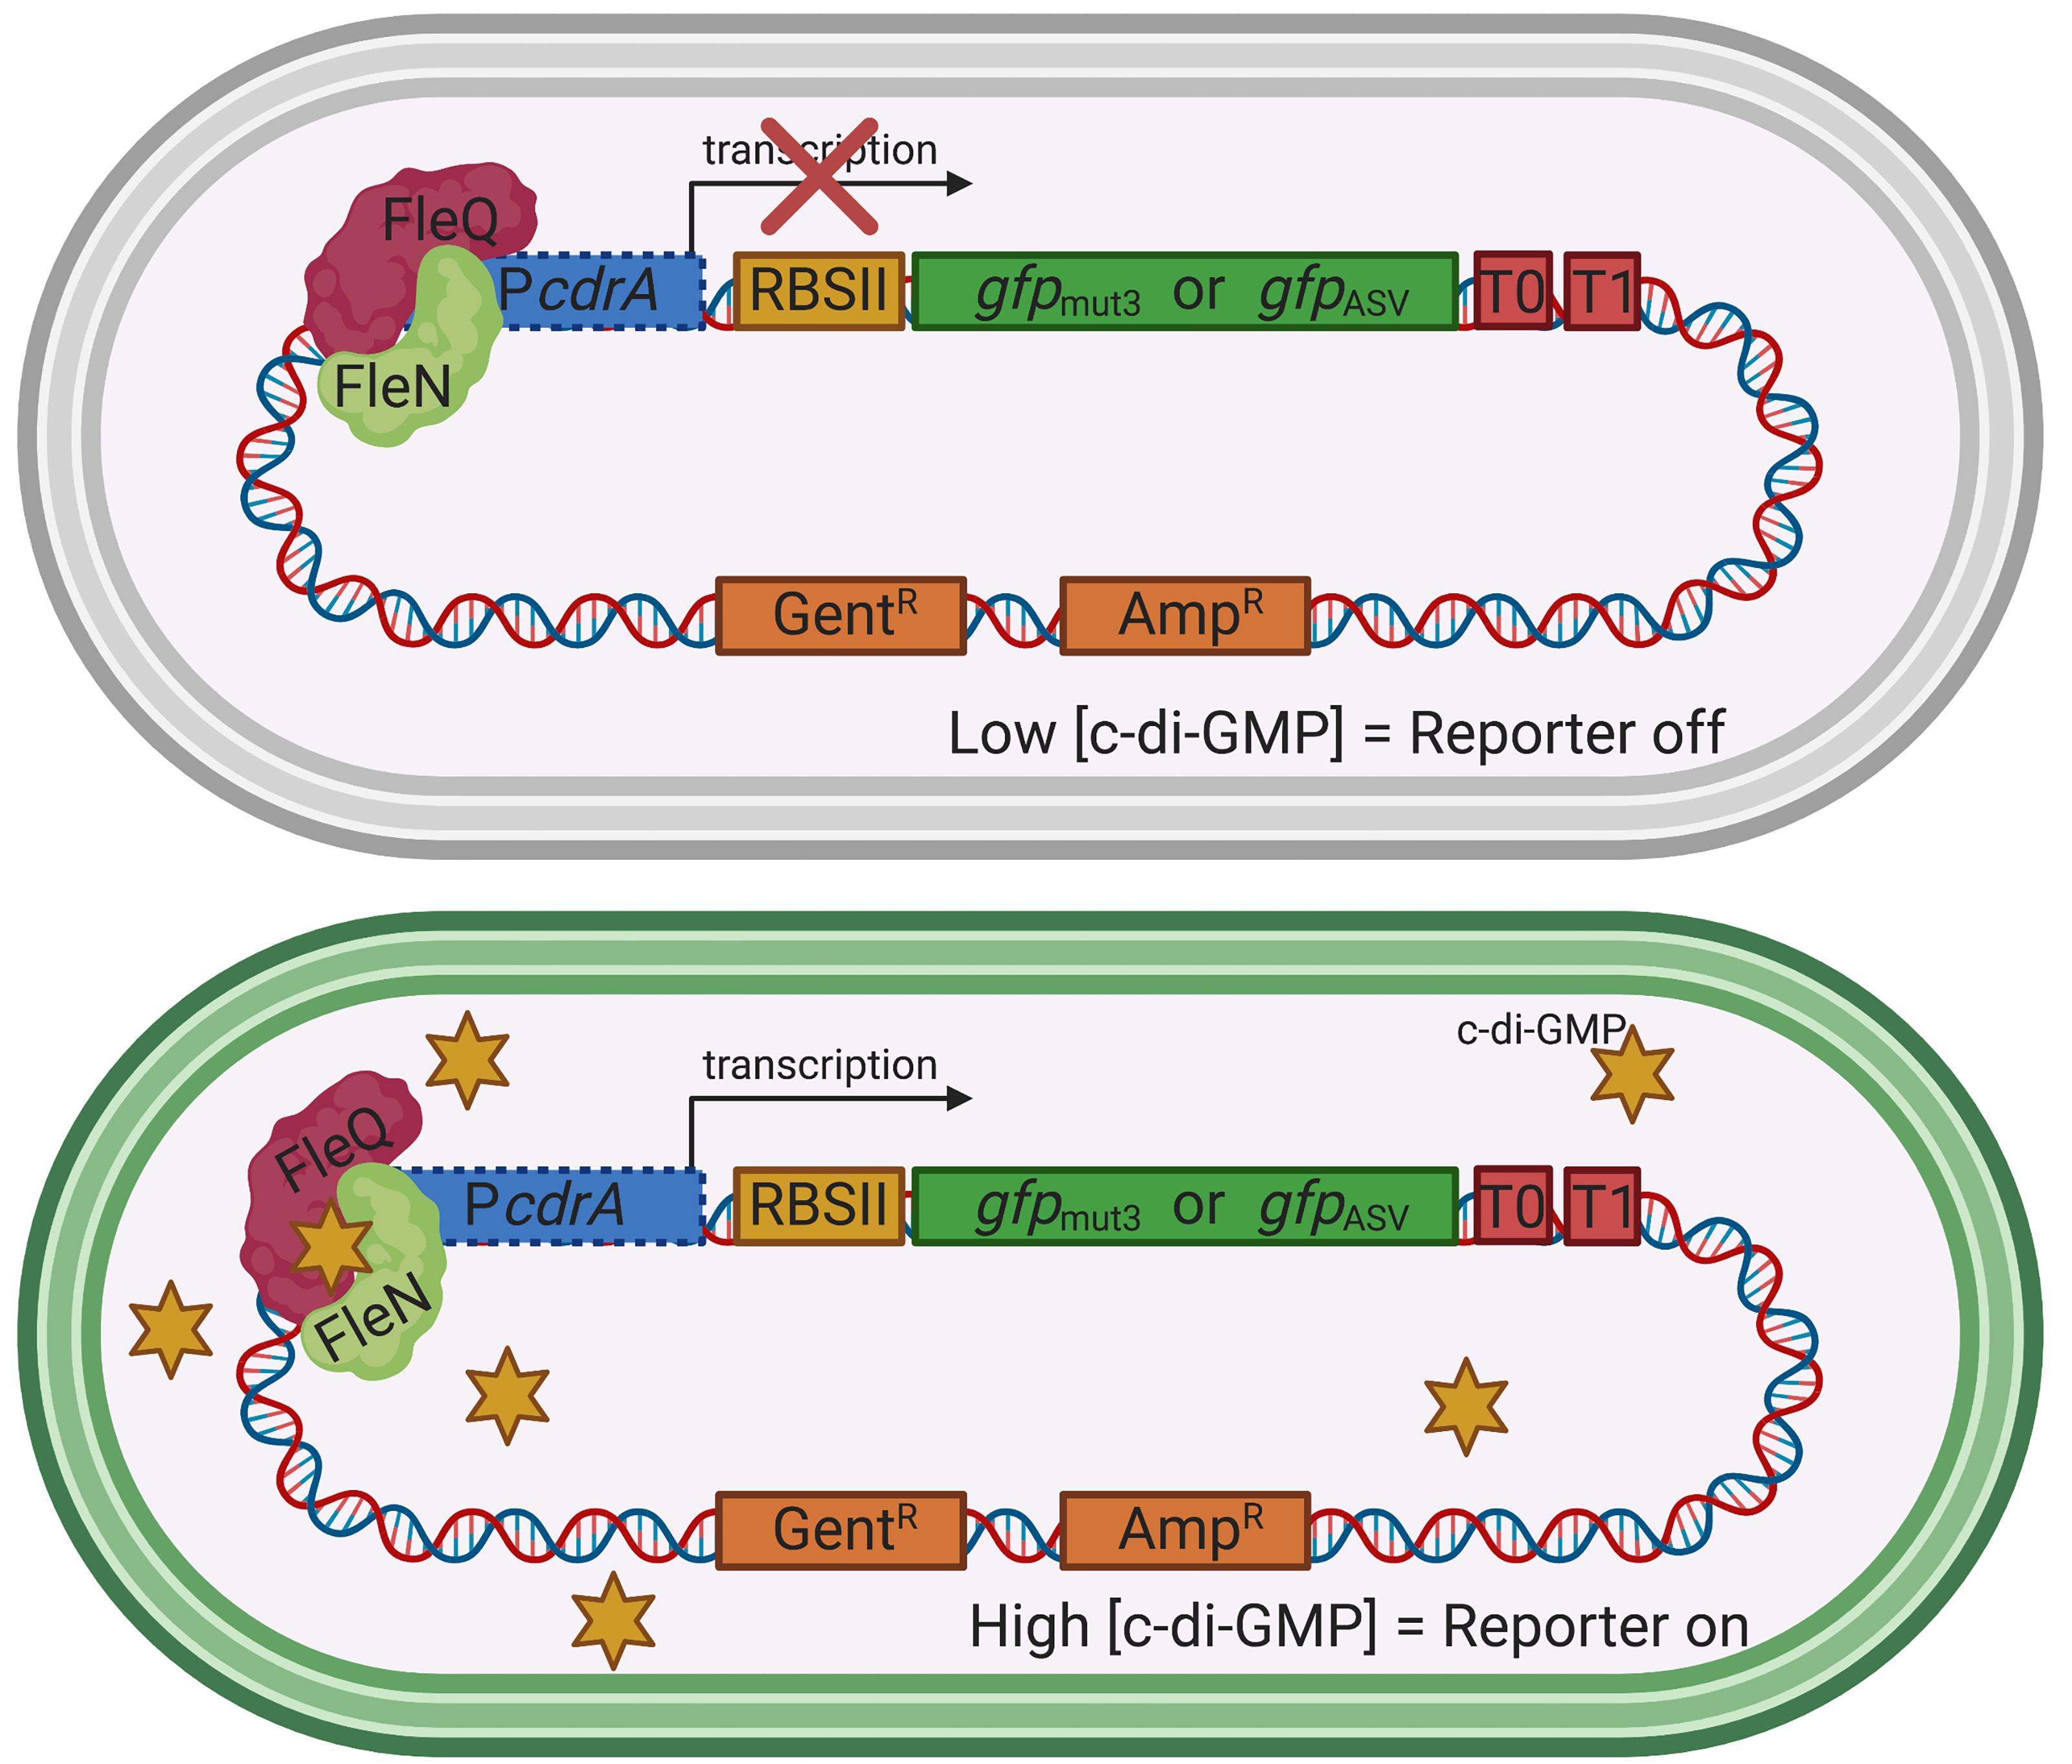
Figure 1. The plasmid-based transcriptional reporters, pPcdrA::gfp and pPcdrA::gfpASV, are sensitive to the intracellular concentration of c-di-GMP in P. aeruginosa. Under conditions of low intracellular c-di-GMP (top), FleQ and FleN repress the promoter for the adhesin, CdrA (PcdrA), and no GFP is produced. Under conditions of high c-di-GMP (bottom), such as when P. aeruginosa is attached to a surface, c-di-GMP binds to FleQ, the cdrA promoter is de-repressed, and GFP is made. Yellow star = c-di-GMP. RBSII is an enhanced ribosomal binding site, T0 and T1 are transcriptional terminators, and GentR and AmpR represent resistance genes for gentamicin and ampicillin, respectively. This is the Seattle c-di-GMP reporter that was originally published in Rybtke et al. (2012).
The Wsp system is a “surface sensing” system in P. aeruginosa with homology to bacterial chemosensory signal transduction complexes, that produces c-di-GMP in response to surface contact (Hickman et al., 2005). The Wsp system senses a yet to be identified signal related to surface contact through WspA, a membrane-bound receptor homologous to methyl-accepting chemotaxis proteins (MCPs), transducing a signal to the CheA homolog, WspE. Upon autophosphorylation, the sensor kinase WspE activates the diguanylate cyclase WspR through phosphorylation of a conserved aspartate residue on WspR’s receiver domain. Phosphorylation of WspR leads to the formation of large subcellular WspR-P aggregates that synthesize c-di-GMP (Huangyutitham et al., 2013). WspC (a methyltransferase) and WspF (a methylesterase) are involved in adaptation of the Wsp system to stimulation. The PAO1 ∆wspR deletion strain is incapable of producing c-di-GMP through the Wsp system and is a helpful control strain for gating a “low c-di-GMP” population. In contrast, the PAO1 ΔwspF ΔpelC ΔpslBCD strain has constitutively high c-di-GMP produced through the Wsp system due to the deletion of the wspF methylesterase gene. This strain also has deletions in genes required for Pel and Psl polysaccharide biosynthesis (ΔpelC ΔpslBCD), to abrogate clumping due to polysaccharide overproduction in the PAO1 ΔwspF background.
Materials and Reagents
1 ml serological pipette
2 ml tube
Control bacterial strains (to determine low GFP and high GFP gates)
Experimental bacterial strains
This protocol utilizes P. aeruginosa strains harboring the following plasmids that are available upon request from the laboratory of Dr. Matthew R. Parsek: pPcdrA::gfp, pPcdrA::gfpASV, pMH487, pMH489. However, in principle, the protocol can be adapted for use with other fluorescent reporters.
Genomic DNA isolated from P. aeruginosa PAO1
Gentamicin
LB agar
Paraformaldehyde (PFA; Millipore Sigma, catalog number: 158127 )
TRIzol LS (Thermo Fisher Scientific, Waltham, MA)
RQ1 DNase I (Promega, Madison, WI)
iTaq Universal SYBR Green One-Step kit (Bio-Rad, Hercules, CA)
LB broth (see Recipes)
Peptone (Fisher Scientific, catalog number: BP1420 )
GibcoTM BactoTM Yeast extract (Fisher Scientific, catalog number: DF0127-17-9 )
Sodium chloride (NaCl; Fisher Scientific, catalog number: S271-3 )
Modified Jensen’s Chemically Defined Media (see Recipes)
Sodium chloride (NaCl; Fisher Scientific, catalog number: S271-3 )
Potassium phosphate dibasic anhydrous (K2HPO4; Fisher Scientific, catalog number: P288 )
L-Glutamic acid monosodium salt hydrate (Millipore Sigma, catalog number: G5889 )
L-Valine (Fisher Scientific, catalog number: AC140811000 )
L-Phenylalanine (Fisher Scientific, catalog number: AC130311000 )
Dextrose (D-Glucose; Fisher Scientific, catalog number: D16 )
Magnesium sulfate heptahydrate (MgSO4; Fisher Scientific, catalog number: M63 )
Calcium chloride dihydrate (CaCl2; Fisher Scientific, catalog number: C79 )
Iron (II) sulfate heptahydrate (FeSO4; Millipore Sigma, catalog number: F7002 )
Zinc sulfate heptahydrate (ZnSO4; Millipore Sigma, catalog number: Z4750 )
Sterile PBS (see Recipes)
Equipment
-80 °C freezer
Micropipettes
Benchtop microcentrifuge
FACSAriaII (BD Biosciences, San Jose, CA) or equivalent flow cytometer that is capable of measuring forward and side scattered light and GFP fluorescence, as well as cell sorting
CFX96 Touch Real-Time PCR detection system (Bio-Rad, Hercules, CA) or equivalent
NanoDrop or equivalent spectrophotometer that is capable of measuring optical density at the following wavelengths: 230, 260, and 280 nanometers (nm)
Software
FlowJo (FlowJo LLC, Ashland, OR) or equivalent software to analyze flow cytometry datasets
Procedure
The following procedure can be adapted for use with cells grown under a variety of c-di-GMP inducing conditions prior to FACS analysis. The methods described below were previously used in a study to examine heterogeneity in c-di-GMP production during surface sensing and early biofilm formation by P. aeruginosa (Armbruster et al., 2019).
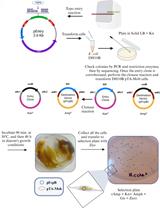
Prepare control and experimental bacterial strains for inoculation into the experimental condition (Figure 2)
Streak P. aeruginosa reporter strains from a -80 °C glycerol freezer stock onto LB agar with 100 µg/ml of gentamicin. Incubate plates overnight at 37 °C.
Prepare an overnight liquid culture by resuspending a single colony into 3 ml LB broth with 100 µg/ml of gentamicin. Grow the liquid culture shaking, overnight, at 37 °C.
Generate an inoculum of P. aeruginosa cells grown to mid-log in planktonic culture. Back dilute overnight, stationary phase cells 1:1000 in a final volume of 3 ml LB with 100 µg/ml gentamicin. Continue to incubate the back-diluted culture at 37 °C with shaking for 2 h. The purpose of generating a mid-log planktonic culture of cells is to start the experiment under conditions where c-di-GMP levels (and GFP fluorescence) should be lowest in the cells.
After 2 h, begin checking the optical density of your culture at 600 nanometers (OD600) until cultures have reached mid-log phase (OD600 ~0.5).
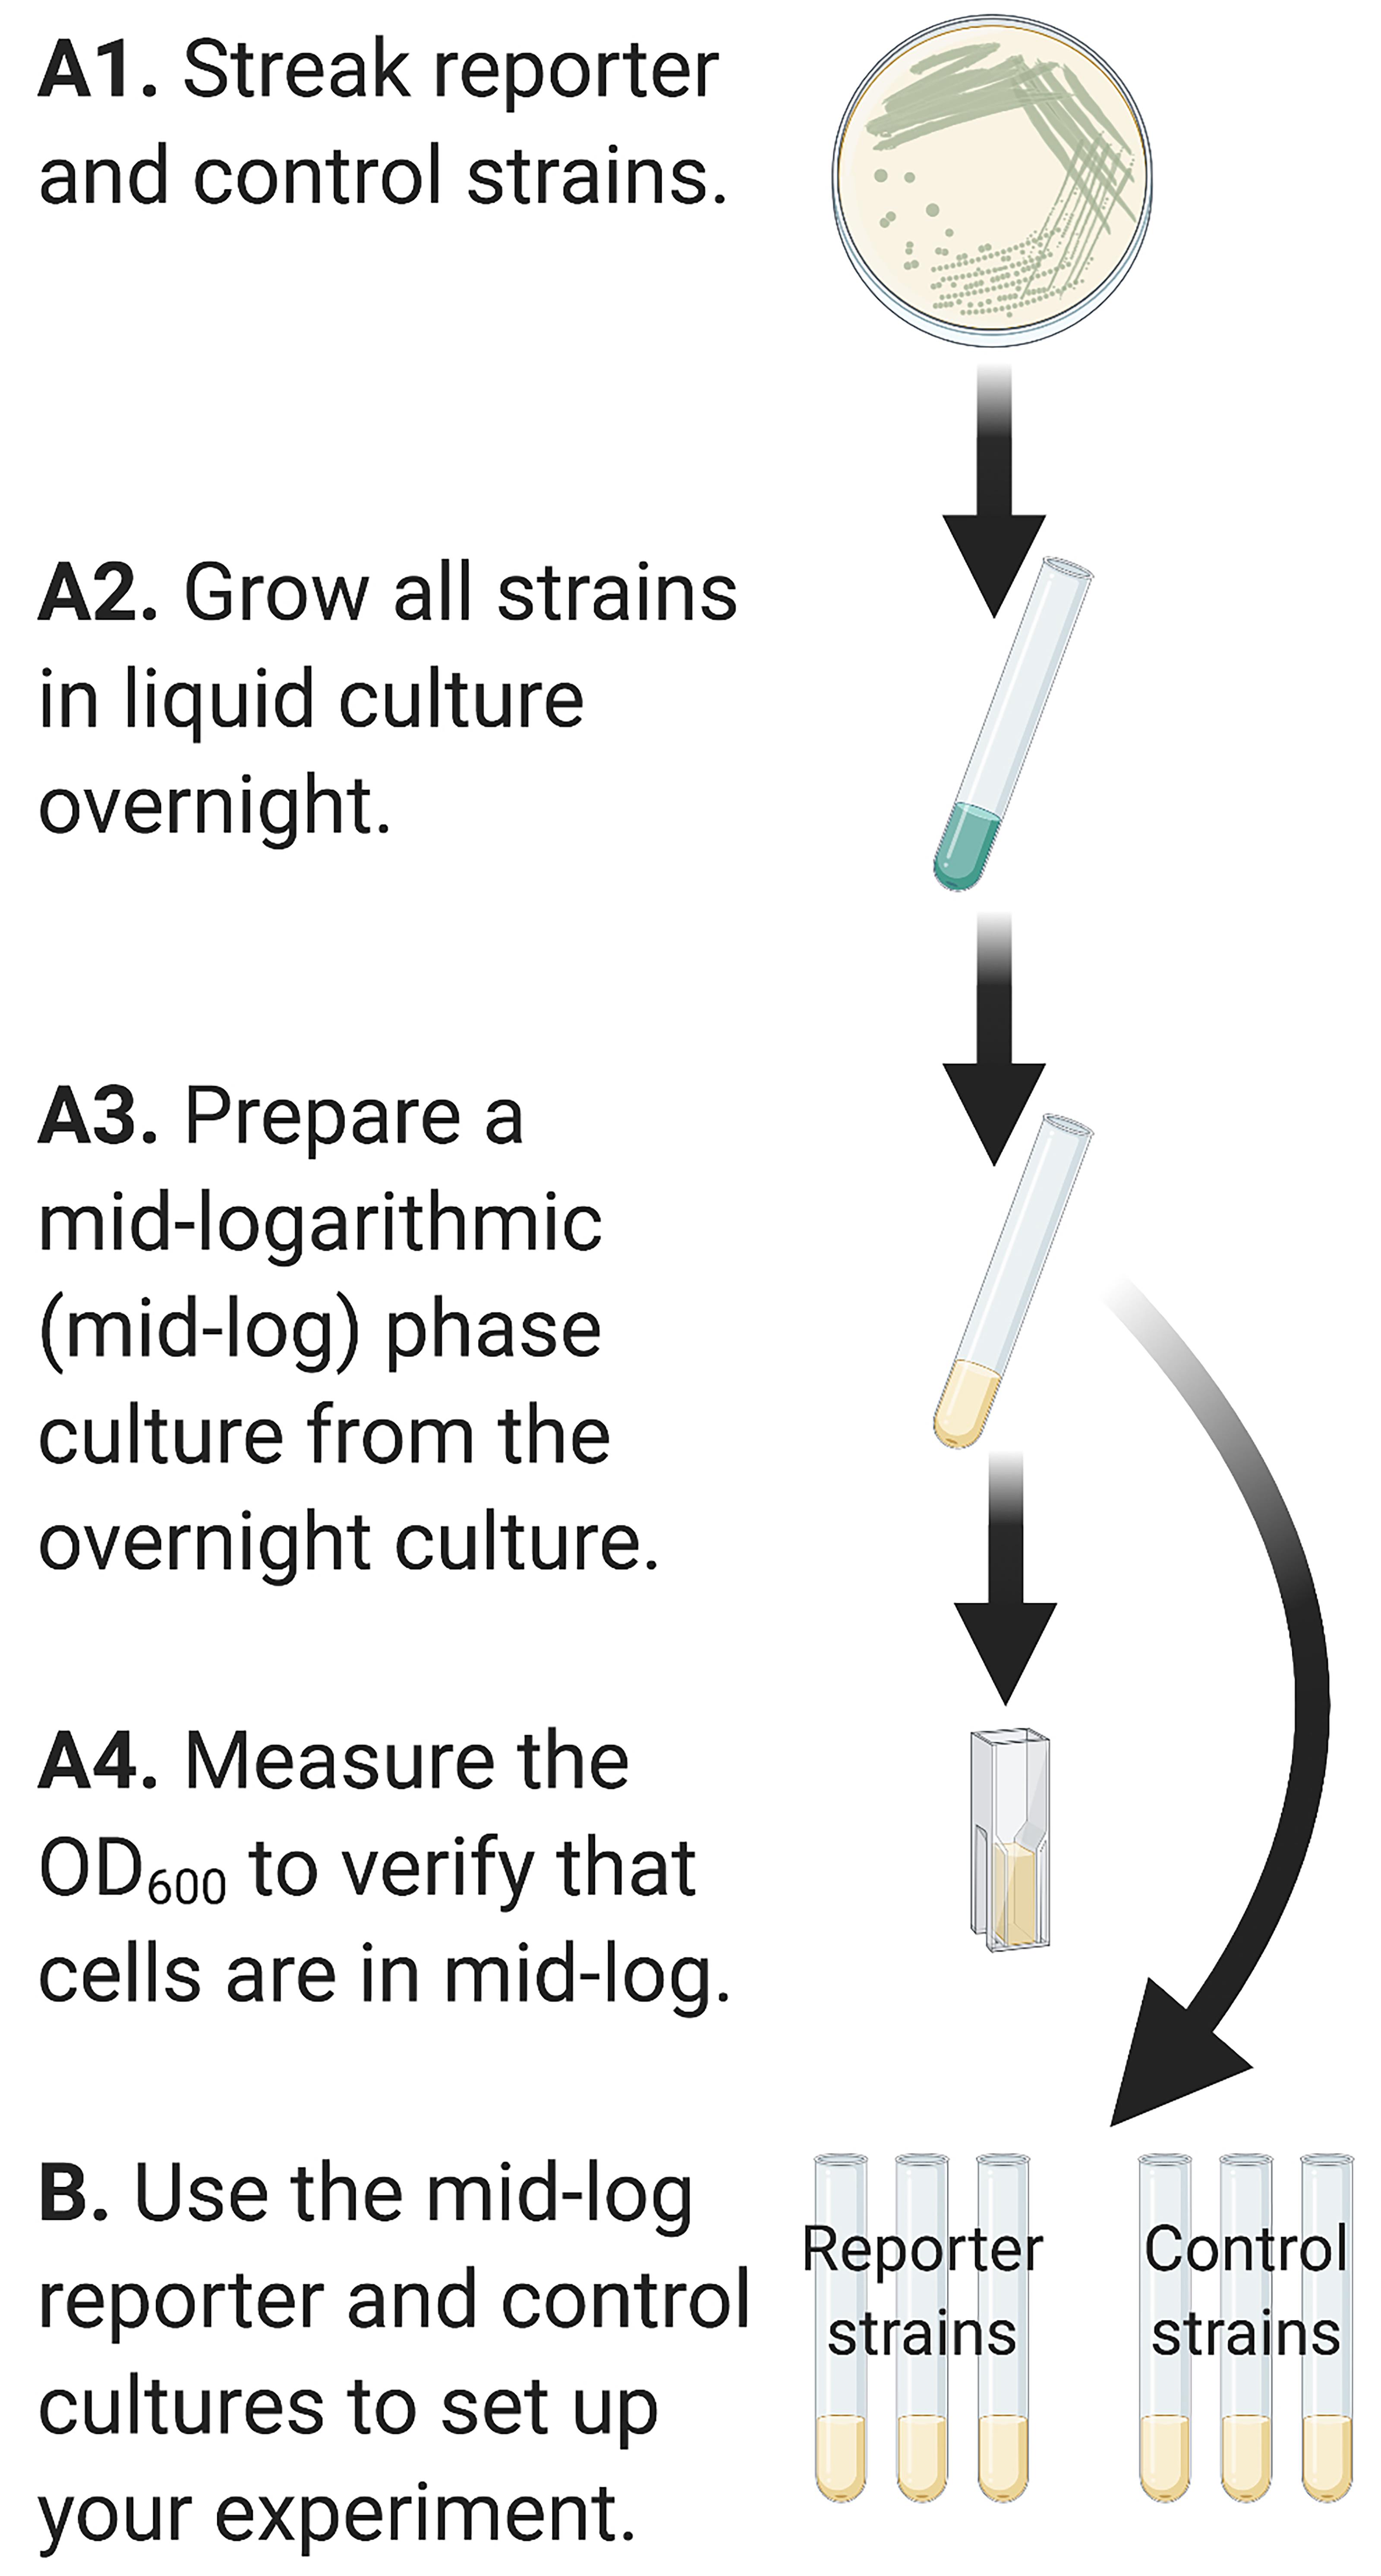
Figure 2. Graphical representation of Steps in Part A. Inocula of reporter and control strains are prepared to mid-logarithmic phase prior to inoculating into the experimental conditions in Part B.
Grow reporter and control strains under c-di-GMP inducing experimental condition. Set up an additional culture growing to mid-log as a control for single cells
Centrifuge 3 ml of mid-log cells for 1 min at > 6,800 x g at room temperature (15-25 °C).
Resuspend concentrated cells in a final volume of 1 ml LB with 100 µg/ml gentamicin, to achieve a final OD600 of 0.8.
Incubate resuspended cells statically in a sterile, glass culture tube for 4 h at 37 °C. The glass culture tube acts as the substratum for P. aeruginosa to attach to and initiate c-di-GMP signaling over 4 h.
Set up the single-cell control by further back diluting one of the strains from Step A4 to OD600 0.05 in LB and growing shaking at 37 °C for 4 h.
Harvest surface-attached cells and fix with paraformaldehyde (PFA)
Prepare the single-cell control sample from Step B4 by centrifuging 1 ml of mid-log cells for 1 min at > 6,800 x g at room temperature (15-25 °C). Rinse twice with PBS, then resuspend the cell pellet in 1 ml of ice-cold 6% PFA. Store this control tube on wet ice.
Use a 1 ml serological pipette to gently remove LB containing the planktonic fraction of each experimental culture from Step B3.
Rinse the inside of the tube with 2 ml of ice cold PBS. Perform 3 rinses. Store tubes on wet ice between washes.
Use a 1 ml serological pipette to transfer 1 ml of ice cold, 6% PFA into each tube. Use the pipette to scrape the sides of the tube and vortex thoroughly to resuspend surface-attached cells.
Incubate resuspended samples on ice for 20 min for PFA fixation.
Note: We used PFA to fix the bacterial cells instead of RNAlater because RNAlater is known to reduce the fluorescence intensity of GFP (Zaitoun et al., 2010).
Within an hour of harvesting samples and immediately prior to FACS analysis, centrifuge to pellet PFA-fixed cells, wash once in ice cold PBS, and resuspend in 1 ml ice cold PBS. Temporarily store samples on wet ice until they are used for FACS.
Analyze populations by flow cytometry and draw gates for sorting
We used a FACSAriaII (BD Biosciences, San Jose, CA) flow cytometer with a 70 µm nozzle to sort P. aeruginosa cells harboring the c-di-GMP reporter into high and low c-di-GMP populations for downstream qRT-PCR. The FACSAriaII was cleaned with 10% bleach followed by PBS for 90 min before and after all runs.
Use the following controls to draw gates for high and low GFP levels (Figure 3):
Single cell control: Wild type PAO1 cells grown planktonically to mid-log. Use this sample first to draw a gate around single cells, using forward and side scatter. This will allow you to avoid counting cell debris or large aggregates of cells as single events when sorting.
GFP fluorescence controls: Use these to draw gates where you expect to see high and low GFP fluorescence from the PcdrA reporter (i.e., cells with high or low c-di-GMP levels, respectively).
If using the regular half-life GFP reporter (pPcdrA::gfp):
Constitutively high GFP controls:
PAO1 ΔwspF ΔpelC ΔpslBCD pPcdrA::gfp
PAO1 Tn7::P(A1/04/03)::GFPmut
Low GFP control:
PAO1 ΔwspR pPcdrA::gfp
Constitutively “off” reporter controls:
PAO1 pMH487
Wild type PAO1
If using the short half-life GFP reporter (pPcdrA::gfpASV):
Constitutively high GFP control:
PAO1 ΔwspF ΔpelC ΔpslBCD pPcdrA::gfpASV
Low GFP control:
PAO1 ΔwspR pPcdrA::gfpASV
Constitutively “off” reporter control:
PAO1 pMH489
Wild type PAO1
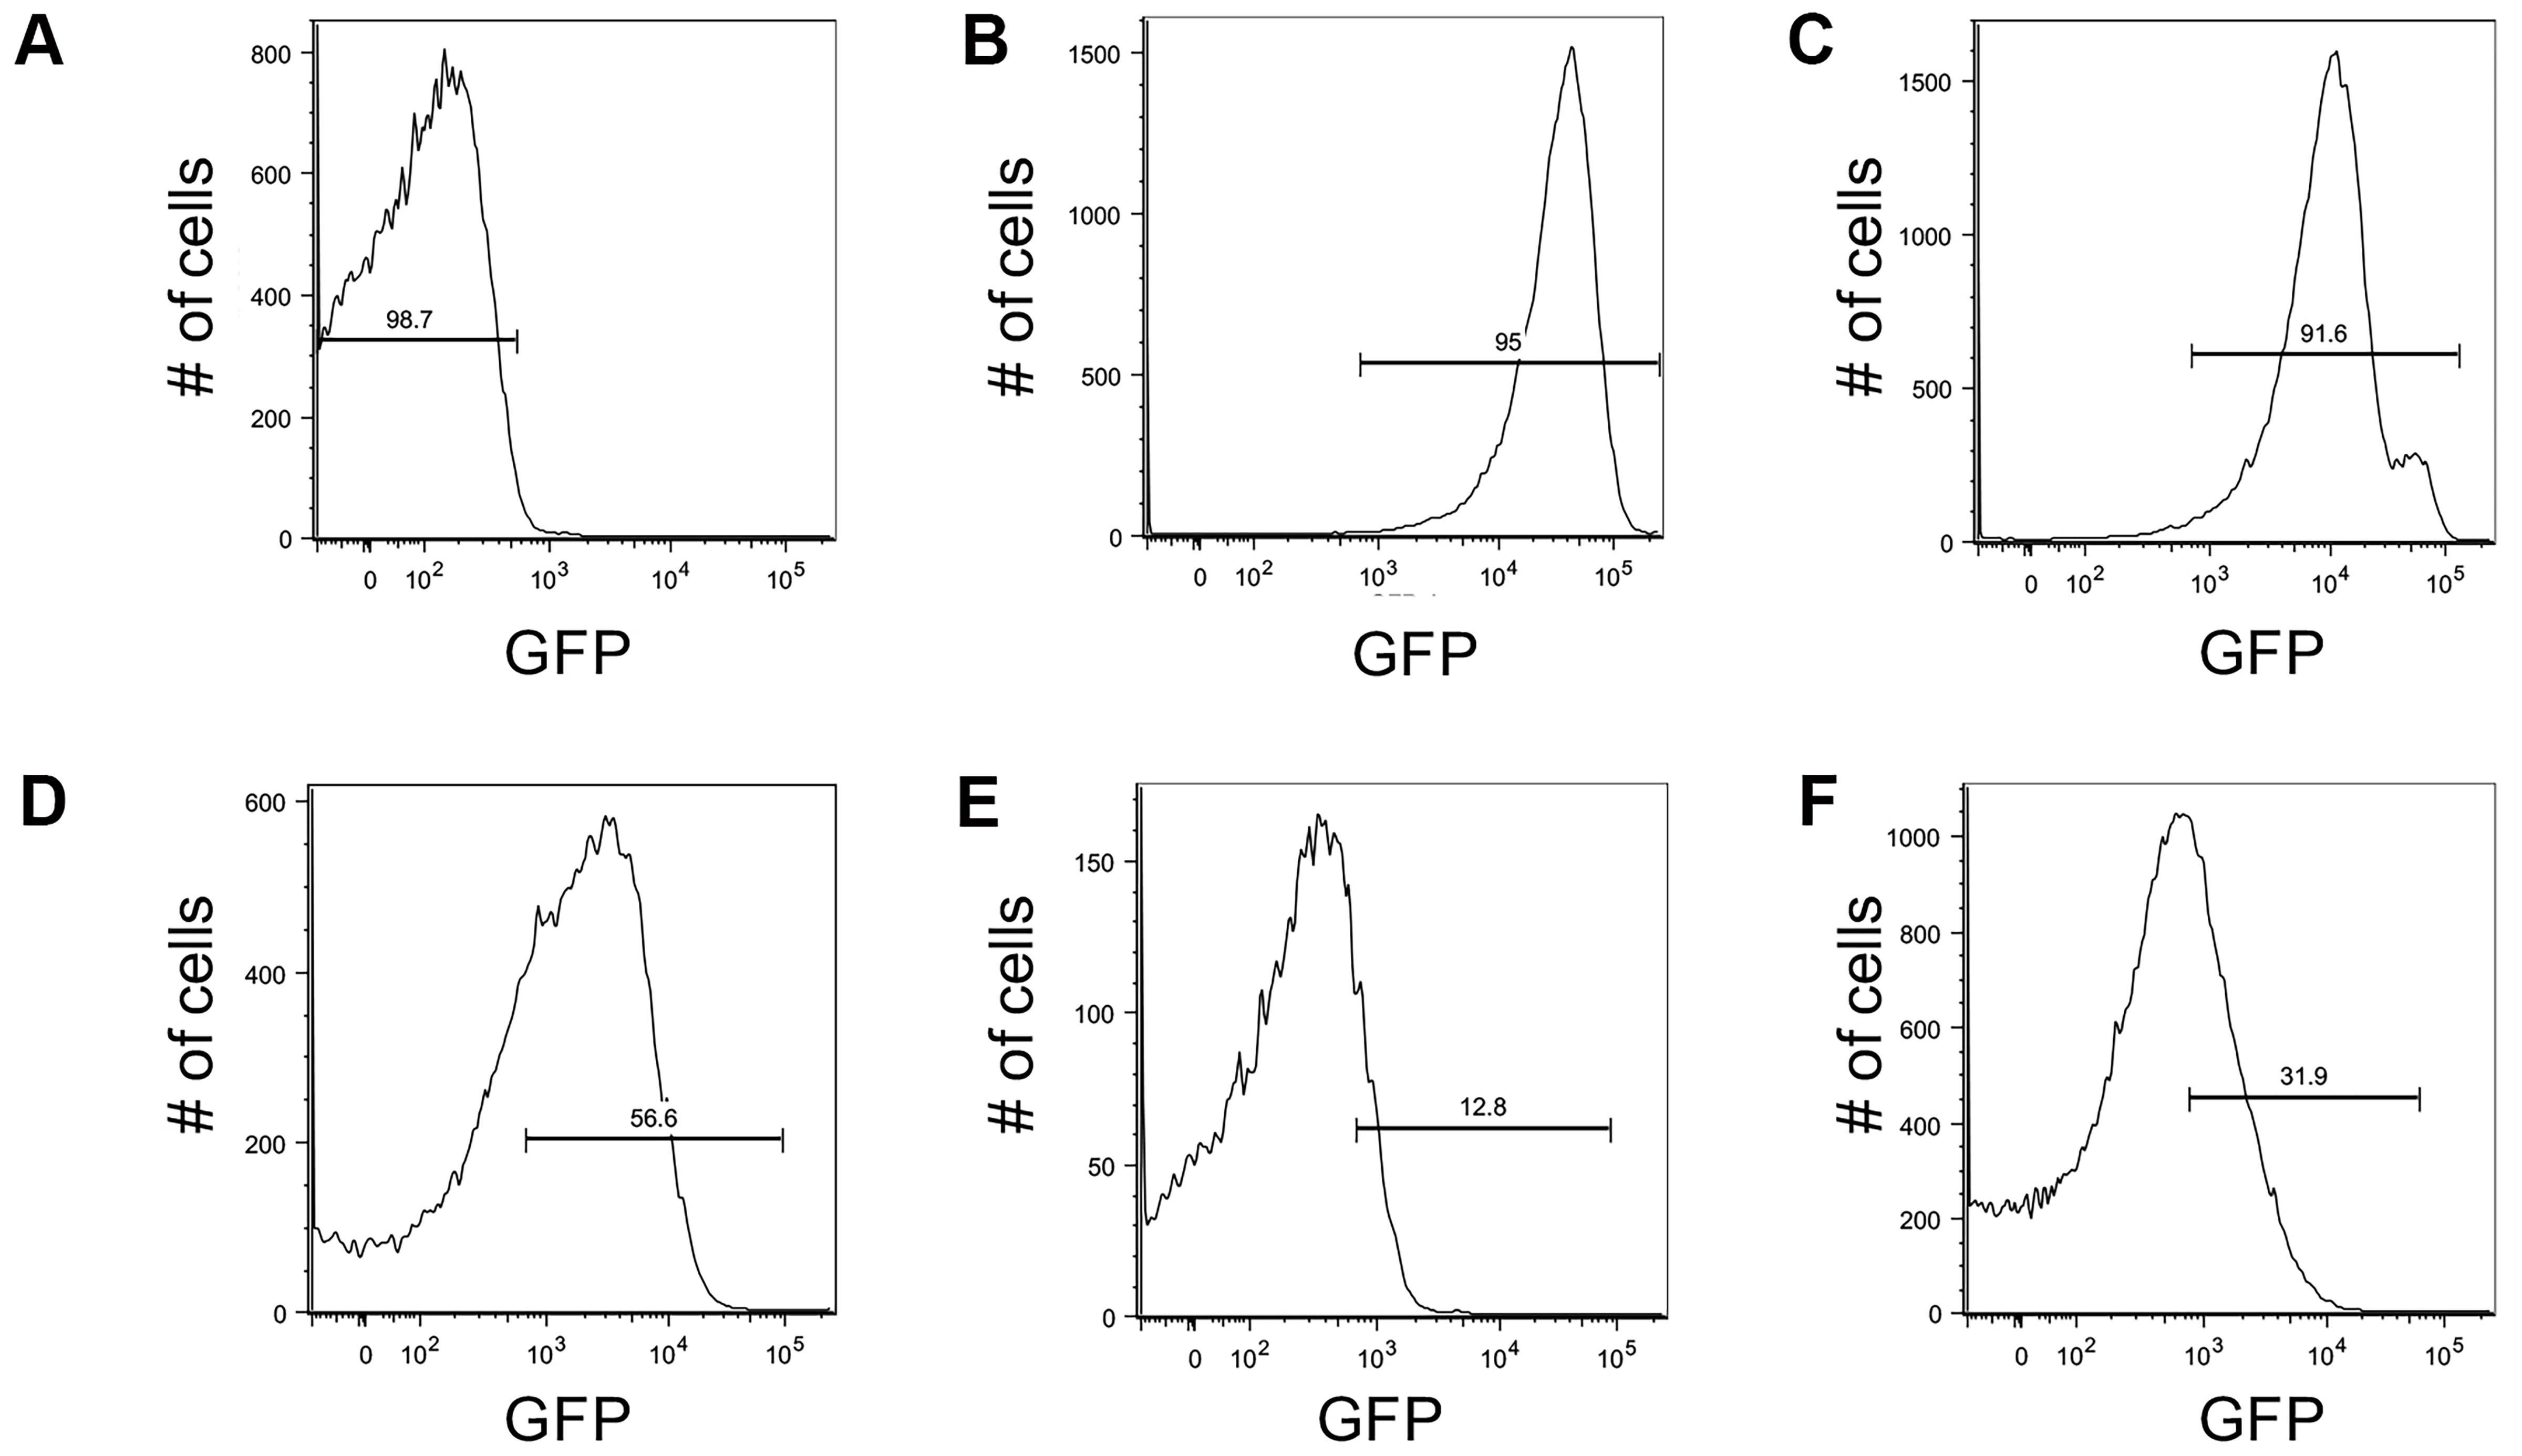
Figure 3. Controls for setting up GFP gates for flow cytometry with the c-di-GMP reporter. Brackets indicate gates for ‘on’ (GFP above 1.7 × 10² RFU) or ‘off’ (GFP below 1.7 × 10² RFU) reporter cells and the number above the bracket indicates the percentage of cells that fall within that gate. (A) Wild type PAO1 cells were used to determine the background level of fluorescence on the BD Aria III for GFP measurements. This population of cells falls below 103 RFU. (B) A P. aeruginosa strain constitutively expressing stable GFP (PAO1 Tn7::P(A1/04/03)::GFPmut) was used to determine gating for cells with the highest amount of GFP, with the population ranging from 103 to 105 RFU. (C) Surface grown PAO1 ΔwspF Δpel Δpsl harboring the pPcdrA::gfpASV was used to validate the gate for collection of cells with high reporter activity (103 to 105 RFU; 91.6% of the population). (D) Example of gating for reporter ‘on’ cells from wild type PAO1 pPcdrA::gfpASV cells that had been attached to glass in LB medium for 4 h. Approximately 56.6% of the population falls into the reporter ‘on’ population. (E) Example of gating for ‘on’ cells from wild type PA14 pPcdrA::gfpASV cells that had been attached to glass in LB medium for 4 h prior to FACS sorting. Approximately 12.8% of the population falls into the reporter ‘on’ population. (F) Example of gating for ‘on’ cells from wild type PA14 pPcdrA::gfpASV cells that had been attached to glass in Jensen’s media (a condition in which Pel is more abundantly produced than in LB) for 4 h. Approximately 31.9% of the population falls into the reporter ‘on’ population. This figure was reproduced from Figure 1-figure supplement 5 in Armbruster et al. (2019).Sort cells directly into TRIzol LS
Prepare tubes to sort cells into by adding 750 µl of Trizol LS for every 250 µl of volume that you plan to sort into that tube (i.e., sorted bacterial cells suspended in PBS sheath fluid). Pre-chill tubes with Trizol LS at 4 °C.
Sort cells at 4 °C by flow assisted cell sorting (FACS) to collect 100,000 events (single cells) into TRIzol LS. Monitor the final volume to maintain a 3:1 ratio of Trizol LS to sorted cell volume and add additional Trizol LS as needed.
After sorting is completed on each tube, vortex the samples for 10 s and store on wet ice.
Extract RNA and test for gDNA contamination
Extract RNA immediately following FACS-sorting.
Incubate samples for 4 min at 90 °C. Invert to mix.
Transfer samples to ice.
Add 200 µl of ice cold chloroform and shake vigorously.
Centrifuge at 6,800 x g for 15 min at 4 °C.
Remove 500 µl of the colorless aqueous layer and transfer to a clean 2 ml tube.
Add the following to the tube:
1 µl glycogen
40 µl of 3 M NaOAc, pH 5.0
1,200 µl of 100% ethanol
Vortex to mix and store at -20 °C for 2 h or overnight.
Centrifuge RNA samples for 30 min at 14,000 x g, 4 °C.
Remove supernatant and wash RNA pellet with 800 µl 70% ethanol.
Centrifuge for 30 min, remove the supernatant, and briefly air dry the pellet at room temperature.
Resuspend the pellet in 20 µl RNase-free water.
Heat at 65 °C for 5 min and vortex to fully resuspent the pellet.
Proceed with RQ1 DNase I digestion.
Digest any contaminating DNA present in the RNA samples with RQ1 DNase I (Promega, Madison, WI) following the manufacturer’s protocol.
Check for genomic DNA contamination by PCR to detect the rplU gene. Include PAO1 genomic DNA as a positive control.
Primers (amplifies a 307 bp product):
rplU-F: 5’-CGCAGTGATTGTTACCGGTG-3’
rplU-R: 5’-AGGCCTGAATGCCGGTGATC-3’
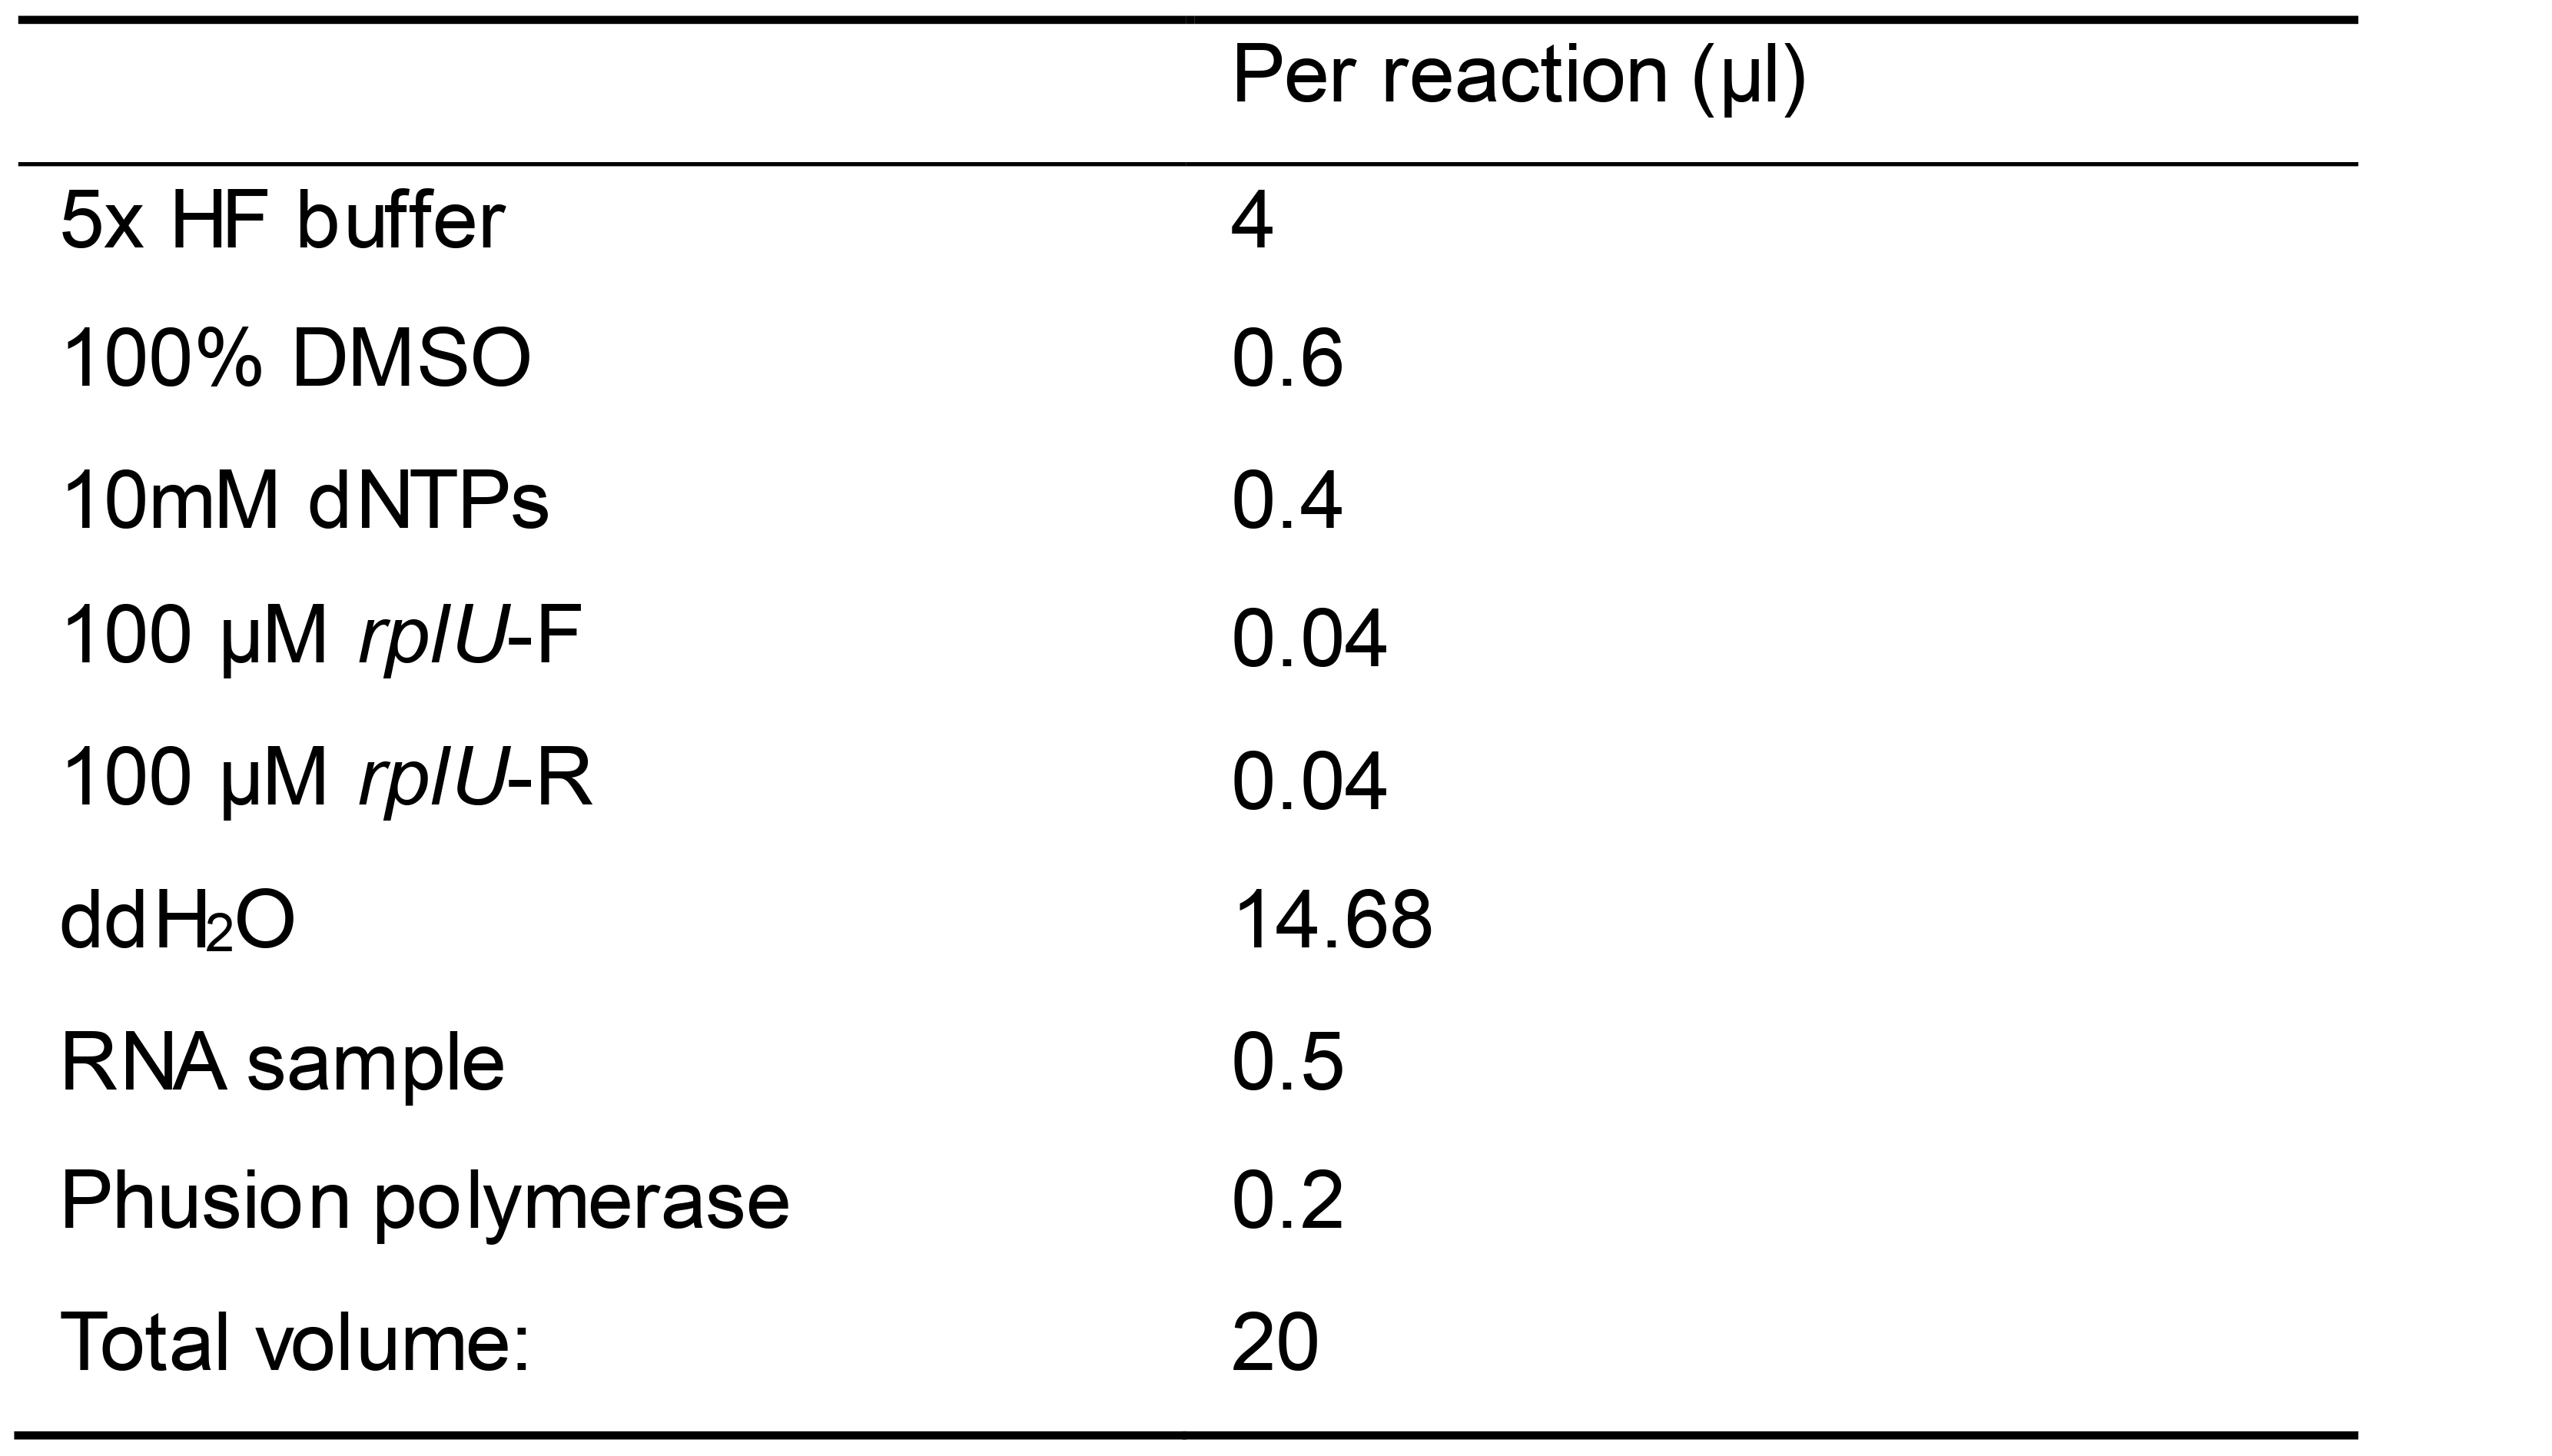
Set up PCR reactions using your preferred Polymerase following manufacturer’s instructions (Table 1):
Table 1.Example PCR recipe using Phusion polymerase
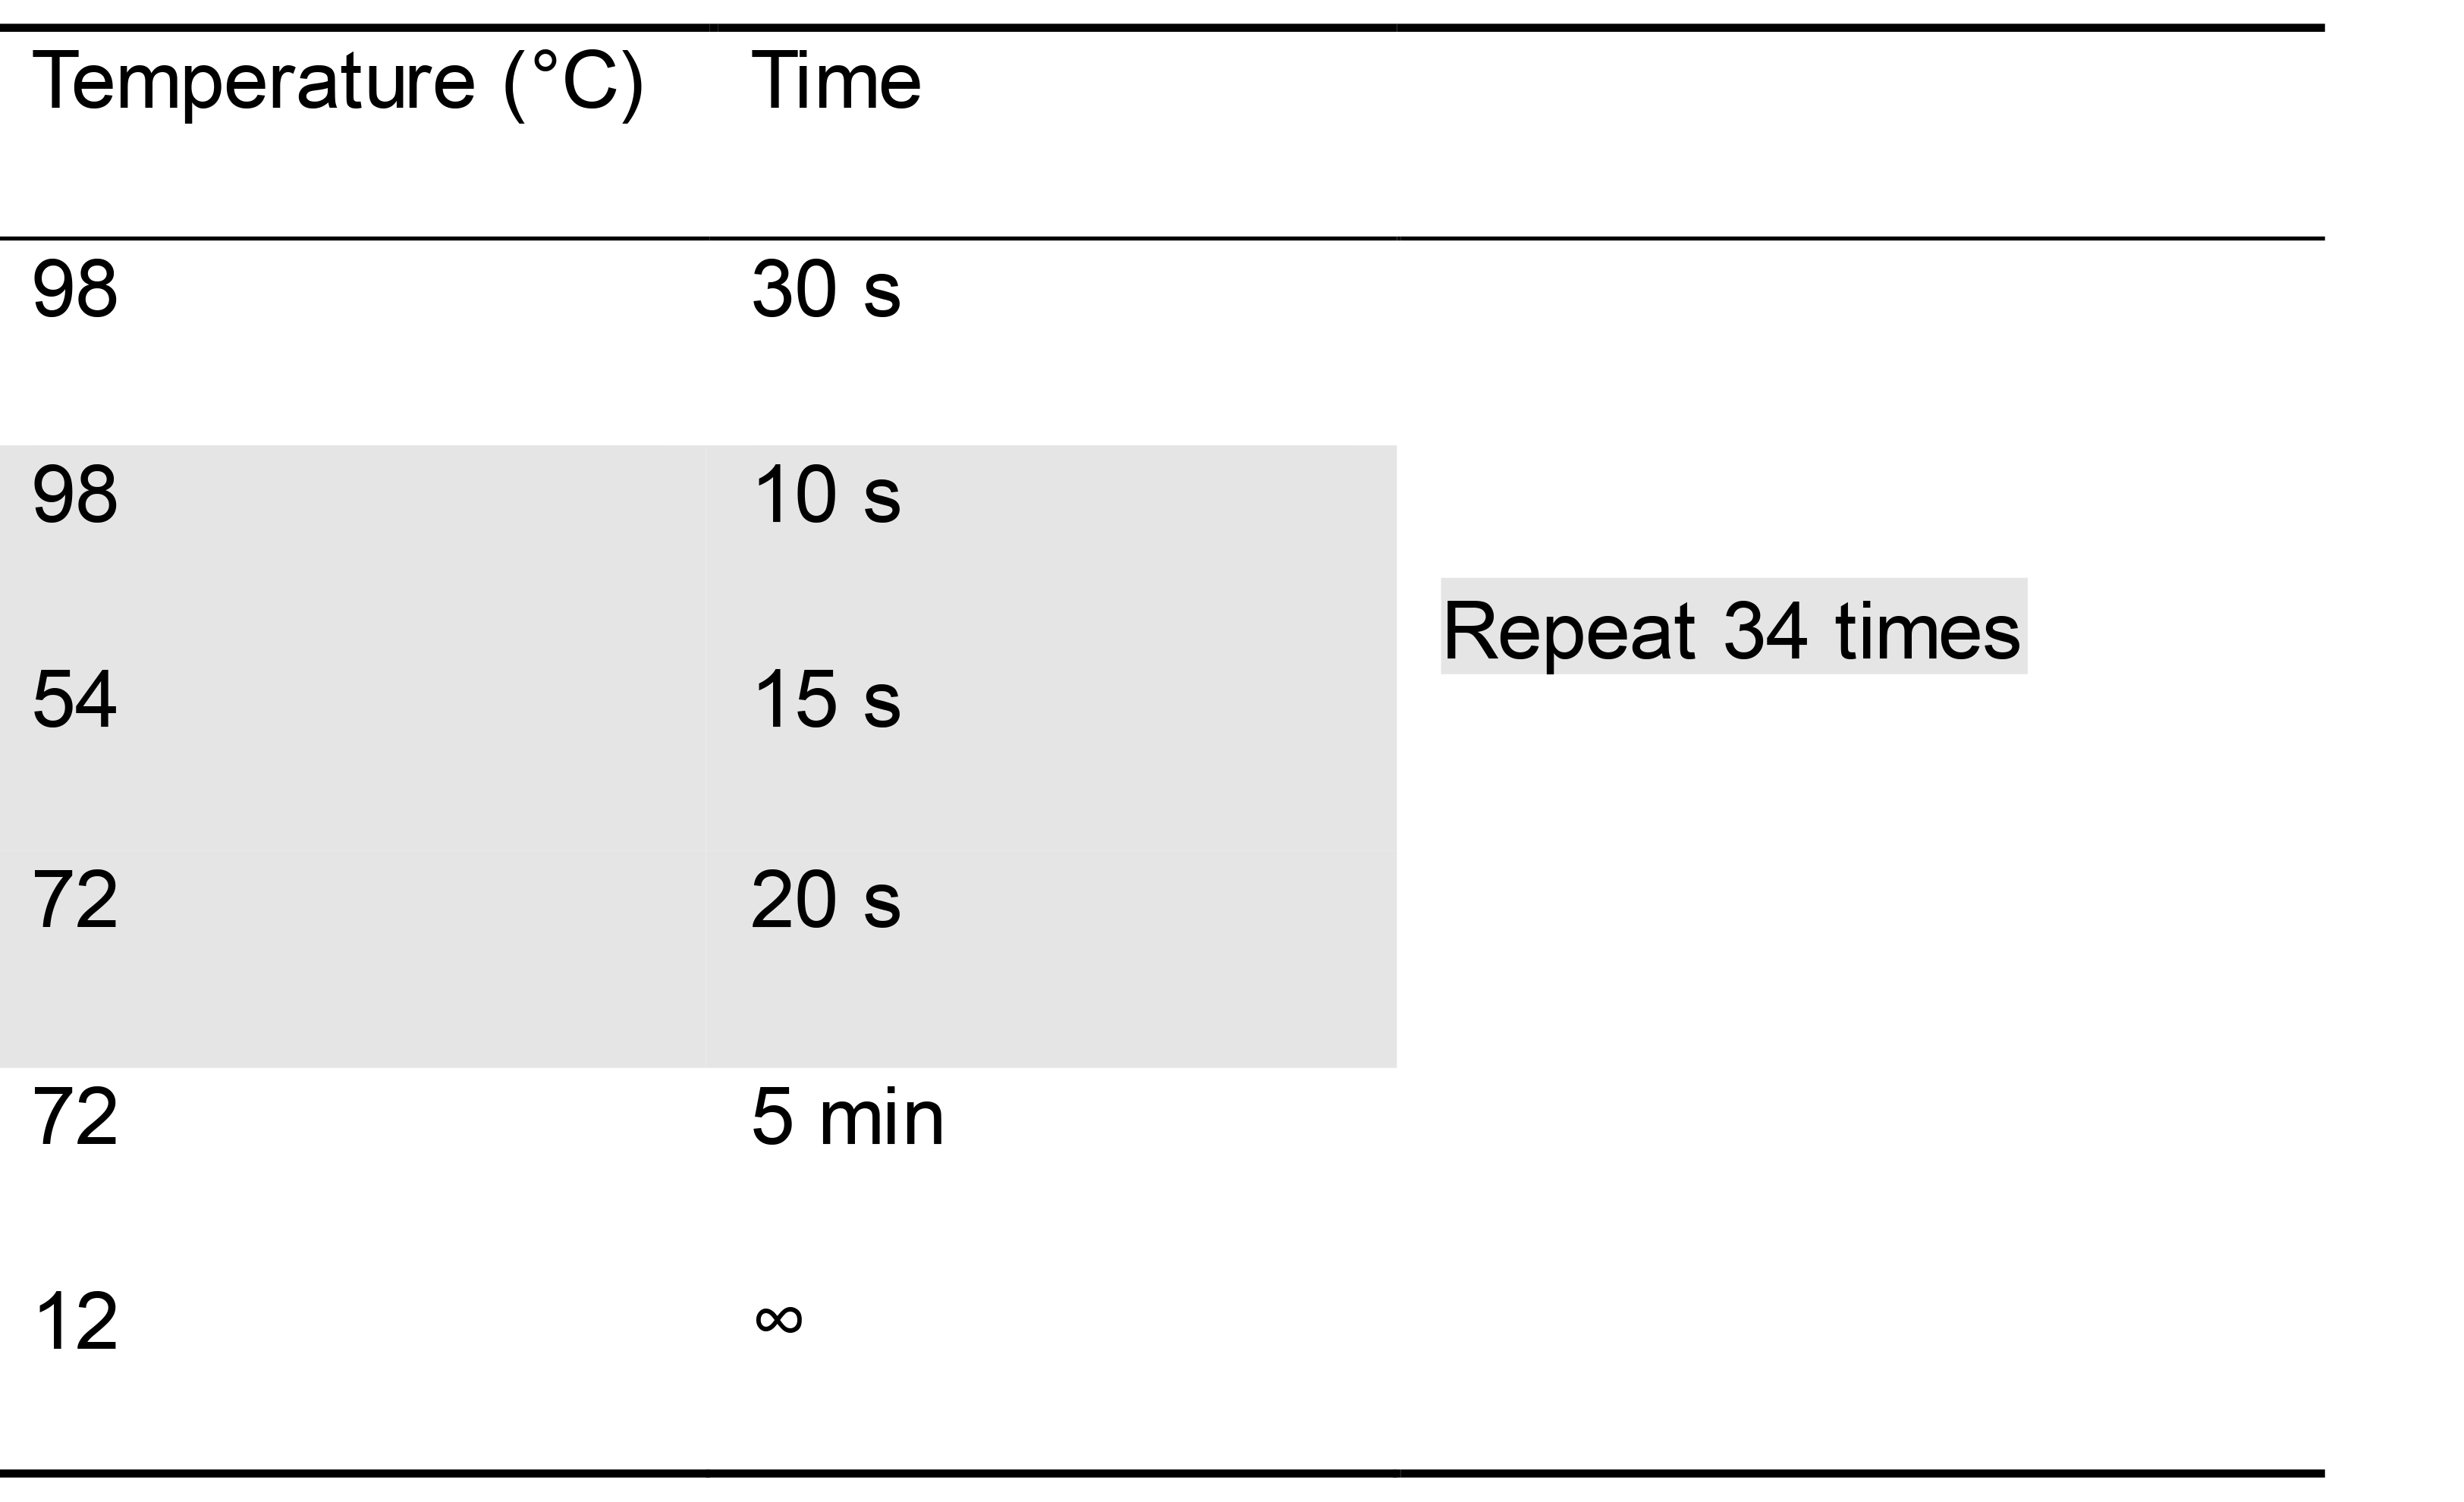
Program your thermocycler appropriately to allow for amplification of an approximately 300 bp amplicon with the polymerase you are using (Table 2).
Table 2. Example PCR conditions to amplify rplU when using Phusion polymerase
Run amplicons on an electrophoresis gel to check for gDNA contamination. Include a DNA ladder and the positive control sample. Contaminated RNA samples will have a band around 300 bp in length, the same length as the positive control (PAO1 gDNA)’s amplicon. For any samples with gDNA contamination, repeat the treatment with Promega RQ1 DNase.
Assess expression of target genes by quantitative Reverse Transcriptase PCR (qRT-PCR)
Determine total RNA concentration and purity. Use a NanoDrop or other spectrophotometer to measure optical density of each RNA sample at 260 nm, 230 nm, and 280 nm. Dilute samples 1:50 in 100 µl H2O and repeat the measurement.
To estimate concentration, an OD260 of 1 unit equals approximately 40 µg/ml RNA.
A sufficiently pure RNA sample will have 260/280 and 260/230 ratios above 1.8.
Prepare genomic DNA standards from 20ng to 0.02pg using PAO1 gDNA diluted in TE buffer.
Set up qRT-PCR reactions using the manufacturer’s instructions. Use 2 or 3 µl of RNA per reaction, depending on the final concentration of RNA you measured above (add no more than 500 ng of RNA to each reaction).
Control primers:
ampR-F-qPCR: 5’-GCGCCATCCCTTCATCG-3’
ampR-R-qPCR: 5’-GATGTCGACGCGGTTGTTG-3’
Experimental primers:
pslA-F-qPCR: 5’-AAGATCAAGAAACGCGTGGAAT-3’
pslA-R-qPCR: 5’-TGTAGAGGTCGAACCACACCG-3’
pelA-F-qPCR: 5’-CCTTCAGCCATCCGTTCTTCT-3’
pelA-R-qPCR: 5’-TCGCGTACGAAGTCGACCTT-3’
Record information regarding your qPCR run according to the Minimal Information for Publication of Quantitative Real-Time PCR Experiments (MIQE) Guidelines (Bustin et al., 2009 and 2010).
The following steps describe how to measure expression of 2 target genes (pelA and pslA) and one control gene (ampR) by quantitative Reverse Transcriptase PCR (qRT-PCR) using the iTaq Universal SYBR Green One-Step kit (Bio-Rad, Hercules, CA) and a CFX96 Touch Real-Time PCR detection system (Bio-Rad, Hercules, CA). Conditions will vary depending on the target genes, qPCR kit, and the thermalcycler used.
Data analysis
Experiments should be performed in biological triplicates. For this protocol, a biological replicate is defined as a biofilm grown, harvested, and flow-sorted on a separate experimental day.
We used the comparative Ct method (ΔΔCt) (Schmittgen and Livak, 2008) to determine the fold change in target gene expression between the reporter “on” and “off” populations.
From the qRT-PCR dataset, calculate the ΔCt for each experimental gene (e.g., pelA, pslA) in either the sorted “on” or “off” populations by subtracting the Ct of the control gene (ampR) from the experimental gene’s Ct. For example, this is the ΔCt for pelA in biofilm cells that were sorted as having high c-di-GMP reporter activity:
∆Ct = CtpelA-ON – CtampR-ON
Then, calculate the ΔΔCt by subtracting the ΔCt of pelA in the reporter “off” population from the ΔCt of pelA in the reporter “on” population.
Finally, to determine the fold change in expression in the reporter “on” population compared to the reporter “off” population, take 2^- ΔΔCt. Data can now be presented as the average fold change in PelA or PslA expression in the PcdrA reporter sorted “on” population (high GFP) relative to the “off” population (low GFP) for the three biological replicates (see Figure 4 for an example of how these data can be presented).
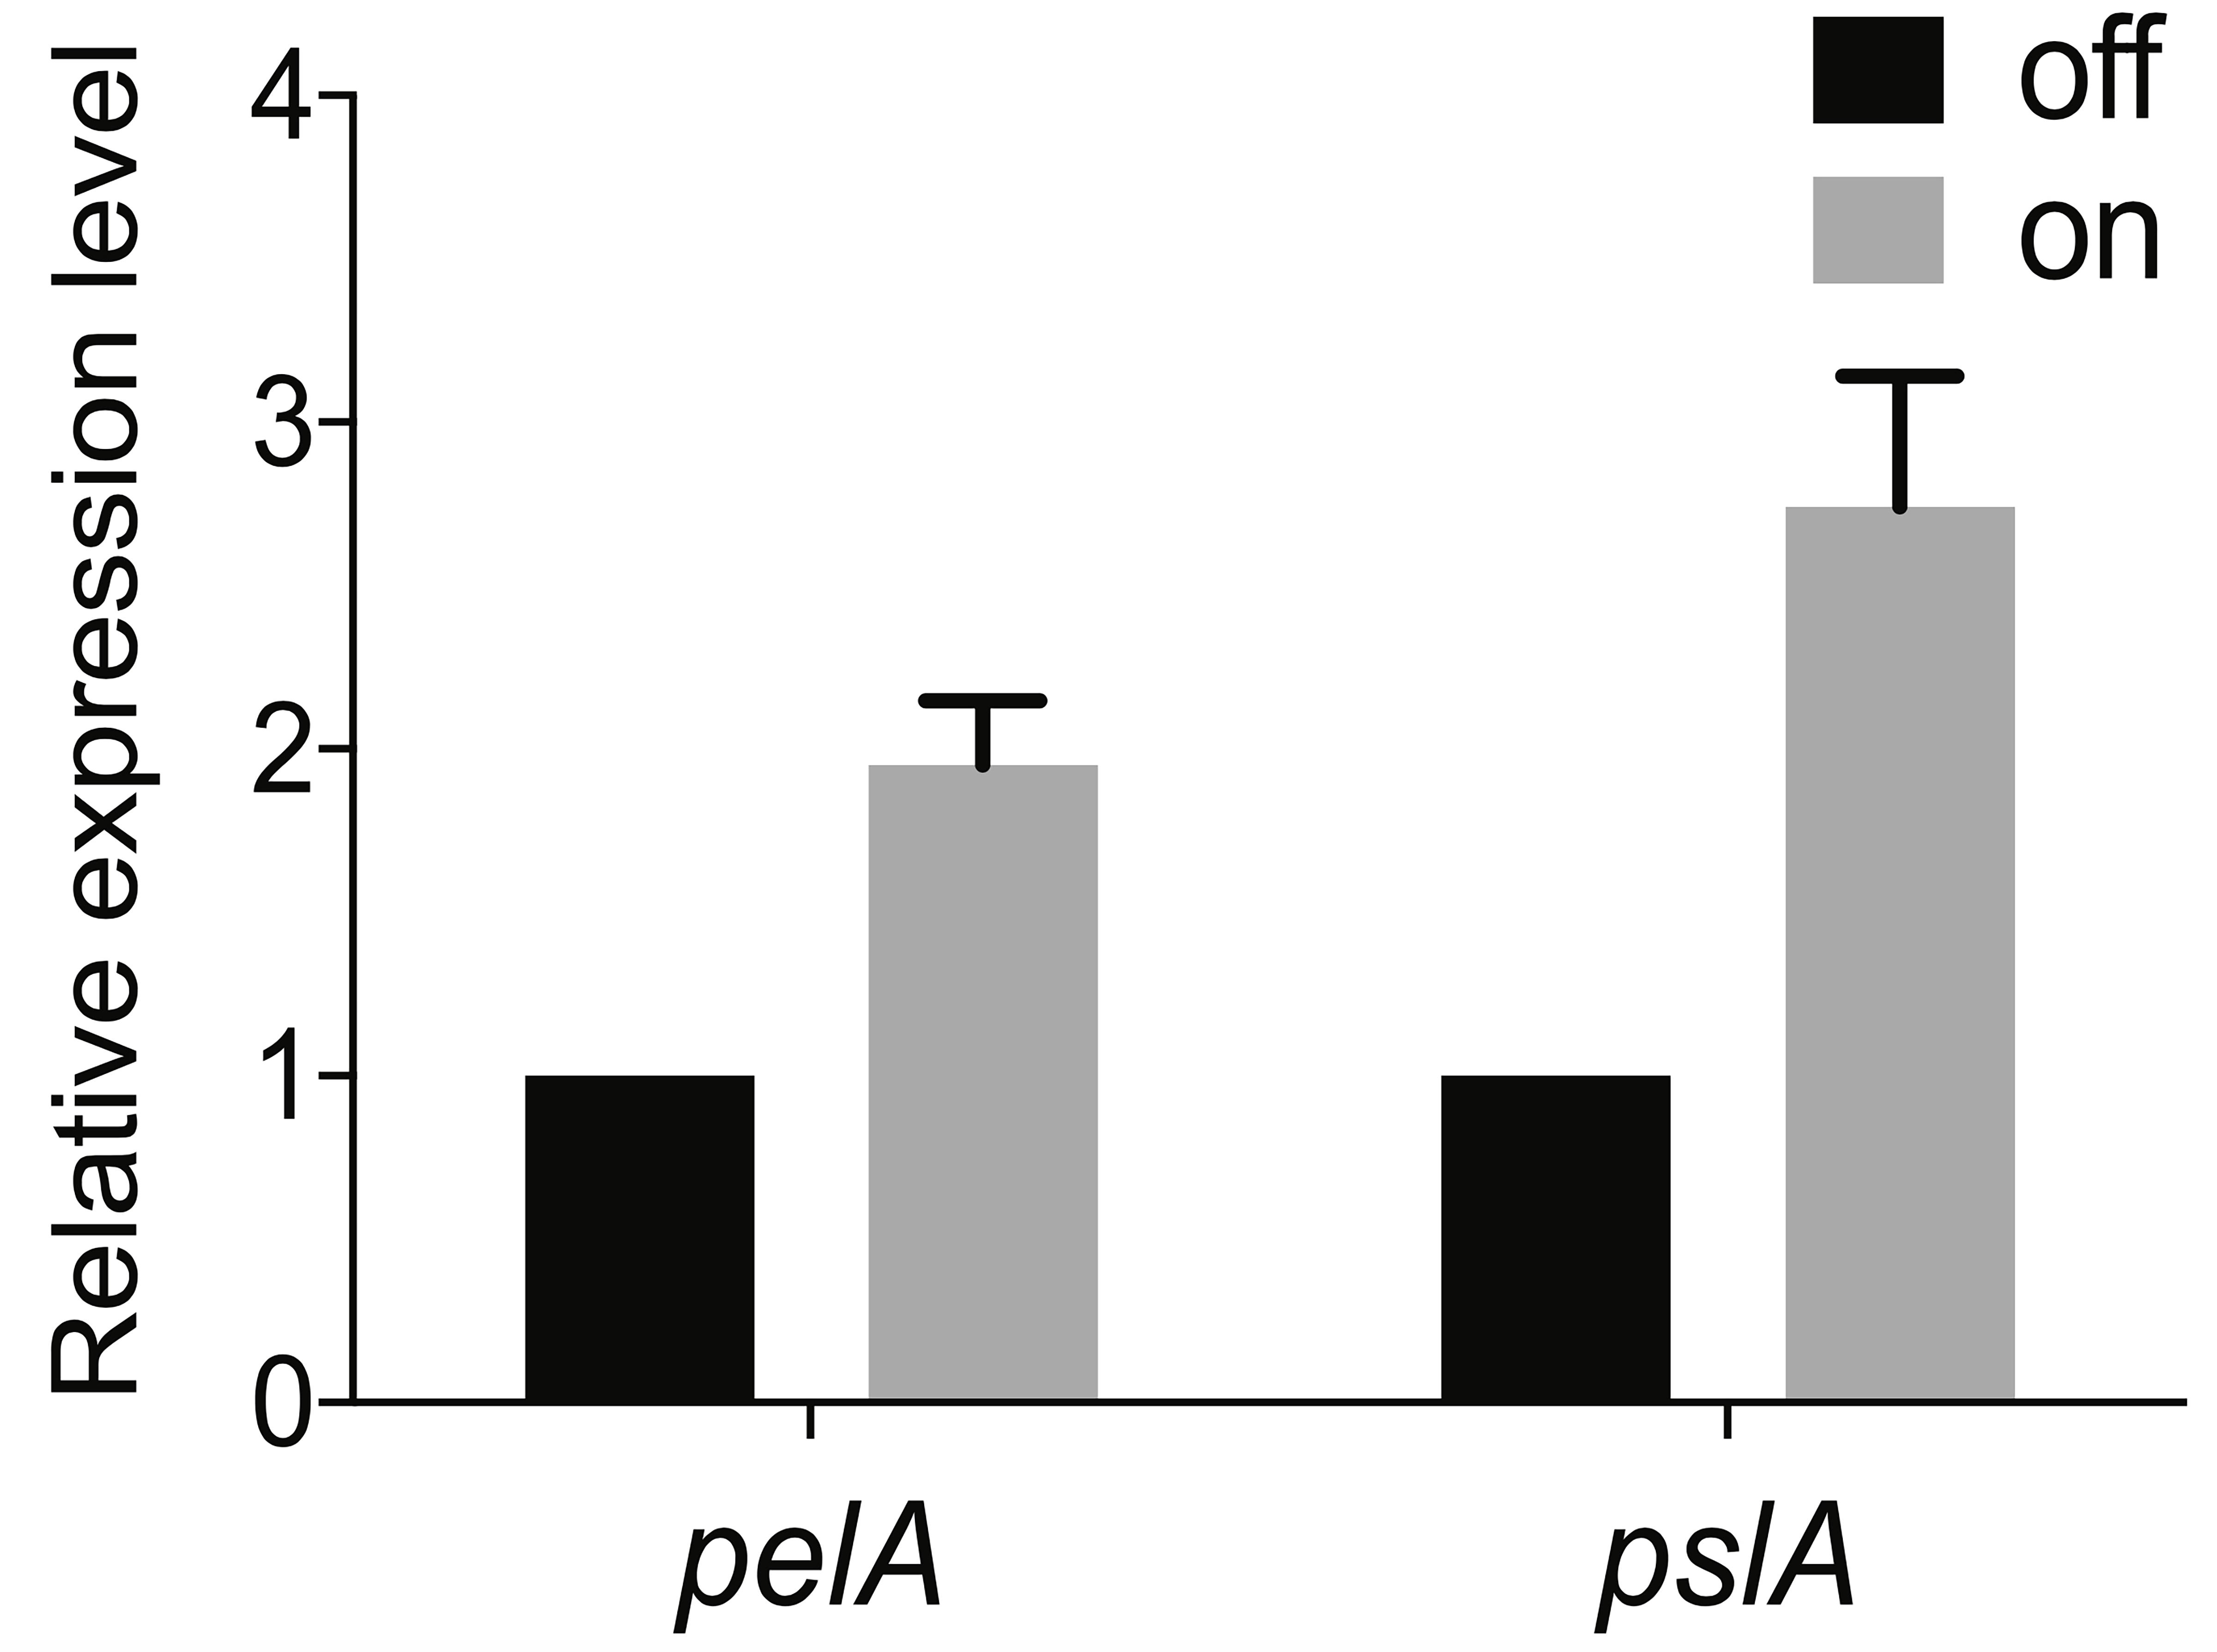
Figure 4. Average fold change in pelA and pslA mRNA transcript levels between the sorted c-di-GMP “off” and “on” populations. Levels of expression of Pel or Psl mRNA in the “on” population were normalized to the “off” population. This figure was reprinted from Figure 1E in Armbruster et al. (2019).
Recipes
LB Broth (Miller’s)
10 g Peptone
5 g Gibco Bacto Yeast extract
10 g NaCl
Ingredients should be combined in one liter of purified and deionized water, then autoclaved to sterilize.
Modified Jensen’s Chemically Defined Media ( Jensen et al., 1980; Jennings et al., 2015)
*NaCl, 85.6 mM
*K2HPO4, 14.4 mM
*Sodium glutamate, 92 mM
*Valine, 24 mM
*Phenylalanine, 8 mM
Glucose, 70 mM
MgSO4, 1.33 mM
CaCl2, 0.14 mM
FeSO4, 0.0039 mM
ZnSO4, 0.0085 mM
Ingredients with an asterisk should be combined, pH adjusted to 7.3, and then autoclaved to sterilize. The remaining ingredients (metals and glucose) should be prepared separately and filter-sterilized. After autoclaving, allow the solution to cool to room temperature, then add the remaining filter-sterilized ingredients.
Phosphate-buffered saline (PBS), pH 7.4
8 g NaCl
0.2 g KCl
1.44 g Na2HPO4
0.24 g KH2PO4
Combine the ingredients to a final volume of 950 ml in purified and deionized water, adjust pH to 7.4, then add more water until the final volume is 1 L.
Acknowledgments
This work was supported by a Cystic Fibrosis Foundation Carol Basbaum Memorial Research Fellowship (ARMBRU19F0) and National Institutes of Health T32HL129949 to CRA and R01AI077628 and R01AI143916-01 to MRP. This protocol was used in a recently published work by the authors (Armbruster et al., 2019). Illustrations were created with biorender.com.
Competing interests
The authors have no competing interests to declare.
Ethics
No human or animal specimens used.
References
- Ackermann, M. (2015). A functional perspective on phenotypic heterogeneity in microorganisms. Nat Rev Microbiol 13(8): 497-508.
- Andersen, J. B., Sternberg, C., Poulsen, L. K., Bjorn, S. P., Givskov, M. and Molin, S. (1998). New unstable variants of green fluorescent protein for studies of transient gene expression in bacteria. Appl Environ Microbiol 64(6): 2240-2246.
- Armbruster, C. R., Lee, C. K., Parker-Gilham, J., de Anda, J., Xia, A., Zhao, K., Murakami, K., Tseng, B. S., Hoffman, L. R., Jin, F., Harwood, C. S., Wong, G. C. and Parsek, M. R. (2019). Heterogeneity in surface sensing suggests a division of labor in Pseudomonas aeruginosa populations. Elife 8: e45084.
- Arora, S. K., Ritchings, B. W., Almira, E. C., Lory, S. and Ramphal, R. (1997). A transcriptional activator, FleQ, regulates mucin adhesion and flagellar gene expression in Pseudomonas aeruginosa in a cascade manner. J Bacteriol 179(17): 5574-5581.
- Baraquet, C. and Harwood, C. S. (2016). FleQ DNA Binding Consensus Sequence Revealed by Studies of FleQ-Dependent Regulation of Biofilm Gene Expression in Pseudomonas aeruginosa. J Bacteriol 198(1): 178-186.
- Baraquet, C., Murakami, K., Parsek, M. R. and Harwood, C. S. (2012). The FleQ protein from Pseudomonas aeruginosa functions as both a repressor and an activator to control gene expression from the pel operon promoter in response to c-di-GMP. Nucleic Acids Res 40(15): 7207-7218.
- Borlee, B. R., Goldman, A. D., Murakami, K., Samudrala, R., Wozniak, D. J. and Parsek, M. R. (2010). Pseudomonas aeruginosa uses a cyclic-di-GMP-regulated adhesin to reinforce the biofilm extracellular matrix. Mol Microbiol 75(4): 827-842.
- Bustin, S. A., Benes, V., Garson, J. A., Hellemans, J., Huggett, J., Kubista, M., Mueller, R., Nolan, T., Pfaffl, M. W., Shipley, G. L., Vandesompele, J. and Wittwer, C. T. (2009). The MIQE guidelines: minimum information for publication of quantitative real-time PCR experiments. Clin Chem 55(4): 611-622.
- Bustin, S.A., Beaulieu, J. F., Huggett, J., Jaggi, R., Kibenge, F.S., Olsvik, P.A., Penning, L.C. and Toegel, S. (2010). MIQE précis: Practical implementation of minimum standard guidelines for fluorescence-based quantitative real-time PCR experiments. BMC Mol Biol 11: 74.
- Güvener, Z. T. and Harwood, C. S. (2007). Subcellular location characteristics of the Pseudomonas aeruginosa GGDEF protein, WspR, indicate that it produces cyclic-di-GMP in response to growth on surfaces. Mol Microbiol 66(6): 1459-1473.
- Hengge, R. (2009). Principles of c-di-GMP signalling in bacteria. Nat Rev Microbiol 7(4): 263-273.
- Hickman, J. W. and Harwood, C. S. (2008). Identification of FleQ from Pseudomonas aeruginosa as a c-di-GMP-responsive transcription factor. Mol Microbiol 69(2): 376-389.
- Hickman, J. W., Tifrea, D. F. and Harwood, C. S. (2005). A chemosensory system that regulates biofilm formation through modulation of cyclic diguanylate levels. Proc Natl Acad Sci U S A 102(40): 14422-14427.
- Huangyutitham, V., Guvener, Z. T. and Harwood, C. S. (2013). Subcellular clustering of the phosphorylated WspR response regulator protein stimulates its diguanylate cyclase activity. mBio 4(3): e00242-00213.
- Jennings, L.K., Storek, K.M., Ledvina, H.E., Coulon, C., Marmont, L.S., Sadovskaya, I., Secor, P.R., Tseng, B.S., Scian, M. and Filloux, A. (2015). Pel is a cationic exopolysaccharide that cross-links extracellular DNA in the Pseudomonas aeruginosa biofilm matrix. Proc Natl Acad Sci U S A 112: 11353-11358.
- Jensen, S. E., Fecycz, I. T. and Campbell, J. N. (1980). Nutritional factors controlling exocellular protease production by Pseudomonas aeruginosa. J Bacteriol 144(2): 844-847.
- Kulasakara, H., Lee, V., Brencic, A., Liberati, N., Urbach, J., Miyata, S., Lee, D. G., Neely, A. N., Hyodo, M., Hayakawa, Y., Ausubel, F. M. and Lory, S. (2006). Analysis of Pseudomonas aeruginosa diguanylate cyclases and phosphodiesterases reveals a role for bis-(3'-5')-cyclic-GMP in virulence. Proc Natl Acad Sci U S A 103(8): 2839-2844.
- Rybtke, M. T., Borlee, B. R., Murakami, K., Irie, Y., Hentzer, M., Nielsen, T. E., Givskov, M., Parsek, M. R. and Tolker-Nielsen, T. (2012). Fluorescence-based reporter for gauging cyclic di-GMP levels in Pseudomonas aeruginosa. Appl Environ Microbiol 78(15): 5060-5069.
- Schmittgen, T. D. and Livak, K. J. (2008). Analyzing real-time PCR data by the comparative C(T) method. Nat Protoc 3(6): 1101-1108.
- Zaitoun, I., Erickson, C.S., Schell, K. and Epstein, M. L. (2010). Use of RNAlater in fluorescence-activated cell sorting(FACS) reduces the fluorescence from GFP but not from DsRed. BMC Res Notes 3: 328-328.
Article Information
Copyright
![]() Armbruster and Parsek. This article is distributed under the terms of the Creative Commons Attribution License (CC BY 4.0).
Armbruster and Parsek. This article is distributed under the terms of the Creative Commons Attribution License (CC BY 4.0).
How to cite
Readers should cite both the Bio-protocol article and the original research article where this protocol was used:
- Armbruster, C. R. and Parsek, M. R. (2021). Analysis of Pseudomonas aeruginosa c-di-GMP High and Low Subpopulations Using Flow-assisted Cell Sorting (FACS) and Quantitative Reverse Transcriptase PCR (qRT-PCR). Bio-protocol 11(2): e3891. DOI: 10.21769/BioProtoc.3891.
- Armbruster, C. R., Lee, C. K., Parker-Gilham, J., de Anda, J., Xia, A., Zhao, K., Murakami, K., Tseng, B. S., Hoffman, L. R., Jin, F., Harwood, C. S., Wong, G. C. and Parsek, M. R. (2019). Heterogeneity in surface sensing suggests a division of labor in Pseudomonas aeruginosa populations. Elife 8: e45084.
Category
Microbiology > Microbial biofilm
Microbiology > Microbial signaling > Secondary messenger
Molecular Biology > RNA > qRT-PCR
Do you have any questions about this protocol?
Post your question to gather feedback from the community. We will also invite the authors of this article to respond.