- Protocols

- Articles and Issues
- For Authors
- About
- Become a Reviewer

Pipecolic Acid Quantification Using Gas Chromatography-coupled Mass Spectrometry
Published: Vol 10, Iss 23, Dec 5, 2020 DOI: 10.21769/BioProtoc.3841 Views: 4634
Reviewed by: Venkatasalam ShanmugabalajiAnonymous reviewer(s)
Original research article
The authors used this protocol in:

May 2020
Advertisement


Protocol Collections
Comprehensive collections of detailed, peer-reviewed protocols focusing on specific topics


Abstract
Pipecolic acid (Pip), a non-proteinacious product of lysine catabolism, is an important regulator of immunity in plants and humans alike. For instance, Pip accumulation is associated with the genetic disorder Zellweger syndrome, chronic liver diseases, and pyridoxine-dependent epilepsy in humans. In plants, Pip accumulates upon pathogen infection and is required for plant defense. The aminotransferase ALD1 catalyzes biosynthesis of Pip precursor piperideine-2-carboxylic acid, which is converted to Pip via ornithine cyclodeaminase. A variety of methods are used to quantify Pip, and some of these involve use of expensive amino acid analysis kits. Here, we describe a simplified procedure for quantitative analysis of Pip from plant tissues. Pipecolic acid was extracted from leaf tissues along with an internal standard norvaline, derivatized with propyl chloroformate and analyzed by gas chromatography-coupled mass spectrometry using selective ion mode. This procedure is simple, economical, and efficient and does not involve isotopic internal standards or multiple-step derivatizations.
Keywords: Pipecolic acidBackground
Pip, a non-protein amino acid derivative of lysine, accumulates in local and distal tissue of pathogen infected plants and in body fluids of patients with peroxisomal disorders (Schutgens et al., 1986; Yoon and An, 2010; Návarová et al., 2012; Wang et al., 2018). In plants, Pip is synthesized from lysine via ALD1 (AGD2 like defense response protein) encoded aminotransferase (Návarová et al., 2012). ALD1 localizes at the chloroplast and converts lysine to ϵ-amino-α-keto caproic acid, which then cyclizes to form 1-piperideine-2 carboxylic acid (P2C) (Ding et al., 2016; Hartmann et al., 2017). The P2C intermediate is subsequently converted to Pip by ornathine cyclodeaminase (encoded by SARD4) (Ding et al., 2016; Hartmann et al., 2017). Pip accumulation upon pathogen infection is associated with the induction of systemic acquired resistance (SAR), a form of broad-spectrum defense that protects uninfected parts of the plant against secondary infections. Pip confers SAR by increasing levels of the free radicals, nitric oxide (NO) and reactive oxygen species (ROS), which act upstream of glycerol-3-phosphate (G3P). Thus, a linear pathway comprising Pip→NO↔ROS→AzA→G3P functions in parallel with salicylic acid-derived signaling, and that both pathways are essential for the induction of SAR (Chanda et al., 2011; Yu et al., 2013; Gao et al., 2014; Wang et al., 2014; Bernsdorff et al., 2016; Lim et al., 2016; Wenig et al., 2019). Pip and G3P have also been suggested to operate in a positive feedback loop that functions upstream of volatile pinenes (Wenig et al., 2019). Notably, de novo synthesis of Pip in distal tissues is dependent on both SA and G3P (Wang et al., 2018). These results suggest that metabolites in a signaling cascade can stimulate biosynthesis of each other depending on their relative levels and their site of action. Notably, ALD1-derived factors (such as Pip) also contribute to SAR-associated transcriptional reprograming in the systemic tissue since pathogen-responsive transcriptional changes in the distal tissue are almost completely absent in ald1 mutant plants (Gruner et al., 2013). Exogenous application of pipecolic acid also enhances disease resistance against bacterial and viral pathogens in Nicotiana plants (Vogel-Adghough et al., 2013; Wang et al., 2019). Recent work has shown that Pip levels are regulated by calmodulin-binding transcription factors (Kim et al., 2020; Sun et al., 2020), calcium-dependent protein kinase 5 (Guerra et al., 2020), and Jumonji domain containing K3K4 demethylase (Li et al., 2019). Thus, determination of pipecolic acid in the plant tissues is an integral part of research on plant defense.
In the present method, we used propyl chloroformate based one-step derivatization procedure for quantification of Pip from Arabidopsis leaves. Norvaline was used as an internal standard and the derivatized products were analysed by gas chromatography (GC)-mass spectrometry (MS) using selective ion monitoring (SIM) mode. Our method is based on two earlier procedures that either used methyl chloroformate to derivatize amino acids (Villas-Bôas et al., 2003) or propyl chloroformate based derivatization of amino acids which were extracted using a commercial kit (EZ:faast free amino acid analysis kit, Phenomenex) (Kugler et al., 2006). One other GC-MS based method for Pip quantification from human plasma involved trimethylsilyl- and trifluoroacyl-derivatizations (Yoon and An, 2010). This method is laborious and moreover uses [2H9]-Pip as an internal standard, which is ~1,000 times more expensive compared to norvaline. The reaction scheme for internal standard norvaline (Figure 1A) and the analyte pipecolic acid (Figure 1B) are shown in Figure 1. The method reported here is simple, cost effective, and can be used to process 100-200 samples in a day.
Figure 1. Derivatization reactions for internal standard L-norvaline (A) and analyte L-pipecolic acid (B) with propyl chloroformate.Propyl chloroformate reacts with both carboxyl and amino groups in basic conditions releasing HCl for respective condensation reactions. The HCl is neutralized by NaOH in the reaction mixture to produce H2O and NaCl. The mixed anhydride formed from the carboxyl group and propyl chloroformate is lost as CO2.
Materials and Reagents
BDTM Tuberculin syringe, 1 ml (Becton Dickinson, catalog number: 309659 )
Kimwipes, 1-Ply (Fisher, catalog number: 06-666 )
Microfuge tubes, 1.5 ml (Sarstedt, catalog number: 72.690.300 )
Disposable test tubes, 13 x 100 mm (VWR, catalog number: 47729-572 )
GC vials, 2 ml (Thermo Scientific, catalog number: C4000-1 )
Screw caps (Agilent; catalog number: 5182-0717 )
Pasteur pipets (Fisher, catalog numbers: 13-678-20A and 13-678-20C )
Micro capillary pipets (Kimble, catalog number: 71900-20 )
Pseudomonas syringae expressing avrRpt2 (a gift from Dr. Barbara Kunkel, Washington University in St. Louis)
Arabidopsis thaliana ecotype Col-0 and mutant ald1 plants
Liquid nitrogen (American Welding & Gas, 22 Psi)
Magnesium chloride hexahydrate (Fisher, catalog number: BP214-500 )
Acetonitrile (ACROS, catalog number: 26827-0040 )
Hydrochloric acid (36.5-38% w/w, approximately 12 N) (Fisher, catalog number: A144-212 )
! CAUTION: The reagent is corrosive and volatile; wear protective gloves and handle it in a fume hood.
L-Norvaline (ACROS, catalog number: 6600-40-4 )
L-Pipecolic acid (TCI, catalog number: P1404 )
Sodium hydroxide (Fisher, catalog number: BP359-500 )
Methanol (Fisher, catalog number: A452-4 )
Pyridine (EMD Millipore, PX2020-6 )
Propyl chloroformate (Beantown Chemical, catalog number: 133200-100G )
CAUTION: This reagent is extremely toxic, volatile, flammable and corrosive and should be handled in a fume hood. Store at 4 °C in a closed jar containing some calcium sulfate desiccant (DRIERITE).
Anhydrous calcium sulfate desiccant (W. A. Hammond DRIERITE Company LTD, catalog number: 13005 ), which is used for storage of propyl chloroformate
Chloroform (EMD Millipore, catalog number: CX1058-1 )
CAUTION: The reagent is toxic and volatile and should be handled in a fume hood.
Sodium bicarbonate (Fisher, catalog number: BP328-1 )
Anhydrous sodium sulfate (Fisher, catalog number: S-421 )
10 mM Magnesium chloride (see Recipes)
Extraction buffer (see Recipes)
Internal standard (see Recipes)
1 M Sodium hydroxide (see Recipes)
50 mM Sodium bicarbonate (see Recipes)
Equipment
Plastic pestle (Axygen Scientific, catalog number: PES15BSI )
Milli-Q Advantage A10 Water purification system (EMD Millipore, model: Z00Q0V0WW )
Autoclave (Consolidated Stills & Sterilizers, model: SSR3APB )
Scissors (Harbor Freight Tools, catalog number: 62458 )
Balance (METTLER TOLEDO, model: AT261 )
Benchtop Dewar Flask (Thermo Scientific, catalog number: 10-194-100B )
Vortexer with a Styroform platform (Labnet, model: S0100 )
Table top centrifuge (Eppendorf, model: 5417C ), which is used for centrifuging microfuge tubes
Parker Source TriGas Generator (Parker Hannifin, model: LCMS-5000NA , compressor model: SF120872PH)
Table-top swing-arm centrifuge (Clay Adams, model: Dynac 0101 ), used for centrifuging disposable test tubes
Latex bulbs, 2 ml (VWR, catalog number: 82024-554 )
Gas chromatograph-mass spectrometer (GC-MS) (Agilent, model: 7890A-5977 )
GC column, HP-5MS (Agilent, catalog number: 19091J-413 )
Computer for GC-MS (Dell, model: 3430 )
Syringe for manual GC injection, 5 µl (Hamilton, catalog number: 87993 )
Software
MassHunter Workstation for qualitative and quantitative analysis (Agilent, software version: 10.0)
Enhanced MassHunter Workstation for data acquisition (Agilent, software version: 10.0)
MS spectral library (NIST)
Procedure
Equipment setup
Gas chromatography (GC) set up
Chromatography: perform chromatography with a 30-m capillary HP-5MS column. Use helium as the carrier gas at a constant pressure of 14 psi. Set the injection port temperature to 240 °C and the transfer line temperature to 280 °C. Samples are run in splitless mode. Use the following temperature program for chromatography as shown in Table 1.
Table 1. GC temperature used for profiling norvaline and pipecolic acid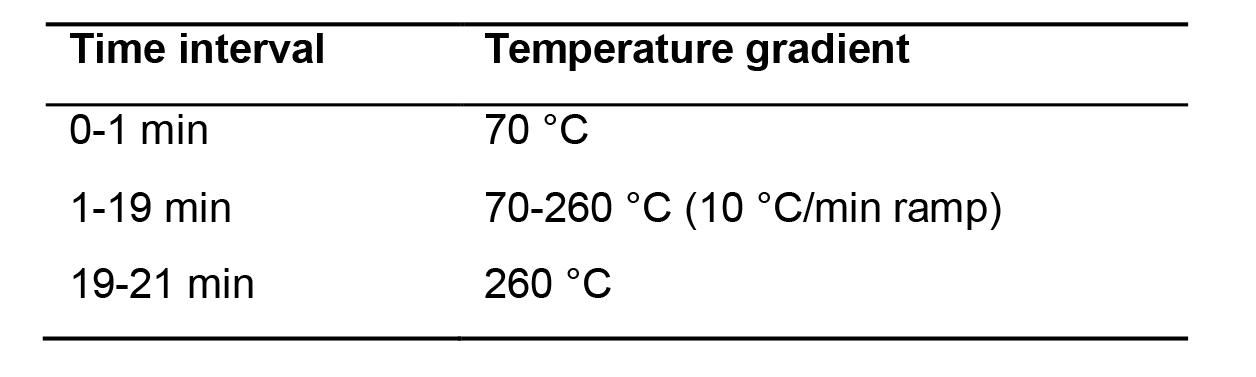
Mass spectrometer (MS) set up
Automatically tune the instrument according to the manufacturer’s instructions.
Sample preparation and analysis
For pathogen assays, the largest three leaves of ~4 weeks old plant are infiltrated with either 10 mM MgCl2 or the pathogen Pseudomonas syringae avrRpt2 using a needleless syringe from the abaxial side of the leaves. After leaf infiltration, remove excess droplets of 10 mM MgCl2 or pathogen suspension with Kimwipes. Figure 2 shows a pot of Arabidopsis thaliana ecotype Columbia-0 plants just after pathogen infiltration (Figure 2).
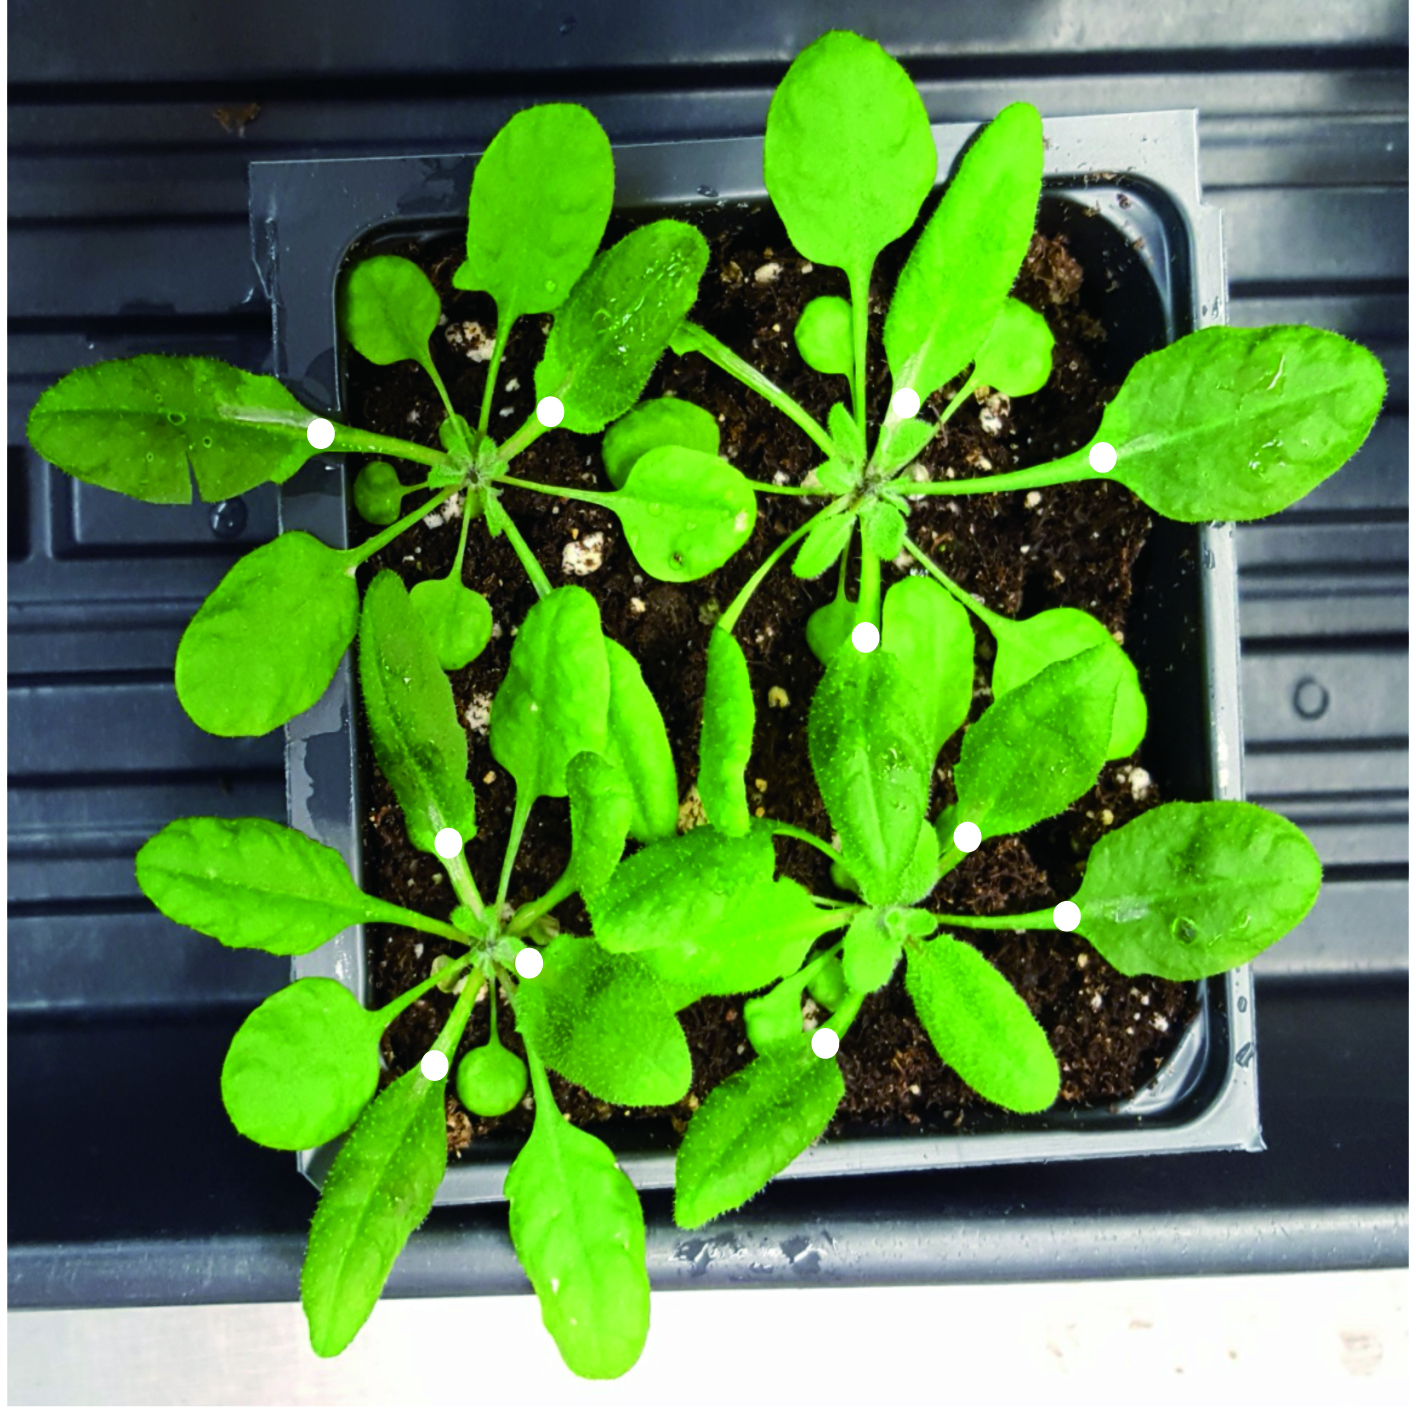
Figure 2. A picture of Arabidopsis thaliana ecotype Col-0 plants after infiltration with Pseudomonos syringae expressing avrRpt2. Infiltrated leaves were marked with a white marker.About 24 h later, collect ~100 mg infiltrated leaf tissue. The entire leaf was sampled using a pair of scissors.
Weigh the tissue with a balance that is accurate to the 1 mg digit. Record the weight of each sample. ∆CRITICAL STEP
Place the tissue in a microfuge tube, cap the tube, and drop it into a bucket of liquid nitrogen. Frozen tissues can be stored at -80 °C indefinitely. •PAUSE POINT
Grind the tissue with a plastic pestle.
Continue to the next step before the tissue is thawed. CRITICAL STEP
Add 400 µl of extraction buffer.
Add 20 µl of internal standard.
Vigorously shake for 15 min on a vortexer at room temperature.
Centrifuge for 5 min at 18,000 x g.
Supernatant is transferred to a 13 x 100 mm glass test tube. Extract can be stored at -80 °C indefinitely. •PAUSE POINT
Dry the supernatant with a stream of nitrogen gas. Dried extract can be stored at -80 °C indefinitely. •PAUSE POINT
Add 200 µl of 1 M sodium hydroxide.
Add 167 µl of methanol and 34 µl of pyridine.
Vortex vigorously and break up any pellets with a Pasteur pipet.
Add 20 µl of propyl chloroformate and vigorously vortex for 30 s. Use a glass micro capillary pipette instead of a plastic pipette tip to avoid contamination of plasticizers. CRITICAL STEP
Add another 20 µl of propyl chloroformate and vigorously vortex for 30 s.
Add 400 µl of chloroform and vortex vigorously for 10 s.
Add 400 µl of µl sodium bicarbonate (50 mM) and vortex vigorously for 10 s.
Centrifuge for 2 min with a table-top swing-arm centrifuge at about 80% speed (approximately 1,250 x g).
The lower layer is transferred to a new 13 x 100 mm glass test tube with a Pasteur pipet. The lower phase obtained after the transfer is approximately 0.375 ml.
Dry the chloroform extract by adding approximately 40 µl of anhydrous sodium sulfate and vortex until clear.
Centrifuge for 1 min with a table-top swing-arm centrifuge at about 80% speed (approximately 1,250 x g).
Transfer chloroform extract to a GC vial with a Pasteur pipet.
Inject 0.5-1 µl to GC/MS for analysis using selective ion monitoring mode (SIM) using quantifier ions 158 and 170 and qualifier ions 72 and 128.
GC-MS data from standard compound analysis
Figure 3 shows the total ion chromatogram (Figure 3A) and corresponding MS of norvaline (Figure 3B left panel) and Pip (Figure 3B right panel) standards run in scan mode.
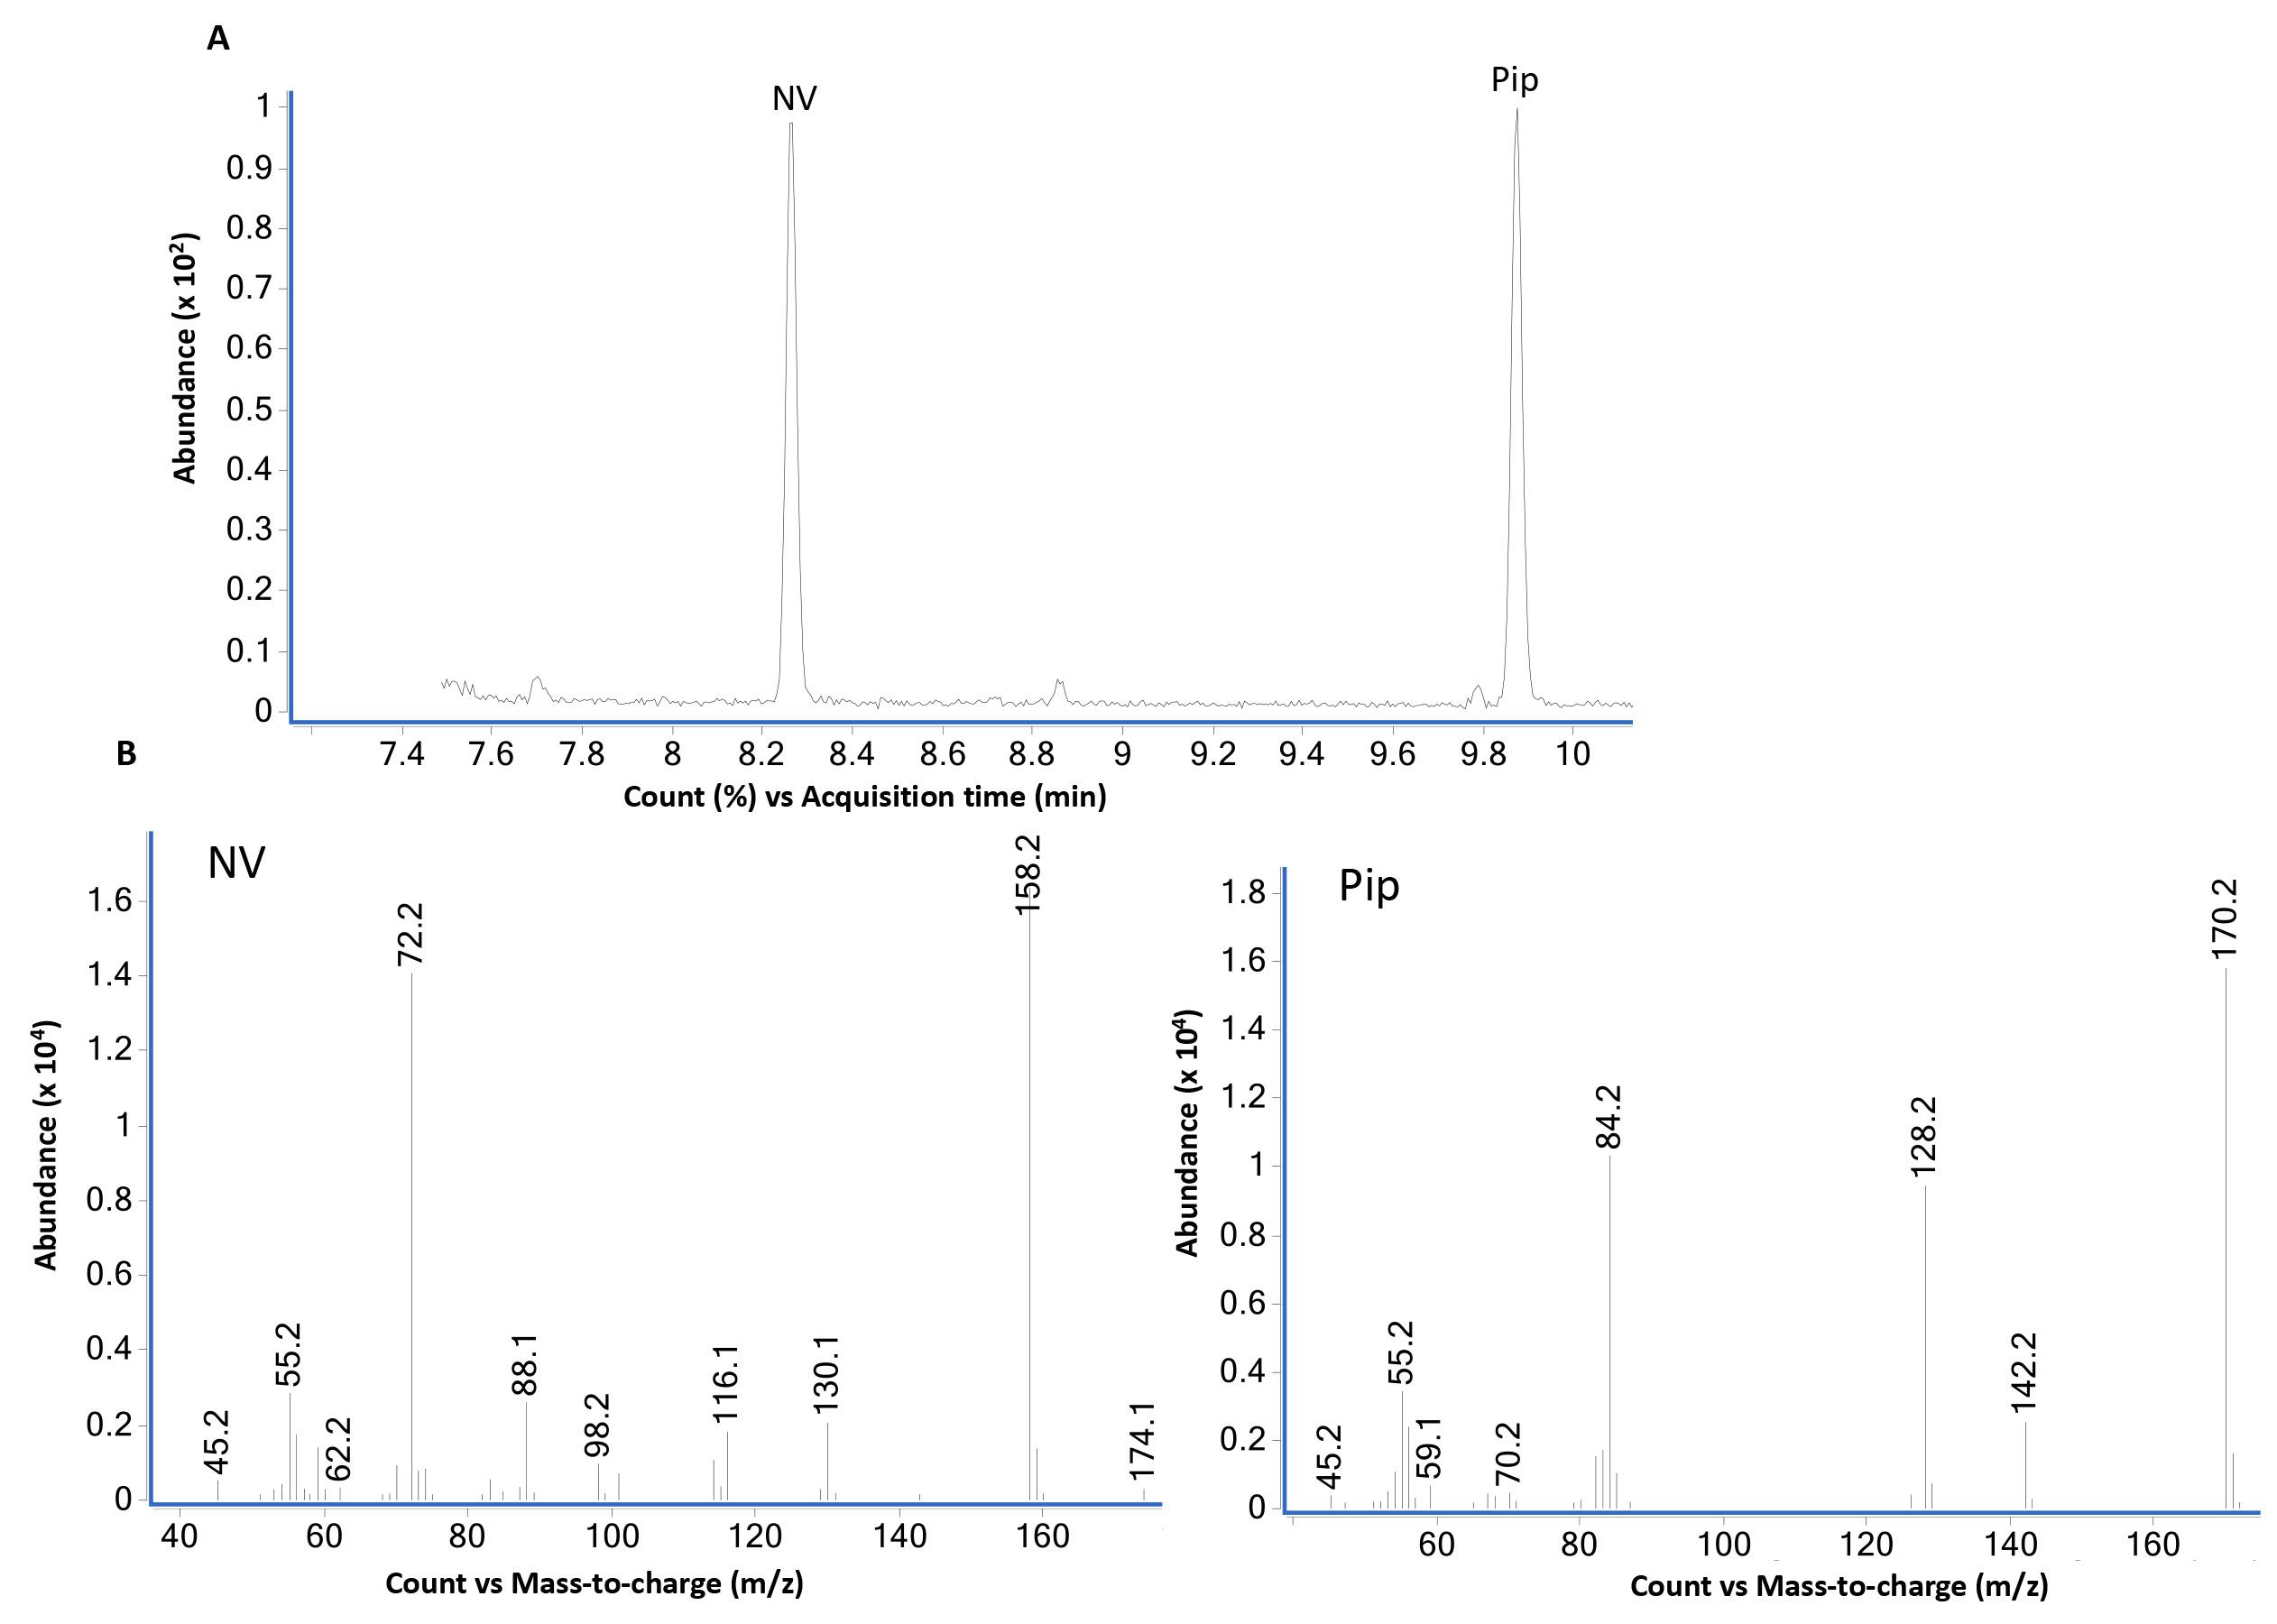
Figure 3. GC-MS analysis of norvaline (NV) and pipecolic acid (Pip) using scan mode. (A) GC-MS total ion chromatogram of equal weight (2 µg each) mixture of L-norvaline (NV) and L-pipecolic acid (Pip) derivatized with propyl chloroformate as described in B using scan mode. L-norvaline, N-propoxycarbonyl, propyl ester (at 8.2 min) and L-pipecolic acid, N-propoxycarbonyl, propyl ester (at 9.9 min) are the two major peaks. The bottom panel (B) shows mass spectra of NV- and Pip-N-propoxycarbonyl propyl esters. The loss of propoxycarbonyl group produces major ions 158 from NV and 170 from Pip derivatives.Figure 4 shows the GC-MS data from standard compound analysis using selective ion monitoring (SIM) mode. Based on the mass spectra shown in Figure 1, two major ions for each compound were used to monitor NV (158 and 72) and Pip (170, 128) in SIM mode.
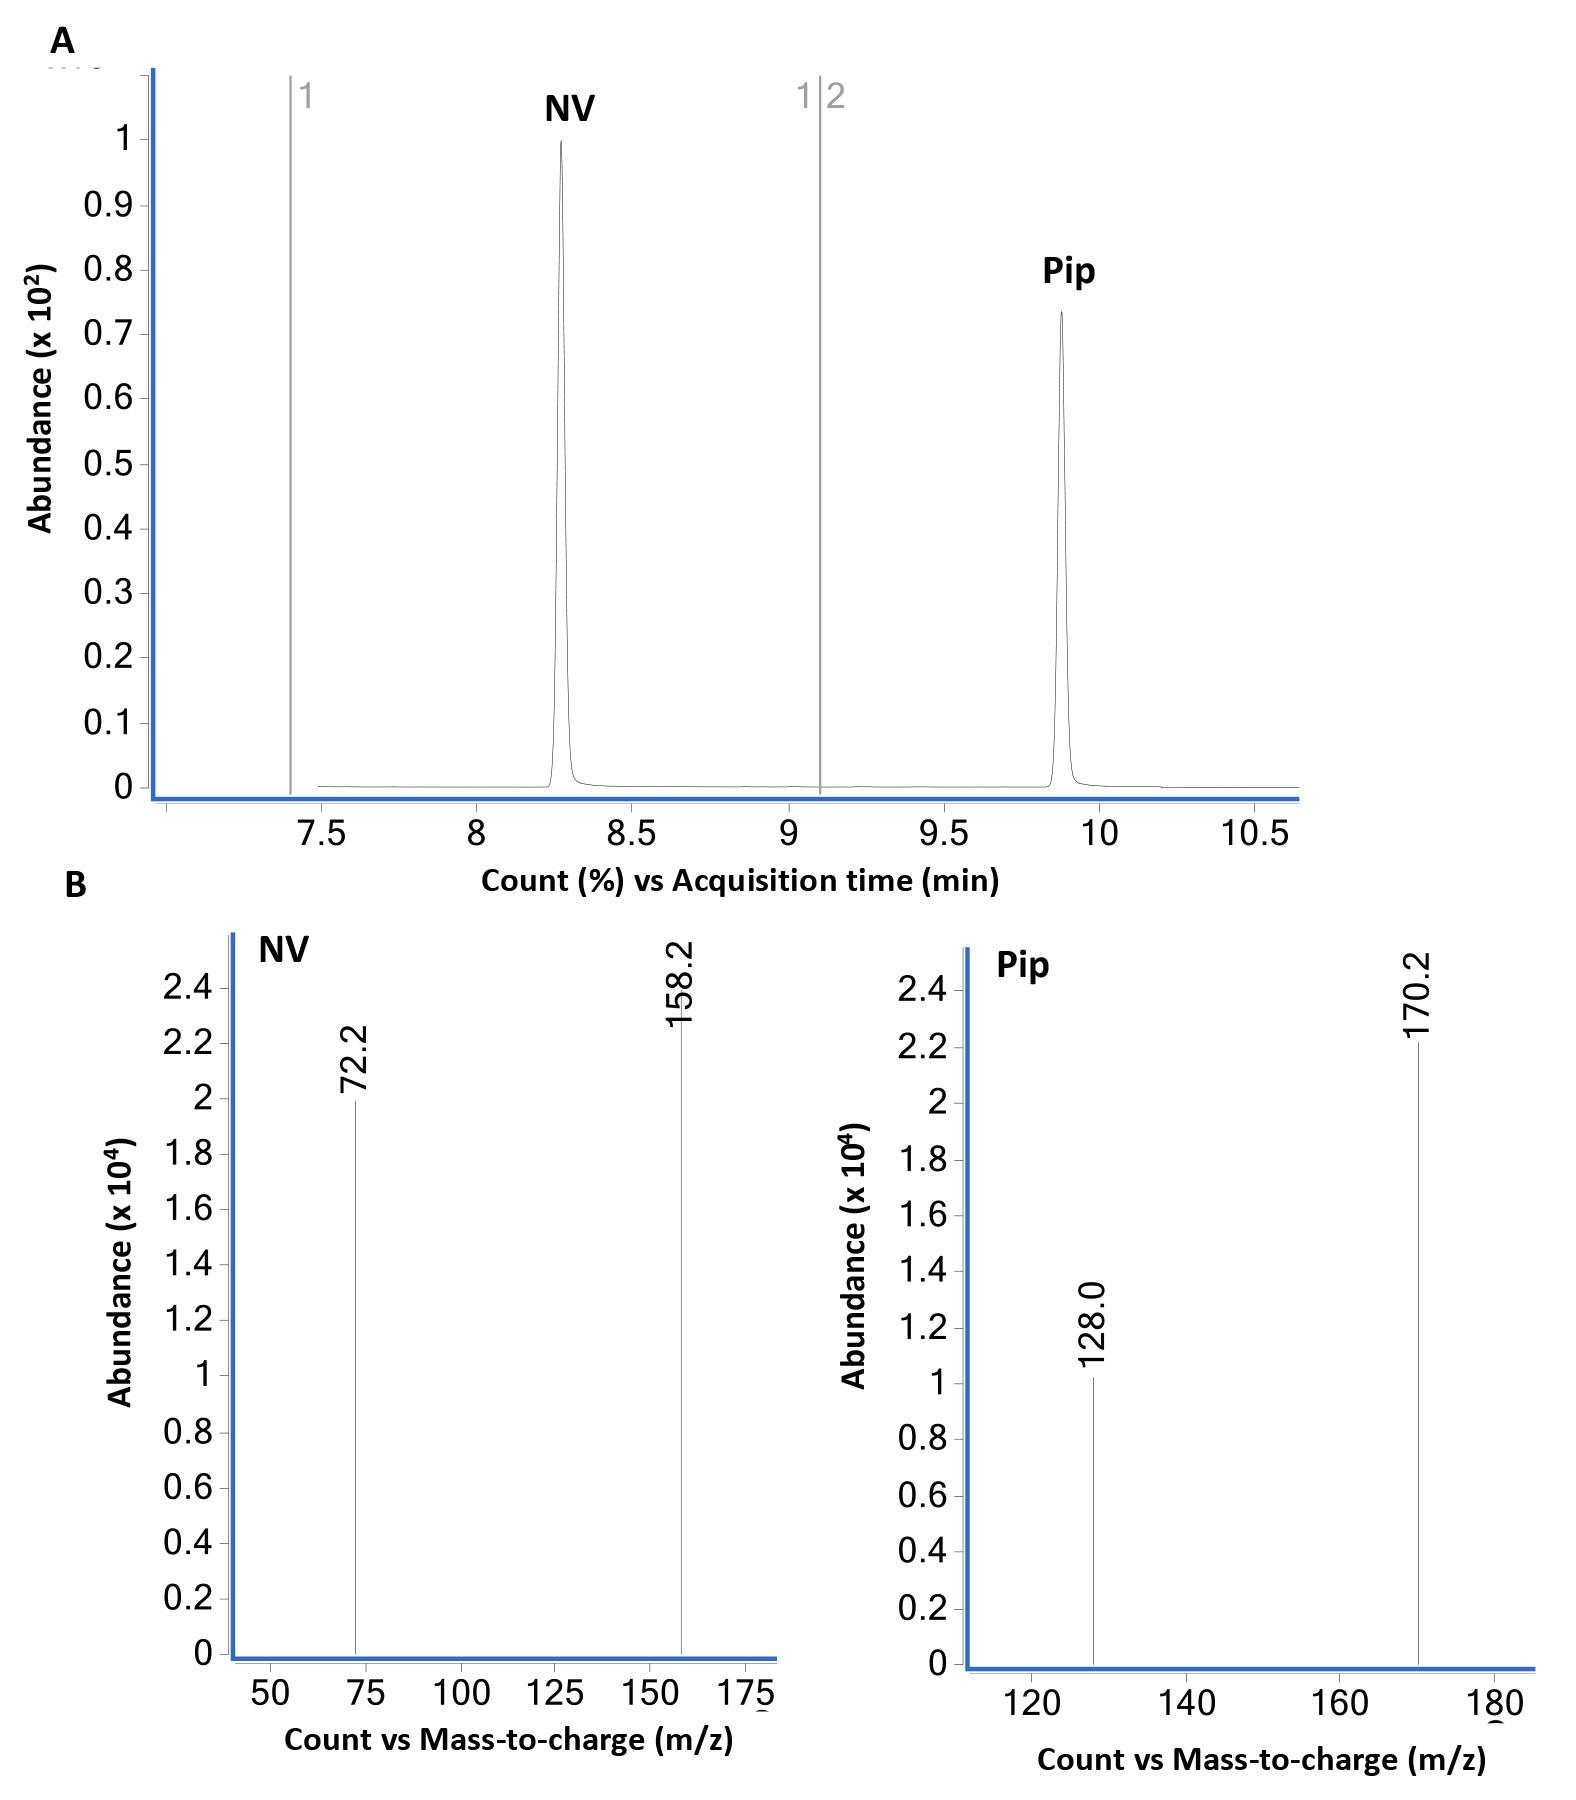
Figure 4. GC-MS analysis of norvaline (NV) and pipecolic acid (Pip) using selective ion monitoring (SIM) mode. (A) GC-MS total ion chromatogram of equal weight (2 µg each) mixture of NV and Pip derivatized with propyl chloroformate as described in B using SIM mode. NV- (at 8.2 min) and Pip-N-propoxycarbonyl propyl ester (at 9.9 min) are the two major peaks. The bottom panel (B) show mass spectra of NV- and Pip-N-propoxycarbonyl propyl esters in SIM mode selected for the major ions 158.2 and 72.2 (NV) and 172.2 and 128.0 (Pip). The dwell time for each ion was set at 25 ms. The SIM mode was set to monitor ions 158 and 72 in the time interval 7.4-9.1 min and ions 170 and 128 from 9.1-10.5 min. The relative abundance of major and qualifier ions monitored in SIM and scan modes was similar.
Pip levels in Arabidopsis leaf tissue
GC-MS data for pipecolic acid analysis from Arabidopsis thaliana leaf tissue samples using scan (Figure 5) and SIM (Figure 6) modes.
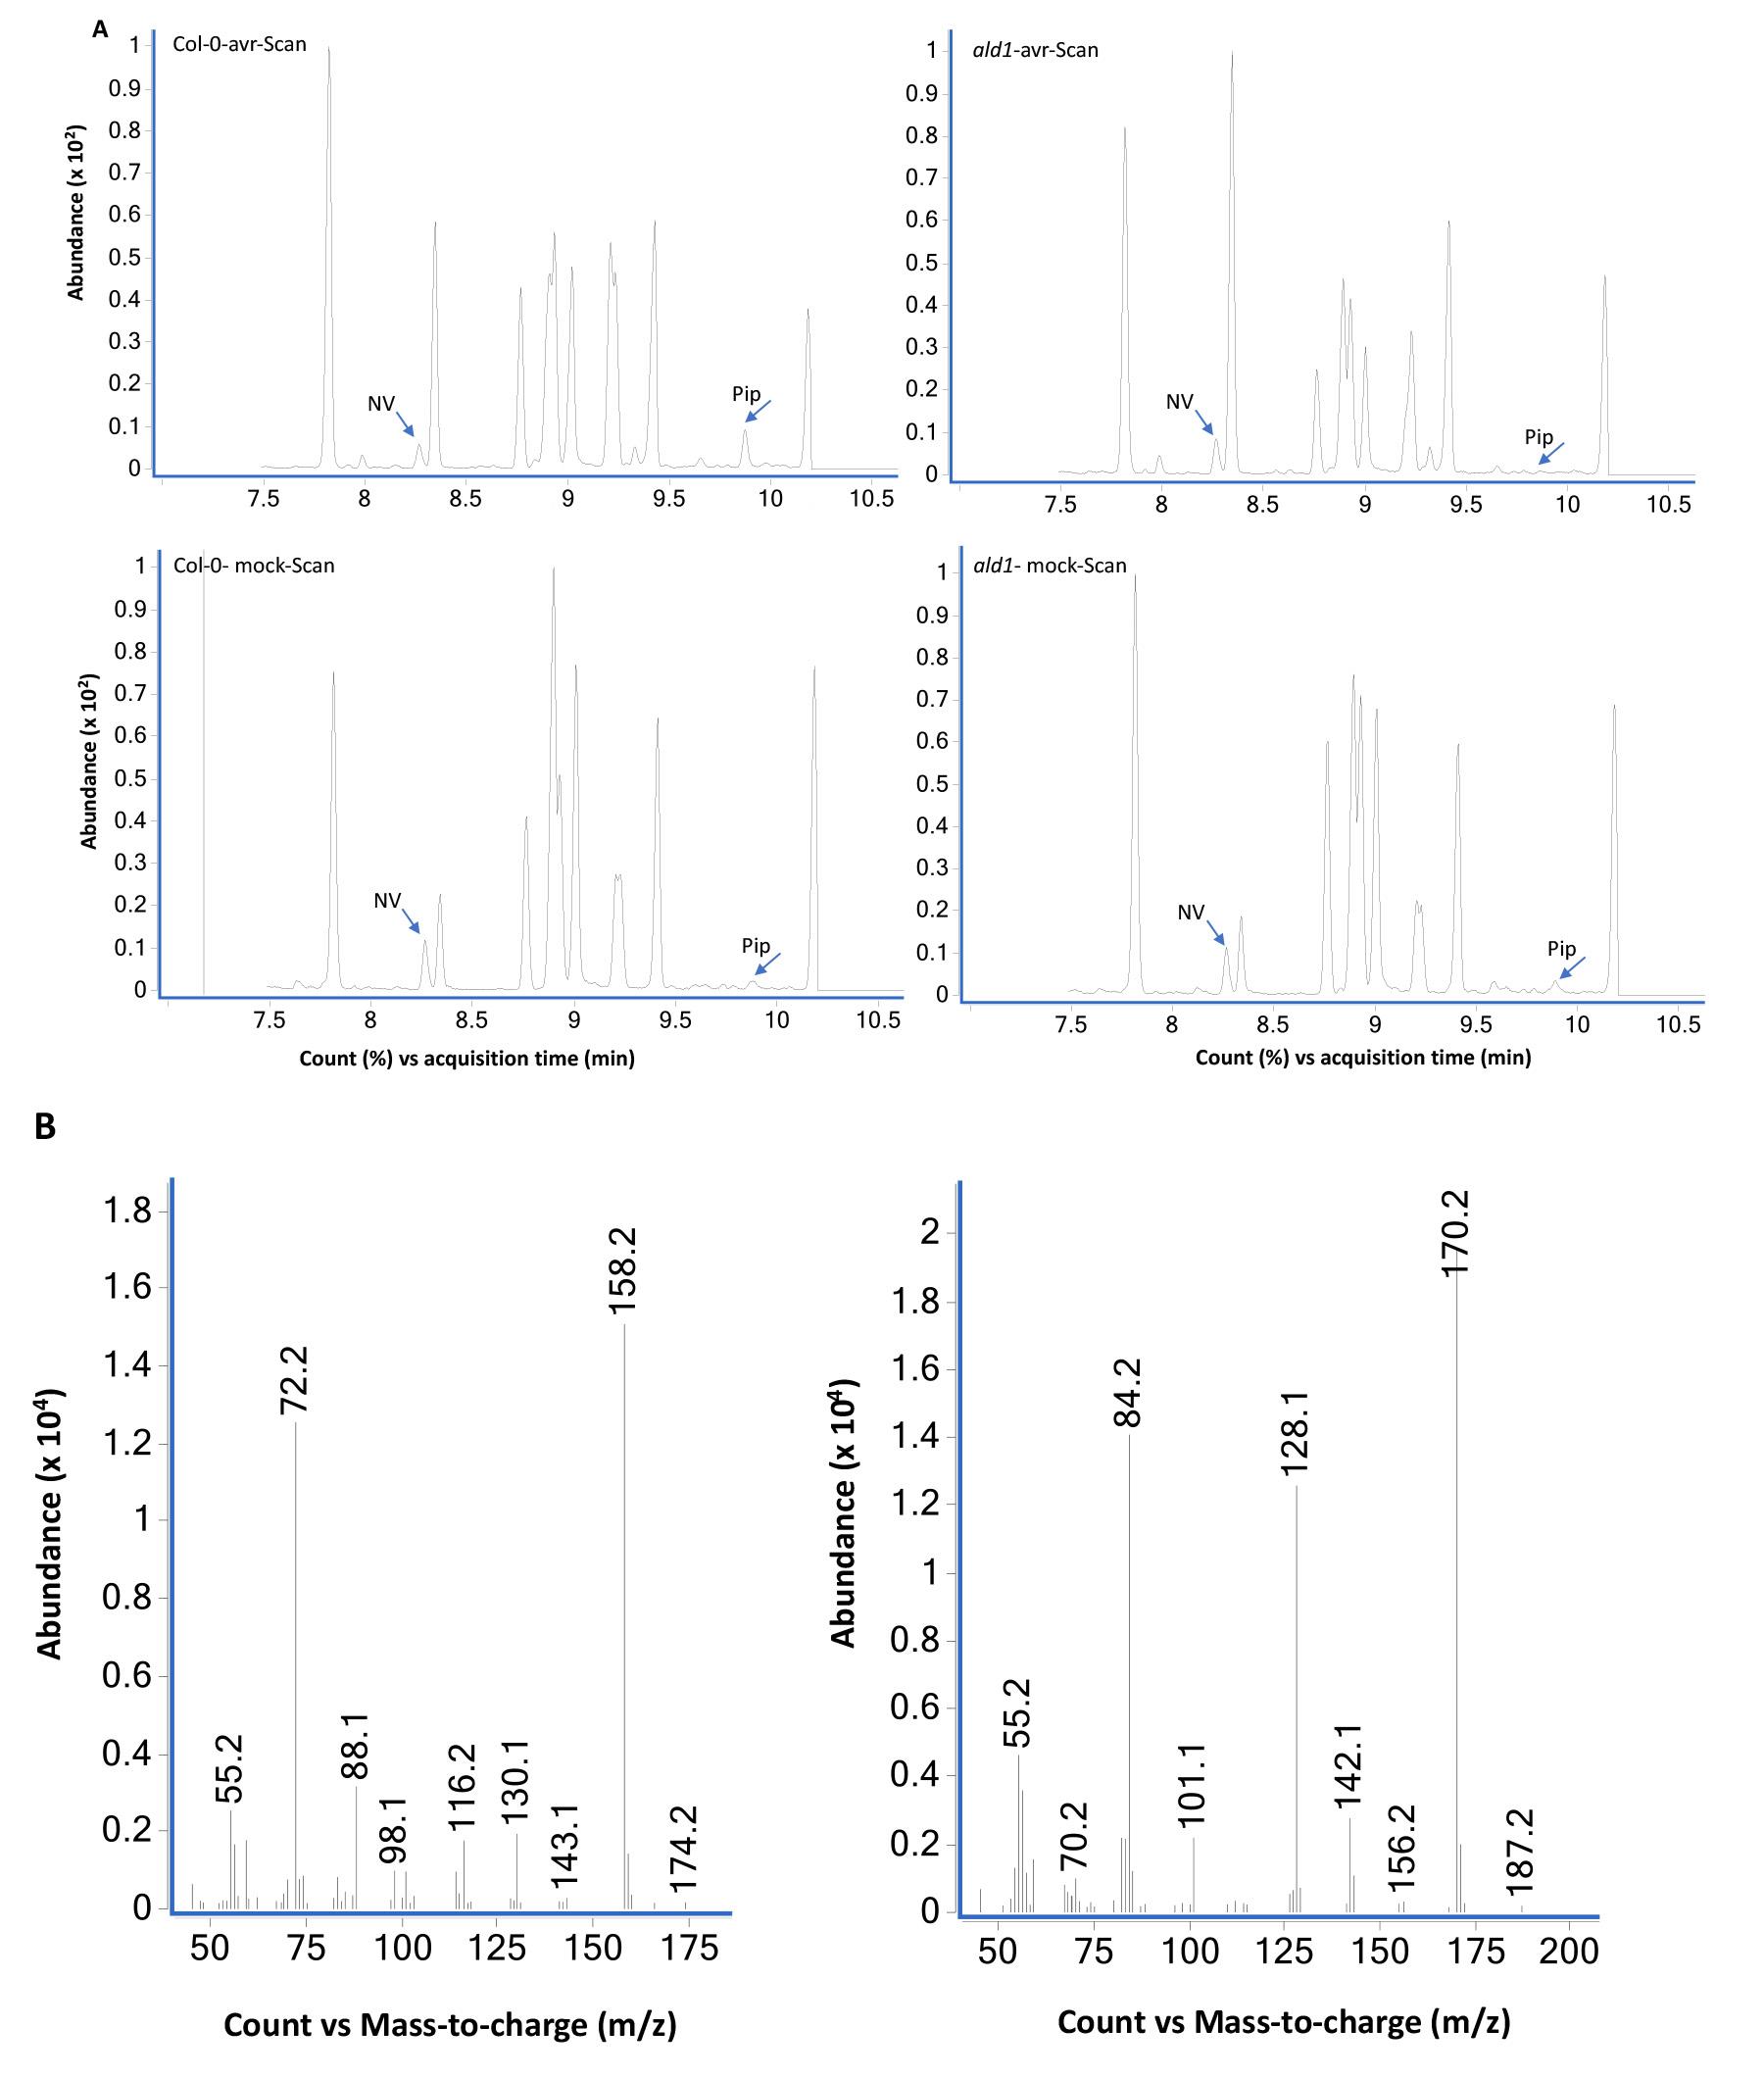
Figure 5. GC-MS analysis of extracts prepared from Col-0 and ald1 plants analyzed using scan mode. (A) Total ion chromatograms of mock (10 mM MgCl2)- and pathogen (Pseudomonas syringae expressing avrRpt2) inoculated wild-type Col-0 and mutant ald1 plants. The leaf tissues were sampled at 24 h post treatment and NV (2 µg) was used as an internal standard as described in Procedure B. The ald1 plants did not accumulate Pip after pathogen infection. The bottom panels (B) show MS spectra of NV- and Pip-N-propoxycarbonyl propyl esters.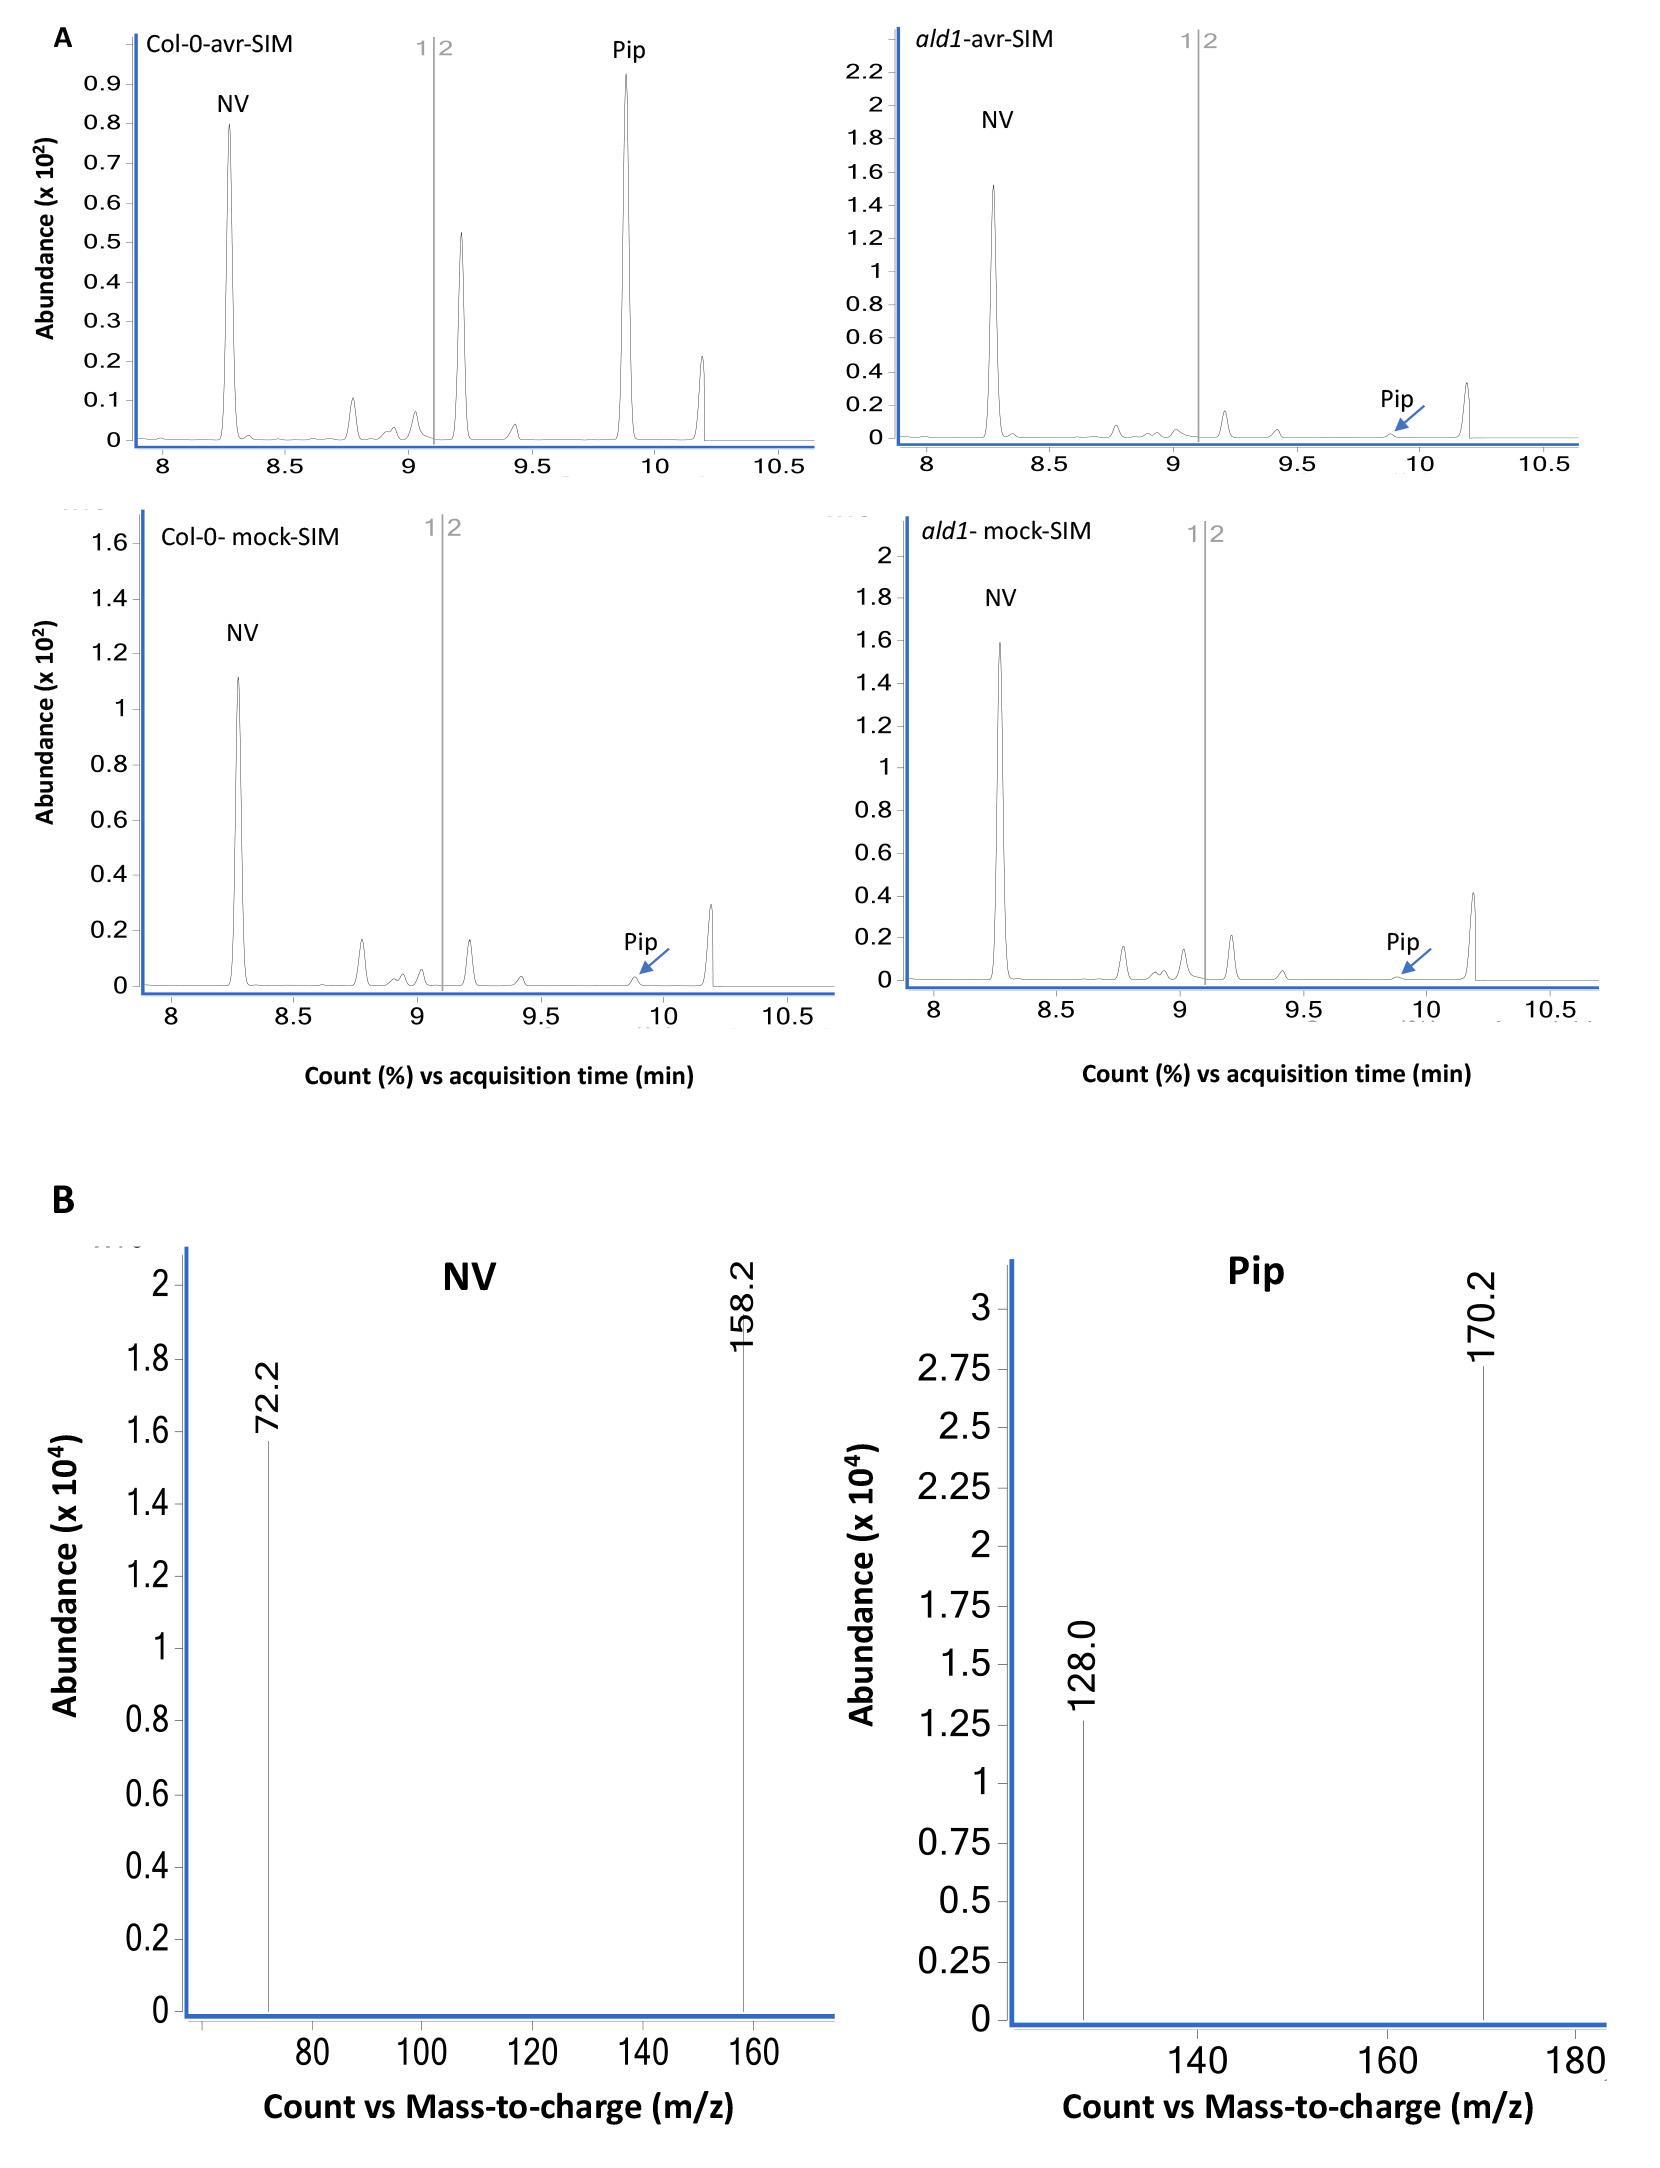
Figure 6. GC-MS analysis of extracts prepared from Col-0 and ald1 plants analyzed using SIM mode. (A) Chromatograms of mock (10 mM MgCl2)- and pathogen (Pseudomonas syringae expressing avrRpt2) inoculated wild-type Col-0 and mutant ald1 plants. The leaf tissues were sampled at 24 h post treatment and NV (2 µg) was used as an internal standard as described in Procedure B. The ald1 plants did not accumulate Pip after pathogen infection. The bottom panels (B) show MS spectra of NV- and Pip-N-propoxycarbonyl propyl esters in SIM mode selected for the major ions 158.2 and 72.2 (NV) and 172.2 and 128.0 (Pip).Relative Pip levels in Col-0 and ald1 plants.
Figure 7 shows the relative Pip levels in Col-0 and ald1 plants inoculated with mock or pathogen. The pathogen inoculated wild-type plants accumulated ~18-fold higher Pip levels compared with the mock inoculated plants. In contrast to wild-type plants, the ald1 accumulate reduced basal levels of Pip and did not show any increase in Pip levels after pathogen infection.
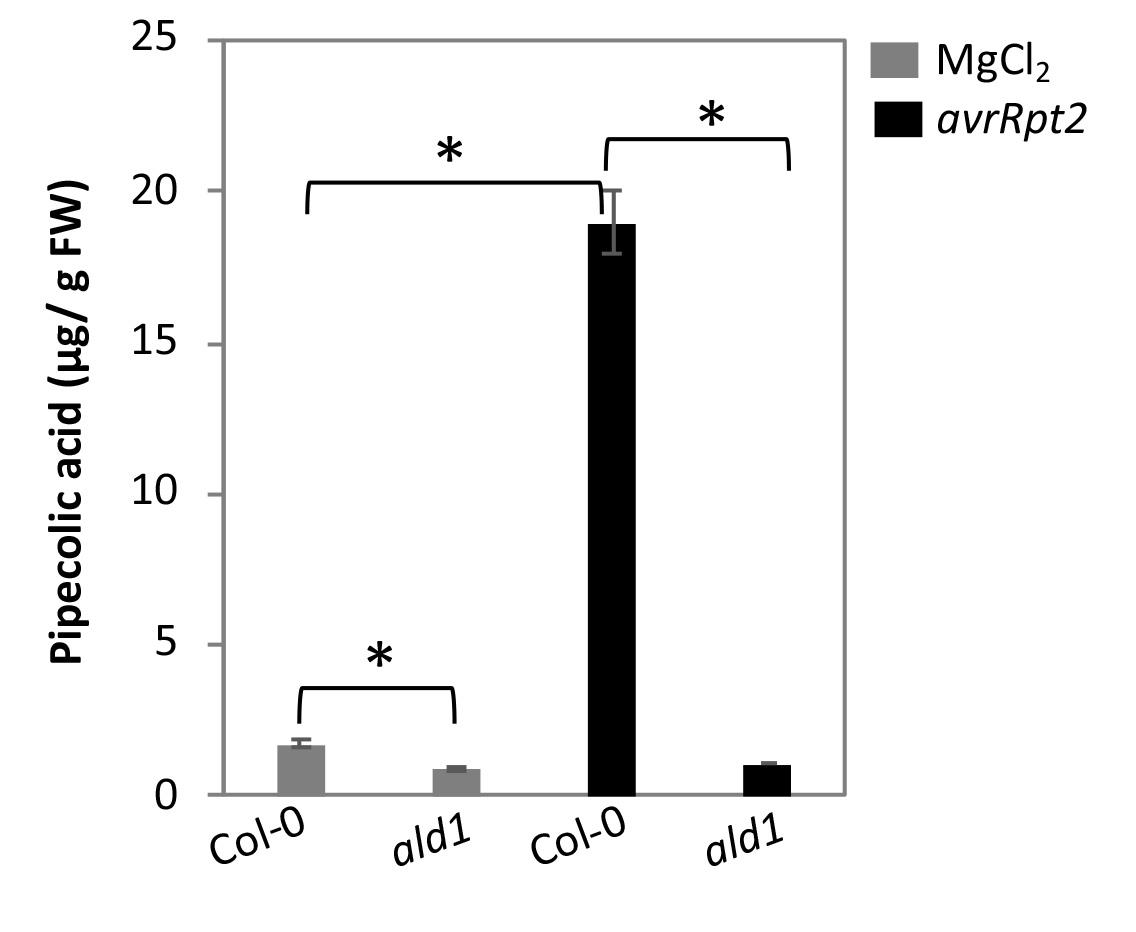
Figure 7. Pip levels in Arabidopsis wild-type Col-0 and Pip deficient ald1 plants post 24 h of inoculation with mock (10 mM MgCl2) or pathogen (P. syringae expressing avrRpt2). Plants were inoculated with 105 CFU ml-1 in 10 mM MgCl2. Error bars indicate standard deviations (n = 3) and astetisks indicate statistical significane (P > 0.001).
Data analysis
MassHunter Workstation 10.0 was used for qualitative and quantitative data analysis. The ion ratios between quantitative and qualifier ions were used as an additional measure to access proper identification of the analytes using SIM mode. Pipecolic acid levels were calculated based on the standard curves generated using varying concentration of NV and Pip standards.
Statistical analysis was performed using Student t-test. For pathogen assays, ~16 plants/ genotype/treatment were analyzed in a single experiment. At least 4 technical replicates/genotype/treatment were plated. For metabolite quantification, ~12 plants/genotype/treatment were analyzed in each experiment. Experiments were repeated at least two-three times with a different set of plants. Unless otherwise mentioned error bars indicate SD.
Notes
The protocol has shown excellent reproducibility and been used to analyze numerous extractions reported in our recent studies (Wang et al., 2018; Lim et al., 2020).
Recipes
10 mM Magnesium chloride
Weigh 20.33 g of magnesium chloride hexahydrate and dissolve it in Milli-Q water to a final volume of 100 ml to obtain 1 M MgCl2
Autoclave 1 M MgCl2 along with 1 liter of Milli-Q water at 121 °C for 30 min using a liquid cycle
After the solutions have cooled down to room temperature, take 1 ml of the 1 M MgCl2 and add it to 99 ml of the autoclaved Milli-Q water, mix well to obtain 10 mM MgCl2
Extraction buffer
Add 8.33 ml of concentrated HCl to 91.67 ml of Milli-Q water and mix well to obtain 1 N HCl
Take 1 ml of the 1 N HCl, add it to 99 ml of Milli-Q water, mix well to obtain 0.01 N HCl
Mix 25 ml of acetonitrile with 75 ml of the 0.01 N HCl and use this solution as extraction buffer
Internal standard
Prepare 100 ng/µl norvaline (wt/vol) in Milli-Q water
1 N Sodium hydroxide
Weigh 40 g of NaOH pellets and dissolve it in Milli-Q water to a final volume of 100 ml to obtain 10 N NaOH, then dilute 10-fold with Milli-Q water
50 mM Sodium bicarbonate
Weigh 420 mg NaHCO3 and dissolve it in Milli-Q water to a final volume of 100 ml
Acknowledgments
This work was supported by grants from National Science Foundation (MCB#0421914 and IOS#051909), Kentucky Science and Engineering Foundation (#1244), and Kentucky Soybean Board (3084113467). We thank John Johnson for technical help. This protocol was adapted from previous work (Villas-boas et al., 2003; Kugler et al., 2006).
Competing interests
The authors declare no conflict of interest.
References
- Bernsdorff, F., Döring, A. C., Gruner, K., Schuck, S., Brautigam, A. and Zeier, J. (2016). Pipecolic acid orchestrates plant systemic acquired resistance and defense priming via salicylic acid-dependent and-independent pathways. Plant Cell 28(1): 102-129.
- Chanda, B., Xia, Y., Mandal, M. K., Yu, K., Sekine, K. T., Gao, Q. M., Selote, D., Hu, Y., Stromberg, A., Navarre, D., Kachroo, A. and Kachroo, P. (2011). Glycerol-3-phosphate is a critical mobile inducer of systemic immunity in plants. Nat Genet 43(5): 421-427.
- Ding, P., Rekhter, D., Ding, Y., Feussner, K., Busta, L., Haroth, S., Xu, S., Li, X., Jetter, R., Feussner, I. and Zhang, Y. (2016). Characterization of a pipecolic acid biosynthesis pathway required for systemic acquired resistance. Plant Cell 28(10): 2603-2615.
- Gao, Q. M., Yu, K., Xia, Y., Shine, M. B., Wang, C., Navarre, D., Kachroo, A. and Kachroo, P. (2014). Mono- and digalactosyldiacylglycerol lipids function nonredundantly to regulate systemic acquired resistance in plants. Cell Rep 9(5): 1681-1691.
- Gruner, K., Griebel, T., Návarová, H., Attaran, E. and Zeier, J. (2013). Reprogramming of plants during systemic acquired resistance. Front Plant Sci 4: 252.
- Guerra, T., Schilling, S., Hake, K., Gorzolka, K., Sylvester, F. P., Conrads, B., Westermann, B. and Romeis, T. (2020). Calcium-dependent protein kinase 5 links calcium signaling with N-hydroxy-l-pipecolic acid- and SARD1-dependent immune memory in systemic acquired resistance. New Phytol 225(1): 310-325.
- Hartmann, M., Kim, D., Bernsdorff, F., Ajami-Rashidi, Z., Scholten, N., Schreiber, S., Zeier, T., Schuck, S., Reichel-Deland, V. and Zeier, J. (2017). Biochemical principles and functional aspects of pipecolic acid biosynthesis in plant immunity. Plant Physiol 174(1): 124-153.
- Kim, Y., Gilmour, S. J., Chao, L., Park, S. and Thomashow, M. F. (2020). Arabidopsis CAMTA transcription factors regulate pipecolic acid biosynthesis and priming of immunity genes. Mol Plant 13(1): 157-168.
- Kugler, F., Graneis, S., Schreiter, P. P., Stintzing, F. C. and Carle, R. (2006). Determination of free amino compounds in betalainic fruits and vegetables by gas chromatography with flame ionization and mass spectrometric detection. J Agric Food Chem 54(12): 4311-4318.
- Li, D., Liu, R., Singh, D., Yuan, X., Kachroo, P. and Raina, R. (2020). JMJ14 encoded H3K4 demethylase modulates immune responses by regulating defence gene expression and pipecolic acid levels. New Phytol 225(5): 2108-2121.
- Lim, G. H., Liu, H., Yu, K., Liu, R., Shine, M. B., Fernandez, J., Burch-Smith, T., Mobley, J. K., McLetchie, N., Kachroo, A. and Kachroo, P. (2020). The plant cuticle regulates apoplastic transport of salicylic acid during systemic acquired resistance. Sci Adv 6(19): eaaz0478.
- Lim, G. H., Shine, M. B., de Lorenzo, L., Yu, K., Cui, W., Navarre, D., Hunt, A. G., Lee, J. Y., Kachroo, A. and Kachroo, P. (2016). Plasmodesmata localizing proteins regulate transport and signaling during systemic acquired immunity in plants. Cell Host Microbe 19(4): 541-549.
- Návarová, H., Bernsdorff, F., Doring, A. C. and Zeier, J. (2012). Pipecolic acid, an endogenous mediator of defense amplification and priming, is a critical regulator of inducible plant immunity. Plant Cell 24(12): 5123-5141.
- Schutgens, R. B., Heymans, H. S., Wanders, R. J., H., den Bosch and Tager, J. M. (1986). Peroxisomal disorders: a newly recognised group of genetic diseases. Eur J Pediatr 144(5): 430-440.
- Sun, T., Huang, J., Xu, Y., Verma, V., Jing, B., Sun, Y., Ruiz Orduna, A., Tian, H., Huang, X., Xia, S., Schafer, L., Jetter, R., Zhang, Y. and Li, X. (2020). Redundant CAMTA transcription factors negatively regulate the biosynthesis of salicylic acid and N-hydroxypipecolic acid by modulating the expression of SARD1 and CBP60g. Mol Plant 13(1): 144-156.
- Villas-Boas, S. G., Delicado, D. G., Akesson, M. and Nielsen, J. (2003). Simultaneous analysis of amino and nonamino organic acids as methyl chloroformate derivatives using gas chromatography-mass spectrometry. Anal Biochem 322(1): 134-138.
- Vogel-Adghough, D., Stahl, E., Navarova, H. and Zeier, J. (2013). Pipecolic acid enhances resistance to bacterial infection and primes salicylic acid and nicotine accumulation in tobacco. Plant Signal Behav 8(11): e26366.
- Wang, C., El-Shetehy, M., Shine, M. B., Yu, K., Navarre, D., Wendehenne, D., Kachroo, A. and Kachroo, P. (2014). Free radicals mediate systemic acquired resistance. Cell Rep 7(2): 348-355.
- Wang, C., Liu, R., Lim, G. H., de Lorenzo, L., Yu, K., Zhang, K., Hunt, A. G., Kachroo, A. and Kachroo, P. (2018). Pipecolic acid confers systemic immunity by regulating free radicals. Sci Adv 4(5): eaar4509.
- Wang, S., Han, K., Peng, J., Zhao, J., Jiang, L., Lu, Y., Zheng, H., Lin, L., Chen, J. and Yan, F. (2019). NbALD1 mediates resistance to turnip mosaic virus by regulating the accumulation of salicylic acid and the ethylene pathway in Nicotiana benthamiana. Mol Plant Pathol 20(7): 990-1004.
- Wenig, M., Ghirardo, A., Sales, J. H., Pabst, E. S., Breitenbach, H. H., Antritter, F., Weber, B., Lange, B., Lenk, M., Cameron, R. K., Schnitzler, J. P. and Vlot, A. C. (2019). Systemic acquired resistance networks amplify airborne defense cues. Nat Commun 10(1): 3813.
- Yoon, H. R. and An, Y. W. (2010). Determination of pipecolic acid following trimethylsilyl and trifluoroacyl derivatisation on plasma filter paper by stable isotope GC-MS for peroxisomal disorders. Arch Pharm Res 33(2): 317-323.
- Yu, K., Soares, J. M., Mandal, M. K., Wang, C., Chanda, B., Gifford, A. N., Fowler, J. S., Navarre, D., Kachroo, A. and Kachroo, P. (2013). A feedback regulatory loop between G3P and lipid transfer proteins DIR1 and AZI1 mediates azelaic-acid-induced systemic immunity. Cell Rep 3(4): 1266-1278.
Article Information
Copyright
© 2020 The Authors; exclusive licensee Bio-protocol LLC.
How to cite
Readers should cite both the Bio-protocol article and the original research article where this protocol was used:
- Yu, K., Liu, H. and Kachroo, P. (2020). Pipecolic Acid Quantification Using Gas Chromatography-coupled Mass Spectrometry. Bio-protocol 10(23): e3841. DOI: 10.21769/BioProtoc.3841.
- Lim, G. H., Liu, H., Yu, K., Liu, R., Shine, M. B., Fernandez, J., Burch-Smith, T., Mobley, J. K., McLetchie, N., Kachroo, A. and Kachroo, P. (2020). The plant cuticle regulates apoplastic transport of salicylic acid during systemic acquired resistance. Sci Adv 6(19): eaaz0478.
Category
Plant Science > Plant physiology > Biotic stress
Plant Science > Plant biochemistry > Metabolite
Biochemistry > Other compound
Do you have any questions about this protocol?
Post your question to gather feedback from the community. We will also invite the authors of this article to respond.