- Protocols

- Articles and Issues
- For Authors
- About
- Become a Reviewer

Visual-looming Shadow Task with in-vivo Calcium Activity Monitoring to Assess Defensive Behaviors in Mice
Published: Vol 10, Iss 22, Nov 20, 2020 DOI: 10.21769/BioProtoc.3826 Views: 4456
Reviewed by: Arnau Busquets-GarciaEdgar Soria-GomezHSIU CHUN CHUANG
Original research article
The authors used this protocol in:

Mar 2020
Advertisement


Protocol Collections
Comprehensive collections of detailed, peer-reviewed protocols focusing on specific topics


Abstract
There has been a clear movement in recent years towards the adoption of more naturalistic experimental regimes for the study of behavior and its underlying neural architecture. Here we provide a protocol that allows experimenters working with mice, to mimic a looming and advancing predatory threat from the sky. This approach is easy to implement and can be combined with sophisticated neural recordings that allow access to real-time activity during behavior. This approach offers another option in a battery of tests that allow for a more comprehensive understanding of defensive behaviors.
Keywords: Defensive behaviorsBackground
How the brain processes danger and then reacts to it has been studied extensively. Recently there has been a shift towards using more ethologically relevant behaviors. This emerging field of “neuroethology” combines behavioral information in tasks that are relevant to the species with real-time recordings of neural activity data from specific cell populations in the brain.
In the late 1980’s, Blanchard et al. proposed a fear taxonomy (Blanchard et al., 1986), in which they contemplated the idea that responses to fear were coordinated in an organized fashion that balanced threat with opportunity. Those studies provided direct evidence that variables such as predator proximity or escape opportunities influence how an individual behaves in response to a putative threat. For example, changes in the distance between a predator and prey, known as a change in threat imminence, initiate changes in the behavior of the prey. Specifically, the prey might exhibit a passive response to avoid detection when the predator is distant, but rapidly transition to flight mode to avoid capture as the predator approaches.
More recently, investigators have explored experimental approaches that are more naturalistic both in terms of the stimuli that are presented and in the opportunities an animal has to execute an action. An intriguing approach, that relies exclusively on visual stimulation to elicit innate fear responses, has been developed for rodents. Pioneered by Yilmaz and Meister (Yilmaz and Meister, 2013), it uses a dark visual stimulus that looms overhead and then increases in size, mimicking the rapid advance of a flying predator. This was paired with a rudimentary shelter in an open arena, thus providing mice an opportunity to find safety. Under these conditions, when exposed to an expanding disk overhead, mice engage in one of two different strategies: they either show a decrease in motor activity (freezing) or they initiate an escape response that targets the shelter. The probability of executing a given behavior is strongly dependent on the various aspects of the experimental parameters.
While many protocols for eliciting a fear response are species specific, the looming visual stimulus can be used across multiple species. Without having to change the physical characteristics of the stimulus, a looming and advancing black disk elicits innate defensive responses from zebra-fish (De Marco et al., 2016) to humans (Mobbs et al., 2007) and, as shown in this protocol, in mice (Evans et al., 2018 ; Daviu et al., 2020). This protocol is highly reproducible and also allows for the simultaneous acquisition of neural activity using single fiber photometry (Daviu et al., 2020) or single-cell data using head-mounted, miniature endoscopes. This new methodological approach may help advance translational knowledge about how different species compute threats and execute innate defensive behaviors.
Materials and Reagents
Looming Shadow task
Plastic transparent or white arena (41 cm x 19 cm x 20.5 cm)
Shelter (13 cm x 12 cm x 10 cm)
Poster board (Staples, catalog number: 28128 )
White Monochrome arena background (optional, 41 cm x 19 cm x 20.5 cm)
LCD monitor down (Dell UltraSharp 1908FP, 19-inch) and a frame (8020 Inc, Columbia city, USA. Profile 1010, fastening 2811, monitor holder corner Gusset 4332) to hold it above the arena facing down
Stimulus (video)
Ethyl Alcohol 70% v/v
Experimental subject: Mice (this protocol was developed using C57BL/6-Elite and Crh-IRES-Cre;Ai14 mice)
Single Fiber Photometry
400-µm diameter mono fiber optic cannula 2.5 mm diameter and 0.48 NA (Doric Lenses, Quebec, Canada. MFC_400/430/0.48_5mm_MF2.5_FLT)
Fiber optic patch chord 1.5 m or longer and 0.48 NA (Doric Lenses, Quebec, Canada. DORIC MFP_400/460/900-0.48_2m_FC/MF2.5)
Zirconia sleeve 2.5 mm diameter to connect the fiber optic patch chord with the cannula (Doric Lenses, Quebec, Canada. DORIC SLEEVE_ZR_2.5)
Equipment
Windows PC
Fiber Photometry system Doric Lenses, Quebec, Canada
Two excitation LEDs 465 nm and 405 nm (Doric Lenses)
LED driver, Doric minicube filter set (FMC4_AE(405)_E(460-490)_F(500-550)_S)
Photoreceiver (NewPort, model 2151 )
Power meter (ThorLabs, Newton, NY, USA PM100D)
Video camera connected and synchronized with the fiber photometry system (Doric Lenses, Quebec, Canada. BTC_USB3.0_CO)
If a simultaneous recording of calcium transients is not performed, any camera that can visualize the entire cage can be used for this protocol.
Tripod
Software
Doric Neuroscience Studio v5.4.1 (Doric Lenses, Quebec, Canada)
Windows media player classic 6.4
Python
Windows Game recorder
MATLAB R2018a (Math Works)
ImageJ
GraphPad Prism 8.0
Procedure
Create the stimulus
A static 2 cm in diameter disk is presented for 3 s.
The disk expanding in size to 20 cm over the next 2 s.
Finally, the 20 cm diameter disk remains for an additional 3 s.
Create the background for the habituation session
Set up of looming shadow test
In case a uniform background is not available in the testing room place the plastic arena inside a larger monochrome arena that will act as a solid color background. Having a solid background increases the quality of the behavioral video recording (Figure 1).
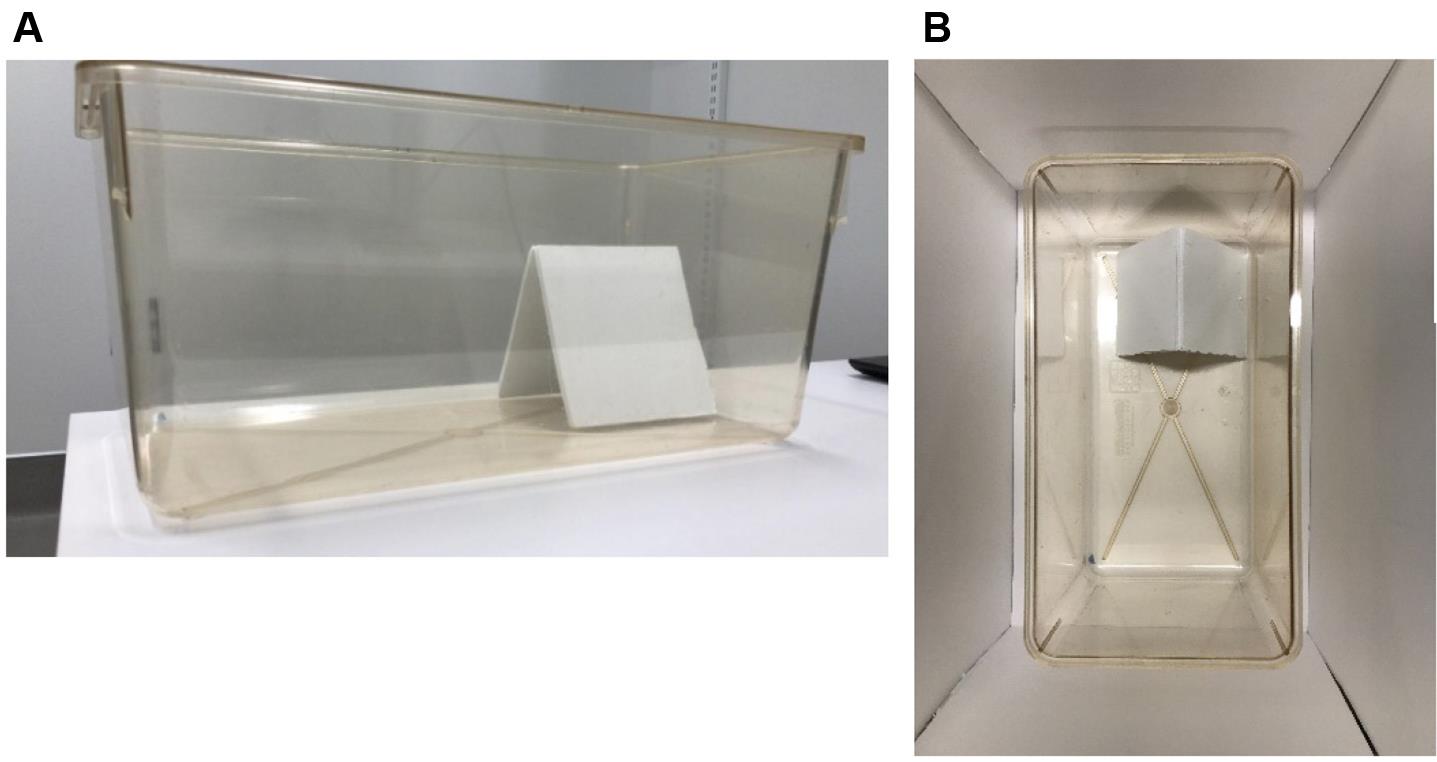
Figure 1. Example of the looming shadow arena. A. Looming shadow arena with the shelter. B. Looming shadow arena with larger monochrome arena to provide a uniform background.Place the shelter in one corner of the arena allowing it only to be accessed by the animal form one side (Figure 2).
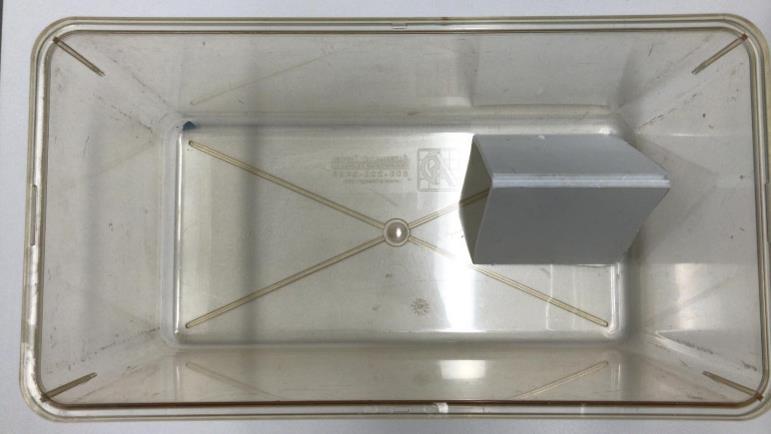
Figure 2. Shelter placement in the looming shadow arenaPlace the LCD screen above the arena (30 cm) facing downward to display a visual stimulus. If the arena is larger than the screen, place the center of the screen toward the area not covered by the shelter (Figure 3).
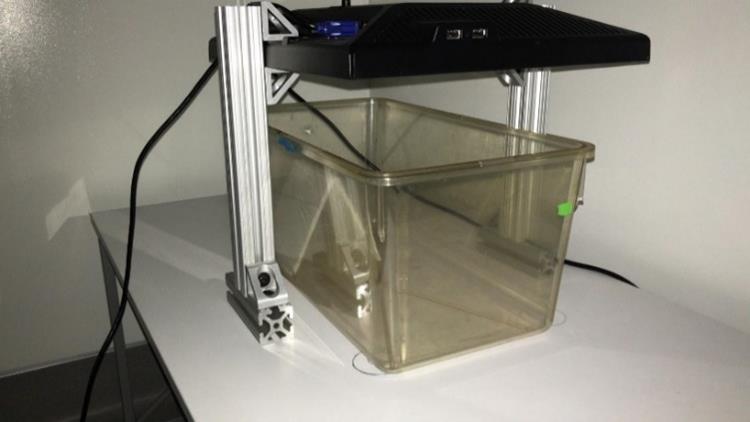
Figure 3. Monitor placement in the looming shadow arenaConnect a PC or a laptop to the LCD screen. Duplicate the screen and open the video with full screen using Windows Media Player classic. Critically, and unlike the most moderns media players, this version does not alter the luminance in the testing arena when the video is paused or completed (Figure 4).
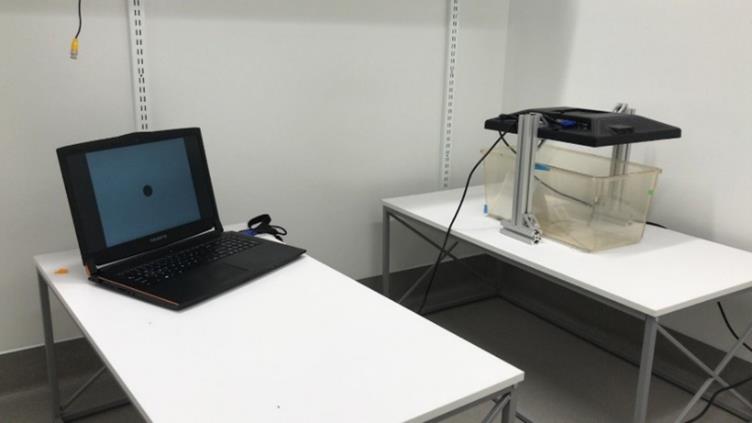
Figure 4. Laptop set up and connectionWithin the testing room the lights should be off and the only light source available for the animal is the one provided by the screen situated on top of the arena acting as a virtual sky (Figure 5).
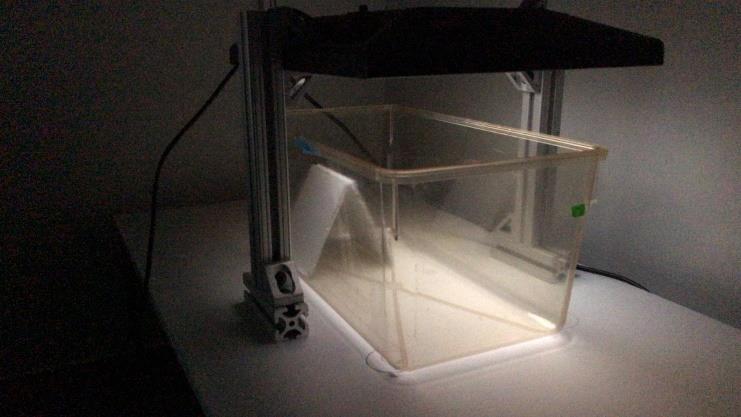
Figure 5. The monitor is the sole light source during the testThe testing room should remain quiet and the investigator should not be within the animals range of view (2 m in a dark room, Figure 6).
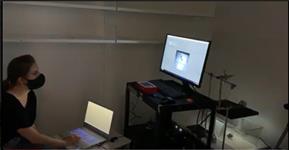
Figure 6. Proposed positioning of the materials and experimenterThe camera should be placed above the arena in one of the corners, allowing the capture of the entire arena. The live recording should be visible at all time for the experimenter (Figure 7).
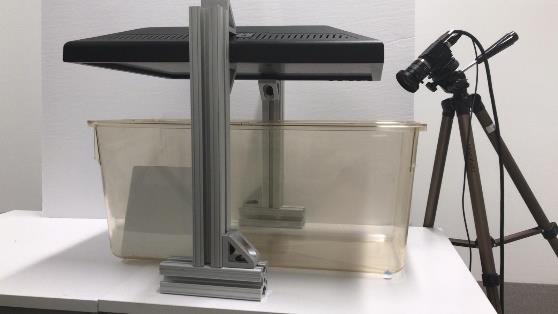
Figure 7. Camera placement allowing the capture of the entire arenaAcclimatization to the testing room and apparatus
Habituate the animal to the testing room for 3 days before starting the habituation procedure for the apparatus. Transport the animal to the room using the same method every day. The animal should remain in the room for a minimum of 30 min every day.
During the 3 days of habituation to the testing room the animal should be habituated to the fiber photometry patch chord. Remove the top part of the homecage and the nesting material and connect the animal to a fiber optic cable, leaving them to freely explore the homecage for 15 min.
Habituate the animal to the apparatus. Move the animal to the testing room 15 min prior to the start of habituation. After this 15 min, turn the lights off in the room and turn on the screen with the background screen displayed. The light coming from the screen will be the only source of light during this phase of the habituation. Connect the animal to the fiber optic patch chord and place it in the arena and allow it to explore for 20 min. This procedure should be repeated for 3 days. They do not need to be consecutive but the last day of habituation should occur 24 h before the testing begins. The habituation to the apparatus is important to ensure a proper display of the escape behavior.
Test day
Move the animal to the testing room 15 min prior the test.
The computer should be on and connected to the LCD screen with the video ready to play.
Room lights should be off and the only source of light is coming from the screen situated above the apparatus.
Turn on the Doric system and load the protocol for the session. Assign one of the digital ports of the Doric system to trigger the video recording. The power of the 465-nm LED is adjusted to 30 µW at the end of the patch cord using a power meter (Figure 8).
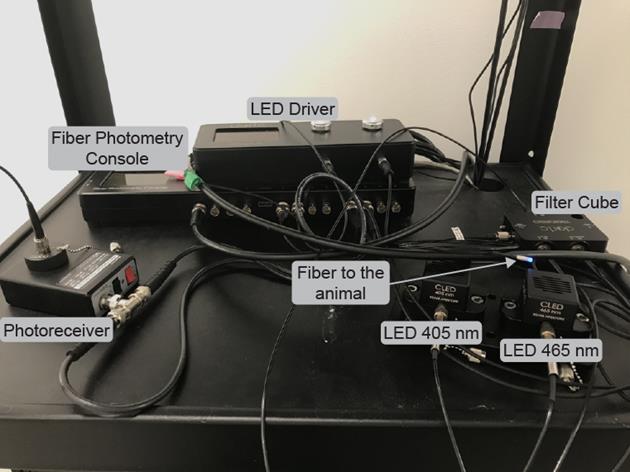
Figure 8. Doric in-vivo calcium set-upBefore placing the animal into the looming shadow apparatus, connect the fiber optic patch chord to the animal and start the fiber photometry recording. Allow for 10 min of baseline recording in the homecage.
Introduce the animal into the arena on the opposite side from where the shelter is. Allow 3 min of exploration time, while recording calcium activity, before initiating the stimulus presentation.
After the initial 3 min of habituation/baseline, 5 overhead looming visual stimuli will be presented.
The stimuli should be presented only when the animal is in the opposite side of the arena from where the shelter is. The orientation of the animal is irrelevant. Also, leave at least 1 min of inter-trial interval. Control the inter-trial interval by pausing the video after the disappearance of the most recent stimulus presented (Figure 9).
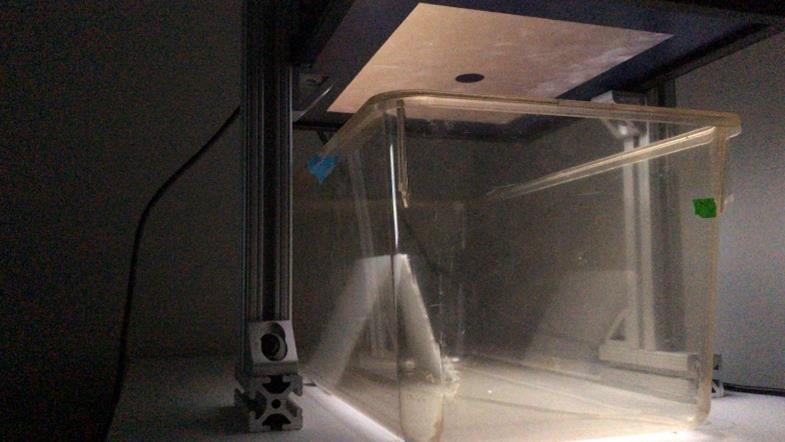
Figure 9. Image of stimulus presentation during the testAfter the delivery of 5 stimuli the test is over and the animal can be removed.
NOTE: If the animal does not leave the shelter in 10 min between shadows the test can be suspended and the animal should be removed from the study. The maximum time allowed before suspending the test can be modified, this 10 min time provided here is just a reference based on experience. After 10 min in the shelter the probability for an animal to leave that shelter in a short period of time is low.
Transfer the animal to its home cage and record for an extra 10 min.
After the post-test recording, stop the recording and detach the animal from the fiber optic cable.
Clean the apparatus with 70% v/v ethanol solution between subjects.
A proposed timeline for the full experiment is detailed in the figure below (Figure 10).
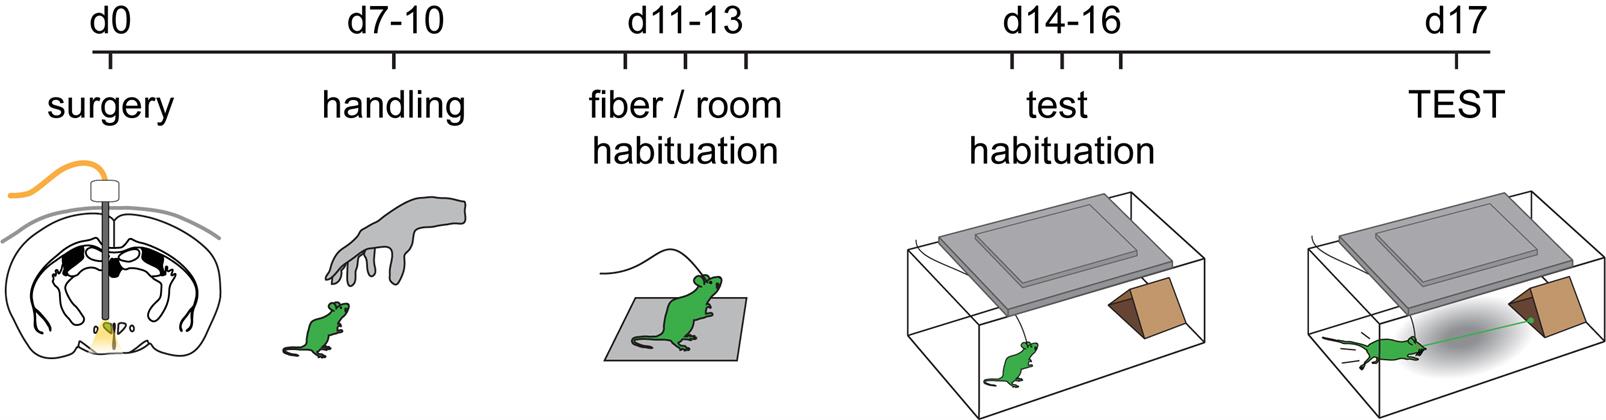
Figure 10. Proposed experimental timeline from ferrule placement to test
The visual stimuli was created with custom Python scripts, and recorded with the Windows Game Recorder (Microsoft Corporation) for replay in behavioral tests. Code for the looming shadow stimuli is available at: www.github.com/kpc-simone/shadow-graphics.
The looming shadow stimulus is comprised of a black disk that appears on a light background in three distinct phases.
A train of ten of these stimulus, with a 2 s interstimulus interval, can be reproduced by running the script reported as example1.py.
Before and after the black disk, a uniform grey (RGB reference 128, 128, 128) background is presented on the monitor.
During the habituation period the animal is exposed to the looming shadow apparatus with no stimulus but only the grey background on the screen as the only light source. For the habituation period a static background can be created using PowerPoint or by pausing the first frame(s) of the stimulus.
Data analysis
Manual behavioral analysis
As a first level analysis, a manual visual analysis can be performed. 3 behaviors where considered for analysis as a behavioral response after visual stimulus delivery:
A flight response during the 8-second visual stimulus that resulted in the subject reaching the shelter, is classified as an escape or active behavior (Video 1).
 Video 1. Example of escape behavior targeting the shelter. (All animal protocols were approved by the University of Calgary Animal Care and Use Committee. Protocol number AC17-0040.)
A response identified as absence of any movement except that related to breathing is classified as a passive or freezing behavior. It is considered freezing when the animal freezes for the entire 8s period or freezes intermittently during the stimulus presentation (Video 2).
Video 2. Example of freezing response during stimulus presentation. (All animal protocols were approved by the University of Calgary Animal Care and Use Committee. Protocol number AC17-0040.)If the subject does not freeze, fail to alter ongoing behavior, or make an escape attempt, and do not reach the shelter during the 8-second stimulus presentation, this is classified as a non-responder (Video 3).
Video 3. Example of a non-responder during stimulus presentation. (All animal protocols were approved by the University of Calgary Animal Care and Use Committee. Protocol number AC17-0040.)
Automated analysis
To detect the onset of escape in an automated fashion a frame-to-frame image difference analysis can be performed to segment out regions of the scene that exhibit movement. This approach works well for analyzing stable recordings where the background is unchanging (e.g., fixed home-cage) and there is large movement in the foreground (e.g., animal locomotion).
To do this, we used the following algorithm to perform a pixel-by-pixel frame subtraction in ImageJ:
Import raw behavioral video. Uncompressed the .avi using FFmpeg, open the video with ImageJ and the converted it as a stack of 8-bit grayscale images and adjust contrast if needed.
Duplicate the stack and rename the first as ‘Stack1’ and the second as ‘Stack2’.
Delete the first frame of ‘Stack1’ and the last frame of ‘Stack2’. As a result, each stack now has n-1 frames, and ‘Stack1’ leads ‘Stack2’ by a single frame.
Subtract every pixel from each image of ‘Stack2’ from the corresponding pixel in ‘Stack1’ with 8-bit precision.
Compute the mean gray value of each image in the resulting stack.
Plot mean gray value against time (frame number divided by sampling rate). When plotted in GraphPad 8.0 the gray value the following graph will result (Figure 11).
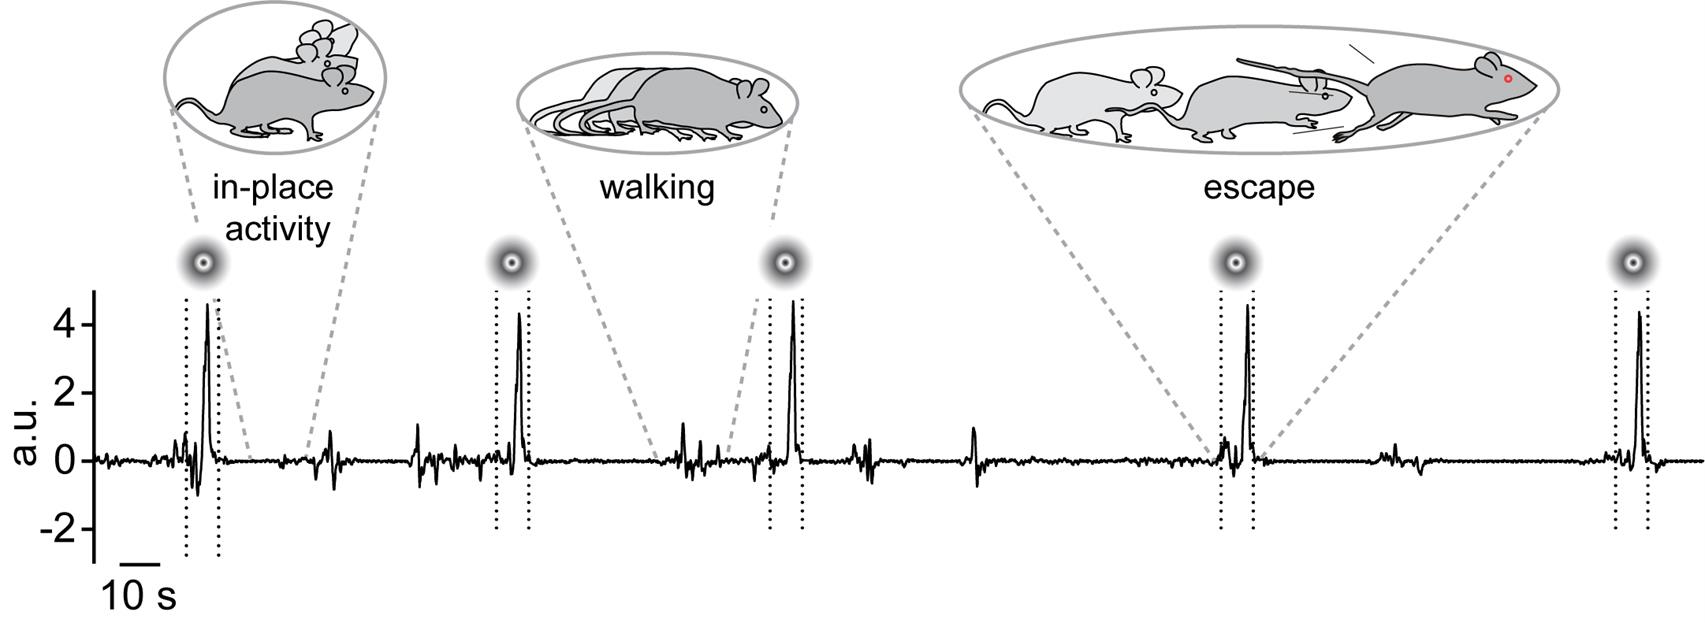
Figure 11. Mean gray value obtained after frame subtraction in ImageJ plotted against time using GraphPad 8.0Save data in a file format set by MATLAB script requirements (see 'sample_data.xlsx').
Using MATLAB detect 4*MAD from the baseline (link). The MATLAB script measures the median standard deviation from the baseline movement in every mouse. In our experience, 4*MAD is a reliable indicator of an escape movement. Again, we used an 8-second time limit for the automated escape behavior analysis but the time can be modified.
A custom ImageJ macro and a sample images are provided for the difference-image analysis. as well, a custom MATLAB script and sample data are provided for detecting onset and offset of movement https://github.com/tpgovind/DIA.
Fiber photometry analysis
Extract the raw data from the Doric System.
Load the raw data into the Matlab script provided in the following link (https://github.com/leomol/FPA). Briefly, the analysis performed by this script is the following: both 465 nm and 405 nm data is fitted individually with a second-order polynomial curve, then they are subtracted to remove any artifact due to bleaching. Next, a least-squares linear fit is applied to the 405-nm data to align it with the 465-nm. The change in fluorescent (ΔF) is calculated by subtracting the 405-nm channel from the 465-nm at each time point.
After the calculation of the ΔF, a z-score index is calculated following the equation z = (F − F0)/σF , where F is the test signal (ΔF), F0 is the mean and σF is the standard deviation of the basal signal.
Peak detection analysis for the calcium signal during the escape response: For the peak detection analysis, a low-pass filter (5 Hz) was applied, and high-amplitude events were filtered and the median of the resultant trace was calculated. The peak detection threshold was set at 2 times the MAD. Scripts used for this analysis are deposited at https://github.com/leomol/MSA.
Finally, the results of the photometry signal and the automated escape response are plotted against each other using the above-mentioned MATLAB script (Figure 12).
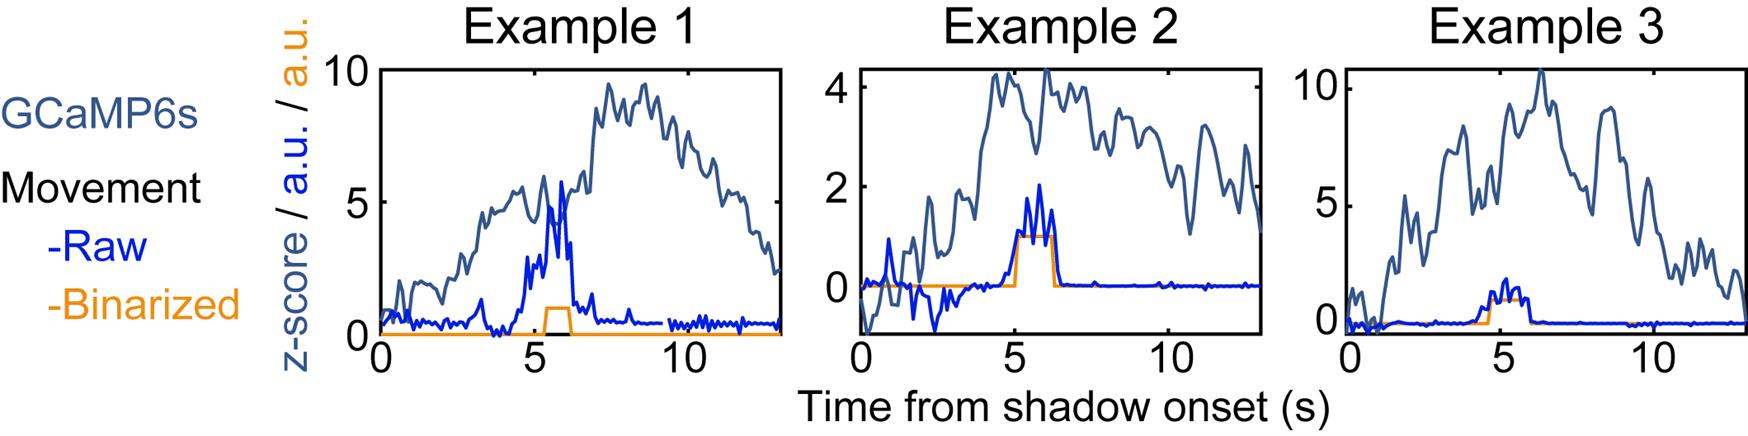
Figure 12. Plots created by using the MATLAB custom script depicting calcium activity and movement vs. time
Acknowledgments
We thank the expert technical support of Mr. L. A. Molina. We are grateful for the support of the Cumming School of Medicine Optogenetics Core Facility. This work was supported by an operating grant to JSB from the Canadian Institutes for Health Research (FDN-148440) and the Brain Canada Neurophotonics Platform. ND is supported by Fellowships from Alberta Innovates-Health Solutions.
Competing interests
The authors declare no competing interest.
Ethics
All animal protocols were approved by the University of Calgary Animal Care and Use Committee. Protocol number AC17-0040.
References
- Blanchard, R. J., Flannelly, K. J. and Blanchard, D. C. (1986). Defensive behavior of laboratory and wild Rattus norvegicus. J Comp Psychol 100(2): 101-107.
- Daviu, N., Fuzesi, T., Rosenegger, D. G., Rasiah, N. P., Sterley, T. L., Peringod, G. and Bains, J. S. (2020). Paraventricular nucleus CRH neurons encode stress controllability and regulate defensive behavior selection. Nat Neurosci 23(3): 398-410.
- De Marco, R. J., Thiemann, T., Groneberg, A. H., Herget, U. and Ryu, S. (2016). Optogenetically enhanced pituitary corticotroph cell activity post-stress onset causes rapid organizing effects on behaviour. Nat Commun 7: 12620.
- Evans, D. A., Stempel, A. V., Vale, R., Ruehle, S., Lefler, Y. and Branco, T. (2018). A synaptic threshold mechanism for computing escape decisions. Nature 558(7711): 590-594.
- Mobbs, D., Petrovic, P., Marchant, J. L., Hassabis, D., Weiskopf, N., Seymour, B., Dolan, R. J. and Frith, C. D. (2007). When fear is near: threat imminence elicits prefrontal-periaqueductal gray shifts in humans. Science 317(5841): 1079-1083.
- Yilmaz, M. and Meister, M. (2013). Rapid innate defensive responses of mice to looming visual stimuli. Curr Biol 23(20): 2011-2015.
Article Information
Copyright
© 2020 The Authors; exclusive licensee Bio-protocol LLC.
How to cite
Daviu, N., Fuzesi, T., Rosenegger, D., Peringod, G., Simone, K. and Bains, J. (2020). Visual-looming Shadow Task with in-vivo Calcium Activity Monitoring to Assess Defensive Behaviors in Mice. Bio-protocol 10(22): e3826. DOI: 10.21769/BioProtoc.3826.
Category
Neuroscience > Behavioral neuroscience
Do you have any questions about this protocol?
Post your question to gather feedback from the community. We will also invite the authors of this article to respond.